Remisión inmediata a colposcopia versus vigilancia citológica para las anomalías citológicas menores del cuello uterino en ausencia de prueba del VPH
Información
- DOI:
- https://doi.org/10.1002/14651858.CD009836.pub2Copiar DOI

- Base de datos:
-
- Cochrane Database of Systematic Reviews
- Versión publicada:
-
- 26 enero 2017see what's new
- Tipo:
-
- Intervention
- Etapa:
-
- Review
- Grupo Editorial Cochrane:
-
Grupo Cochrane de Cáncer ginecológico, neurooncología y otros cánceres
- Copyright:
-
- Copyright © 2017 The Cochrane Collaboration. Published by John Wiley & Sons, Ltd.
Cifras del artículo
Altmetric:
Citado por:
Autores
Contributions of authors
The study was conceived and designed by MK, MA and EP. The data was acquired and collated by MK, IK, AM, PMH, MA and analysed by MK, IK, AM, PMH, MA and EP. The manuscript was drafted and revised critically for important intellectual content by all authors (MK, IK, AM, CF, SGM, PMH, MC, MA, EP). All authors gave final approval of the version to be published and have contributed to the manuscript. MC was not involved in application of the inclusion and exclusion criteria, in data extraction or in data analysis.
Sources of support
Internal sources
-
Cochrane Gynaecological, Neuro‐oncology and Orphan Cancers, UK
Marc Arbyn received financial support from Cochrane Gynaecological, Neuro‐oncology and Orphan Cancers
External sources
-
European Commission, Other
Marc Arbyn received financial support from the European Commission through the COHEAHR Network, coordinated by the Free University of Amsterdam (The Netherlands), funded by the 7th Framework programme of DG Research (Brussels, Belgium), and through the ECCG (European Co‐operation on Development and Implementation of Cancer Screening and Prevention Guidelines, via IARC, Lyon, France), funded by the Directorate of SANCO (Luxembourg, Grand‐Duchy of Luxembourg)
-
Belgian Foundation Against Cancer, Belgium
Marc Arbyn received financial support from the Belgian Foundation Against Cancer, Brussels, Belgium
-
British Society of Colposcopy Cervical Pathology Jordan/Singer Award, UK
Maria Kyrgiou received financial support from British Society of Colposcopy Cervical Pathology (Grant reference: P47773)
-
Imperial College Healthcare Charity, UK
Anita Mitra and Maria Kyrgiou received financial support from Imperial College Healthcare Charity (Grant reference: P47907)
-
Imperial Healthcare NHS Trust NIHR Biomedical Research Centre, UK
Maria Kyrgiou received financial support from Imperial Healthcare NHS Trust NIHR Biomedical Research Centre (Grant reference: P45272)
-
Genesis Research Trust, UK
Maria Kyrgiou received financial support from Genesis Research Trust (Grant reference: P55549)
-
Sigrid Jusélius Foundation, Finland
Ilkka Kalliala received postdoctoral fellowship under Dr Kyrgiou's group at Imperial College London from Sigrid Jusélius Foundation (Grant reference: P52483)
Declarations of interest
Maria Kyrgiou: None known
Ilkka Kalliala: None known
Anita Mitra: None known
Christina Fotopolou: None known
Sadaf Ghaem‐Maghami: None known
Pierre Martin‐HIrcsh: None known
Margaret Cruickshank: author of one of the included studies (TOMBOLA 2009): MC was not involved in application of the inclusion and exclusion criteria, in data extraction or in data analysis.
Marc Arbyn: None known
Evangelos Paraskevaidis: None known
Acknowledgements
The authors wish to acknowledge Jo Morrison for her clinical and editorial advice, Jane Hayes for designing the search strategy and Gail Quinn, Clare Jess and Tracey Bishop for their contribution to the editorial process.
This project was supported by the National Institute for Health Research, via Cochrane Infrastructure funding to the Cochrane Gynaecological, Neuro‐oncology and Orphan Cancer Group. The views and opinions expressed therein are those of the authors and do not necessarily reflect those of the Systematic Reviews Programme, NIHR, NHS or the Department of Health.
Version history
| Published | Title | Stage | Authors | Version |
| 2017 Jan 26 | Immediate referral to colposcopy versus cytological surveillance for minor cervical cytological abnormalities in the absence of HPV test | Review | Maria Kyrgiou, Ilkka Kalliala, Anita Mitra, Christina Fotopoulou, Sadaf Ghaem-Maghami, Pierre PL Martin-Hirsch, Margaret Cruickshank, Marc Arbyn, Evangelos Paraskevaidis | |
| 2012 May 16 | Management of low‐grade squamous intra‐epithelial lesions of the uterine cervix: repeat cytology versus immediate referral to colposcopy | Protocol | Maria Kyrgiou, Sofia Melina Stasinou, Marc Arbyn, George Valasoulis, Sadaf Ghaem‐Maghami, Pierre PL Martin‐Hirsch, Aristotelis D Loufopoulos, Petros J Karakitsos, Evangelos Paraskevaidis | |
Differences between protocol and review
The title has changed from 'Management of low‐grade squamous intra‐epithelial lesions of the uterine cervix repeat cytology versus immediate referral to colposcopy' to 'Immediate referral to colposcopy versus cytological surveillance for minor cervical cytological abnormalities in the absence of HPV test' in order to better describe the applicability of the evidence only in the absence of HPV test.
None of outcomes included used continuous outcome measures and the methods described in the protocol to be applied on continuous outcomes were not needed and included in the review. If in a future update continuous outcomes are identified the following methodology will be used. For continuous outcomes (e.g. anxiety, depression scores), we will extract the final value and standard deviation (SD) of the outcome of interest and the number of patients assessed at endpoint in each treatment arm at the end of follow‐up, in order to estimate the mean difference (MD) (if trials measured outcomes on the same scale) or standardised mean differences (SMDs) (if trials measured outcomes on different scales) between treatment arms and its standard error (SE).
Surveillance or immediate colposcopy after ASCUS or borderline dyskaryosis was also included. These lesions,which constitute the majority of women with low‐grade smear, have hence been included in most trials and represent a major proportion of the women upon whom these results are applicable.
We decided to accept cytological surveillance in any setting, not only in primary care as eligible. Most of the included studies used other than primary care setting for follow‐up and we considered it appropriate to include them.
Subgroup analyses were not performed based on continent, study type, study quality and inclusion and exclusion criteria. We were able to include only a few studies in each meta‐analysis and were hence not able to conduct all planned subgroup analyses.
We used GRADE to assess the quality of evidence instead of just removing unpublished and low‐quality studies from sensitivity analyses due to GRADE being introduced only after the publication of the protocol.
Keywords
MeSH
Medical Subject Headings (MeSH) Keywords
- Colposcopy [*statistics & numerical data];
- Papillomaviridae [isolation & purification];
- Patient Compliance [statistics & numerical data];
- Precancerous Conditions [*diagnosis, *pathology];
- Randomized Controlled Trials as Topic;
- *Referral and Consultation;
- Time Factors;
- Uterine Cervical Dysplasia [*diagnosis, *pathology];
- Vaginal Smears [*statistics & numerical data];
- Watchful Waiting;
Medical Subject Headings Check Words
Female; Humans;
PICO
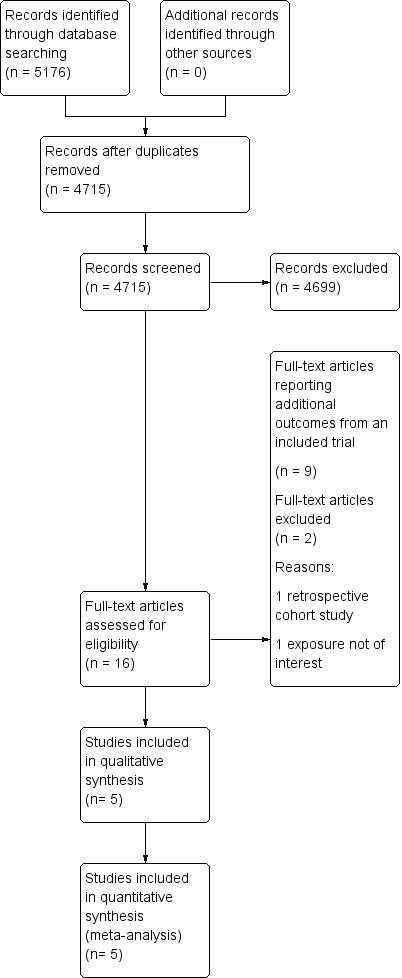
Study flow diagram

Risk of bias summary: review authors' judgements about each risk of bias item for each included study

Forest plot of comparison: occurrence of CIN2+ at different lengths of follow‐up

Forest plot of comparison: occurence of CIN3+ at different lengths of follow‐up

Forest plot of comparison: occurence of CIN2 at different lengths of follow‐up

Forest plot of comparison: default rates at different lengths of follow‐up

Comparison 1: Occurence of CIN2+ at different lengths of follow‐up: immediate colposcopy versus cytological surveillance, Outcome 1: Occurrence of CIN2+

Comparison 2: Occurence of CIN3+ at different lengths of follow‐up: immediate colposcopy versus cytological surveillance, Outcome 1: Occurrence of CIN3+

Comparison 3: Histology at 12 months: immediate colposcopy versus cytological surveillance, Outcome 1: Presence of any CIN in histology at 12 months

Comparison 3: Histology at 12 months: immediate colposcopy versus cytological surveillance, Outcome 2: Presence of CIN1/2 in histology at 12 months

Comparison 3: Histology at 12 months: immediate colposcopy versus cytological surveillance, Outcome 3: Presence of CIN3+ in histology at 12 months

Comparison 4: Histology at 24 months: immediate colposcopy versus cytological surveillance, Outcome 1: Histology at 24 months

Comparison 5: Occurence of CIN2 at different lengths of follow‐up: Immediate colposcopy versus cytological surveillance, Outcome 1: Occurrence of CIN2

Comparison 6: Default rates: immediate colposcopy versus cytological surveillance, Outcome 1: Default rates

Comparison 7: Histology at 24 months: immediate colposcopy versus cytological surveillance, LSIL/mild dyskaryosis only, Outcome 1: CIN incidence at 24 months, after LSIL/mild dyskaryosis at baseline

Comparison 8: Histology at 24 months: immediate colposcopy versus cytological surveillance, excluding 1 trial, Outcome 1: Presence of CIN2 in histology at 24 months

Comparison 8: Histology at 24 months: immediate colposcopy versus cytological surveillance, excluding 1 trial, Outcome 2: Presence of CIN2+ in histology at 24 months

Comparison 8: Histology at 24 months: immediate colposcopy versus cytological surveillance, excluding 1 trial, Outcome 3: Presence of CIN3+ in histology at 24 months
| Immediate colposcopy compared with cytological surveillance for minor cervical cytological abnormalities: occurrence of different grades CIN in histology according to follow‐up time and default rates | ||||||
| Patient or population: women with ASCUS or LSIL Settings: colposcopy clinic Intervention: immediate colposcopy Comparison: cytological surveillance | ||||||
| Outcomes | Illustrative comparative risks* (95% CI) | Relative effect | No of participants | Quality of the evidence | Comments | |
|---|---|---|---|---|---|---|
| Assumed risk | Corresponding risk | |||||
| Risk with cytological surveillance | Risk with immediate colposcopy | |||||
| Occurrence of CIN2+ in histology at 18 months | 101 per 1000 | 151 per 1000 | RR 1.50 (1.12 to 2.01) | 4028 | ⊕⊕⊕⊝ | |
| Occurrence of CIN2+ in histology at 24 months | 183 per 1000 | 209 per 1000 | RR 1.14 (0.66 to 1.97) | 4331 | ⊕⊕⊝⊝ | |
| Occurrence of CIN3+ in histology at 18 months | 69 per 1000 | 86 per 1000 | RR 1.24 (0.77 to 1.98) | 4028 | ⊕⊕⊕⊝ | |
| Occurrence of CIN3+ in histology at 24 months | 119 per 1000 | 121 per 1000 | RR 1.02 (0.53 to 1.97) | 4331 | ⊕⊕⊝⊝ | |
| Occurrence of any CIN in histology at 24 months | 316 per 1000 | 639 per 1000 | RR 2.02 (1.33 to 3.08) | 656 | ⊕⊕⊝⊝ | |
| Default rates at 6 months | 63 per 1000 | 241 per 1000 | RR 3.85 | 5117 | ⊕⊕⊕⊝ moderate6 | |
| Default rates at 12 months | 63 per 1000 | 413 per 1000 | RR 6.60 | 5115 | ⊕⊕⊕⊝ moderate7 | |
| *The basis for the assumed risk (e.g. the median control group risk across studies) is provided in footnotes. The corresponding risk (and its 95% confidence interval) is based on the assumed risk in the comparison group and the relative effect of the intervention (and its 95% CI). For default rates the relative effect is calculated between cytological surveillance versus immediate colposcopy. For histology the relative effect is calculated between immediate colposcopy versus cytological surveillance. | ||||||
| GRADE Working Group grades of evidence | ||||||
| 1 Downgraded to moderate due to substantial inter‐study heterogeneity (P = 0.08, I2= 61%). | ||||||
| Study | Outcomes | Immediate colposcopy n/N (%) | Cytological surveillance n/N (%) | RR + 95% CI |
| ALTS 2003(ASCUS) | Histology at 18 monthsa | |||
| CIN 2 | 61/1163 (5.2) | 26/1164 (2.2) | 2.35 [1.49, 3.69] | |
| CIN 2+ | 119/1163 (10.2) | 92/1164 (7.9) | 1.29 [1.00, 1.68] | |
| CIN 3+ | 58/1163 (5.0) | 66/1164 (5.7) | 0.88 [0.62, 1.24] | |
| Histology at 24 months | ||||
| CIN 2 | 61/1163 (5.2) | 60/1164 (5.2) | 1.02 [0.72,1.44] | |
| CIN 2+ | 119/1163 (10.2) | 168/1164 (14.4) | 0.71 [0.57, 0.88] | |
| CIN 3+ | 58/1163 (5.0) | 108/1164 (9.3) | 0.54 [0.39, 0.73] | |
| Default rates: | ||||
| Default rate at 24 months | 15/1163 (1.3) | 165/1164 (14.2) | 10.99 [6.52, 18.53] | |
| ALTS 2003(LSIL) | Histology at 18 monthsa | |||
| CIN 2 | 63/673 (9.4) | 36/675 (5.3) | 1.76 [1.18, 2.61] | |
| CIN 2+ | 127/673 (18.9) | 95/675 (14.1) | 1.34 [1.05, 1.71] | |
| CIN 3+ | 64/673 (9.5) | 59/675 (8.7) | 1.09 [0.78, 1.52] | |
| Histology at 24 months | ||||
| CIN 2 | 63/673 (9.4) | 58/675 (8.6) | 1.09 [0.78,1.53] | |
| CIN 2+ | 127/673 (18.9) | 151/675 (22.4) | 0.84 [0.68, 1.04] | |
| CIN 3+ | 64/673 (9.5) | 93/675 (13.8) | 0.69 [0.51, 0.93] | |
| Default rates: | ||||
| Default rate at 24 months | 4/673 (0.6) | 110/675 (16.3) | 27.42 [10.17, 73.93] | |
| Histology at 6 months | ||||
| HPV / Koilocytic atypia | 13/145 (9.0) | 28/160 (17.5) | 0.52 [0.28, 0.95] | |
| Any CIN | 121/145 (83.4) | 86/160 (53.8) | 1.55 [1.32, 1.82] | |
| CIN 1 | 23/145 (15.9) | 27/160 (16.9) | 0.94 [0.57, 1.56] | |
| CIN 2 | 32/145 (22.1) | 26/160 (16.3) | 1.36 [0.85, 2.16] | |
| CIN 2+ | 98/145 (67.6) | 59/160 (36.9) | 1.83 [1.45, 2.31] | |
| CIN 3+ | 66/145 (45.5) | 33/160 (20.6) | 2.21 [1.55, 3.14] | |
| Histology at 12 months | ||||
| HPV / Koilocytic atypia | 13/145 (9.0) | 18/158 (11.4) | 0.79 [0.40, 1.55] | |
| Any CIN | 121/145 (83.4) | 96/158 (60.8) | 1.37 [1.19, 1.59] | |
| CIN 1 | 23/145 (15.9) | 25/158 (15.8) | 1.00 [0.60, 1.69] | |
| CIN 2 | 32/145 (22.1) | 26/158 (16.5) | 1.34 [0.84, 2.14] | |
| CIN 1 / 2 | 55/145 (37.9) | 51/158 (32.3) | 1.18 [0.86, 1.60] | |
| CIN 2+ | 98/145 (67.6) | 71/158 (44.9) | 1.50 [1.22, 1.85] | |
| CIN 3+ | 66/145 (45.5) | 45/158 (28.5) | 1.60 [1.18, 2.17] | |
| Histology at 24 months | ||||
| HPV / Koilocytic atypia | 13/145 (9.0) | 11/158 (7.0) | 1.29 [0.60, 2.78] | |
| Any CIN | 121/145 (83.4) | 53/158 (33.5) | 2.49 [1.97, 3.13] | |
| CIN 1 | 23/145 (15.9) | 9/158 (5.7) | 2.78 [1.33, 5.82] | |
| CIN 2 | 32/145 (22.1) | 12/158 (7.6) | 2.91 [1.56, 5.42] | |
| CIN 2+ | 98/145 (67.6) | 44/158 (27.8) | 2.43 [1.84, 3.20] | |
| CIN 3+ | 66/145 (45.5) | 32/158 (20.3) | 2.25 [1.57, 3.21] | |
| Default rates: | ||||
| Default rate at 6 months | 0/145 (0) | 19/160 (11.9) | 35.37 [2.15, 580.52] | |
| Default rate at 12 months | 0/145 (0) | 23/158 (14.6) | 43.16 [2.65, 704.13] | |
| Default rate at 24 months | 0/145 (0) | 38/158 (24.1) | 70.70 [4.38, 1140.47] | |
| Histology at 12 months | ||||
| Any CIN | 83/130 (63.8) | 71/243 (29.2) | 2.19 [1.73, 2.76] | |
| CIN 1 / 2 | 61/130 (46.9) | 47/243 (19.3) | 2.43 [1.77, 3.32] | |
| CIN 3+ | 22/130 (16.9) | 24/243 (9.9) | 1.71 [1.00, 2.93] | |
| Default rates: | ||||
| Default rate at 6 months | 5/130 (3.8) | 46/243 (18.9) | 4.92 [2.01, 12.08] | |
| Default rate at 12 months | 5/130 (3.8) | 95/243 (39.1) | 10.16 [4.24, 24.35] | |
| GHQ casenessb | Choicec | No choicec | ||
| Baseline | 134/233 (58) | 119/241 (49) | 1.16 [0.98, 1.38] | |
| 6 months (pre visit) | 71/183 (39) | 77/190 (41) | 0.96 [0.75, 1.23] | |
| 6 months (post visit) | 59/175 (34) | 66/177 (37) | 0.90 [0.68, 1.20] | |
| 12 months | 40/135 (29) | 35/127 (28) | 1.08 [0.73, 1.58] | |
| Histology at 18 monthsa | ||||
| CIN 2 | 8/182(4.4) | 2/171 (1.1) | 3.76 [0.81, 17.45] | |
| CIN 2+ | 43/182 (23.6) | 16/171 (9.4) | 2.53 [1.48, 4.31] | |
| CIN 3+ | 35/182 (19.2) | 14/171(8.2) | 2.35 [1.31, 2.45] | |
| Histology at 24 months | ||||
| HPV / Koilocytic atypia | 92/182 (50.5) | 57/171 (33.3) | 1.52 [1.17, 1.96] | |
| Any CIN | 88/182 (48.4) | 51/171 (29.8) | 1.62 [1.23, 2.13] | |
| CIN 1 | 45/182 (24.7) | 17/171 (9.9) | 2.49 [1.48, 4.17] | |
| CIN 2 | 8/182 (4.4) | 10/171 (5.8) | 0.75 [0.30, 1.86] | |
| CIN 2+ | 43/182 (23.6) | 34/171 (19.9) | 1.19 [0.80, 1.77] | |
| CIN 3+ | 35/182 (19.2) | 24/171 (14.0) | 1.37 [0.85, 2.20] | |
| Default rates: | ||||
| Default rate at 24 months | 1/182 (0.5) | 36/171 (21.1) | 38.32 [5.31, 276.40] | |
| Tombola 2009 | Histology at 30 monthsa | |||
| CIN 2 | 181/2216 (8.2) | 101/2223 (4.5) | 1.80 [1.42, 2.28] | |
| CIN 2+ | 369/2216 (16.7) | 269/2223 (12.1) | 1.38 [1.19, 1.59] | |
| CIN 3+ | 188/2216 (8.5) | 168/2223 (7.6) | 1.12 [0.92, 1.37] | |
| Histology at 36 months | ||||
| CIN 2 | 181/2216 (8.2) | 157/2223 (7.1) | 1.16 [0.94, 1.42] | |
| CIN 2+ | 369/2216 (16.7) | 350/2223 (15.7) | 1.06 [0.93, 1.21] | |
| CIN 3+ | 188/2216 (8.5) | 193/2223 (8.7) | 0.98 [0.81, 1.18] | |
| Default rates: | ||||
| Default rate at 6 months | 151/2216 (6.8) | 285/2223 (12.8) | 1.88 [1.56, 2.27] | |
| Default rate at 12 months | 151/2216 (6.8) | 327/2223 (14.7) | 2.16 [1.80, 2.59] | |
| Paind | ||||
| Any pain | 304/782 (38.9) | 145/968 (15.0) | 2.60 [2.18, 3.09] | |
| Moderate or more severe | 144/774 (18.6) | 56/965 (5.8) | 3.21 [2.39, 4.30] | |
| Bleedingd | ||||
| Any bleeding | 366/781 (46.9) | 166/967 (17.2) | 2.73 [2.33, 3.19] | |
| Moderate or more severe | 144/772 (18.6) | 16/961 (1.7) | 11.20 [6.74, 18.61] | |
| Discharged | ||||
| Any discharge | 267/780 (34.2) | 83/964 (8.6) | 3.98 [3.17, 4.99] | |
| Moderate or more severe | 133/777 (17.1) | 36/962 (3.7) | 4.57 [3.20, 6.53] | |
| Anxietye | ||||
| 6 weeks | 59/751 (7.9) | 121/900 (13.4) | 0.58 [0.43, 0.79] | |
| 12 months | 190/1161 (16.4) | 218/1130 (19.3) | 0.85 [0.71, 1.01] | |
| 18 months | 162/1050 (15.4) | 177/1008 (17.6) | 0.88 [0.72, 1.07] | |
| 24 months | 179/1001 (17.9) | 177/962 (18.4) | 0.97 [0.81, 1.17] | |
| 30 months | 146/949 (15.4) | 143/887 (16.1) | 0.95 [0.77, 1.18] | |
| Depressionf | ||||
| 6 weeks | 50/757 (6.6) | 68/902 (7.5) | 0.88 [0.62, 1.25] | |
| 12 months | 110/1162 (9.5) | 132/1136 (11.6) | 0.81 [0.64, 1.04] | |
| 18 months | 106/1052 (10.1) | 114/1016 (11.2) | 0.90 [0.70, 1.15] | |
| 24 months | 111/1001 (11.1) | 104/964 (10.8) | 1.03 [0.80, 1.32] | |
| 30 months | 101/948 (10.7) | 108/887 (12.2) | 0.88 [0.68, 1.13] | |
| For Immediate colposcopy, n = n at immediate colposcopy visit, possible follow‐up excluded. a Cumulative incidence during follow‐up, excluding the exit examination or deferred treatment. b GHQ caseness = GHQ (General Health Questionnaire) score ≥ 4. c Analysis for this outcome between the original randomization groups. d Based on Questionnaire 6 weeks after immediate colposcopy or first cytological surveillance visit. e ≥ 11 on hospital anxiety and depression anxiety subscale f ≥ 8 on hospital anxiety and depression subscale | ||||
| Outcome or subgroup title | No. of studies | No. of participants | Statistical method | Effect size |
| 1.1 Occurrence of CIN2+ Show forest plot | 3 | Risk Ratio (IV, Random, 95% CI) | Subtotals only | |
| 1.1.1 18 months' surveillance | 2 | 4028 | Risk Ratio (IV, Random, 95% CI) | 1.50 [1.12, 2.01] |
| 1.1.2 24 months' surveillance | 3 | 4331 | Risk Ratio (IV, Random, 95% CI) | 1.14 [0.66, 1.97] |
| Outcome or subgroup title | No. of studies | No. of participants | Statistical method | Effect size |
| 2.1 Occurrence of CIN3+ Show forest plot | 4 | Risk Ratio (IV, Random, 95% CI) | Subtotals only | |
| 2.1.1 12 months' surveillance | 2 | 676 | Risk Ratio (IV, Random, 95% CI) | 2.07 [1.54, 2.79] |
| 2.1.2 18 months' surveillance | 2 | 4028 | Risk Ratio (IV, Random, 95% CI) | 1.24 [0.77, 1.98] |
| 2.1.3 24 months' surveillance | 3 | 4331 | Risk Ratio (IV, Random, 95% CI) | 1.02 [0.53, 1.97] |
| Outcome or subgroup title | No. of studies | No. of participants | Statistical method | Effect size |
| 3.1 Presence of any CIN in histology at 12 months Show forest plot | 2 | 676 | Risk Ratio (IV, Random, 95% CI) | 1.72 [1.09, 2.70] |
| 3.2 Presence of CIN1/2 in histology at 12 months Show forest plot | 2 | 676 | Risk Ratio (IV, Random, 95% CI) | 1.69 [0.83, 3.43] |
| 3.3 Presence of CIN3+ in histology at 12 months Show forest plot | 2 | 676 | Risk Ratio (IV, Random, 95% CI) | 1.63 [1.25, 2.12] |
| Outcome or subgroup title | No. of studies | No. of participants | Statistical method | Effect size |
| 4.1 Histology at 24 months Show forest plot | 3 | Risk Ratio (IV, Random, 95% CI) | Subtotals only | |
| 4.1.1 HPV/Koilocytic atypia | 2 | 656 | Risk Ratio (IV, Random, 95% CI) | 1.49 [1.17, 1.90] |
| 4.1.2 Any CIN | 2 | 656 | Risk Ratio (IV, Random, 95% CI) | 2.02 [1.33, 3.08] |
| 4.1.3 CIN1 | 2 | 656 | Risk Ratio (IV, Random, 95% CI) | 2.58 [1.69, 3.94] |
| 4.1.4 CIN2 | 3 | 4331 | Risk Ratio (IV, Random, 95% CI) | 1.25 [0.80, 1.96] |
| 4.1.5 CIN2+ | 3 | 4331 | Risk Ratio (IV, Random, 95% CI) | 1.14 [0.66, 1.97] |
| 4.1.6 CIN3+ | 3 | 4331 | Risk Ratio (IV, Random, 95% CI) | 1.02 [0.53, 1.97] |
| Outcome or subgroup title | No. of studies | No. of participants | Statistical method | Effect size |
| 5.1 Occurrence of CIN2 Show forest plot | 3 | Risk Ratio (IV, Random, 95% CI) | Subtotals only | |
| 5.1.1 18 months' surveillance | 2 | 4028 | Risk Ratio (IV, Random, 95% CI) | 2.04 [1.52, 2.73] |
| 5.1.2 24 months' surveillance | 3 | 4331 | Risk Ratio (IV, Random, 95% CI) | 1.45 [0.87, 2.40] |
| Outcome or subgroup title | No. of studies | No. of participants | Statistical method | Effect size |
| 6.1 Default rates Show forest plot | 5 | Risk Ratio (IV, Random, 95% CI) | Subtotals only | |
| 6.1.1 Default rates at 6 months | 3 | 5117 | Risk Ratio (IV, Random, 95% CI) | 3.85 [1.27, 11.63] |
| 6.1.2 Default rates at 12 months | 3 | 5115 | Risk Ratio (IV, Random, 95% CI) | 6.60 [1.49, 29.29] |
| 6.1.3 Default rates at 24 months | 3 | 4331 | Risk Ratio (IV, Random, 95% CI) | 19.10 [9.02, 40.43] |
| Outcome or subgroup title | No. of studies | No. of participants | Statistical method | Effect size |
| 7.1 CIN incidence at 24 months, after LSIL/mild dyskaryosis at baseline Show forest plot | 2 | Risk Ratio (IV, Random, 95% CI) | Subtotals only | |
| 7.1.1 CIN2 incidence at 24 months | 2 | 1651 | Risk Ratio (IV, Random, 95% CI) | 1.72 [0.66, 4.48] |
| 7.1.2 CIN2+ incidence at 24 months | 2 | 1651 | Risk Ratio (IV, Random, 95% CI) | 1.43 [0.51, 4.01] |
| 7.1.3 CIN3+ incidence at 24 months | 2 | 1651 | Risk Ratio (IV, Random, 95% CI) | 1.24 [0.39, 3.94] |
| Outcome or subgroup title | No. of studies | No. of participants | Statistical method | Effect size |
| 8.1 Presence of CIN2 in histology at 24 months Show forest plot | 2 | 656 | Risk Ratio (IV, Random, 95% CI) | 1.54 [0.41, 5.78] |
| 8.2 Presence of CIN2+ in histology at 24 months Show forest plot | 2 | 656 | Risk Ratio (IV, Random, 95% CI) | 1.72 [0.86, 3.47] |
| 8.3 Presence of CIN3+ in histology at 24 months Show forest plot | 2 | 656 | Risk Ratio (IV, Random, 95% CI) | 1.80 [1.11, 2.92] |