Intervenciones para la promoción de la reintegración y la reducción del comportamiento y modos de vida perjudiciales en niños y jóvenes relacionados con la calle
Información
- DOI:
- https://doi.org/10.1002/14651858.CD009823.pub3Copiar DOI

- Base de datos:
-
- Cochrane Database of Systematic Reviews
- Versión publicada:
-
- 13 enero 2016see what's new
- Tipo:
-
- Intervention
- Etapa:
-
- Review
- Grupo Editorial Cochrane:
-
Grupo Cochrane de Salud pública
- Copyright:
-
- Copyright © 2016 The Cochrane Collaboration. Published by John Wiley & Sons, Ltd.
Cifras del artículo
Altmetric:
Citado por:
Autores
Contributions of authors
Esther Coren (EC) and Rosa Hossain (RH) drafted the protocol with input from other review authors and from the advisory group for the original review. At the update stage, changes to these elements of the review were drafted by Esther Coren and Rosa Hossain. Jordi Pardo Pardo (JPP) developed the search strategy with input provided as above and consulted on development of the logic models. He was involved in many strategic discussions with EC on the overall progress of the review. RH contributed to development and piloting of data extraction and mapping tools, to data extraction and mapping, to analysis and synthesis and to writing of the review including the Discussion section, and to all of these tasks with EC at update. At the update stage, Brittany Baker (BB) contributed to screening and data extraction. EC directed all stages of the review, co‐ordinated the team and was involved directly at all stages and in all aspects of problem solving through each stage of the review and the update.
Sources of support
Internal sources
-
Canterbury Christ Church University, UK.
Lead authors are employed by Canterbury Christ Church University, which has contributed infrastructure and running costs to the review and the update
External sources
-
3ie, Other.
Funding to support the project
-
NIHR Cochrane Incentive Award, UK.
This project was supported by the National Institute for Health Research, via Cochrane Incentive Award funding to the Cochrane Public Health Group. The views and opinions expressed therein are those of the review authors and do not necessarily reflect those of the Systematic Reviews Programme, NIHR, NHS or the Department of Health.
Declarations of interest
Research discussed in this publication has been funded by the International Initiative for Impact Evaluation, Inc. (3ie), through the Global Development Network (GDN). The views expressed in this article are not necessarily those of 3ie or its members, or of GDN.
Acknowledgements
Thanks are due to the advisory group members who contributed their wisdom to the development of the original protocol: Sarah Thomas de Benitez, Harriot Beazley, Nicole Howard, Christopher Hands, Petra Englebrecht, Anna‐mai Estrella, Angeles Fiallo Montero, Claudia Stoicescu, Joe Walker, Louise Meincke, Damon Barrett and Kirstin Mitchell.
Thanks also to Tamara Rader from the Campbell Collaboration International Development Co‐ordinating Group and the Cochrane Musculoskeletal Group for assistance in developing the search strategy, and to Jodie Doyle of the Cochrane Public Health Group for assistance with the process.
Acknowledgements are due to authors of the original review, as follows: Manuela Thomae contributed to drafting the protocol, Mirella MS Veras (MV) contributed to refining the search and providing relevant Portuguese language terms, was closely involved in detailed screening of Spanish and Portuguese language texts retrieved in the search and contributed to data extraction. Kabita Chakraborty (KC) contacted organisations and NGOs in the field for unpublished data and made a contribution to screening, as well as to extrapolation and discussion. Holly Harris contributed to screening, data extraction and mapping of the original review, as well as to extrapolation and writing of the Discussion section. Anne Martin (AM) contributed to data extraction and to final production of the original completed review.
Thanks are also due to Jean Paul Boddu of Madras Christian College for assistance with screening, and to Jenny Witherden of Canterbury Christ Church University for assistance with institutional project management.
This project was supported by the National Institute for Health Research, via Cochrane Incentive Award funding to the authorship group. The views and opinions expressed therein are those of the authors and do not necessarily reflect those of the systematic Reviews Programme, NIHR, NHS or the Department of Health.Â
Version history
| Published | Title | Stage | Authors | Version |
| 2016 Jan 13 | Interventions for promoting reintegration and reducing harmful behaviour and lifestyles in street‐connected children and young people | Review | Esther Coren, Rosa Hossain, Jordi Pardo Pardo, Brittany Bakker | |
| 2013 Feb 28 | Interventions for promoting reintegration and reducing harmful behaviour and lifestyles in street‐connected children and young people | Review | Esther Coren, Rosa Hossain, Jordi Pardo Pardo, Mirella MS Veras, Kabita Chakraborty, Holly Harris, Anne J Martin | |
| 2012 Apr 18 | Interventions for promoting reintegration and reducing harmful behaviour and lifestyles in street‐connected children and young people | Protocol | Esther Coren, Rosa Hossain, Jordi Pardo Pardo, Manuela Thomae, Mirella MS Veras, Kabita Chakraborty | |
Differences between protocol and review
Review authors followed processes planned in the protocol, except when circumstances did not arise, for example, in cluster trials. The decision was made at the update stage to conduct a separate review of interventions to support street families. As a result of this, Tischler 2002 was removed from the review and will be added to an upcoming, separate review of interventions to support street families. This reflects differences in populations and in interventions offered, making this a more plausible theoretical approach. Also at update stage, we screened studies identified in the original search as well as in the update search for non‐randomised studies from LMICs for possible inclusion. We identified no studies that could be included through this approach.
Keywords
MeSH
Medical Subject Headings (MeSH) Keywords
Medical Subject Headings Check Words
Adolescent; Child; Child, Preschool; Female; Humans; Male; Young Adult;
PICO

Intervention and context logic model.
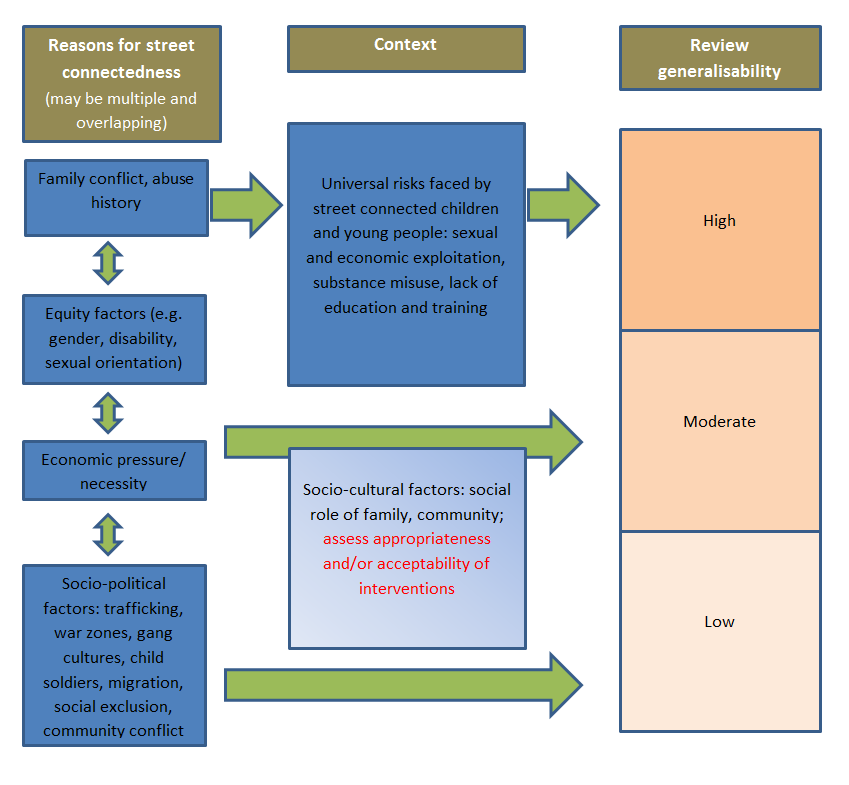
Generalisability logic model.

Study flow diagram.
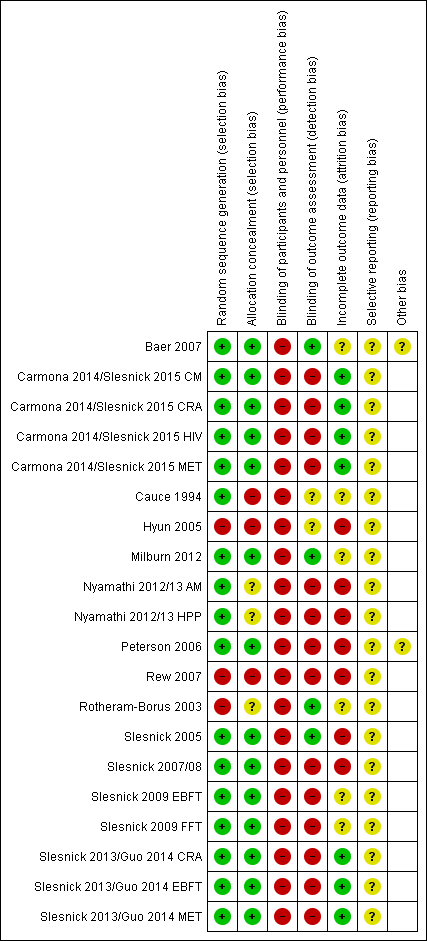
Risk of bias summary: review authors' judgements about each risk of bias item for each included study.

Risk of bias graph: review authors' judgements about each risk of bias item presented as percentages across all included studies.

Comparison 1 Safer or reduced sexual activity, Outcome 1 Number of times had sex ‐ 3 months.

Comparison 1 Safer or reduced sexual activity, Outcome 2 Number of times had sex ‐ 6 months.
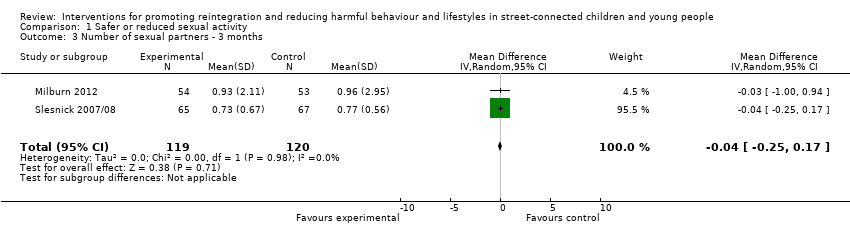
Comparison 1 Safer or reduced sexual activity, Outcome 3 Number of sexual partners ‐ 3 months.

Comparison 1 Safer or reduced sexual activity, Outcome 4 Number of sexual partners ‐ 6 months.
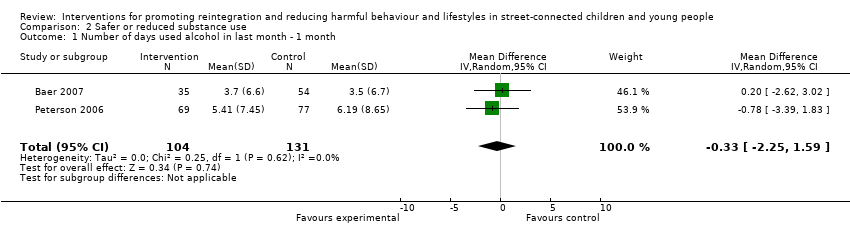
Comparison 2 Safer or reduced substance use, Outcome 1 Number of days used alcohol in last month ‐ 1 month.
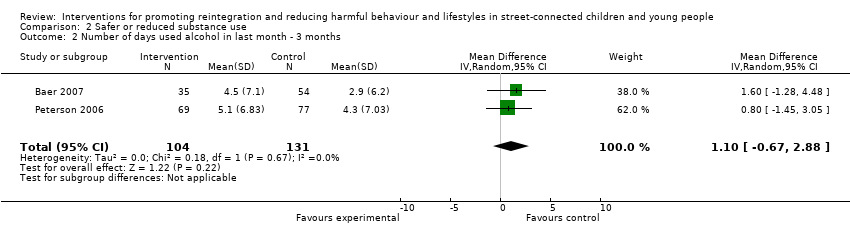
Comparison 2 Safer or reduced substance use, Outcome 2 Number of days used alcohol in last month ‐ 3 months.
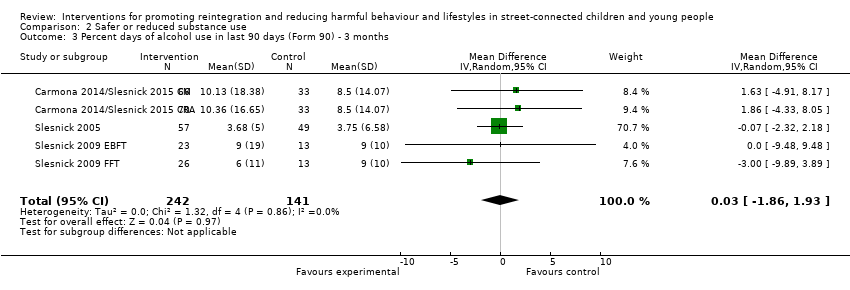
Comparison 2 Safer or reduced substance use, Outcome 3 Percent days of alcohol use in last 90 days (Form 90) ‐ 3 months.

Comparison 2 Safer or reduced substance use, Outcome 4 Percent days of alcohol use in last 90 days (Form 90) ‐ 6 months.
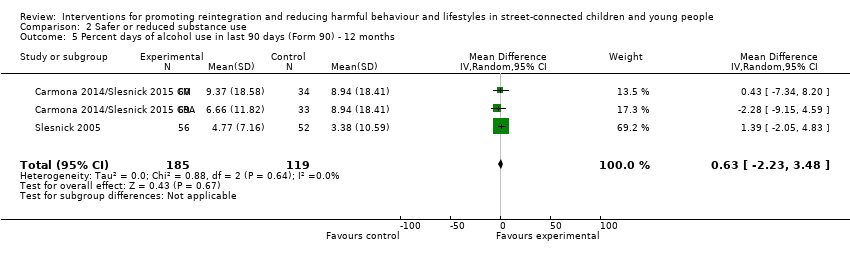
Comparison 2 Safer or reduced substance use, Outcome 5 Percent days of alcohol use in last 90 days (Form 90) ‐ 12 months.
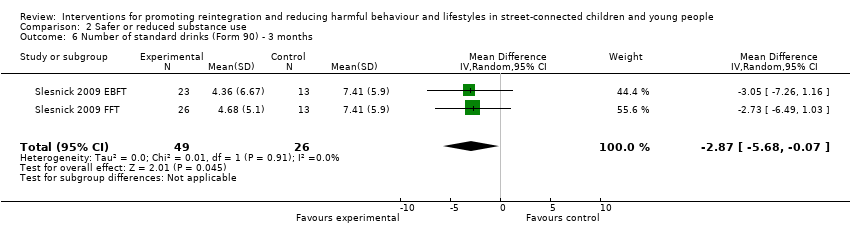
Comparison 2 Safer or reduced substance use, Outcome 6 Number of standard drinks (Form 90) ‐ 3 months.

Comparison 2 Safer or reduced substance use, Outcome 7 Adolescent Drinking Index ‐ 3 months.

Comparison 2 Safer or reduced substance use, Outcome 8 Percent days of alcohol/drug use (excl tobacco) (Form 90) ‐ 3 months.

Comparison 2 Safer or reduced substance use, Outcome 9 Percent days of alcohol/drug use (excl tobacco) (Form 90) ‐ 6 months.
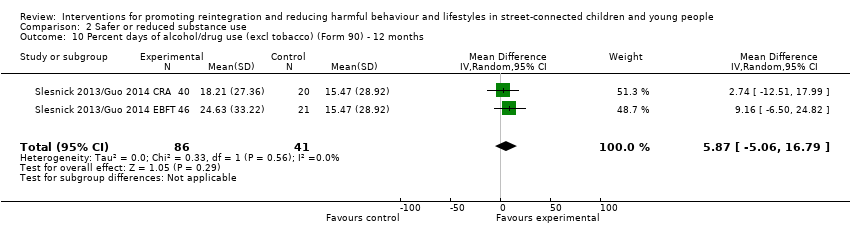
Comparison 2 Safer or reduced substance use, Outcome 10 Percent days of alcohol/drug use (excl tobacco) (Form 90) ‐ 12 months.

Comparison 2 Safer or reduced substance use, Outcome 11 Percent days only/any drug use (Form 90) ‐ 3 months.
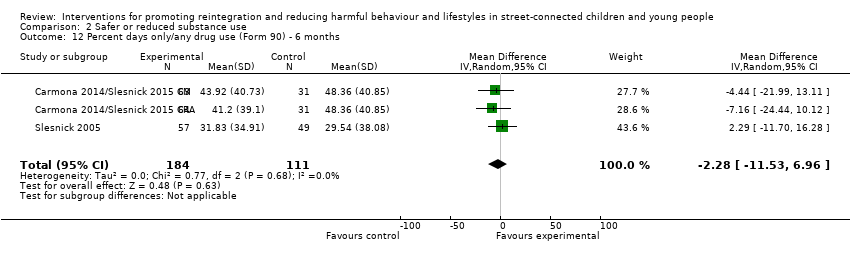
Comparison 2 Safer or reduced substance use, Outcome 12 Percent days only/any drug use (Form 90) ‐ 6 months.
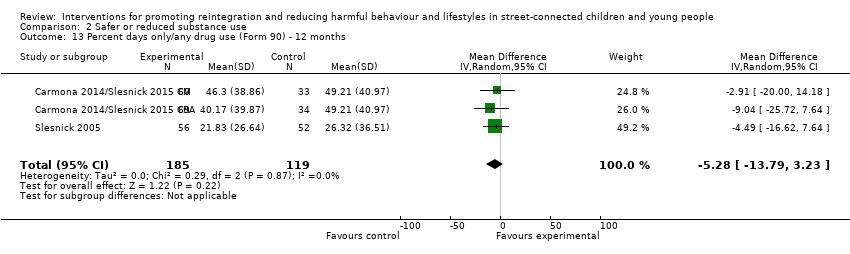
Comparison 2 Safer or reduced substance use, Outcome 13 Percent days only/any drug use (Form 90) ‐ 12 months.
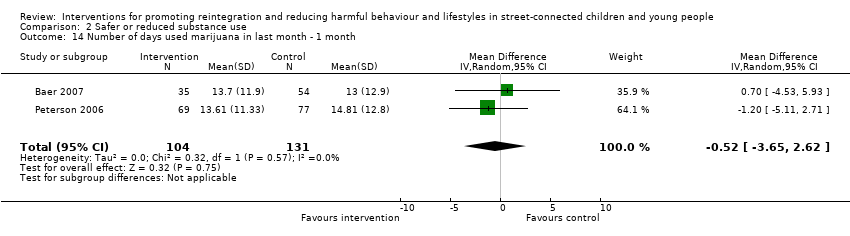
Comparison 2 Safer or reduced substance use, Outcome 14 Number of days used marijuana in last month ‐ 1 month.
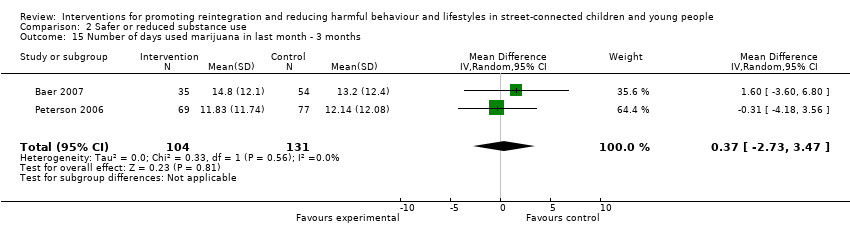
Comparison 2 Safer or reduced substance use, Outcome 15 Number of days used marijuana in last month ‐ 3 months.
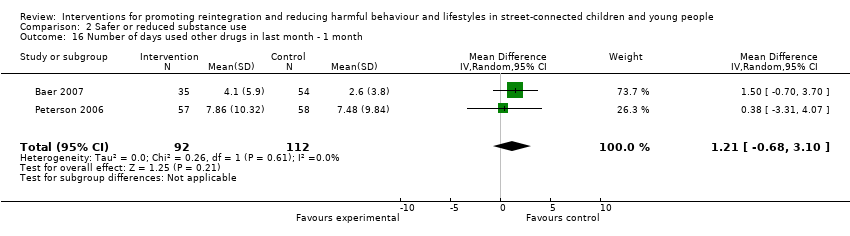
Comparison 2 Safer or reduced substance use, Outcome 16 Number of days used other drugs in last month ‐ 1 month.

Comparison 2 Safer or reduced substance use, Outcome 17 Number of days used other drugs in last month ‐ 3 months.

Comparison 2 Safer or reduced substance use, Outcome 18 Number of problem consequences ‐ 3 months.

Comparison 2 Safer or reduced substance use, Outcome 19 Number of problem consequences ‐ 6 months.

Comparison 2 Safer or reduced substance use, Outcome 20 Number of substance use diagnoses (CDISC) ‐ 3 months.

Comparison 2 Safer or reduced substance use, Outcome 21 Number of categories of drug use (Form 90) ‐ 6 months.

Comparison 3 Self esteem, Outcome 1 Self esteem at endpoint.

Comparison 4 Depression, Outcome 1 Depression at 3 months.

Comparison 4 Depression, Outcome 2 Depression at 6 months.

Comparison 4 Depression, Outcome 3 Depression at 12 months.

Comparison 5 Reduced use of violence, Outcome 1 Verbal aggression (Conflict Tactic Scale) ‐ 3 months.
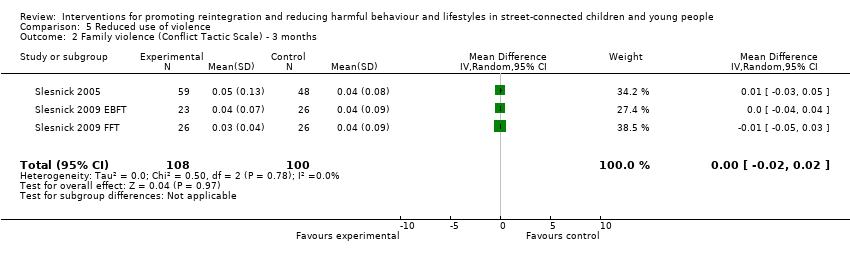
Comparison 5 Reduced use of violence, Outcome 2 Family violence (Conflict Tactic Scale) ‐ 3 months.
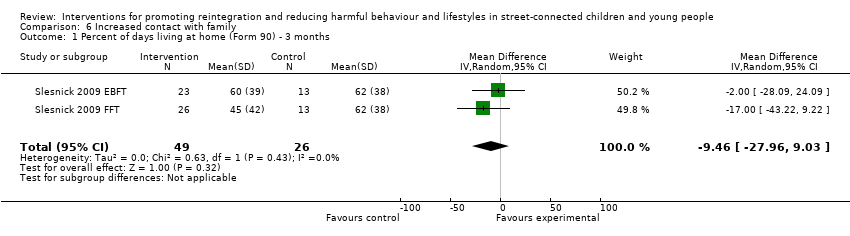
Comparison 6 Increased contact with family, Outcome 1 Percent of days living at home (Form 90) ‐ 3 months.

Comparison 7 Social functioning, Outcome 1 Delinquent behaviours at 3 months.
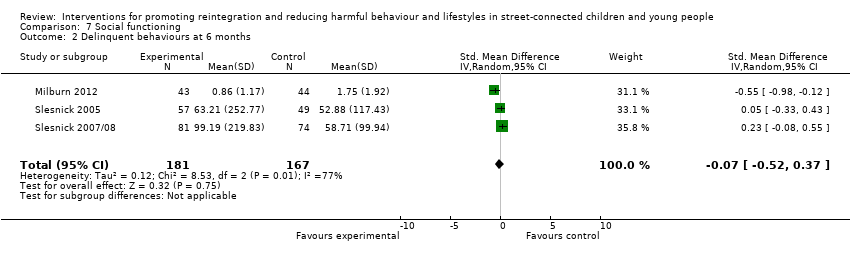
Comparison 7 Social functioning, Outcome 2 Delinquent behaviours at 6 months.
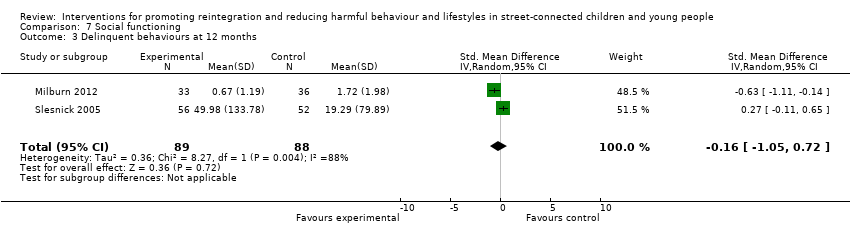
Comparison 7 Social functioning, Outcome 3 Delinquent behaviours at 12 months.

Comparison 8 Psychological functioning, Outcome 1 Internalising behaviours at 3 months.
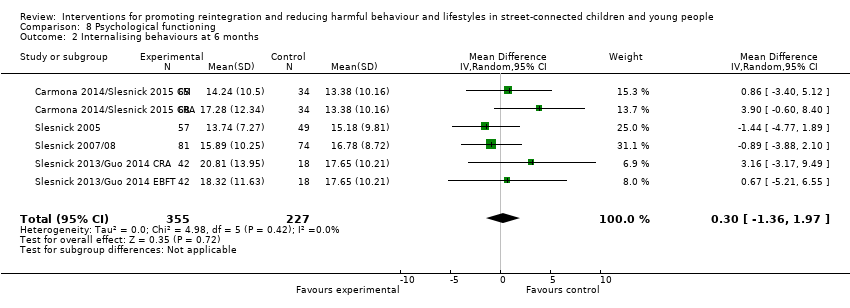
Comparison 8 Psychological functioning, Outcome 2 Internalising behaviours at 6 months.

Comparison 8 Psychological functioning, Outcome 3 Internalising behaviours at 12 months.
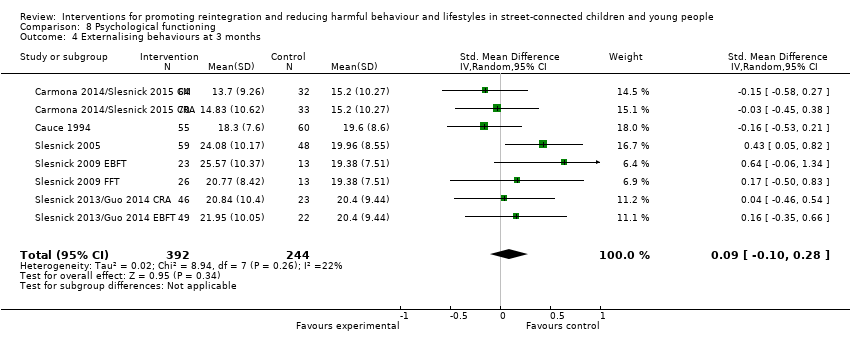
Comparison 8 Psychological functioning, Outcome 4 Externalising behaviours at 3 months.

Comparison 8 Psychological functioning, Outcome 5 Externalising behaviours at 6 months.

Comparison 8 Psychological functioning, Outcome 6 Externalising behaviours at 12 months.

Comparison 8 Psychological functioning, Outcome 7 Number of psychiatric diagnoses.
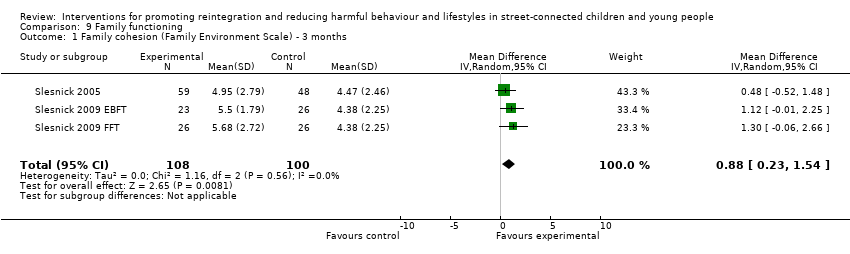
Comparison 9 Family functioning, Outcome 1 Family cohesion (Family Environment Scale) ‐ 3 months.

Comparison 9 Family functioning, Outcome 2 Family conflict (Family Environment Scale) ‐ 3 months.
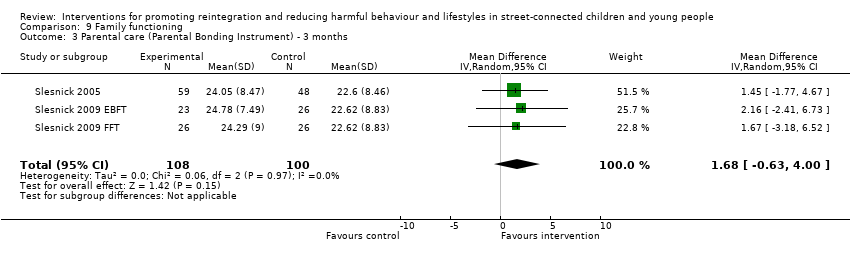
Comparison 9 Family functioning, Outcome 3 Parental care (Parental Bonding Instrument) ‐ 3 months.

Comparison 9 Family functioning, Outcome 4 Parental overprotection (Parental Bonding Instrument) ‐ 3 months.
| Therapeutic intervention compared with service as usual for street‐connected children and young people | |||
| Patient or population: street‐connected children and young people Settings: shelters and drop‐in centres Intervention: various specific therapeutic types of interventions Comparison: shelter/drop‐in service as usual | |||
| Outcome categories (summarised) | Impact | Number of | Quality of the evidence |
| Primary outcome ‐ reintegration
| Reintegration was not measured in any of the studies. Similarly, access to literacy, numeracy, education and employment were not measured in any of the studies that met the criteria for inclusion. However, social stability was measured in 1 study and delinquent behaviours in 4 studies. Social stability outcomes measured in 1 study showed benefit for the intervention group. Delinquent behaviour results were mixed across studies; investigators used different types and constructs of measurement, so findings cannot be summarised | 1 4 | Moderatea |
| Promotion of mental health, including self esteem | Outcomes included in this category included depression, internalising and externalising behaviours, self esteem and psychiatric diagnoses measured on various scales. None of these measures showed overall differences between intervention and control groups, and change score calculations demonstrated that for the most part, both groups improved from baseline. These results indicate that for mental health promotion outcomes, the therapeutic intervention did not obtain significantly better outcomes than the service as usual/control condition in the studies included in this review | 8 | Moderatea |
| Reduction in harms associated with substance misuse | Substance misuse was measured in a wide variety of ways and includes alcohol misuse and different categories of non‐prescription drugs, as well as a scale measuring 'problem consequences'. The overall picture emerging form the included studies on these outcomes is unclear, possibly because of the array of measurement types and tools that measure subtly different constructs and differing time windows that were impossible to combine statistically. Results are mixed across studies, with some showing marginal or no differences between groups, and others showing clear benefit for intervention or control. Improvements in some substance misuse measures were noted in all 3 family intervention studies | 8 | Moderatea |
| Reduction in harms associated with early sexual activity | Sexually risky behaviour was similarly measured in different ways, including numbers of partners, numbers of times had sex, HIV knowledge, unprotected sex, condom use and rates of abstinence. Again, the picture across studies is mixed. Some studies showed benefit in 1 or another group, but it is difficult to untangle whether this shows benefit of a particular intervention or control condition, or whether this reflects differences in measurement approach | 5 | Lowb |
| Family functioning | These outcomes were measured by two studies that utilised family‐based approaches to providing intervention. No differences were found between intervention and control conditions on most of the outcome measures used. These included various aspects of family life such as parenting style, aggression and violence, family conflict and percent days living at home | 2 | Lowc |
| Overall picture | Participants in studies remained for the most part at a similar level or improved on outcomes measured. Assessment of the grade of evidence is moderate overall, as whilst some domains of bias (e.g. allocation concealment) were assessed mostly as having low risk of bias, other domains such as blinding, were assessed consistently as high risk, whilst selective reporting was consistently assessed as unclear. No clear examples showed deteriorated outcomes. Findings may be more generalisable to young people in low‐ and middle‐income countries with circumstances more similar to those included in the studies (i.e. those who have left home because of abuse or family conflict | Total studies included = 13 | Moderatea |
| GRADE Working Group grades of evidence | |||
| Summarised outcome categories used in Summary of findings (SoF) table in the interest of space aOverall, the quality of the evidence was assessed as 'moderate' in the context of typical study quality in comparable areas (psychosocial interventions with at‐risk populations), and standard quality criteria were used in Cochrane reviews (in particular, the GRADE evaluation framework as utilised here). Quality of evidence for all available outcome categories was upgraded because they were based on robust study designs (RCTs); reasonably low drop‐out rates (for the study population involved); some analysis of major confounders including age and gender, and publication of data for a broad range of outcomes, including non‐significant outcomes, measured over reasonably long follow‐up periods, in most included studies. Quality of evidence was downgraded for the following reasons: heterogeneity of study outcomes, measures and types of statistical analysis used; inconsistency in measures, findings and analyses across outcomes and across studies with similar interventions; reliance on self report; use of convenience samples; over‐representation of studies from one study team; and questions over study generalisability. Further, few studies involved a control condition receiving no services, and some did not involve a service as usual condition, reducing comparability across studies. Finally, the relationship between intervention theories and outcomes measured remained unclear, and clinical and subjective significance of outcomes was explored in a small number of included studies. No participatory or process evaluations were available bAs above, but the quality of the evidence was further downgraded because of the relatively small number of heterogeneous studies cAs above, but the quality of the evidence was further downgraded because of the small number of studies available. The two included studies were conducted by the same study team. | |||
| Number* | Outcome name | Study | Measure | ≤1 month | 3 months | 6 months | 12 months |
| Number of times participant had sex in last 90 days | HRQ | x | x | ||||
| Own | x | x | |||||
| Number of sexual partners | HRQ | x | x | ||||
| Own | x | x | |||||
| Alcohol use (number of days in last 30 days) | TLFB | x | x | ||||
| TLFB | x | x | |||||
| Alcohol use (% days in last 90 days) | Form 90 | x | x | x | |||
| Form 90 | x | ||||||
| Form 90 | x | ||||||
| Form 90 | x | x | x | ||||
| Form 90 | x | x | x | ||||
| Form 90 | x | x | x | ||||
| Number of standard drinks (in last 90 days) | Form 90 | x | |||||
| Form 90 | x | ||||||
| Alcohol use (total score) | ADI | x | |||||
| ADI | x | ||||||
| Alcohol/drug use (% days in last 90 days) | Form 90 | x | |||||
| Form 90 | x | ||||||
| Form 90 | x | ||||||
| Form 90 | x | x | x | ||||
| Form 90 | x | x | x | ||||
| Form 90 | x | x | x | ||||
| Only/any drug use (% days in last 90 days) | Form 90 | x | x | x | |||
| Form 90 | x | ||||||
| Form 90 | x | ||||||
| Form 90 | x | x | x | ||||
| Form 90 | x | x | x | ||||
| Form 90 | x | x | x | ||||
| Marijuana use (number of days in last 30 days) | TLFB | x | x | ||||
| TLFB | x | x | |||||
| Drug use other than marijuana (number of days in last 30 days) | TLFB | x | x | ||||
| TLFB | x | x | |||||
| Number of problem consequences | POSIT | x | x | ||||
| POSIT | x | ||||||
| POSIT | x | ||||||
| POSIT | x | ||||||
| Number of substance use diagnoses | CDISC | x | |||||
| CDISC | x | ||||||
| Number of categories of drug use (last 90 days) | Form 90 | x | |||||
| Form 90 | x | ||||||
| Self esteem | RSES | x | |||||
| SEI | x | ||||||
| Depression | RADS | x | |||||
| BDI | x | ||||||
| BDI | x | x | x | ||||
| BDI | x | ||||||
| BDI | x | ||||||
| BDI | x | ||||||
| BDI | x | x | x | ||||
| BDI | x | x | x | ||||
| BDI | x | x | x | ||||
| BDI | x | x | x | ||||
| BDI | x | x | x | ||||
| BDI | x | x | x | ||||
| Verbal aggression (youth) | CTS | x | |||||
| CTS | x | ||||||
| CTS | x | ||||||
| Family violence (youth) | CTS | x | |||||
| CTS | x | ||||||
| CTS | x | ||||||
| Days living at home (% days in last 90 days) | Form 90 | x | |||||
| Form 90 | x | ||||||
| Delinquent behaviours | YSR | x | |||||
| DSM‐IV | x | x | x | ||||
| NYSDS | x | x | x | ||||
| NYSDS | x | ||||||
| NYSDS | x | ||||||
| NYSDS | x | ||||||
| Internalising problems | YSR | x | |||||
| YSR | x | x | x | ||||
| YSR | x | ||||||
| YSR | x | ||||||
| YSR | x | ||||||
| YSR | x | x | x | ||||
| YSR | x | x | x | ||||
| YSR | x | x | x | ||||
| YSR | x | x | x | ||||
| YSR | x | x | x | ||||
| YSR | x | x | x | ||||
| Externalising problems | YSR | x | |||||
| YSR | x | x | x | ||||
| YSR | x | ||||||
| YSR | x | ||||||
| YSR | x | ||||||
| YSR | x | x | x | ||||
| YSR | x | x | x | ||||
| YSR | x | x | x | ||||
| YSR | x | x | x | ||||
| YSR | x | x | x | ||||
| YSR | x | x | x | ||||
| Number of psychiatric diagnoses | CDISC | x | |||||
| CDISC | x | ||||||
| CDISC | x | ||||||
| Family cohesion | FES | x | |||||
| FES | x | ||||||
| FES | x | ||||||
| Family conflict | FES | x | |||||
| FES | x | ||||||
| FES | x | ||||||
| Parental care | PBI | x | |||||
| PBI | x | ||||||
| PBI | x | ||||||
| Parental overprotectiveness | PBI | x | |||||
| PBI | x | ||||||
| PBI | x | ||||||
| Number | Outcome name | Study | Measure | ≤1 month | 3 months | 6 months | 12 months |
| Gaps occur when absence of relevant data was noted in relation to particular outcomes defined in the protocol | |||||||
| Outcome or subgroup title | No. of studies | No. of participants | Statistical method | Effect size |
| 1 Number of times had sex ‐ 3 months Show forest plot | 2 | 239 | Mean Difference (IV, Random, 95% CI) | ‐0.56 [‐1.13, 0.01] |
| 2 Number of times had sex ‐ 6 months Show forest plot | 2 | 242 | Mean Difference (IV, Random, 95% CI) | 0.73 [‐2.97, 4.43] |
| 3 Number of sexual partners ‐ 3 months Show forest plot | 2 | 239 | Mean Difference (IV, Random, 95% CI) | ‐0.04 [‐0.25, 0.17] |
| 4 Number of sexual partners ‐ 6 months Show forest plot | 2 | 242 | Mean Difference (IV, Random, 95% CI) | ‐0.04 [‐0.22, 0.13] |
| Outcome or subgroup title | No. of studies | No. of participants | Statistical method | Effect size |
| 1 Number of days used alcohol in last month ‐ 1 month Show forest plot | 2 | 235 | Mean Difference (IV, Random, 95% CI) | ‐0.33 [‐2.25, 1.59] |
| 2 Number of days used alcohol in last month ‐ 3 months Show forest plot | 2 | 235 | Mean Difference (IV, Random, 95% CI) | 1.10 [‐0.67, 2.88] |
| 3 Percent days of alcohol use in last 90 days (Form 90) ‐ 3 months Show forest plot | 5 | 383 | Mean Difference (IV, Random, 95% CI) | 0.03 [‐1.86, 1.93] |
| 4 Percent days of alcohol use in last 90 days (Form 90) ‐ 6 months Show forest plot | 3 | 295 | Mean Difference (IV, Random, 95% CI) | 1.05 [‐1.76, 3.86] |
| 5 Percent days of alcohol use in last 90 days (Form 90) ‐ 12 months Show forest plot | 3 | 304 | Mean Difference (IV, Random, 95% CI) | 0.63 [‐2.23, 3.48] |
| 6 Number of standard drinks (Form 90) ‐ 3 months Show forest plot | 2 | 75 | Mean Difference (IV, Random, 95% CI) | ‐2.87 [‐5.68, ‐0.07] |
| 7 Adolescent Drinking Index ‐ 3 months Show forest plot | 2 | 75 | Mean Difference (IV, Random, 95% CI) | 1.08 [‐4.42, 6.57] |
| 8 Percent days of alcohol/drug use (excl tobacco) (Form 90) ‐ 3 months Show forest plot | 4 | 214 | Mean Difference (IV, Random, 95% CI) | ‐0.70 [‐9.09, 7.70] |
| 9 Percent days of alcohol/drug use (excl tobacco) (Form 90) ‐ 6 months Show forest plot | 3 | 278 | Mean Difference (IV, Random, 95% CI) | ‐2.15 [‐9.82, 5.53] |
| 10 Percent days of alcohol/drug use (excl tobacco) (Form 90) ‐ 12 months Show forest plot | 2 | 127 | Mean Difference (IV, Random, 95% CI) | 5.87 [‐5.06, 16.79] |
| 11 Percent days only/any drug use (Form 90) ‐ 3 months Show forest plot | 5 | 384 | Mean Difference (IV, Random, 95% CI) | 0.67 [‐6.82, 8.15] |
| 12 Percent days only/any drug use (Form 90) ‐ 6 months Show forest plot | 3 | 295 | Mean Difference (IV, Random, 95% CI) | ‐2.28 [‐11.53, 6.96] |
| 13 Percent days only/any drug use (Form 90) ‐ 12 months Show forest plot | 3 | 304 | Mean Difference (IV, Random, 95% CI) | ‐5.28 [‐13.79, 3.23] |
| 14 Number of days used marijuana in last month ‐ 1 month Show forest plot | 2 | 235 | Mean Difference (IV, Random, 95% CI) | ‐0.52 [‐3.65, 2.62] |
| 15 Number of days used marijuana in last month ‐ 3 months Show forest plot | 2 | 235 | Mean Difference (IV, Random, 95% CI) | 0.37 [‐2.73, 3.47] |
| 16 Number of days used other drugs in last month ‐ 1 month Show forest plot | 2 | 204 | Mean Difference (IV, Random, 95% CI) | 1.21 [‐0.68, 3.10] |
| 17 Number of days used other drugs in last month ‐ 3 months Show forest plot | 2 | 204 | Mean Difference (IV, Random, 95% CI) | 0.22 [‐1.84, 2.28] |
| 18 Number of problem consequences ‐ 3 months Show forest plot | 3 | 182 | Mean Difference (IV, Random, 95% CI) | 1.51 [0.56, 2.47] |
| 19 Number of problem consequences ‐ 6 months Show forest plot | 2 | 261 | Mean Difference (IV, Random, 95% CI) | 0.34 [‐0.67, 1.34] |
| 20 Number of substance use diagnoses (CDISC) ‐ 3 months Show forest plot | 2 | 75 | Mean Difference (IV, Random, 95% CI) | ‐0.70 [‐1.27, ‐0.14] |
| 21 Number of categories of drug use (Form 90) ‐ 6 months Show forest plot | 2 | 261 | Mean Difference (IV, Random, 95% CI) | 0.14 [‐0.33, 0.61] |
| Outcome or subgroup title | No. of studies | No. of participants | Statistical method | Effect size |
| 1 Self esteem at endpoint Show forest plot | 2 | 142 | Std. Mean Difference (IV, Random, 95% CI) | 0.11 [‐0.22, 0.44] |
| Outcome or subgroup title | No. of studies | No. of participants | Statistical method | Effect size |
| 1 Depression at 3 months Show forest plot | 9 | 661 | Std. Mean Difference (IV, Random, 95% CI) | ‐0.03 [‐0.22, 0.17] |
| 2 Depression at 6 months Show forest plot | 6 | 586 | Mean Difference (IV, Random, 95% CI) | 0.83 [‐0.88, 2.55] |
| 3 Depression at 12 months Show forest plot | 5 | 441 | Mean Difference (IV, Random, 95% CI) | 1.28 [‐0.36, 2.92] |
| Outcome or subgroup title | No. of studies | No. of participants | Statistical method | Effect size |
| 1 Verbal aggression (Conflict Tactic Scale) ‐ 3 months Show forest plot | 3 | 208 | Mean Difference (IV, Random, 95% CI) | ‐0.00 [‐0.07, 0.06] |
| 2 Family violence (Conflict Tactic Scale) ‐ 3 months Show forest plot | 3 | 208 | Mean Difference (IV, Random, 95% CI) | ‐0.00 [‐0.02, 0.02] |
| Outcome or subgroup title | No. of studies | No. of participants | Statistical method | Effect size |
| 1 Percent of days living at home (Form 90) ‐ 3 months Show forest plot | 2 | 75 | Mean Difference (IV, Random, 95% CI) | ‐9.46 [‐27.96, 9.03] |
| Outcome or subgroup title | No. of studies | No. of participants | Statistical method | Effect size |
| 1 Delinquent behaviours at 3 months Show forest plot | 5 | 404 | Std. Mean Difference (IV, Random, 95% CI) | ‐0.29 [‐0.54, ‐0.03] |
| 2 Delinquent behaviours at 6 months Show forest plot | 3 | 348 | Std. Mean Difference (IV, Random, 95% CI) | ‐0.07 [‐0.52, 0.37] |
| 3 Delinquent behaviours at 12 months Show forest plot | 2 | 177 | Std. Mean Difference (IV, Random, 95% CI) | ‐0.16 [‐1.05, 0.72] |
| Outcome or subgroup title | No. of studies | No. of participants | Statistical method | Effect size |
| 1 Internalising behaviours at 3 months Show forest plot | 8 | 634 | Mean Difference (IV, Random, 95% CI) | 0.73 [‐0.87, 2.34] |
| 2 Internalising behaviours at 6 months Show forest plot | 6 | 582 | Mean Difference (IV, Random, 95% CI) | 0.30 [‐1.36, 1.97] |
| 3 Internalising behaviours at 12 months Show forest plot | 5 | 433 | Mean Difference (IV, Random, 95% CI) | 0.31 [‐1.58, 2.20] |
| 4 Externalising behaviours at 3 months Show forest plot | 8 | 636 | Std. Mean Difference (IV, Random, 95% CI) | 0.09 [‐0.10, 0.28] |
| 5 Externalising behaviours at 6 months Show forest plot | 6 | 583 | Mean Difference (IV, Random, 95% CI) | 0.83 [‐0.74, 2.41] |
| 6 Externalising behaviours at 12 months Show forest plot | 5 | 434 | Mean Difference (IV, Random, 95% CI) | 0.04 [‐2.89, 2.97] |
| 7 Number of psychiatric diagnoses Show forest plot | 3 | 182 | Mean Difference (IV, Random, 95% CI) | ‐0.06 [‐0.50, 0.37] |
| Outcome or subgroup title | No. of studies | No. of participants | Statistical method | Effect size |
| 1 Family cohesion (Family Environment Scale) ‐ 3 months Show forest plot | 3 | 208 | Mean Difference (IV, Random, 95% CI) | 0.88 [0.23, 1.54] |
| 2 Family conflict (Family Environment Scale) ‐ 3 months Show forest plot | 3 | 208 | Mean Difference (IV, Random, 95% CI) | ‐0.05 [‐0.91, 0.81] |
| 3 Parental care (Parental Bonding Instrument) ‐ 3 months Show forest plot | 3 | 208 | Mean Difference (IV, Random, 95% CI) | 1.68 [‐0.63, 4.00] |
| 4 Parental overprotection (Parental Bonding Instrument) ‐ 3 months Show forest plot | 3 | 208 | Mean Difference (IV, Random, 95% CI) | ‐0.82 [‐4.75, 3.10] |