有剖宫产史妇女足月引产的方法
摘要
研究背景
有剖宫产史的女性子宫破裂的风险增加,对于她们中随后需要引产的女性,目前尚不清楚采用哪种方法更有利于避免不良事件。本综述是对2013年已发表的综述的更新。
研究目的
评估不同的引产方法对有剖宫产史的女性所产生的效益与伤害。
检索策略
我们检索了Cochrane妊娠与分娩试验注册库(Cochrane Pregnancy and Childbirth's Trials Register,截至2016年8月31日)和已检索研究的参考文献目录。
纳入排除标准
随机对照临床试验(randomised controlled trials, RCTs)比较了妊娠晚期宫颈成熟或引产的方法与安慰剂/不处理或其他方法,对既往剖宫产需要在随后的妊娠中进行分娩诱导的妇女的影响。
资料收集与分析
两名综述作者独立评估了研究的纳入和试验质量,提取资料,并对其进行了准确性检查。
主要结果
此次更新的综述纳入八项研究(涉及707名女性和婴儿的资料)。由于研究比较了不同的引产方法,故无法进行meta分析。所有纳入的研究都至少存在一种设计局限性(例如缺乏盲法、样本失访、其他偏倚或报告偏倚)。其中一项研究出于安全考虑提前终止。
阴道前列腺素E2与静脉注射催产素 (一项试验,42名女性):剖宫产(风险比(RR)=0.67, 95%置信区间(CI) [0.22, 2.03],低质量证据)以及严重的新生儿发病率或围产期死亡率(RR=3.00,95% CI [0.13, 69.70],低质量证据)、严重的产妇发病率或死亡率(RR=3.00, 95% CI [0.13, 69.70],低质量证据)均未见明显差异。报告的次要结局也未显示明显组间差异。推荐意见的评估、制定与评价(GRADE)结局未在24小时内实现阴道分娩,且未报告子宫过度收缩伴随胎儿心率变化的情况。
阴道米索前列醇与静脉注射催产素 (一项试验,38名女性):由于一名接受米索前列醇的女性发生子宫破裂(RR=3.67, 95% CI [ 0.16, 84.66]),另一名发生子宫裂开,该试验提前终止。未报告其他结局(包括GRADE结局)。
导尿管与静脉注射催产素 (一项试验,53名女性组成的亚组):24小时内未实现阴道分娩(RR=1.47, 95% CI [0.89, 2.44],低质量证据)、子宫过度收缩伴随胎儿心率变化(RR=3.11, 95% CI [0.13, 73.09],低质量证据)和剖宫产(RR=0.93, 95% CI [0.45, 1.92],低质量证据)的组间未见明显差异。组间报告的次要结局也未见明显差异。未报告以下GRADE结局:严重的新生儿发病率或围产期死亡率,以及严重的产妇发病率或死亡率。
双球囊导管与阴道 PGE2 (一项试验,26名女性组成的亚组):剖宫产未见明显差异(RR=0.97, 95% CI [0.41, 2.32],极低质量证据)。未报告未在24小时内实现阴道分娩、子宫过度收缩引起胎儿心率变化、严重的新生儿发病率或围产期死亡率,以及严重的产妇发病率或死亡率。
口服米非司酮与福雷导尿管 (一项试验,107名女性):未报告主要/GRADE结局。使用米非司酮引产的女性需要辅助增加使用催产素的较少(RR=0.54, 95% CI [0.38, 0.76])。接受米非司酮治疗的女性发生子宫破裂的病例较少,但组间差异不明显(RR=0.29, 95% CI [0.08, 1.02])。未报告其他次要结局。
阴道单硝酸异山梨酯(Vaginal isosorbide mononitrate, IMN)与福雷导管 (一项试验,80名女性):使用IMN诱导的女性在24小时内实现阴道分娩的比例较少(RR=2.62, 95% CI [1.32, 5.21],低质量证据)。在剖宫产女性的数量上,两组间未见差异(RR=1.00, 95% CI [0.39, 2.59],低质量证据)。使用IMN诱导的女性中需要催产素增强的比例较高(RR=1.65, 95% CI [1.17, 2.32])。其他报告的次要结局未见明显差异。未报告以下GRADE结局:子宫过度刺激伴有胎心变化、严重的新生儿发病率或围产期死亡率,以及严重的产妇发病率或死亡率。
80 mL与30 mL福雷导管 (一项试验,154名女性):两组的主要结局未见明显差异:24小时内未实现阴道分娩(RR=1.05, 95% CI [0.91, 1.20],中等质量证据)和剖宫产(RR=1.05, 95% CI [0.89, 1.24],中等质量证据)。然而,使用30ml导尿管诱导的女性中需要催产素增强的比例较高(RR=0.81, 95% CI [0.66, 0.98])。在其他次要结局中,两组之间未见明显差异。未报告一些GRADE结局:子宫过度刺激伴有胎心变化、严重的新生儿发病率或围产期死亡率,以及严重的产妇发病率或死亡率。
阴道PGE2栓剂与阴道PGE2片剂 (一项试验,200名女性):剖宫产组间未见差异(RR=1.09, 95% CI [0.74, 1.60],极低证据质量),其他报告的次要结局方面也未见差异。未报告一些GRADE结局:24小时内未实现阴道分娩、子宫过度刺激伴有胎心变化、严重的新生儿发病率或围产期死亡率,以及严重的产妇发病率或死亡率。
作者结论
有过剖宫产史妇女引产方法的随机对照临床试验证据不足,而且研究不足以发现许多结局的临床相关差异。有几项研究几乎没有报告我们预先设定的结局,且关于婴儿结局的报告尤为稀少。由于不精确性和研究设计的限制,证据质量的GRADE等级为中等至极低。
高质量的、足够有力的随机对照临床试验将是确定有剖宫产史妇女引产最佳方法的最佳途径。然而,由于需要大量的数据来调查不常见但严重的不良结局(如子宫破裂)的风险,这样的试验不太可能进行。观察性研究(队列研究),包括不同的宫颈成熟方法,可能是最佳选择。研究可以与被认为是提供有效引产且严重危害风险低的方法进行比较,并报告本综述中列出的结局。
PICO
简语概要
产程诱导方法作用于有宫产史的女性
研究问题是什么?
引产是一种常见的手术;通常在判断婴儿出生比继续妊娠更为安全时进行引产。当过往有剖宫产史的妇女进行分娩时,目前的临床实践支持帮助她进行阴道分娩。然而,对于以往有剖宫产史的妇女来说,引产导致并发症的风险更高。
诱导方法包括:前列腺素药物(包括口服或阴道前列腺素E2(PGE2)或米索前列醇);米非司酮;机械方法(包括福雷导管和双球囊导管);一氧化氮供体(如单硝酸异山梨酯);以及催产素。本综述研究了有剖宫产史妇女在当前妊娠期是否需要引产,以及不同引产方法的危害和益处。
为什么这很重要?
很多女性都做过剖宫产手术:全世界有四分之一到二分之一的婴儿是通过剖宫产出生的。许多妇女继续再次妊娠,我们想知道如何安全地分娩胎儿。有过剖宫产经历的妇女子宫瘢痕破裂的风险增加;尤其是引产时,这种风险更甚。这是一种严重的并发症,通常会导致产妇和婴儿的负面结局,如子宫切除术、泌尿生殖道损伤、产妇产后输血,以及婴儿的神经损伤甚至死亡。
我们发现了哪些证据?
我们在2016年8月31日检索文献。本次更新的综述纳入了8个小型随机对照临床试验,数据来自707名妇女和婴儿。这些研究比较了不同的引产方法,因此结果无法合并。
所有的试验都存在设计问题:8项试验中有7项试验的妇女和保健专业人员知道正在使用哪种引产方法,这可能会影响临床决策。在一些试验中,妇女被排除在分析之外,而且试验往往未报告重要结局(引产后24小时内未实现阴道分娩、子宫过度刺激伴随婴儿心率改变、剖宫产、婴儿严重疾病或死亡、产妇严重疾病或死亡)。
这些试验规模太小,无法显示出明显差异。因为试验规模较小且偏倚风险较高,所以证据质量极低、低或中等。我们不能确定结果,未来的研究可能会显示不同。
这意味着什么?
从随机对照临床试验中没有得到足够的信息,来为有既往剖宫产史的妇女提供最佳引产方法建议。需要更多高质量的随机对照临床试验来找出哪种方法对产妇和婴儿最好。然而,因为需要大量的受试者来研究不常见但严重的结局(如妇女子宫破裂)的风险,所以这样的试验不太可能进行。其他类型的研究(即非随机对照临床试验)可能是最好的选择。未来的研究可以把重点放在那些被认为是有效且造成严重伤害风险较低的引产方法上。本综述中确定的重要结果可用于未来的研究。
Authors' conclusions
Summary of findings
| Vaginal PGE2 compared with IV oxytocin for term labour induction for women with a previous caesarean section | ||||||
| Patient or population: women with one previous lower segment caesarean section and requiring labour induction due to prolonged pregnancy or pre‐eclampsia, singleton in cephalic presentation, GA ≥ 37 weeks, BS < 9, no cephalopelvic disproportion anticipated | ||||||
| Outcomes | Anticipated absolute effects* (95% CI) | Relative effect | № of participants | Quality of the evidence | Comments | |
| Risk with oxytocin | Risk with prostaglandin E2 | |||||
| Vaginal delivery not achieved within 24 hours | ‐ | ‐ | ‐ | ‐ | ‐ | Not reported |
| Uterine hyperstimulation with fetal heart rate changes | ‐ | ‐ | ‐ | ‐ | ‐ | Not reported |
| Caesarean section | Study population | RR 0.67 | 42 | ⊕⊕⊝⊝ | ||
| 286 per 1000 | 191 per 1000 | |||||
| Serious neonatal morbidity/perinatal death | Study population | RR 3.00 | 42 | ⊕⊕⊝⊝ | ||
| 0 per 1000 | 0 per 1000 | |||||
| Serious maternal morbidity or death | Study population | RR 3.00 | 42 | ⊕⊕⊝⊝ | ||
| 0 per 1000 | 0 per 1000 | |||||
| *The risk in the intervention group (and its 95% confidence interval) is based on the assumed risk in the comparison group and the relative effect of the intervention (and its 95% CI). | ||||||
| GRADE Working Group grades of evidence | ||||||
| 1Wide CI crossing the line of no effect, small sample size, and few events (imprecision, downgraded 2 levels). | ||||||
| Vaginal misoprostol compared with IV oxytocin for term labour induction for women with a previous caesarean section | ||||||
| Patient or population: women with a previous caesarean section | ||||||
| Outcomes | Anticipated absolute effects* (95% CI) | Relative effect | № of participants | Quality of the evidence | Comments | |
| Risk with misoprostol | Risk with oxytocin | |||||
| Vaginal delivery not achieved within 24 hours | not reported | |||||
| Uterine hyperstimulation with fetal heart rate changes | not reported | |||||
| Caesarean section | not reported | |||||
| Serious neonatal morbidity or perinatal death | not reported | |||||
| Serious maternal morbidity or death | not reported | |||||
| *The risk in the intervention group (and its 95% confidence interval) is based on the assumed risk in the comparison group and the relative effect of the intervention (and its 95% CI). | ||||||
| GRADE Working Group grades of evidence | ||||||
| Foley catheter compared with IV oxytocin for term labour induction for women with a previous caesarean section | ||||||
| Patient or population: pregnant women with a previous low transverse caesarean section, singleton live pregnancy with cephalic presentation, period of gestation > 28 weeks and BS < 5 were included in the study, with unfavourable cervix | ||||||
| Outcomes | Anticipated absolute effects* (95% CI) | Relative effect | № of participants | Quality of the evidence | Comments | |
| Risk with oxytocin | Risk with Foley catheter | |||||
| Vaginal delivery not achieved within 24 hours | Study population | RR 1.47 | 53 | ⊕⊕⊝⊝ | ||
| 444 per 1000 | 653 per 1000 | |||||
| Uterine hyperstimulation with fetal heart rate changes | Study population | RR 3.11 | 53 | ⊕⊕⊝⊝ | ||
| 0 per 1000 | 0 per 1000 | |||||
| Caesarean section | Study population | RR 0.93 | 53 | ⊕⊕⊝⊝ | ||
| 370 per 1000 | 344 per 1000 | |||||
| Serious neonatal morbidity or perinatal death | ‐ | ‐ | ‐ | ‐ | ‐ | Not reported |
| Serious maternal morbidity or death | ‐ | ‐ | ‐ | ‐ | ‐ | Not reported |
| *The risk in the intervention group (and its 95% confidence interval) is based on the assumed risk in the comparison group and the relative effect of the intervention (and its 95% CI). | ||||||
| GRADE Working Group grades of evidence | ||||||
| 1Wide confidence interval crossing the line of no effect, small sample size, and few events (imprecision, downgraded 2 levels). | ||||||
| Double‐balloon catheter compared with vaginal PGE2 for term labour induction for women with a previous caesarean section | ||||||
| Patient or population: women with a previous caesarean section (subgroup of all women in the study) with intact fetal membranes, cephalic position and unfavourable cervix, with indications for induction of labour Intervention: double‐balloon catheter inserted through the cervical canal with 80 mL of saline installed stepwise in the uterine balloon and 80 mL saline in the cervicovaginal balloon | ||||||
| Outcomes | Anticipated absolute effects* (95% CI) | Relative effect | № of participants | Quality of the evidence | Comments | |
| Risk with prostaglandin E2 | Risk with double‐balloon catheter | |||||
| Vaginal delivery not achieved within 24 hours | ‐ | ‐ | ‐ | ‐ | ‐ | Not reported |
| Uterine hyperstimulation with fetal heart rate changes | ‐ | ‐ | ‐ | ‐ | ‐ | Not reported |
| Caesarean section | Study population | RR 0.97 | 16 | ⊕⊝⊝⊝ | ||
| 571 per 1000 | 554 per 1000 | |||||
| Serious neonatal morbidity or perinatal death | ‐ | ‐ | ‐ | ‐ | ‐ | Not reported |
| Serious maternal morbidity or death | ‐ | ‐ | ‐ | ‐ | ‐ | Not reported |
| *The risk in the intervention group (and its 95% confidence interval) is based on the assumed risk in the comparison group and the relative effect of the intervention (and its 95% CI). | ||||||
| GRADE Working Group grades of evidence | ||||||
| 1One study with design limitations (risk of bias, downgraded 1 level). | ||||||
| Oral mifepristone compared with Foley catheter for term labour induction for women with a previous caesarean section | ||||||
| Patient or population: pregnant women, 40 weeks' gestation, single cephalic presentation, 1 previous low segment caesarean section | ||||||
| Outcomes | Anticipated absolute effects* (95% CI) | Relative effect | № of participants | Quality of the evidence | Comments | |
| Risk with mifepristone | Risk with Foley catheter | |||||
| Vaginal delivery not achieved within 24 hours | not reported | |||||
| Uterine hyperstimulation with fetal heart rate changes | not reported | |||||
| Caesarean section | not reported | |||||
| Serious neonatal morbidity or perinatal death | not reported | |||||
| Serious maternal morbidity or death | not reported | |||||
| *The risk in the intervention group (and its 95% confidence interval) is based on the assumed risk in the comparison group and the relative effect of the intervention (and its 95% CI). | ||||||
| GRADE Working Group grades of evidence | ||||||
| Vaginal isosorbide mononitrate versus Foley catheter for term labour induction for women with a previous caesarean section | ||||||
| Patient or population: pregnant women with 1 previous lower segment caesarean section at 37 weeks and beyond, with a BS of ≤ 6, intact membranes, reactive non‐stress test, normal umbilical arterial Doppler indices, absence of labour and willingness of women to participate in the study | ||||||
| Outcomes | Anticipated absolute effects* (95% CI) | Relative effect | № of participants | Quality of the evidence | Comments | |
| Risk with Foley catheter | Risk with isosorbide mononitrate | |||||
| Vaginal delivery not achieved within 24 hours | Study population | RR 2.63 | 80 | ⊕⊕⊝⊝ | ||
| 200 per 1000 | 526 per 1000 | |||||
| Uterine hyperstimulation with fetal heart rate changes | ‐ | ‐ | ‐ | ‐ | ‐ | Not reported |
| Caesarean section | Study population | RR 1.00 | 80 | ⊕⊝⊝⊝ | ||
| 175 per 1000 | 175 per 1000 | |||||
| Serious neonatal morbidity or perinatal death | ‐ | ‐ | ‐ | ‐ | ‐ | Not reported |
| Serious maternal morbidity or death | ‐ | ‐ | ‐ | ‐ | ‐ | Not reported |
| *The risk in the intervention group (and its 95% confidence interval) is based on the assumed risk in the comparison group and the relative effect of the intervention (and its 95% CI). | ||||||
| GRADE Working Group grades of evidence | ||||||
| 1 One study with design limitations (risk of bias, downgraded 1 level). | ||||||
| 80 mL Foley catheter versus 30 mL Foley catheter for term labour induction for women with a previous caesarean section | ||||||
| Patient or population: pregnant women who previously had a lower segment CS and now have a singleton cephalic presentation after at least 36 completed weeks, not in labour, with intact membranes and BS of < 6 | ||||||
| Outcomes | Anticipated absolute effects* (95% CI) | Relative effect | № of participants | Quality of the evidence | Comments | |
| Risk with 30 mL Foley catheter | Risk with 80 mL Foley catheter | |||||
| Vaginal delivery not achieved within 24 hours | Study population | RR 1.05 | 154 | ⊕⊕⊕⊝ | ||
| 818 per 1000 | 859 per 1000 | |||||
| Uterine hyperstimulation with fetal heart rate changes | ‐ | ‐ | ‐ | ‐ | ‐ | Not reported |
| Caesarean section | Study population | RR 1.05 | 154 | ⊕⊕⊕⊝ | ||
| 766 per 1000 | 805 per 1000 | |||||
| Serious neonatal morbidity or perinatal death | ‐ | ‐ | ‐ | ‐ | ‐ | Not reported |
| Serious maternal morbidity or death | ‐ | ‐ | ‐ | ‐ | ‐ | Not reported |
| *The risk in the intervention group (and its 95% confidence interval) is based on the assumed risk in the comparison group and the relative effect of the intervention (and its 95% CI). | ||||||
| GRADE Working Group grades of evidence | ||||||
| 1Small sample size (imprecision, downgraded 1 level). | ||||||
| Vaginal PGE2 pessary versus vaginal PGE2 tablet for term labour induction for women with a previous caesarean section | ||||||
| Patient or population: women with a previous caesarean section, a live singleton fetus (37‐42 weeks of gestation) in cephalic presentation and a reactive non‐stress test, BS of ≤ 7 before onset of labour, no spontaneous contractions (< 4 contractions within 20 minutes) | ||||||
| Outcomes | Anticipated absolute effects* (95% CI) | Relative effect | № of participants | Quality of the evidence | Comments | |
| Risk with dinoprostone tablet | Risk with dinoprostone pessary | |||||
| Vaginal delivery not achieved within 24 hours | ‐ | ‐ | ‐ | ‐ | ‐ | Not reported |
| Uterine hyperstimulation with fetal heart rate changes | ‐ | ‐ | ‐ | ‐ | ‐ | Not reported |
| Caesarean section | Study population | RR 1.09 | 200 | ⊕⊝⊝⊝ | ||
| 330 per 1000 | 360 per 1000 | |||||
| Serious neonatal morbidity or perinatal death | ‐ | ‐ | ‐ | ‐ | ‐ | Not reported |
| Serious maternal morbidity or death | ‐ | ‐ | ‐ | ‐ | ‐ | Not reported |
| *The risk in the intervention group (and its 95% confidence interval) is based on the assumed risk in the comparison group and the relative effect of the intervention (and its 95% CI). | ||||||
| GRADE Working Group grades of evidence | ||||||
| 1One study with design limitations (risk of bias, downgraded 1 level). | ||||||
Background
This review is an update of a review first published in 2013 (Jozwiak 2013).
Description of the condition
Worldwide, caesarean birth is common. In Australia in 2007, almost 31% of women gave birth by caesarean section (Laws 2009), with similar figures reported from the USA (Martin 2009). While the overall rate of caesarean section is lower in the UK, accounting for approximately 25% of all births (NHS 2009), rates of almost 50% have been reported in some private hospitals in Argentina, Brazil and Chile (Belizan 1999). Women who have had a prior caesarean birth are at increased risk of complications during a subsequent labour, including risk of uterine rupture, presenting unique circumstances related to the mode of birth in a subsequent pregnancy. The particular benefits and harms associated with both elective repeat caesarean section and vaginal birth after caesarean section are discussed in the Cochrane Review 'Planned elective repeat caesarean section versus planned vaginal birth for women with a previous caesarean section' (Dodd 2004). Current clinical practice guidelines support vaginal birth and trial of labour among women who have had a prior caesarean birth (ACOG 2006; RCOG 2008).
Induction of labour is a common obstetric intervention, with between 20% and 30% of births reported to occur following induction of labour (Laws 2009; Martin 2009; Peristat 2008). The percentage of women requiring induction of labour after a previous caesarean birth is thought to be similar to that of other pregnant women (Locatelli 2004). For women who have had a previous caesarean birth and who require induction of labour in a subsequent pregnancy, it is unclear whether labour should be induced, or if birth should occur by repeat elective caesarean section. This question is considered in more detail in the Cochrane Review 'Elective repeat caesarean section versus induction of labour for women with a previous caesarean birth' (Dodd 2006).
An uncommon, but potentially life‐threatening complication for both the woman and her infant associated with vaginal birth, is that of uterine scar rupture (where the previous caesarean scar breaks down). Uterine scar rupture is associated with a significant risk of maternal morbidity, such as hysterectomy, genitourinary tract injury, postpartum blood transfusions, and maternal death (Chuahan 2003; Zwart 2008). Increased infant morbidity and perinatal death have been reported (Chuahan 2003). Although there is variation in findings in different studies, in women who have had previous caesarean birth, uterine rupture is reported to occur in about 8 in 1000 births with spontaneous labour, however, this risk is thought to be almost doubled when labour is induced (NIH consensus 2010).
The focus of this current systematic review is to address the method of induction of labour, should it be required, in women who have had a previous caesarean section. The review draws on the methodology of the Cochrane generic protocol related to methods of induction of labour (Hofmeyr 2009).
Description of the intervention
Induction of labour is carried out when the risks of continuing the pregnancy outweigh the benefits. Common indications for labour induction include post‐term pregnancy, prelabour rupture of membranes, intrauterine growth restriction of the fetus, maternal hypertensive disorders, and other maternal conditions. Many different methods are available for labour induction, including pharmacological methods (mainly prostaglandin analogues and oxytocin), and mechanical methods, such as Foley catheters.
How the intervention might work
Prospective and retrospective cohort studies have shown an increased risk of uterine rupture in women who have had a prior caesarean birth following induction of labour, especially when prostaglandin preparations are used for cervical ripening (Landon 2004; Lydon‐Rochelle 2001; Smith 2004). The risk of uterine rupture following mechanical dilation for ripening of the cervix is reported to be lower than with prostaglandins (Bujold 2004; Landon 2004; Ravasia 2000), approximating the risk after spontaneous onset of labour.
The observed increase in risk of uterine rupture following prostaglandin administration may reflect changes that are induced in the connective tissue of the uterine scar, thereby, weakening it. Equally, it could be reflective of the woman’s cervix being ‘unfavourable’ for labour (Bujold 2004; Kayani 2005), which in turn has been recognised to be associated with adverse maternal and infant outcomes following the trial of labour (Landon 2005).
The use of oxytocin to induce labour in women who have had a prior caesarean birth is also associated with an increased risk of uterine rupture (36/10,000 women without the use of oxytocin compared with 87/10,000 women following oxytocin use) (Landon 2005).
Clinical practice guidelines vary worldwide in relation to induction of labour for women who have had a previous caesarean section. The Society of Obstetricians and Gynaecologists of Canada clinical practice guidelines state that prostaglandins E2 (PGE2) should only be used in exceptional circumstances, and after appropriate counselling on the risk of uterine rupture, recommending that a Foley catheter be used in these women (SOGC 2005). The UK National Institute for Clinical Excellence (NICE) guidelines do not make any explicit recommendations, but do not discourage the use of prostaglandin (RCOG 2008). In contrast, practice guidelines issued by the American College of Obstetricians and Gynaecologists state that the use of prostaglandins for cervical ripening or induction of labour in most women who have had a previous caesarean section should be discouraged (ACOG 2006).
Why it is important to do this review
Cohort studies suggest that for women who have had a previous caesarean birth and require induction of labour in a subsequent pregnancy, there are potential benefits and harms associated with the induction of labour. These benefits and harms may vary considerably with the method used to induce labour.
Objectives
To assess the benefits and harms associated with different methods used to induce labour in women who have had a previous caesarean birth and require induction of labour in a subsequent pregnancy.
Methods
Criteria for considering studies for this review
Types of studies
All randomised controlled trials (with reported data for women and infants) comparing any method of term cervical ripening or labour induction, with placebo/no treatment or other methods, not including the comparison of induction of labour versus expectant management. Quasi‐randomised controlled trials, cluster‐randomised trials, and those presented only as an abstract were eligible for inclusion. Cross‐over trials are not relevant to this intervention and were not eligible for inclusion.
Types of participants
Pregnant women with a live fetus, who have had a previous caesarean section, requiring induction of labour in the third trimester of pregnancy.
Types of interventions
All methods of cervical ripening or labour induction including: prostaglandin medication (including oral or vaginal PGE2 and misoprostol); mifepristone; mechanical methods (including Foley catheters and double‐balloon catheters); oxytocin, or placebo compared with placebo or any other method were included.
Types of outcome measures
Clinically relevant outcomes for trials of methods of cervical ripening/labour induction have been prespecified and published in the Cochrane generic protocol relating to induction of labour (Hofmeyr 2009).
Primary outcomes
1. Vaginal delivery not achieved within 24 hours (or period specified by trial authors)
2. Uterine hyperstimulation with fetal heart rate (FHR) changes
3. Caesarean section
4. Serious neonatal morbidity or perinatal death (e.g. seizures, birth asphyxia defined by trialists, neonatal encephalopathy, disability in childhood)
5. Serious maternal morbidity or death (e.g. uterine rupture, admission to intensive care unit, septicaemia)
Secondary outcomes
Measures of effectiveness
6. Cervix unfavourable/unchanged after 12 to 24 hours
7. Oxytocin augmentation
Complications
8. Uterine hyperstimulation without FHR changes
9. Uterine rupture
10. Epidural analgesia
11. Instrumental vaginal delivery
12. Meconium‐stained liquor
13. Apgar score less than 7 at five minutes
14. Neonatal intensive care unit admission
15. Neonatal encephalopathy
16. Perinatal death
17. Disability in childhood
18. Neonatal infection
19. Neonatal antibiotics
20. Maternal side‐effects (all)
21. Maternal nausea
22. Maternal vomiting
23. Maternal diarrhoea
24. Other maternal side‐effects
25. Postpartum haemorrhage
26. Chorioamnionitis
27. Endometritis
28. Maternal antibiotics
29. Serious maternal complications (e.g. intensive care unit admission, septicaemia but excluding uterine rupture)
30. Maternal death
Measures of satisfaction
31. Woman not satisfied
32. Caregiver not satisfied
'Uterine rupture' includes all clinically significant ruptures of unscarred or scarred uteri. Trivial scar dehiscence noted incidentally at the time of surgery was excluded.
In the reviews, we use the term 'uterine hyperstimulation without FHR changes' to include uterine tachysystole (more than five contractions per 10 minutes for at least 20 minutes) and uterine hypersystole/hypertonus (a contraction lasting at least two minutes) and 'uterine hyperstimulation with FHR changes' to denote uterine hyperstimulation syndrome (tachysystole or hypersystole with FHR changes such as persistent decelerations, tachycardia or decreased short‐term variability).
Outcomes are included in the analysis if data are available according to treatment allocation and reasonable measures were taken to minimise observer bias. While all the above outcomes were sought, only outcomes with available data appear in the analysis tables. Data not pre‐stated were extracted and reported as not pre‐specified.
Search methods for identification of studies
The following methods section of this review is based on a standard template used by Cochrane Pregnancy and Childbirth.
Electronic searches
We searched Cochrane Pregnancy and Childbirth’s Trials Register by contacting their Information Specialist (31 August 2016).
The Register is a database containing over 23,000 reports of controlled trials in the field of pregnancy and childbirth. For full search methods used to populate Pregnancy and Childbirth’s Trials Register including the detailed search strategies for CENTRAL, MEDLINE, Embase and CINAHL; the list of handsearched journals and conference proceedings, and the list of journals reviewed via the current awareness service, please follow this link to the editorial information about the Cochrane Pregnancy and Childbirth in the Cochrane Library and select the ‘Specialized Register ’ section from the options on the left side of the screen.
Briefly, Cochrane Pregnancy and Childbirth’s Trials Register is maintained by their Information Specialist and contains trials identified from:
-
monthly searches of the Cochrane Central Register of Controlled Trials (CENTRAL);
-
weekly searches of MEDLINE (Ovid);
-
weekly searches of Embase (Ovid);
-
monthly searches of CINAHL (EBSCO);
-
handsearches of 30 journals and the proceedings of major conferences;
-
weekly current awareness alerts for a further 44 journals plus monthly BioMed Central email alerts.
Search results are screened by two people and the full text of all relevant trial reports identified through the searching activities described above is reviewed. Based on the intervention described, each trial report is assigned a number that corresponds to a specific Pregnancy and Childbirth review topic (or topics), and is then added to the Register. The Information Specialist searches the Register for each review using this topic number rather than keywords. This results in a more specific search set which has been fully accounted for in the relevant review sections (Included studies; Excluded studies; Ongoing studies).
Searching other resources
We searched the reference lists of retrieved studies.
We did not apply any language or date restrictions.
Data collection and analysis
For methods used in the previous version of this review, see Jozwiak 2013.
For this update, we used the following methods for assessing the 12 reports that were identified as a result of the updated search.
The following methods section of this review is based on a standard template used by Cochrane Pregnancy and Childbirth.
Selection of studies
Two review authors independently assessed for inclusion all the potential studies identified as a result of the search strategy. We resolved any disagreement through discussion or, if required, we consulted the third review author.
Data extraction and management
We designed a form to extract data. For eligible studies, two review authors extracted the data using the agreed form. We resolved discrepancies through discussion or, if required, we consulted the third review author. Data were entered into Review Manager 5 (RevMan 5) software (RevMan 2014) and checked for accuracy.
When information regarding any of the above was unclear, we planned to contact authors of the original reports to provide further details.
Assessment of risk of bias in included studies
Two review authors independently assessed risk of bias for each study using the criteria outlined in the Cochrane Handbook for Systematic Reviews of Interventions (Higgins 2011a). Any disagreement was resolved by discussion or by involving a third assessor.
1. Random sequence generation (checking for possible selection bias)
We described for each included study the method used to generate the allocation sequence in sufficient detail to allow an assessment of whether it should produce comparable groups.
We assessed the method as:
-
low risk of bias (any truly random process, e.g. random number table; computer random‐number generator);
-
high risk of bias (any non‐random process, e.g. odd or even date of birth; hospital or clinic record number);
-
unclear risk of bias.
2. Allocation concealment (checking for possible selection bias)
We described for each included study the method used to conceal allocation to interventions prior to assignment and assessed whether intervention allocation could have been foreseen in advance of, or during recruitment, or changed after assignment.
We assessed the methods as:
-
low risk of bias (e.g. telephone or central randomisation; consecutively‐numbered, sealed, opaque envelopes);
-
high risk of bias (open random allocation; unsealed or non‐opaque envelopes, alternation; date of birth);
-
unclear risk of bias.
3.1. Blinding of participants and personnel (checking for possible performance bias)
We described for each included study the methods used, if any, to blind study participants and personnel from knowledge of which intervention a participant received. We considered that studies were at low risk of bias if they were blinded, or if we judged that the lack of blinding unlikely to affect results. We assessed blinding separately for different outcomes or classes of outcomes.
We assessed the methods as:
-
low, high or unclear risk of bias for participants;
-
low, high or unclear risk of bias for personnel.
3.2. Blinding of outcome assessment (checking for possible detection bias)
We described for each included study the methods used, if any, to blind outcome assessors from knowledge of which intervention a participant received. We assessed blinding separately for different outcomes or classes of outcomes.
We assessed methods used to blind outcome assessment as:
-
low, high or unclear risk of bias.
4. Incomplete outcome data (checking for possible attrition bias due to the amount, nature and handling of incomplete outcome data)
We described for each included study, and for each outcome or class of outcomes, the completeness of data including attrition and exclusions from the analysis. We stated whether attrition and exclusions were reported and the numbers included in the analysis at each stage (compared with the total randomised participants), reasons for attrition or exclusion where reported, and whether missing data were balanced across groups or were related to outcomes. Where sufficient information was reported, or could be supplied by the trial authors, we planned to re‐include missing data in the analyses that we undertook.
We assessed methods as:
-
low risk of bias (e.g. no missing outcome data; missing outcome data balanced across groups);
-
high risk of bias (e.g. numbers or reasons for missing data imbalanced across groups; ‘as‐treated’ analysis done with substantial departure of intervention received from that assigned at randomisation);
-
unclear risk of bias.
5. Selective reporting (checking for reporting bias)
We described for each included study how we investigated the possibility of selective outcome reporting bias and what we found.
We assessed the methods as:
-
low risk of bias (where it is clear that all of the study’s pre‐specified outcomes and all expected outcomes of interest to the review have been reported);
-
high risk of bias (where not all the study’s pre‐specified outcomes have been reported; one or more reported primary outcomes were not pre‐specified; outcomes of interest are reported incompletely and so cannot be used; study fails to include results of a key outcome that would have been expected to have been reported);
-
unclear risk of bias.
6. Other bias (checking for bias due to problems not covered by (1) to (5) above)
We described for each included study any important concerns we had about other possible sources of bias.
7. Overall risk of bias
We made explicit judgements about whether studies were at high risk of bias, according to the criteria given in the Cochrane Handbook for Systematic Reviews of interventions (Higgins 2011a). With reference to (1) to (6) above, we planned to assess the likely magnitude and direction of the bias and whether we considered it was likely to impact on the findings. In future updates, we will explore the impact of the level of bias through undertaking sensitivity analyses ‐ see Sensitivity analysis.
Assessing the quality of the evidence using GRADE
For this update we have assessed the quality of the evidence using the GRADE approach as outlined in the GRADE handbook in order to assess the quality of the body of evidence relating to the following outcomes for the main comparisons.
-
Vaginal delivery not achieved within 24 hours (or period specified by trial authors)
-
Uterine hyperstimulation with fetal heart rate changes
-
Caesarean section
-
Serious neonatal morbidity or perinatal death (e.g. seizures, birth asphyxia defined by trialists, neonatal encephalopathy, disability in childhood)
-
Serious maternal morbidity or death (e.g. uterine rupture, admission to intensive care unit, septicaemia)
We used GRADEpro Guideline Development Tool (GRADEpro GDT) to import data from RevMan 5 (RevMan 2014) in order to create 'Summary of findings' tables. We produced a summary of the intervention effect and a measure of quality for each of the above outcomes using the GRADE approach. The GRADE approach uses five considerations (study limitations, consistency of effect, imprecision, indirectness and publication bias) to assess the quality of the body of evidence for each outcome. The evidence can be downgraded from 'high quality' by one level for serious (or by two levels for very serious) limitations, depending on assessments for risk of bias, indirectness of evidence, serious inconsistency, imprecision of effect estimates or potential publication bias.
Measures of treatment effect
Dichotomous data
For dichotomous data, we presented results as summary risk ratio with 95% confidence intervals.
Continuous data
We used the mean difference if outcomes were measured in the same way between trials. We used the standardised mean difference to combine trials that measured the same outcome, but used different methods.
Unit of analysis issues
Cluster‐randomised trials
Our searches did not identify any cluster‐randomised trials for inclusion in the analyses. In future updates, if we identify any cluster‐randomised controlled trials we will include them in our analyses along with the individually randomised trials. We will adjust their sample sizes using the methods described in the Cochrane Handbook for Systematic Reviews of Interventions (Higgins 2011b) using an estimate of the intracluster correlation co‐efficient (ICC) derived from the trial (if possible), from a similar trial or from a study of a similar population. If we use ICCs from other sources, we will report this and conduct sensitivity analyses to investigate the effect of variation in the ICC. We will consider it reasonable to combine the results from both if there is little heterogeneity between the study designs and the interaction between the effect of intervention and the choice of randomisation unit is considered to be unlikely.
Cross‐over trials
Cross‐over trials are inappropriate for this intervention.
Multi‐armed trials
We identified one multi‐arm trial, however only two arms were reported in the study publication. We contacted the trial authors to request data on the other arms but did not receive a reply. If we had received these data, we would have combined all relevant experimental intervention groups of the study into a single group and all relevant control intervention groups into a single control group when we analysed the data. If we had considered one of the arms irrelevant, we would have excluded it from analysis.
Dealing with missing data
For included studies, we noted levels of attrition. In future updates, if we include more eligible studies, we will explore the impact of including studies with high levels of missing data in the overall assessment of treatment effect using sensitivity analysis.
For all outcomes, we carried out analyses, as far as possible, on an intention‐to‐treat basis, that is, we attempted to include all participants randomised to each group in the analyses. The denominator for each outcome in each trial was the number randomised minus any participants whose outcomes were known to be missing.
Assessment of heterogeneity
We did not combine data from the included studies. In future updates we will assess statistical heterogeneity in each meta‐analysis using the Tau², I² (Higgins 2003) and Chi² statistics (Deeks 2011). We will regard heterogeneity as substantial if I² is greater than 30% and either Tau² is greater than zero, or there is a low P value (less than 0.10) in the Chi² test for heterogeneity. If we identify substantial heterogeneity (above 30%), we will explore it by pre‐specified subgroup analysis.
Assessment of reporting biases
In future updates, if there are 10 or more studies in the meta‐analysis we will investigate reporting biases (such as publication bias) using funnel plots. We will assess funnel plot asymmetry visually. If asymmetry is suggested by a visual assessment, we will perform exploratory analyses to investigate it.
Data synthesis
Meta‐analysis was not possible because the studies compared different methods of labour induction. In future updates we will carry out statistical analysis using RevMan 5 software (RevMan 2014). We will use fixed‐effect meta‐analysis for combining data where it was reasonable to assume that studies were estimating the same underlying treatment effect: that is, where trials were examining the same intervention, and the trials’ populations and methods were judged sufficiently similar.
If there is clinical heterogeneity sufficient to expect that the underlying treatment effects differed between trials, or if substantial statistical heterogeneity is detected, we will use random‐effects meta‐analysis to produce an overall summary if an average treatment effect across trials is considered clinically meaningful. The random‐effects summary will be treated as the average range of possible treatment effects and we will discuss the clinical implications of treatment effects differing between trials. If the average treatment effect is not clinically meaningful, we will not combine trials. If we use random‐effects analyses, we will present the results as the average treatment effect with 95% confidence intervals, and the estimates of Tau² and I².
Subgroup analysis and investigation of heterogeneity
In future updates, if we identify substantial heterogeneity, we will investigate it using subgroup analyses and sensitivity analyses. We will considered whether an overall summary is meaningful, and if it is, we will use a random‐effects analysis to produce it.
We plan to carry out the following subgroup analyses:
-
previous vaginal birth (yes versus no);
-
number of previous caesarean births (one versus two versus three or more);
-
indication for previous caesarean birth(s) (failure to progress versus fetal distress versus other);
-
indication for labour induction (hypertensive disorders versus post‐term pregnancy versus intrauterine growth restriction versus maternal disease versus other indication);
-
favourability of the cervix (favourable versus unfavourable);
-
status of membranes (ruptured versus unruptured);
-
gestational age (37 to 40 weeks versus 40 to 41 weeks versus more than 41 weeks).
We will restrict planned subgroup analysis to the primary outcomes.
We will assess subgroup differences by interaction tests available within RevMan 5 (RevMan 2014). We will report the results of subgroup analyses quoting the Chi² statistic and P value, and the interaction test I² value.
Sensitivity analysis
In future updates, we will carry out sensitivity analyses, where appropriate, to explore the effect of trial quality assessed by concealment of allocation, high attrition rates, or both, with poor‐quality studies being excluded from the analyses in order to assess whether this makes any difference to the overall result.
Results
Description of studies
Results of the search
The updated search of Cochrane Pregnancy and Childbirth's Trials Register retrieved 12 reports (see Figure 1). We included six new studies (10 reports) (Hassan 2014; Lokkegaard 2015; Manish 2016; Meetei 2015; Rezk 2014; Sharma 2015). One new study was excluded (Ramya 2015) and one study is ongoing (NCT02196103).
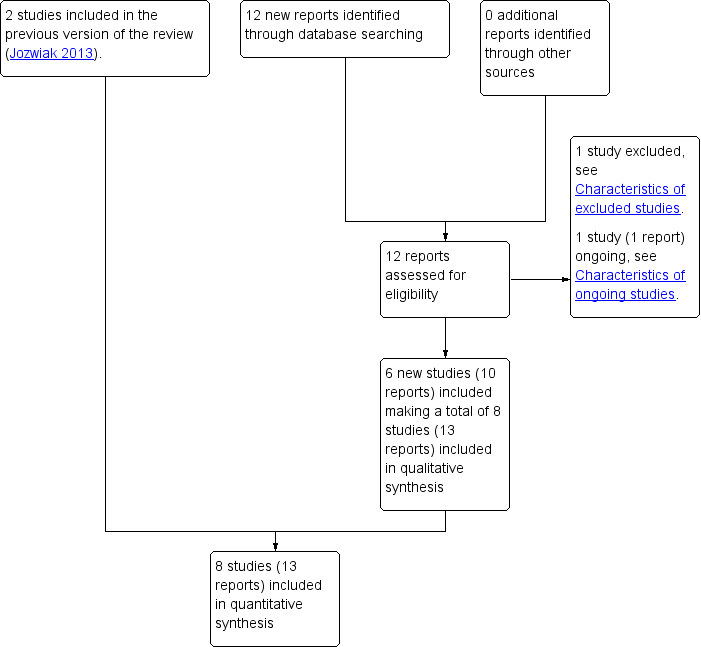
Study flow diagram
Included studies
See Characteristics of included studies.
Altogether we included eight studies in the review (Hassan 2014; Lokkegaard 2015; Manish 2016; Meetei 2015; Rezk 2014; Sharma 2015; Taylor 1993; Wing 1998). A subset of the women who participated in Lokkegaard 2015 had a prior caesarean section, and it was only this subset of results that we included in our review. Only data for women who were 37 weeks' gestation or more in Meetei 2015 were included in this review (unpublished data supplied by the trial author).
Design
Seven of the included studies were two‐arm randomised controlled trials (Hassan 2014; Lokkegaard 2015; Manish 2016; Meetei 2015; Rezk 2014; Taylor 1993; Wing 1998), one was a four‐arm randomised controlled trial however only two arms were reported in the publications (Sharma 2015). Trials compared different methods of labour induction.
Sample sizes
The studies range in size from 26 women (Lokkegaard 2015) to 200 women (Hassan 2014). The total number of women contributing data to the review is 707.
Setting
Three studies took place in India (Manish 2016; Meetei 2015; Sharma 2015), one in Saudi Arabia (Hassan 2014), one in Denmark (Lokkegaard 2015), one in Egypt (Rezk 2014), one in the UK (Taylor 1993), and one in the USA (Wing 1998).
Participants
All participants were women with a prior caesarean section. In Lokkegaard 2015 this was a subgroup within a trial of all women undergoing induction.
All studies looked at induction at term, or approaching term. The gestational age at which women were eligible varied: in Sharma 2015 women were 40 weeks' gestation, in Manish 2016, Rezk 2014 and Taylor 1993 they were at least 37 weeks gestational age, and in Hassan 2014 they were 37 to 42 weeks' gestation. The inclusion criteria in Meetei 2015 is from 28 weeks gestational age. The gestational age of women who took part is not reported, although it states that the majority of women were between 38 and 40 weeks. In personal communication, the trial author reported that 26 out of 30 women in the Foley catheter group, and 27 out of 30 in the oxytocin group were 37 weeks' gestation or more, and provided data for this subgroup of women. Lokkegaard 2015 does not state a specific gestational age among the inclusion criteria. In the whole study the earliest gestational age was 32 + 5, however this information is not given in the published report for the subgroup of women with a prior caesarean. In personal communication, the trial author reported that all women with a prior caesarean were 37 weeks' gestation or more. The gestational age for included women is not stated in Wing 1998.
The indications for induction of labour varied between studies. Taylor 1993 included only women with post‐term pregnancy or pre‐eclampsia. Sharma 2015 included only women with a post‐term pregnancy (defined by the trialists as from 40 weeks five days). Hassan 2014, Lokkegaard 2015, Manish 2016, Meetei 2015, Rezk 2014 and Wing 1998 used broad criteria for induction, including post‐term pregnancy, pre‐eclampsia or hypertension, gestational diabetes mellitus, oligohydramnios and intrauterine growth restriction.
Seven studies specified cephalic presentation in the inclusion criteria (Hassan 2014; Lokkegaard 2015; Manish 2016; Meetei 2015; Sharma 2015; Taylor 1993; Wing 1998). Seven studies included only women with a singleton pregnancy (Hassan 2014; Manish 2016; Meetei 2015; Rezk 2014; Sharma 2015; Taylor 1993; Wing 1998). Lokkegaard 2015 did not exclude multiple pregnancies, however there were none in the subgroup of women with a previous caesarean section. Six studies specified that women could participate if they had had a previous low transverse or lower segment caesarean section (Hassan 2014; Manish 2016; Meetei 2015; Rezk 2014; Sharma 2015; Taylor 1993). Wing 1998 included women with one prior caesarean, but found that verifying the type of incision was "often impossible in our population", and Lokkegaard 2015 did not report on the number or nature of prior caesarean(s).
Hassan 2014, Lokkegaard 2015, Manish 2016 and Rezk 2014 specified in their inclusion criteria that membranes had to be unruptured, as did the previous trial cited by Wing 1998 as having similar inclusion and exclusion criteria to this study (Wing 1996). Meetei 2015 and Sharma 2015 excluded women with premature rupture of membranes from their studies, and Taylor 1993 did not describe the status of membranes for women to be included in the trial.
The inclusion criteria of studies specified Bishop scores of less than or equal to seven (Hassan 2014), less than or equal to six (Rezk 2014), less than six (Lokkegaard 2015; Manish 2016), less than five (Meetei 2015), less than or equal to four (Wing 1998), and modified Bishop score less than nine (Taylor 1993). Sharma 2015 did not specify.
No information was reported on the indication for the previous caesarean section, or whether women had had a previous vaginal birth, in Lokkegaard 2015, Manish 2016, Meetei 2015, Rezk 2014 and Sharma 2015. In Taylor 1993, women whose only previous pregnancy was delivered by caesarean section were included, so no women had had a prior vaginal birth. The indications for previous caesarean sections are listed in a table in the report. Wing 1998 required that women had not had a vaginal birth since their caesarean section. Some women in Manish 2016 had had more than one previous pregnancy (seven out of 70 in the 30 mL group, four out of 70 in the 80 mL group), however it does not report whether these previous births were caesarean or vaginal deliveries. Hassan 2014 reports that 56 out of 100 women in the tablet group and 62 out of 100 women in the pessary group had had a prior vaginal delivery, in addition to their previous caesarean section.
Interventions
Three studies made a comparison with oxytocin: vaginal PGE2 (Taylor 1993), vaginal misoprostol (Wing 1998), and Foley catheter (Meetei 2015). Two additional studies made a comparison with Foley catheter: oral mifepristone (Sharma 2015), and vaginal isosorbide mononitrate (Rezk 2014). One study compared double‐balloon catheter with vaginal PGE2 (Lokkegaard 2015), one compared 30 mL Foley catheter with 80 mL Foley catheter (Manish 2016), and one compared vaginal PGE2 tablet with vaginal PGE2 pessary (Hassan 2014).
The dose of intravenous oxytocin was started at 1 mU/minute and increased if contractions were not frequent after one hour in Meetei 2015, "per a standardized infusion protocol" in Wing 1998, and in Taylor 1993, the dose was not reported. Amniotomy was done at the start of oxytocin administration Taylor 1993 and Wing 1998, but is not reported in Meetei 2015. PGE2 was administered as a 2.5 mg vaginal pessary (Taylor 1993), or 3 mg vaginal tablet (Lokkegaard 2015). The dose of misoprostol was 25 μg intravaginally every six hours to a maximum of four doses (Wing 1998). The Foley catheter balloon was inserted to the endocervix and inflated with 30 mL of sterile saline (Meetei 2015; Sharma 2015) or inserted into the cervix beyond the internal os and inflated with 80 mL or 30 mL of sterile water (Manish 2016) or 50 mL to 60 mL of normal saline (Rezk 2014). The double‐balloon catheter was inflated with 80 mL of saline in the uterine balloon and 80 mL of saline in the cervicovaginal balloon (Lokkegaard 2015). Women received a dose of 400 mg mifepristone orally (Sharma 2015). Women received either 1.5 mg PGE2 (dinoprostone) vaginal tablet into the posterior vaginal fornix for a maximum of three doses with six‐hourly intervals, or a single dose of PGE2 (dinoprostone) 10 mg sustained‐release vaginal pessary into the posterior vaginal fornix (Hassan 2014).
Outcomes
Three studies reported very few of our prespecified outcomes or did not report them in a form that could be included in the review (Lokkegaard 2015; Sharma 2015; Wing 1998). Perinatal outcomes were especially scarce. Wing 1998 reported only uterine rupture, and Sharma 2015 reported oxytocin augmentation and uterine rupture. Caesarean section and neonatal unit admission were the only prespecified outcomes reported for the subgroup of women with a previous caesarean in Lokkegaard 2015.
Five studies reported more of our prespecified outcomes (Hassan 2014; Manish 2016; Meetei 2015; Rezk 2014; Taylor 1993), including the primary outcomes: any delivery not achieved within 24 hours (Manish 2016; Meetei 2015; Rezk 2014), uterine hyperstimulation with FHR changes (Meetei 2015), caesarean section (Hassan 2014; Manish 2016; Meetei 2015; Rezk 2014; Taylor 1993), serious neonatal morbidity or perinatal death (Taylor 1993), and serious maternal morbidity or death (Taylor 1993). In several studies (e.g. Hassan 2014; Manish 2016; Rezk 2014) the composite outcomes were not reported, but individual elements of them were, for example, perinatal death, uterine rupture, and maternal admission to intensive care unit.
Excluded studies
See Characteristics of excluded studies.
We excluded nine studies (Arraztoa 1994; Ben‐Aroya 2001; Hamdan 2009; Lelaidier 1994; Morales 1986; Ramya 2015; Rayburn 1999; Sciscione 2001; Spallicci 2007).
The studies by Arraztoa 1994, Morales 1986 and Rayburn 1999 compared a pharmacological method of induction of labour with ongoing expectant management of the pregnancy. The Ben‐Aroya 2001 study did not involve a randomised comparison, while Hamdan 2009 and Ramya 2015 compared weekly membrane sweeping with weekly vaginal examination, in women who did not require induction of labour.
The Lelaidier 1994 study compared mifepristone with placebo as a pre‐induction agent, followed by vaginal prostaglandin induction in all women after an observation period of four days. Spallicci 2007 compared hyaluronidase with placebo in women with a prior caesarean birth at term, who did not require induction of labour. Sciscione 2001 compared transcervical Foley catheter with misoprostol to induce labour in women with a prior caesarean birth. However, the trial inclusion criteria were modified to exclude women with a prior caesarean birth, following the occurrence of a uterine rupture in the misoprostol group.
Risk of bias in included studies
Assessment of the methodological quality of the included studies was based on risk of bias in relation to selection bias (method of randomisation and allocation concealment), performance bias, detection bias, attrition bias (loss of participants from the analyses) and reporting bias. Summaries of 'Risk of bias' assessments for each study, and for included trials overall, are set out in Figure 2 and Figure 3.
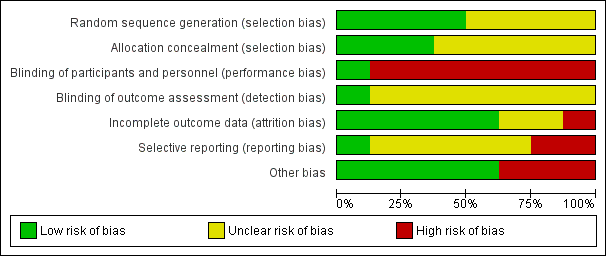
Risk of bias graph: review authors' judgements about each risk of bias item presented as percentages across all included studies
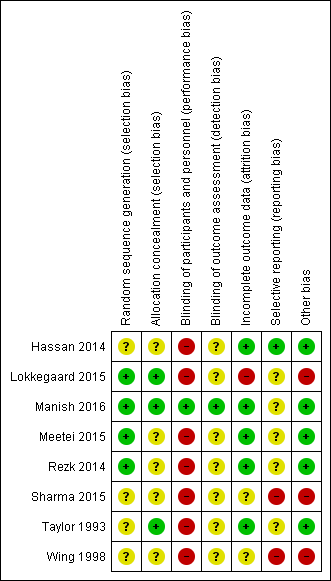
Risk of bias summary: review authors' judgements about each risk of bias item for each included study
Allocation (selection bias)
Generation of the randomisation sequence
Three studies reported using a computer‐generated random sequence (Lokkegaard 2015; Manish 2016; Rezk 2014) and one used Tippets random number table (Meetei 2015), which we judged were at low risk of bias. The method of generating the randomisation sequence was not described in two studies (Hassan 2014; Wing 1998), which we judged to be unclear risk of bias. Sharma 2015 reported an intention to use computer‐generated randomisation in the study protocol, but this was not reported in the study report. We contacted the study author to clarify the method, but no response has been received, so their method was judged to be unclear risk of bias. Taylor 1993 described using "predetermined code envelope" which we also judged to be at unclear risk of bias.
Allocation concealment
In three of the studies, the method for concealing group allocation at the point of randomisation was at low risk of bias: randomised by a central telephone automatic voice‐response system (Lokkegaard 2015), and sealed, opaque envelopes (Manish 2016; Taylor 1993). The method for concealing group allocation was not described in Hassan 2014, Meetei 2015, Rezk 2014 or Wing 1998, which we judged to be at unclear risk of bias. Sharma 2015 reported an intention to use "sequentially numbered, sealed, opaque envelopes" in the study protocol, but this was not described in the study report, and enquiries to clarify the method were not answered, so we decided it was at unclear risk of bias.
Blinding (performance bias and detection bias)
Manish 2016 is the only study that reported any attempt to blind women or health professionals to group allocation. In this study, the decision to perform caesarean section was left to the discretion of an obstetrician who was unaware of group allocation. Women were unlikely to be aware of how much sterile water was in the Foley catheter, despite the personnel responsible for inserting and removing the catheter knowing. Therefore blinding was not perfect, but the bias was minimised and we judged it to be low risk of bias.
No other studies were blinded (Hassan 2014; Lokkegaard 2015; Meetei 2015; Rezk 2014; Sharma 2015; Taylor 1993; Wing 1998). It was not feasible to blind women or health professionals to most of these comparisons. This may have had an effect on other treatment decisions. All included studies have consequently been assessed as high risk of bias due to lack of blinding. It might have been possible to blind outcome assessors, but this was not described in any studies, so they were all judged to be at unclear risk of bias.
Incomplete outcome data (attrition bias)
Five studies were judged to be at low risk of attrition bias. All women appear to be accounted for and there is no mention of women dropping out of the study in Hassan 2014, Manish 2016, Meetei 2015, Rezk 2014 and Taylor 1993.
Two studies had unclear risk of attrition bias. In Sharma 2015, all women recruited appear to be accounted for in the results. However, the omission of two arms of the study may suggest bias. There is insufficient information in Wing 1998 to judge whether all women were accounted for.
One study was at high risk of bias. Women in Lokkegaard 2015 who went into spontaneous labour before induction, who were not in labour after 48 hours, or who had been coded as "VBAC" (vaginal birth after caesarean section) in error were classed as ‘failure’ and excluded from the results. There were 13 women randomised to each group, however results for only 10 are reported in the publication, and in correspondence from the study author additional 'failures' were identified. In the Minprostin group, two women began labour before induction, three were not in labour after 48 hours, and one was wrongly coded as VBAC. In the balloon group, three began labour before induction, one was not VBAC and 0 were not in labour after 48 hours. Unfortunately, despite additional information from the study authors, there were still missing data on outcomes, and we were unable to add the excluded women in an intention‐to‐treat analysis.
Selective reporting (reporting bias)
Two studies were judged to be at high risk of reporting bias. The protocol for Sharma 2015 describes a four‐arm study, but only two arms were reported in the publication. The abstracts from which it was assessed do not report any prespecified neonatal outcomes, and report only two arms of the four comparison groups set out in the protocol. No response was received from the authors when additional details were requested. In Wing 1998, uterine rupture is the only outcome reported. It is likely that other outcomes were prespecified and these are not reported.
Four studies were at unclear risk of reporting bias: Meetei 2015, Rezk 2014 and Taylor 1993 were assessed from published reports, without protocols available. It is unclear whether all prespecified outcomes were reported in these studies. Several secondary outcomes prespecified in the protocol for Manish 2016 were not reported in the published study report. In Lokkegaard 2015 the subset of participants with a previous VBAC were not the primary focus of this study, so few outcomes are reported for these women.
One study was at low risk of reporting bias: Hassan 2014 was assessed from a published report with no protocol available, however outcomes were comprehensively reported.
Other potential sources of bias
Five studies were at low risk: the groups were comparable at baseline, and no other potential sources of bias were identified (Hassan 2014; Manish 2016; Meetei 2015; Rezk 2014; Taylor 1993).
Three studies were considered to be at high risk of other bias: the inconsistencies between the study protocol and published report for Sharma 2015 suggest that this study is at high risk of other bias. In Lokkegaard 2015 the primary endpoints of the full study are reported by both intention‐to‐treat and per‐protocol analyses, indicating that a large proportion of women did not receive the allocated treatment. Wing 1998 was stopped prematurely due to safety concerns.
Effects of interventions
See: Summary of findings for the main comparison Vaginal PGE2 versus intravenous (IV) oxytocin; Summary of findings 2 Vaginal misoprostol versus intravenous (IV) oxytocin; Summary of findings 3 Foley catheter versus intravenous (IV) oxytocin; Summary of findings 4 Double‐balloon catheter versus vaginal PGE2; Summary of findings 5 Oral mifepristone versus Foley catheter; Summary of findings 6 Vaginal isosorbide mononitrate versus Foley catheter; Summary of findings 7 80 mL versus 30 mL Foley catheter; Summary of findings 8 Vaginal PGE2 pessary versus vaginal PGE2 tablet
We did not combine data from the six included studies because they used different methods of induction of labour, so we did not consider meta‐analysis appropriate.
1. Vaginal PGE2 inserts versus intravenous oxytocin
A single study involving 42 women compared vaginal PGE2 with intravenous oxytocin for induction of labour (Taylor 1993). See summary of findings Table for the main comparison.
Primary outcomes
There were no differences identified between the two treatment groups for caesarean section (risk ratio (RR) 0.67, 95% confidence interval (CI) 0.22 to 2.03, one study, 42 women, evidence graded low, Analysis 1.1). There was only one event for serious neonatal morbidity or perinatal death and serious maternal morbidity or death, so the analysis of differences between groups was not meaningful (one study, 42 women, evidence graded low, Analysis 1.2; one study, 42 women, evidence graded low,Analysis 1.3).
The study did not report the following primary/GRADE outcomes: vaginal delivery not achieved within 24 hours, anduterine hyperstimulation with fetal heart rate (FHR) changes.
Secondary outcomes
One woman was identified as having a uterine rupture following prostaglandin administration, so the analysis is not meaningful (one study, 42 women, Analysis 1.4). There were no differences identified in the secondary maternal or infant outcomes, including use of epidural analgesia (RR 1.42, 95% CI 0.93 to 2.17, one study, 42 women, Analysis 1.5), instrumental vaginal delivery (RR 1.25, 95% CI 0.39 to 4.02, one study, 42 women, Analysis 1.6), or Apgar score of less than seven at five minutes (no events, one study, 42 infants, Analysis 1.7).
The study did not report the following secondary outcomes: cervix unfavourable/unchanged after 12 to 24 hours, oxytocin augmentation, uterine hyperstimulation without FHR changes, meconium‐stained liquor, neonatal intensive care unit admission, neonatal encephalopathy, perinatal death, disability in childhood, neonatal infection, neonatal antibiotics, maternal side‐effects (all), maternal nausea, maternal vomiting, maternal diarrhoea, other maternal side‐effects, postpartum haemorrhage, chorioamnionitis, endometritis, maternal antibiotics, serious maternal complications (e.g. intensive care unit admission, septicaemia but excluding uterine rupture), maternal death, woman not satisfied, and caregiver not satisfied.
2. Vaginal misoprostol versus intravenous oxytocin
There was one study comparing vaginal misoprostol and intravenous oxytocin included in the review (Wing 1998). No GRADE outcomes were reported. See summary of findings Table 2.
Primary outcomes
This trial was stopped following recruitment and randomisation of 38 women (17 women misoprostol group; 21 women oxytocin group) and no primary outcomes or GRADE outcomes were reported (vaginal delivery not achieved within 24 hours, uterine hyperstimulation with FHR changes, caesarean section, serious neonatal morbidity or perinatal death, and serious maternal morbidity or death).
Secondary outcomes
The only outcome reported was uterine rupture, which occurred in one woman in the misoprostol group (RR 3.67, 95% CI 0.16 to 84.66, one study, 38 women, Analysis 2.1). One woman in the misoprostol group also experienced uterine dehiscence.
The study did not report the following secondary outcomes: cervix unfavourable/unchanged after 12 to 24 hours, oxytocin augmentation, uterine hyperstimulation without FHR changes, epidural analgesia, instrumental vaginal delivery, meconium‐stained liquor, Apgar score less than seven at five minutes, neonatal intensive care unit admission, neonatal encephalopathy, perinatal death, disability in childhood, neonatal infection, neonatal antibiotics, maternal side‐effects (all), maternal nausea, maternal vomiting, maternal diarrhoea, other maternal side‐effects, postpartum haemorrhage, chorioamnionitis, endometritis, maternal antibiotics, serious maternal complications (e.g. intensive care unit admission, septicaemia but excluding uterine rupture), maternal death, woman not satisfied, and caregiver not satisfied.
3. Foley catheter versus intravenous oxytocin
One study comparing Foley catheter with intravenous oxytocin was included (Meetei 2015). The study author supplied unpublished data for the women who were 37 weeks' gestation or more (53 of the 60 women who participated). See summary of findings Table 3.
Primary outcomes
There was no difference between oxytocin and Foley catheter in the number of women who delivered within 24 hours (RR 1.47, 95% CI 0.89 to 2.44, one study, 53 women, evidence graded low, Analysis 3.1), uterine hyperstimulation with FHR changes (RR 3.11, 95% CI 0.13 to 73.09, one study, 53 women, evidence graded low, Analysis 3.2), or the number of women requiring a caesarean section (RR 0.93, 95% CI 0.45 to 1.92, one study, 53 women, evidence graded low,Analysis 3.3).
The study did not report the following primary/GRADE composite outcomes: serious neonatal morbidity or perinatal death, and serious maternal morbidity or death.
Secondary outcomes
There was no difference between the groups in the number of women requiring oxytocin augmentation (RR 1.04, 95% CI 0.81 to 1.32, one study, 53 women, Analysis 3.4), uterine rupture (no events, one study, 53 women, Analysis 3.5), instrumental vaginal delivery (RR 7.26, 95% CI 0.39 to 134.01, one study, 53 women, Analysis 3.6), postpartum haemorrhage (RR 3.11, 95% CI 0.13 to 73.09, one study, 53 women, Analysis 3.7) and chorioamnionitis (not estimable, one study, 53 women, Analysis 3.8). However the number of events for each of these outcomes was very low and the study did not include enough women to show differences between the groups. Two women in the oxytocin group had scar dehiscence, while none in the Foley catheter group did.
The study did not report the following secondary outcomes: cervix unfavourable/unchanged after 12 to 24 hours, uterine hyperstimulation without FHR changes, epidural analgesia, meconium‐stained liquor, Apgar score less than seven at five minutes, neonatal intensive care unit admission, neonatal encephalopathy, perinatal death, disability in childhood, neonatal infection, neonatal antibiotics, maternal side‐effects (all), maternal nausea, maternal vomiting, maternal diarrhoea, other maternal side‐effects, endometritis, maternal antibiotics, serious maternal complications (e.g. intensive care unit admission, septicaemia but excluding uterine rupture), maternal death, woman not satisfied, and caregiver not satisfied.
4. Double‐balloon catheter versus vaginal PGE2
One study compared double‐balloon catheter with vaginal PGE2 (Lokkegaard 2015). Data from the subgroup of women who had had a previous caesarean section were included in this review. See summary of findings Table 4.
Primary outcomes
There was no difference between the groups for caesarean section (RR 0.97, 95% CI 0.41 to 2.32, one study, 16 women, evidence graded very low,Analysis 4.1).
The study did not report the following primary/GRADE outcomes: vaginal delivery not achieved within 24 hours, uterine hyperstimulation with FHR changes, serious neonatal morbidity or perinatal death, and serious maternal morbidity or death.
Failed induction was reported (three out of 12 women in the double‐balloon catheter group, and five out of 12 women in the dinoprostone group), however we did not included this outcome in this review as it included women who started labour before induction began and women who had not delivered 48 hours after induction began.
Secondary outcomes
No babies in this subgroup of the study were admitted to neonatal unit (not estimable, one study, 20 infants, Analysis 4.2).
The study did not report the following secondary outcomes: cervix unfavourable/unchanged after 12 to 24 hours, oxytocin augmentation, uterine hyperstimulation without FHR changes, uterine rupture, epidural analgesia, instrumental vaginal delivery, meconium‐stained liquor, Apgar score less than seven at five minutes, neonatal encephalopathy, perinatal death, disability in childhood, neonatal infection, neonatal antibiotics, maternal side‐effects (all), maternal nausea, maternal vomiting, maternal diarrhoea, other maternal side‐effects, postpartum haemorrhage, chorioamnionitis, endometritis, maternal antibiotics, serious maternal complications (e.g. intensive care unit admission, septicaemia but excluding uterine rupture), maternal death, woman not satisfied, and caregiver not satisfied.
5. Oral mifepristone versus Foley catheter
One study compared oral mifepristone versus Foley catheter (Sharma 2015). No GRADE outcomes were reported. See summary of findings Table 5.
Primary outcomes
The study did not report any of the primary/GRADE outcomes: vaginal delivery not achieved within 24 hours, uterine hyperstimulation with FHR changes, caesarean section, serious neonatal morbidity or perinatal death, and serious maternal morbidity or death.
Secondary outcomes
More women who were induced with Foley catheter than mifepristone required further oxytocin augmentation (RR 0.54, 95% CI 0.38 to 0.76, one study, 107 women, Analysis 5.1). The number of women who had a uterine rupture was slightly lower with mifepristone (three out of 57, compared with nine out of 50), however this does not show a clear difference between groups (RR 0.29, 95% CI 0.08 to 1.02, one study, 107 women, Analysis 5.2).
The study did not report the following secondary outcomes: cervix unfavourable/unchanged after 12 to 24 hours, uterine hyperstimulation without FHR changes, epidural analgesia, instrumental vaginal delivery, meconium‐stained liquor, Apgar score less than seven at five minutes, neonatal intensive care unit admission, neonatal encephalopathy, perinatal death, disability in childhood, neonatal infection, neonatal antibiotics, maternal side‐effects (all), maternal nausea, maternal vomiting, maternal diarrhoea, other maternal side‐effects, postpartum haemorrhage, chorioamnionitis, endometritis, maternal antibiotics, serious maternal complications (e.g. intensive care unit admission, septicaemia but excluding uterine rupture), maternal death, woman not satisfied, and caregiver not satisfied.
6. Vaginal isosorbide mononitrate versus Foley catheter
One study compared vaginal isosorbide mononitrate (IMN) versus Foley catheter (Rezk 2014). See summary of findings Table 6.
Primary outcomes
More women who were induced using IMN rather than Foley catheter had not achieved a vaginal delivery within 24 hours (RR 2.62, 95% CI 1.32 to 5.21, one study, 80 women, evidence graded low,Analysis 6.1). There was no difference in the number of women who had a caesarean section (RR 1.00, 95% CI 0.39 to 2.59, one study, 80 women, evidence graded very low,Analysis 6.2).
The study did not report the following primary/GRADE outcomes: uterine hyperstimulation with FHR changes, serious neonatal morbidity or perinatal death, and serious maternal morbidity or death.
Secondary outcomes
More women who in the IMN group compared with the Foley catheter group received oxytocin augmentation (RR 1.65, 95% CI 1.17 to 2.32, one study, 80 women, Analysis 6.3).
The number of women may have been too small to show clear differences for some outcomes: slightly more infants in the IMN group had an Apgar score less than seven at five minutes (IMN: 20 out of 40, Foley catheter: 12 out of 40; RR 1.67, 95% CI 0.95 to 2.93, Analysis 6.8); slightly more women experience puerperal pyrexia with Foley catheter (IMN: five out of 40, Foley catheter: 12 out of 40; RR 0.42, 95% CI 0.16 to 1.07, Analysis 6.11); and slightly more women experienced headaches with IMN (IMN: 10 out of 40, Foley catheter: three out of 40; RR 3.33, 95% CI 0.99 to 11.22, Analysis 6.13).
In this study of 80 women and infants, there was no clear difference between groups for: uterine rupture (no events, Analysis 6.4); epidural analgesia (RR 1.00, 95% CI 0.39 to 2.59, Analysis 6.5); instrumental vaginal delivery (RR 0.80, 95% CI 0.23 to 2.76, Analysis 6.6); meconium‐stained liquor (RR 2.00, 95% CI 0.19 to 21.18, Analysis 6.7); neonatal intensive care unit admission (RR 2.50, 95% CI 0.51 to 12.14, Analysis 6.9); maternal nausea and vomiting (RR 3.00, 95% CI 0.33 to 27.63, Analysis 6.10); palpitation (RR 2.50, 95% CI 0.51 to 12.14, Analysis 6.12); postpartum haemorrhage (RR 2.00, 95% CI 0.90 to 4.43, Analysis 6.14); and woman not satisfied (RR 1.75, 95% CI 0.56 to 5.51, Analysis 6.15).
The study did not report the following secondary outcomes: cervix unfavourable/unchanged after 12 to 24 hours, uterine hyperstimulation without FHR changes, neonatal encephalopathy, perinatal death, disability in childhood, neonatal infection, neonatal antibiotics, maternal side‐effects (all), maternal diarrhoea, chorioamnionitis, endometritis, maternal antibiotics, serious maternal complications (e.g. intensive care unit admission, septicaemia but excluding uterine rupture), maternal death, and caregiver not satisfied.
7. Foley catheter (80 mL) versus Foley catheter (30 mL)
One study compared 80 mL Foley catheter versus 30 mL Foley catheter (Manish 2016). See summary of findings Table 7.
Primary outcomes
There was no clear difference between groups for vaginal delivery not achieved within 24 hours (RR 1.05, 95% CI 0.91 to 1.20, one study, 154 women, evidence graded moderate,Analysis 7.1) and caesarean section (RR 1.05, 95% CI 0.89 to 1.24, one study, 154 women, evidence graded moderate,Analysis 7.2).
The study did not report the following primary/GRADE outcomes: uterine hyperstimulation with FHR changes, serious neonatal morbidity or perinatal death, and serious maternal morbidity or death.
Secondary outcomes
More women who were induced using a 30 mL Foley catheter required oxytocin augmentation (RR 0.81, 95% CI 0.66 to 0.98, one study, 154 women, Analysis 7.3).
In this study of 154 women and infants, there was no clear difference between groups for: uterine rupture (RR 1.00, 95% CI 0.06 to 15.70, Analysis 7.4); epidural analgesia (no events, Analysis 7.5); instrumental vaginal delivery (RR 0.92, 95% CI 0.43 to 1.95, Analysis 7.6); Apgar score less than seven at five minutes (RR 1.00, 95% CI 0.06 to 15.70, Analysis 7.7); neonatal intensive care unit admission (RR 2.00, 95% CI 0.19 to 21.60, Analysis 7.8); neonatal encephalopathy (RR 3.00, 95% CI 0.12 to 72.52, Analysis 7.9); perinatal death (RR 3.00, 95% CI 0.12 to 72.52, Analysis 7.10); neonatal infection (no events, Analysis 7.11); cord prolapse (other maternal side‐effects) (no events, Analysis 7.12); postpartum haemorrhage (RR 0.33, 95% CI 0.01 to 8.06, Analysis 7.13); and chorioamnionitis (RR 0.33, 95% CI 0.04 to 3.13, Analysis 7.14).
The study did not report the following secondary outcomes: cervix unfavourable/unchanged after 12 to 24 hours, uterine hyperstimulation without FHR changes, meconium‐stained liquor, disability in childhood, neonatal antibiotics, maternal side‐effects (all), maternal nausea, maternal vomiting, maternal diarrhoea, endometritis, maternal antibiotics, serious maternal complications (e.g. intensive care unit admission, septicaemia but excluding uterine rupture), maternal death, woman not satisfied, and caregiver not satisfied.
8. Vaginal PGE2 tablet versus vaginal PGE2 pessary
One study compared PGE2 (dinoprostone) vaginal tablet versus vaginal pessary (Hassan 2014). See summary of findings Table 8.
Primary outcomes
There was no clear difference between groups in the number of women requiring a caesarean section (RR 1.09, 95% CI 0.74 to 1.60, one study, 200 women, evidence graded very low, Analysis 8.1).
The study did not report the following primary/GRADE outcomes: vaginal delivery not achieved within 24 hours, uterine hyperstimulation with FHR changes, serious neonatal morbidity or perinatal death, and serious maternal morbidity or death.
Secondary outcomes
In this study of 200 women and infants, there was no clear difference between groups for: oxytocin augmentation (RR 1.50, 95% CI 0.81 to 2.78, Analysis 8.2); uterine hyperstimulation (FHR change not mentioned) (RR 0.50, 95% CI 0.05 to 5.43, Analysis 8.3); uterine rupture (RR 0.33, 95% CI 0.01 to 8.09, Analysis 8.4); Apgar score less than seven at five minutes (RR 0.80, 95% CI 0.22 to 2.89, Analysis 8.5); neonatal intensive care unit admission (RR 0.75, 95% CI 0.17 to 3.27, Analysis 8.6); neonatal infection (RR 1.00, 95% CI 0.06 to 15.77, Analysis 8.7); postpartum haemorrhage (RR 1.00, 95% CI 0.14 to 6.96, Analysis 8.8); chorioamnionitis (RR 1.00, 95% CI 0.06 to 15.77, Analysis 8.9); endometritis (RR 1.50, 95% CI 0.26 to 8.79, Analysis 8.10); and maternal intensive care unit admission (no events, Analysis 8.11).
The study did not report the following secondary outcomes: cervix unfavourable/unchanged after 12 to 24 hours, epidural analgesia, instrumental vaginal delivery, meconium‐stained liquor, neonatal encephalopathy, perinatal death, disability in childhood, neonatal antibiotics, maternal side‐effects (all), maternal nausea, maternal vomiting, maternal diarrhoea, other maternal side‐effects, maternal antibiotics, maternal death, woman not satisfied, and caregiver not satisfied.
Discussion
Summary of main results
Eight studies were included in this updated review (Hassan 2014; Lokkegaard 2015; Manish 2016; Meetei 2015; Rezk 2014; Sharma 2015; Taylor 1993; Wing 1998), with a total of 707 women participating in these studies, or the eligible subgroups within them. Three studies compared an intervention with intravenous oxytocin: vaginal PGE2 (Taylor 1993), vaginal misoprostol (Wing 1998), and Foley catheter (Meetei 2015). One study compared double‐balloon catheter with vaginal PGE2 (Lokkegaard 2015), one compared oral mifepristone with Foley catheter (Sharma 2015), and one trial compared vaginal isosorbide mononitrate (a nitric oxide donor) with Foley catheter (Rezk 2014). One study compared 80 mL Foley catheter with 30 mL Foley catheter (Manish 2016), and one study compared vaginal PGE2 pessary with vaginal PGE2 tablet (Hassan 2014).
The available evidence from randomised controlled trials relating to methods of induction of labour for women with a prior caesarean section is inadequate. The available studies are underpowered to detect clinically relevant differences in the primary and secondary outcome measures, and many important outcomes were not reported. As the studies compared different methods of labour induction, no meta‐analysis was possible.
No clear differences were found between vaginal PGE2 and intravenous oxytocin for the outcomes reported by Taylor 1993 (42 women): caesarean section, serious neonatal morbidity or perinatal death, serious maternal morbidity or death, uterine rupture, epidural analgesia, instrumental vaginal delivery, and Apgar score less than seven at five minutes.
One woman who received vaginal misoprostol rather than intravenous oxytocin had a uterine rupture and one had a uterine dehiscence, prompting Wing 1998 to prematurely end the trial. Despite this, there was no clear difference between groups, possibly due to the small number of participants. None of our other prespecified primary or secondary outcomes were reported in this study of 38 women.
One study comparing Foley catheter with intravenous oxytocin in a study of 53 women (Meetei 2015) found no difference between groups for all reported primary and secondary outcomes: vaginal delivery within 24 hours, uterine stimulation with fetal heart rate changes, caesarean section, oxytocin augmentation, uterine rupture, instrumental vaginal delivery, postpartum haemorrhage, and chorioamnionitis.
There was no clear difference between women who were induced using a double‐balloon catheter versus vaginal PGE2 for caesarean section and admission to the neonatal unit in Lokkegaard 2015 (26 women) for the outcomes reported: caesarean section, and admission to neonatal unit. 'Failed induction' was reported, however this combined women who had begun labour between randomisation and induction, as well as women who had not delivered 48 hours after induction, so it was not considered meaningful to include this. No other primary or secondary outcomes were reported.
None of the primary outcomes were reported by Sharma 2015 (107 women). Women induced with oral mifepristone received less oxytocin augmentation than those induced with Foley catheter. There were slightly fewer cases of uterine rupture in the mifepristone group, however this was not a clear difference between groups.
One study comparing induction with vaginal isosorbide mononitrate (IMN) versus Foley catheter (80 women, Rezk 2014) found that fewer women induced with isosorbide mononitrate achieved a vaginal delivery within 24 hours. More women induced with IMN required oxytocin augmentation. There were no clear differences for the other reported outcomes: caesarean section, uterine rupture, epidural analgesia, instrumental vaginal delivery, meconium‐stained liquor, Apgar score less than seven at five minutes, neonatal intensive care unit admission, maternal nausea and vomiting, puerperal pyrexia, palpitation, headache, postpartum haemorrhage, and woman not satisfied. There were slightly more infants with an Apgar score less than seven at five minutes in the IMN group, slightly more women experienced puerperal pyrexia in the Foley catheter group, and slightly more women experienced headaches with IMN, however the low number of participants meant that these were not clear differences between the groups of women.
Manish 2016 compared 80 mL Foley catheter with 30 mL Foley catheter (154 women). There was no clear difference between groups for the primary outcomes: vaginal delivery not achieved within 24 hours and caesarean section. More women who were induced using a 30 mL Foley catheter required oxytocin augmentation. There were no clear differences in the other reported secondary outcomes: uterine rupture, epidural analgesia, instrumental vaginal delivery, Apgar score less than seven at five minutes, neonatal intensive care unit admission, neonatal encephalopathy, perinatal death, neonatal infection, cord prolapse, postpartum haemorrhage, and chorioamnionitis.
One study of 200 women (Hassan 2014) showed no difference between induction with vaginal PGE2 pessary and vaginal PGE2 tablet for any of the reported outcomes: caesarean section, oxytocin augmentation, uterine hyperstimulation (FHR change not mentioned), uterine rupture, Apgar score less than seven at five minutes, neonatal intensive care unit admission, neonatal infection, postpartum haemorrhage, chorioamnionitis, endometritis, and maternal intensive care unit admission.
Overall completeness and applicability of evidence
There is insufficient information available from randomised trials to inform the optimal method of induction of labour in women with a prior caesarean birth. Several of the studies were at high risk of bias, and did not report important outcomes.
Quality of the evidence
All of the trials included in this review had design limitations and some had serious design limitations. It would be difficult to blind women or health professionals to these interventions, and only one study described blinding outcome assessors and the health professionals making clinical decisions (Manish 2016). One study had high risk of attrition bias due to excluding a high proportion of women from the analysis (Lokkegaard 2015). The risk of reporting bias was high in two studies, one that reported few of the prespecified outcomes from two arms of a four‐arm study (Sharma 2015), and one that reported only uterine rupture and was stopped prematurely due to safety concerns (Wing 1998).
Several studies reported very few of our prespecified outcomes (Lokkegaard 2015; Sharma 2015; Wing 1998), or did not report them in a form that could be included in the review. Infant outcomes were especially scarce, with none of our prespecified infant outcomes reported by Meetei 2015, Sharma 2015 and Wing 1998.
Studies reported none (Sharma 2015; Wing 1998), one (Hassan 2014; Lokkegaard 2015), two (Manish 2016; Rezk 2014), or three (Meetei 2015; Taylor 1993) of our five primary/GRADE outcomes. Caesarean section was reported by six studies (Hassan 2014; Lokkegaard 2015; Manish 2016; Meetei 2015; Rezk 2014; Taylor 1993), vaginal delivery not achieved within 24 hours was reported by three studies (Manish 2016; Meetei 2015; Rezk 2014), uterine hyperstimulation with fetal heart rate changes was reported by one study (Meetei 2015), and the composite outcomes serious neonatal morbidity or perinatal death, and serious maternal morbidity or death were reported by one study (Taylor 1993).
The GRADE level of evidence for outcomes were: moderate (vaginal delivery not achieved within 24 hours, and caesarean section in Manish 2016), low (vaginal delivery not achieved within 24 hours, uterine hyperstimulation with fetal heart rate changes, and caesarean section in Meetei 2015; vaginal delivery not achieved within 24 hours in Rezk 2014; caesarean section, serious neonatal morbidity or perinatal death, and serious maternal morbidity or death in Taylor 1993), and very low (caesarean section in Lokkegaard 2015; caesarean section in Rezk 2014; caesarean section in Hassan 2014).
Decisions to downgrade the evidence were based on small sample sizes in every comparison, and high risk of bias in some studies (Hassan 2014; Lokkegaard 2015; Meetei 2015; Rezk 2014; Taylor 1993). GRADE could not be assessed for misoprostol versus oxytocin (Wing 1998) or mifepristone versus Foley catheter (Sharma 2015), because none of the prespecified GRADE outcomes were reported.
Potential biases in the review process
The assessment of risk of bias involves subjective judgements. This potential limitation is minimised by following the procedures in the Cochrane Handbook for Systematic Reviews of Interventions (Higgins 2011a) with review authors independently assessing studies and resolving any disagreement through discussion, and if required involving a third assessor in the decision.
Agreements and disagreements with other studies or reviews
While there is limited information available from randomised trials, lower‐quality evidence is available from observational studies.
In a large retrospective population‐based study, Lydon‐Rochelle 2001 evaluated the risk of uterine rupture among women with a prior caesarean birth, comparing the risks following the spontaneous onset of labour, as well as following induction of labour (using both prostaglandin and other methods to induce labour). Where labour occurred spontaneously, the risk of uterine rupture was reported to be 5.2 per 1000 women (56 of 10,789 women), increasing to 7.7 per 1000 women (15 of 1960 women) where labour was induced with “non‐prostaglandin” methods, and further increasing to 24.5 per 1000 women (nine of 366 women) where labour was induced with prostaglandin preparations. When expressed as a risk ratio (RR) comparing the chance of uterine rupture among women who had a repeat elective caesarean section, spontaneous labour increased the chance of rupture by three‐fold (RR 3.3, 95% confidence interval (CI) 1.8 to 6.0), induction with non‐prostaglandin methods by almost five‐fold (RR 4.9, 95% CI 2.4 to 9.7), and induction with prostaglandin preparations by over 15.5‐fold (RR 15.6, 95% CI 8.1 to 30.0). Specific information was not presented for different prostaglandin preparations (for example, PGE2, or misoprostol).
The US‐based NICHD group conducted a prospective evaluation of women with a prior caesarean birth (Landon 2004). In this study, induction of labour following the use of prostaglandin medication was associated with a non‐significant increase in risk of uterine rupture when compared with mechanical methods of induction, for example, the Foley catheter (risk of uterine rupture 140 per 10,000 inductions following PGE2 compared with 89 per 10,000 inductions following mechanical dilation of the cervix with a Foley catheter) (Landon 2004). In contrast, Scottish data from more than 36,000 women with a prior caesarean birth, of whom 4600 women had labour induced with prostaglandins, demonstrated an increased risk of uterine rupture and subsequent perinatal death following prostaglandin induction (risk of uterine rupture 4.5 per 10,000 non‐induced labours versus 11 per 10,000 labours induced with prostaglandins in women with a prior caesarean) (Smith 2004). Raviasia et al conducted a retrospective cohort study reviewing all births between 1992 and 1998 in a Canadian hospital (Ravasia 2000). In this series, of the 172 women who underwent induction with prostaglandins, five suffered a uterine rupture (2.9%), compared with one of 129 in women who were induced with a Foley catheter (0.78%), and two of 274 women who did not require cervical ripening (0.73%). In a similar study evaluating mechanical cervical dilation in women with a prior caesarean section, Bujold 2004 demonstrated a similar risk of uterine rupture between Foley catheter induction and spontaneous onset of labour (1.78% versus 1.2%).
The risk associated with uterine scar rupture following the use of misoprostol is less well documented. Misoprostol is an oral prostaglandin E1 analogue, licensed for use in the treatment of gastric ulcer disease. There is increasing recognition of its use as a prostaglandin agent to induce labour following oral, vaginal and buccal administration (Alfirevic 2006; Hofmeyr 2010; Muzonzini 2004). However, its use to induce labour in women with a previous caesarean has been questioned, with several case reports indicating an increased risk of uterine rupture (Bennett 1997; Choy‐Hee 2001; Cunha 1999; Phillips 1996; Plaut 1999).
While there are documented potential risks associated with induction of labour among women with a previous caesarean section, induction of labour is considered by many to be preferable to a repeat elective caesarean section. In an Australian survey of practice relating to care of women with a prior caesarean section in a subsequent birth, two‐thirds of obstetrician respondents indicated that induction of labour was preferable to a repeat elective caesarean (Dodd 2003). While manufacturers of both oxytocin and PGE2 specifically list previous caesarean as a contraindication to use in their product information brochures, almost two‐thirds of Australian obstetricians (Dodd 2003) and 25% of Canadian obstetricians (Brill 2003) use vaginal PGE2 in this setting. Additionally, 80% of Australian obstetricians use oxytocin in women with a previous caesarean birth (Dodd 2003). These figures are similar to those reported in England, where 76% of obstetricians would consider use of prostaglandin analogues, and 86% of consultants would use oxytocin to induce labour in women with a previous caesarean birth (Gupta 2011).

Study flow diagram

Risk of bias graph: review authors' judgements about each risk of bias item presented as percentages across all included studies

Risk of bias summary: review authors' judgements about each risk of bias item for each included study
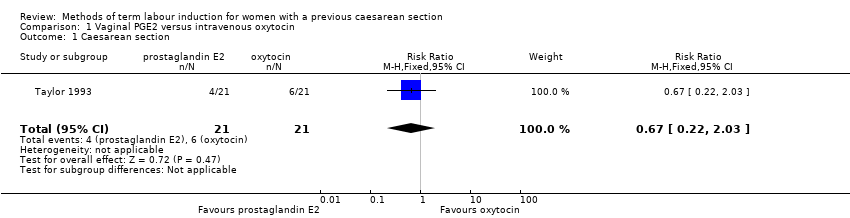
Comparison 1 Vaginal PGE2 versus intravenous oxytocin, Outcome 1 Caesarean section.

Comparison 1 Vaginal PGE2 versus intravenous oxytocin, Outcome 2 Serious neonatal morbidity or perinatal death.

Comparison 1 Vaginal PGE2 versus intravenous oxytocin, Outcome 3 Serious maternal morbidity or death.

Comparison 1 Vaginal PGE2 versus intravenous oxytocin, Outcome 4 Uterine rupture.

Comparison 1 Vaginal PGE2 versus intravenous oxytocin, Outcome 5 Epidural analgesia.

Comparison 1 Vaginal PGE2 versus intravenous oxytocin, Outcome 6 Instrumental vaginal delivery.

Comparison 1 Vaginal PGE2 versus intravenous oxytocin, Outcome 7 Apgar score < 7 at 5 minutes.

Comparison 2 Vaginal misoprostol versus intravenous oxytocin, Outcome 1 Uterine rupture.

Comparison 3 Foley catheter versus intravenous oxytocin, Outcome 1 Vaginal delivery not achieved within 24 hours.

Comparison 3 Foley catheter versus intravenous oxytocin, Outcome 2 Uterine hyperstimulation with FHR changes.

Comparison 3 Foley catheter versus intravenous oxytocin, Outcome 3 Caesarean section.

Comparison 3 Foley catheter versus intravenous oxytocin, Outcome 4 Oxytocin augmentation.

Comparison 3 Foley catheter versus intravenous oxytocin, Outcome 5 Uterine rupture.

Comparison 3 Foley catheter versus intravenous oxytocin, Outcome 6 Instrumental vaginal delivery.

Comparison 3 Foley catheter versus intravenous oxytocin, Outcome 7 Postpartum haemorrhage.

Comparison 3 Foley catheter versus intravenous oxytocin, Outcome 8 Chorioamnionitis.

Comparison 4 Double‐balloon catheter versus vaginal PGE2, Outcome 1 Caesarean section.

Comparison 4 Double‐balloon catheter versus vaginal PGE2, Outcome 2 Admission to neonatal unit.

Comparison 5 Oral mifepristone versus Foley catheter, Outcome 1 Oxytocin augmentation.

Comparison 5 Oral mifepristone versus Foley catheter, Outcome 2 Uterine rupture.

Comparison 6 Vaginal isosorbide mononitrate versus Foley catheter, Outcome 1 Vaginal delivery not achieved within 24 hours.

Comparison 6 Vaginal isosorbide mononitrate versus Foley catheter, Outcome 2 Caesarean section.

Comparison 6 Vaginal isosorbide mononitrate versus Foley catheter, Outcome 3 Oxytocin augmentation.
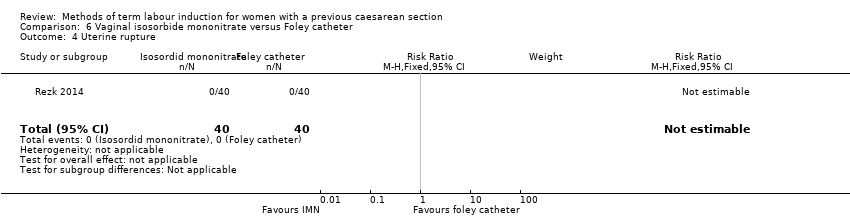
Comparison 6 Vaginal isosorbide mononitrate versus Foley catheter, Outcome 4 Uterine rupture.

Comparison 6 Vaginal isosorbide mononitrate versus Foley catheter, Outcome 5 Epidural analgesia.

Comparison 6 Vaginal isosorbide mononitrate versus Foley catheter, Outcome 6 Instrumental vaginal delivery.

Comparison 6 Vaginal isosorbide mononitrate versus Foley catheter, Outcome 7 Meconium‐stained liquor.

Comparison 6 Vaginal isosorbide mononitrate versus Foley catheter, Outcome 8 Apgar score < 7 at 5 minutes.
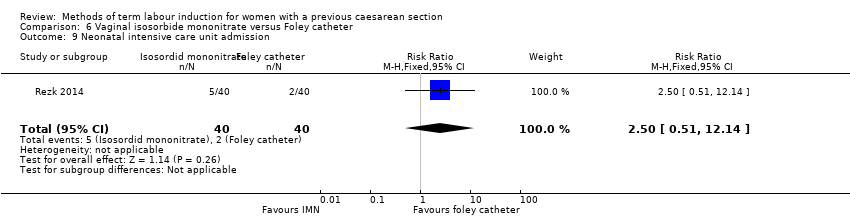
Comparison 6 Vaginal isosorbide mononitrate versus Foley catheter, Outcome 9 Neonatal intensive care unit admission.

Comparison 6 Vaginal isosorbide mononitrate versus Foley catheter, Outcome 10 Maternal nausea and vomiting.

Comparison 6 Vaginal isosorbide mononitrate versus Foley catheter, Outcome 11 Puerperal pyrexia (other maternal side‐effects).
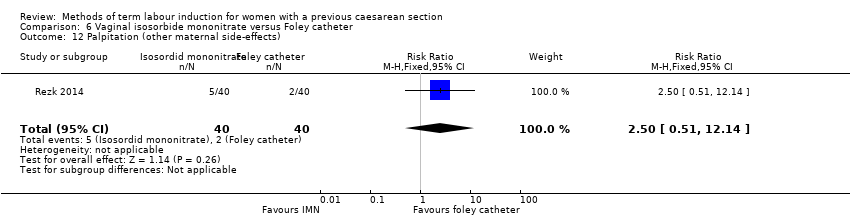
Comparison 6 Vaginal isosorbide mononitrate versus Foley catheter, Outcome 12 Palpitation (other maternal side‐effects).

Comparison 6 Vaginal isosorbide mononitrate versus Foley catheter, Outcome 13 Headache (other maternal side‐effects).

Comparison 6 Vaginal isosorbide mononitrate versus Foley catheter, Outcome 14 Postpartum haemorrhage.

Comparison 6 Vaginal isosorbide mononitrate versus Foley catheter, Outcome 15 Woman not satisfied.

Comparison 7 Foley catheter 80 mL versus Foley catheter 30 mL, Outcome 1 Vaginal delivery not achieved within 24 hours.

Comparison 7 Foley catheter 80 mL versus Foley catheter 30 mL, Outcome 2 Caesarean section.

Comparison 7 Foley catheter 80 mL versus Foley catheter 30 mL, Outcome 3 Oxytocin augmentation.

Comparison 7 Foley catheter 80 mL versus Foley catheter 30 mL, Outcome 4 Uterine rupture.

Comparison 7 Foley catheter 80 mL versus Foley catheter 30 mL, Outcome 5 Epidural analgesia.

Comparison 7 Foley catheter 80 mL versus Foley catheter 30 mL, Outcome 6 Instrumental vaginal delivery.

Comparison 7 Foley catheter 80 mL versus Foley catheter 30 mL, Outcome 7 Apgar score < 7 at 5 minutes.

Comparison 7 Foley catheter 80 mL versus Foley catheter 30 mL, Outcome 8 Neonatal intensive care unit admission.

Comparison 7 Foley catheter 80 mL versus Foley catheter 30 mL, Outcome 9 Neonatal encephalopathy.

Comparison 7 Foley catheter 80 mL versus Foley catheter 30 mL, Outcome 10 Perinatal death.

Comparison 7 Foley catheter 80 mL versus Foley catheter 30 mL, Outcome 11 Neonatal infection.

Comparison 7 Foley catheter 80 mL versus Foley catheter 30 mL, Outcome 12 Cord prolapse (other maternal side‐effects).

Comparison 7 Foley catheter 80 mL versus Foley catheter 30 mL, Outcome 13 Postpartum haemorrhage.

Comparison 7 Foley catheter 80 mL versus Foley catheter 30 mL, Outcome 14 Chorioamnionitis.

Comparison 8 Vaginal PGE2 pessary versus vaginal PGE2 tablet, Outcome 1 Caesarean section.
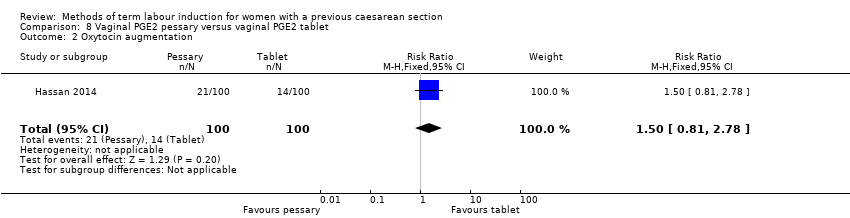
Comparison 8 Vaginal PGE2 pessary versus vaginal PGE2 tablet, Outcome 2 Oxytocin augmentation.

Comparison 8 Vaginal PGE2 pessary versus vaginal PGE2 tablet, Outcome 3 Uterine hyperstimulation (FHR change not mentioned).

Comparison 8 Vaginal PGE2 pessary versus vaginal PGE2 tablet, Outcome 4 Uterine rupture.

Comparison 8 Vaginal PGE2 pessary versus vaginal PGE2 tablet, Outcome 5 Apgar score < 7 at 5 minutes.

Comparison 8 Vaginal PGE2 pessary versus vaginal PGE2 tablet, Outcome 6 Neonatal intensive care unit admission.
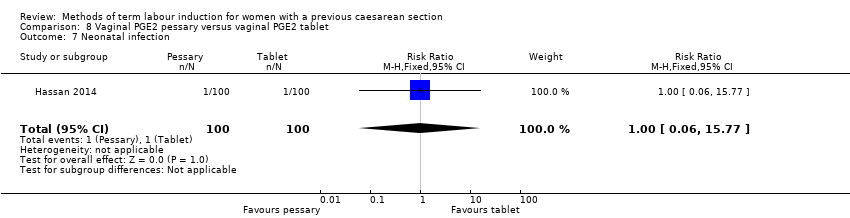
Comparison 8 Vaginal PGE2 pessary versus vaginal PGE2 tablet, Outcome 7 Neonatal infection.
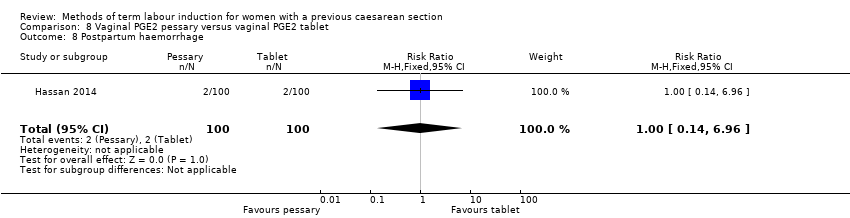
Comparison 8 Vaginal PGE2 pessary versus vaginal PGE2 tablet, Outcome 8 Postpartum haemorrhage.

Comparison 8 Vaginal PGE2 pessary versus vaginal PGE2 tablet, Outcome 9 Chorioamnionitis.

Comparison 8 Vaginal PGE2 pessary versus vaginal PGE2 tablet, Outcome 10 Endometritis.

Comparison 8 Vaginal PGE2 pessary versus vaginal PGE2 tablet, Outcome 11 Maternal intensive care unit admission (serious maternal complications).
| Vaginal PGE2 compared with IV oxytocin for term labour induction for women with a previous caesarean section | ||||||
| Patient or population: women with one previous lower segment caesarean section and requiring labour induction due to prolonged pregnancy or pre‐eclampsia, singleton in cephalic presentation, GA ≥ 37 weeks, BS < 9, no cephalopelvic disproportion anticipated | ||||||
| Outcomes | Anticipated absolute effects* (95% CI) | Relative effect | № of participants | Quality of the evidence | Comments | |
| Risk with oxytocin | Risk with prostaglandin E2 | |||||
| Vaginal delivery not achieved within 24 hours | ‐ | ‐ | ‐ | ‐ | ‐ | Not reported |
| Uterine hyperstimulation with fetal heart rate changes | ‐ | ‐ | ‐ | ‐ | ‐ | Not reported |
| Caesarean section | Study population | RR 0.67 | 42 | ⊕⊕⊝⊝ | ||
| 286 per 1000 | 191 per 1000 | |||||
| Serious neonatal morbidity/perinatal death | Study population | RR 3.00 | 42 | ⊕⊕⊝⊝ | ||
| 0 per 1000 | 0 per 1000 | |||||
| Serious maternal morbidity or death | Study population | RR 3.00 | 42 | ⊕⊕⊝⊝ | ||
| 0 per 1000 | 0 per 1000 | |||||
| *The risk in the intervention group (and its 95% confidence interval) is based on the assumed risk in the comparison group and the relative effect of the intervention (and its 95% CI). | ||||||
| GRADE Working Group grades of evidence | ||||||
| 1Wide CI crossing the line of no effect, small sample size, and few events (imprecision, downgraded 2 levels). | ||||||
| Vaginal misoprostol compared with IV oxytocin for term labour induction for women with a previous caesarean section | ||||||
| Patient or population: women with a previous caesarean section | ||||||
| Outcomes | Anticipated absolute effects* (95% CI) | Relative effect | № of participants | Quality of the evidence | Comments | |
| Risk with misoprostol | Risk with oxytocin | |||||
| Vaginal delivery not achieved within 24 hours | not reported | |||||
| Uterine hyperstimulation with fetal heart rate changes | not reported | |||||
| Caesarean section | not reported | |||||
| Serious neonatal morbidity or perinatal death | not reported | |||||
| Serious maternal morbidity or death | not reported | |||||
| *The risk in the intervention group (and its 95% confidence interval) is based on the assumed risk in the comparison group and the relative effect of the intervention (and its 95% CI). | ||||||
| GRADE Working Group grades of evidence | ||||||
| Foley catheter compared with IV oxytocin for term labour induction for women with a previous caesarean section | ||||||
| Patient or population: pregnant women with a previous low transverse caesarean section, singleton live pregnancy with cephalic presentation, period of gestation > 28 weeks and BS < 5 were included in the study, with unfavourable cervix | ||||||
| Outcomes | Anticipated absolute effects* (95% CI) | Relative effect | № of participants | Quality of the evidence | Comments | |
| Risk with oxytocin | Risk with Foley catheter | |||||
| Vaginal delivery not achieved within 24 hours | Study population | RR 1.47 | 53 | ⊕⊕⊝⊝ | ||
| 444 per 1000 | 653 per 1000 | |||||
| Uterine hyperstimulation with fetal heart rate changes | Study population | RR 3.11 | 53 | ⊕⊕⊝⊝ | ||
| 0 per 1000 | 0 per 1000 | |||||
| Caesarean section | Study population | RR 0.93 | 53 | ⊕⊕⊝⊝ | ||
| 370 per 1000 | 344 per 1000 | |||||
| Serious neonatal morbidity or perinatal death | ‐ | ‐ | ‐ | ‐ | ‐ | Not reported |
| Serious maternal morbidity or death | ‐ | ‐ | ‐ | ‐ | ‐ | Not reported |
| *The risk in the intervention group (and its 95% confidence interval) is based on the assumed risk in the comparison group and the relative effect of the intervention (and its 95% CI). | ||||||
| GRADE Working Group grades of evidence | ||||||
| 1Wide confidence interval crossing the line of no effect, small sample size, and few events (imprecision, downgraded 2 levels). | ||||||
| Double‐balloon catheter compared with vaginal PGE2 for term labour induction for women with a previous caesarean section | ||||||
| Patient or population: women with a previous caesarean section (subgroup of all women in the study) with intact fetal membranes, cephalic position and unfavourable cervix, with indications for induction of labour Intervention: double‐balloon catheter inserted through the cervical canal with 80 mL of saline installed stepwise in the uterine balloon and 80 mL saline in the cervicovaginal balloon | ||||||
| Outcomes | Anticipated absolute effects* (95% CI) | Relative effect | № of participants | Quality of the evidence | Comments | |
| Risk with prostaglandin E2 | Risk with double‐balloon catheter | |||||
| Vaginal delivery not achieved within 24 hours | ‐ | ‐ | ‐ | ‐ | ‐ | Not reported |
| Uterine hyperstimulation with fetal heart rate changes | ‐ | ‐ | ‐ | ‐ | ‐ | Not reported |
| Caesarean section | Study population | RR 0.97 | 16 | ⊕⊝⊝⊝ | ||
| 571 per 1000 | 554 per 1000 | |||||
| Serious neonatal morbidity or perinatal death | ‐ | ‐ | ‐ | ‐ | ‐ | Not reported |
| Serious maternal morbidity or death | ‐ | ‐ | ‐ | ‐ | ‐ | Not reported |
| *The risk in the intervention group (and its 95% confidence interval) is based on the assumed risk in the comparison group and the relative effect of the intervention (and its 95% CI). | ||||||
| GRADE Working Group grades of evidence | ||||||
| 1One study with design limitations (risk of bias, downgraded 1 level). | ||||||
| Oral mifepristone compared with Foley catheter for term labour induction for women with a previous caesarean section | ||||||
| Patient or population: pregnant women, 40 weeks' gestation, single cephalic presentation, 1 previous low segment caesarean section | ||||||
| Outcomes | Anticipated absolute effects* (95% CI) | Relative effect | № of participants | Quality of the evidence | Comments | |
| Risk with mifepristone | Risk with Foley catheter | |||||
| Vaginal delivery not achieved within 24 hours | not reported | |||||
| Uterine hyperstimulation with fetal heart rate changes | not reported | |||||
| Caesarean section | not reported | |||||
| Serious neonatal morbidity or perinatal death | not reported | |||||
| Serious maternal morbidity or death | not reported | |||||
| *The risk in the intervention group (and its 95% confidence interval) is based on the assumed risk in the comparison group and the relative effect of the intervention (and its 95% CI). | ||||||
| GRADE Working Group grades of evidence | ||||||
| Vaginal isosorbide mononitrate versus Foley catheter for term labour induction for women with a previous caesarean section | ||||||
| Patient or population: pregnant women with 1 previous lower segment caesarean section at 37 weeks and beyond, with a BS of ≤ 6, intact membranes, reactive non‐stress test, normal umbilical arterial Doppler indices, absence of labour and willingness of women to participate in the study | ||||||
| Outcomes | Anticipated absolute effects* (95% CI) | Relative effect | № of participants | Quality of the evidence | Comments | |
| Risk with Foley catheter | Risk with isosorbide mononitrate | |||||
| Vaginal delivery not achieved within 24 hours | Study population | RR 2.63 | 80 | ⊕⊕⊝⊝ | ||
| 200 per 1000 | 526 per 1000 | |||||
| Uterine hyperstimulation with fetal heart rate changes | ‐ | ‐ | ‐ | ‐ | ‐ | Not reported |
| Caesarean section | Study population | RR 1.00 | 80 | ⊕⊝⊝⊝ | ||
| 175 per 1000 | 175 per 1000 | |||||
| Serious neonatal morbidity or perinatal death | ‐ | ‐ | ‐ | ‐ | ‐ | Not reported |
| Serious maternal morbidity or death | ‐ | ‐ | ‐ | ‐ | ‐ | Not reported |
| *The risk in the intervention group (and its 95% confidence interval) is based on the assumed risk in the comparison group and the relative effect of the intervention (and its 95% CI). | ||||||
| GRADE Working Group grades of evidence | ||||||
| 1 One study with design limitations (risk of bias, downgraded 1 level). | ||||||
| 80 mL Foley catheter versus 30 mL Foley catheter for term labour induction for women with a previous caesarean section | ||||||
| Patient or population: pregnant women who previously had a lower segment CS and now have a singleton cephalic presentation after at least 36 completed weeks, not in labour, with intact membranes and BS of < 6 | ||||||
| Outcomes | Anticipated absolute effects* (95% CI) | Relative effect | № of participants | Quality of the evidence | Comments | |
| Risk with 30 mL Foley catheter | Risk with 80 mL Foley catheter | |||||
| Vaginal delivery not achieved within 24 hours | Study population | RR 1.05 | 154 | ⊕⊕⊕⊝ | ||
| 818 per 1000 | 859 per 1000 | |||||
| Uterine hyperstimulation with fetal heart rate changes | ‐ | ‐ | ‐ | ‐ | ‐ | Not reported |
| Caesarean section | Study population | RR 1.05 | 154 | ⊕⊕⊕⊝ | ||
| 766 per 1000 | 805 per 1000 | |||||
| Serious neonatal morbidity or perinatal death | ‐ | ‐ | ‐ | ‐ | ‐ | Not reported |
| Serious maternal morbidity or death | ‐ | ‐ | ‐ | ‐ | ‐ | Not reported |
| *The risk in the intervention group (and its 95% confidence interval) is based on the assumed risk in the comparison group and the relative effect of the intervention (and its 95% CI). | ||||||
| GRADE Working Group grades of evidence | ||||||
| 1Small sample size (imprecision, downgraded 1 level). | ||||||
| Vaginal PGE2 pessary versus vaginal PGE2 tablet for term labour induction for women with a previous caesarean section | ||||||
| Patient or population: women with a previous caesarean section, a live singleton fetus (37‐42 weeks of gestation) in cephalic presentation and a reactive non‐stress test, BS of ≤ 7 before onset of labour, no spontaneous contractions (< 4 contractions within 20 minutes) | ||||||
| Outcomes | Anticipated absolute effects* (95% CI) | Relative effect | № of participants | Quality of the evidence | Comments | |
| Risk with dinoprostone tablet | Risk with dinoprostone pessary | |||||
| Vaginal delivery not achieved within 24 hours | ‐ | ‐ | ‐ | ‐ | ‐ | Not reported |
| Uterine hyperstimulation with fetal heart rate changes | ‐ | ‐ | ‐ | ‐ | ‐ | Not reported |
| Caesarean section | Study population | RR 1.09 | 200 | ⊕⊝⊝⊝ | ||
| 330 per 1000 | 360 per 1000 | |||||
| Serious neonatal morbidity or perinatal death | ‐ | ‐ | ‐ | ‐ | ‐ | Not reported |
| Serious maternal morbidity or death | ‐ | ‐ | ‐ | ‐ | ‐ | Not reported |
| *The risk in the intervention group (and its 95% confidence interval) is based on the assumed risk in the comparison group and the relative effect of the intervention (and its 95% CI). | ||||||
| GRADE Working Group grades of evidence | ||||||
| 1One study with design limitations (risk of bias, downgraded 1 level). | ||||||
| Outcome or subgroup title | No. of studies | No. of participants | Statistical method | Effect size |
| 1 Caesarean section Show forest plot | 1 | 42 | Risk Ratio (M‐H, Fixed, 95% CI) | 0.67 [0.22, 2.03] |
| 2 Serious neonatal morbidity or perinatal death Show forest plot | 1 | 42 | Risk Ratio (M‐H, Fixed, 95% CI) | 3.0 [0.13, 69.70] |
| 3 Serious maternal morbidity or death Show forest plot | 1 | 42 | Risk Ratio (M‐H, Fixed, 95% CI) | 3.0 [0.13, 69.70] |
| 4 Uterine rupture Show forest plot | 1 | 42 | Risk Ratio (M‐H, Fixed, 95% CI) | 3.0 [0.13, 69.70] |
| 5 Epidural analgesia Show forest plot | 1 | 42 | Risk Ratio (M‐H, Fixed, 95% CI) | 1.42 [0.93, 2.17] |
| 6 Instrumental vaginal delivery Show forest plot | 1 | 42 | Risk Ratio (M‐H, Fixed, 95% CI) | 1.25 [0.39, 4.02] |
| 7 Apgar score < 7 at 5 minutes Show forest plot | 1 | 42 | Risk Ratio (M‐H, Fixed, 95% CI) | 0.0 [0.0, 0.0] |
| Outcome or subgroup title | No. of studies | No. of participants | Statistical method | Effect size |
| 1 Uterine rupture Show forest plot | 1 | 38 | Risk Ratio (M‐H, Fixed, 95% CI) | 3.67 [0.16, 84.66] |
| Outcome or subgroup title | No. of studies | No. of participants | Statistical method | Effect size |
| 1 Vaginal delivery not achieved within 24 hours Show forest plot | 1 | 53 | Risk Ratio (M‐H, Fixed, 95% CI) | 1.47 [0.89, 2.44] |
| 2 Uterine hyperstimulation with FHR changes Show forest plot | 1 | 53 | Risk Ratio (M‐H, Fixed, 95% CI) | 3.11 [0.13, 73.09] |
| 3 Caesarean section Show forest plot | 1 | 53 | Risk Ratio (M‐H, Fixed, 95% CI) | 0.93 [0.45, 1.92] |
| 4 Oxytocin augmentation Show forest plot | 1 | 53 | Risk Ratio (M‐H, Fixed, 95% CI) | 1.04 [0.81, 1.32] |
| 5 Uterine rupture Show forest plot | 1 | 53 | Risk Ratio (M‐H, Fixed, 95% CI) | 0.0 [0.0, 0.0] |
| 6 Instrumental vaginal delivery Show forest plot | 1 | 53 | Risk Ratio (M‐H, Fixed, 95% CI) | 7.26 [0.39, 134.01] |
| 7 Postpartum haemorrhage Show forest plot | 1 | 53 | Risk Ratio (M‐H, Fixed, 95% CI) | 3.11 [0.13, 73.09] |
| 8 Chorioamnionitis Show forest plot | 1 | 53 | Risk Ratio (M‐H, Fixed, 95% CI) | 0.0 [0.0, 0.0] |
| Outcome or subgroup title | No. of studies | No. of participants | Statistical method | Effect size |
| 1 Caesarean section Show forest plot | 1 | 16 | Risk Ratio (M‐H, Fixed, 95% CI) | 0.97 [0.41, 2.32] |
| 2 Admission to neonatal unit Show forest plot | 1 | 20 | Risk Ratio (M‐H, Fixed, 95% CI) | 0.0 [0.0, 0.0] |
| Outcome or subgroup title | No. of studies | No. of participants | Statistical method | Effect size |
| 1 Oxytocin augmentation Show forest plot | 1 | 107 | Risk Ratio (M‐H, Fixed, 95% CI) | 0.54 [0.38, 0.76] |
| 2 Uterine rupture Show forest plot | 1 | 107 | Risk Ratio (M‐H, Fixed, 95% CI) | 0.29 [0.08, 1.02] |
| Outcome or subgroup title | No. of studies | No. of participants | Statistical method | Effect size |
| 1 Vaginal delivery not achieved within 24 hours Show forest plot | 1 | 80 | Risk Ratio (M‐H, Fixed, 95% CI) | 2.63 [1.32, 5.21] |
| 2 Caesarean section Show forest plot | 1 | 80 | Risk Ratio (M‐H, Fixed, 95% CI) | 1.0 [0.39, 2.59] |
| 3 Oxytocin augmentation Show forest plot | 1 | 80 | Risk Ratio (M‐H, Fixed, 95% CI) | 1.65 [1.17, 2.32] |
| 4 Uterine rupture Show forest plot | 1 | 80 | Risk Ratio (M‐H, Fixed, 95% CI) | 0.0 [0.0, 0.0] |
| 5 Epidural analgesia Show forest plot | 1 | 80 | Risk Ratio (M‐H, Fixed, 95% CI) | 1.0 [0.39, 2.59] |
| 6 Instrumental vaginal delivery Show forest plot | 1 | 80 | Risk Ratio (M‐H, Fixed, 95% CI) | 0.8 [0.23, 2.76] |
| 7 Meconium‐stained liquor Show forest plot | 1 | 80 | Risk Ratio (M‐H, Fixed, 95% CI) | 2.0 [0.19, 21.18] |
| 8 Apgar score < 7 at 5 minutes Show forest plot | 1 | 80 | Risk Ratio (M‐H, Fixed, 95% CI) | 1.67 [0.95, 2.93] |
| 9 Neonatal intensive care unit admission Show forest plot | 1 | 80 | Risk Ratio (M‐H, Fixed, 95% CI) | 2.5 [0.51, 12.14] |
| 10 Maternal nausea and vomiting Show forest plot | 1 | 80 | Risk Ratio (M‐H, Fixed, 95% CI) | 3.0 [0.33, 27.63] |
| 11 Puerperal pyrexia (other maternal side‐effects) Show forest plot | 1 | 80 | Risk Ratio (M‐H, Fixed, 95% CI) | 0.42 [0.16, 1.07] |
| 12 Palpitation (other maternal side‐effects) Show forest plot | 1 | 80 | Risk Ratio (M‐H, Fixed, 95% CI) | 2.5 [0.51, 12.14] |
| 13 Headache (other maternal side‐effects) Show forest plot | 1 | 80 | Risk Ratio (M‐H, Fixed, 95% CI) | 3.33 [0.99, 11.22] |
| 14 Postpartum haemorrhage Show forest plot | 1 | 80 | Risk Ratio (M‐H, Fixed, 95% CI) | 2.0 [0.90, 4.43] |
| 15 Woman not satisfied Show forest plot | 1 | 80 | Risk Ratio (M‐H, Fixed, 95% CI) | 1.75 [0.56, 5.51] |
| Outcome or subgroup title | No. of studies | No. of participants | Statistical method | Effect size |
| 1 Vaginal delivery not achieved within 24 hours Show forest plot | 1 | 154 | Risk Ratio (M‐H, Fixed, 95% CI) | 1.05 [0.91, 1.20] |
| 2 Caesarean section Show forest plot | 1 | 154 | Risk Ratio (M‐H, Fixed, 95% CI) | 1.05 [0.89, 1.24] |
| 3 Oxytocin augmentation Show forest plot | 1 | 154 | Risk Ratio (M‐H, Fixed, 95% CI) | 0.81 [0.66, 0.98] |
| 4 Uterine rupture Show forest plot | 1 | 154 | Risk Ratio (M‐H, Fixed, 95% CI) | 1.0 [0.06, 15.70] |
| 5 Epidural analgesia Show forest plot | 1 | 154 | Risk Ratio (M‐H, Fixed, 95% CI) | 0.0 [0.0, 0.0] |
| 6 Instrumental vaginal delivery Show forest plot | 1 | 154 | Risk Ratio (M‐H, Fixed, 95% CI) | 0.92 [0.43, 1.95] |
| 7 Apgar score < 7 at 5 minutes Show forest plot | 1 | 154 | Risk Ratio (M‐H, Fixed, 95% CI) | 1.0 [0.06, 15.70] |
| 8 Neonatal intensive care unit admission Show forest plot | 1 | 154 | Risk Ratio (M‐H, Fixed, 95% CI) | 2.0 [0.19, 21.60] |
| 9 Neonatal encephalopathy Show forest plot | 1 | 154 | Risk Ratio (M‐H, Fixed, 95% CI) | 3.0 [0.12, 72.52] |
| 10 Perinatal death Show forest plot | 1 | 154 | Risk Ratio (M‐H, Fixed, 95% CI) | 3.0 [0.12, 72.52] |
| 11 Neonatal infection Show forest plot | 1 | 154 | Risk Ratio (M‐H, Fixed, 95% CI) | 0.0 [0.0, 0.0] |
| 12 Cord prolapse (other maternal side‐effects) Show forest plot | 1 | 154 | Risk Ratio (M‐H, Fixed, 95% CI) | 0.0 [0.0, 0.0] |
| 13 Postpartum haemorrhage Show forest plot | 1 | 154 | Risk Ratio (M‐H, Fixed, 95% CI) | 0.33 [0.01, 8.06] |
| 14 Chorioamnionitis Show forest plot | 1 | 154 | Risk Ratio (M‐H, Fixed, 95% CI) | 0.33 [0.04, 3.13] |
| Outcome or subgroup title | No. of studies | No. of participants | Statistical method | Effect size |
| 1 Caesarean section Show forest plot | 1 | 200 | Risk Ratio (M‐H, Fixed, 95% CI) | 1.09 [0.74, 1.60] |
| 2 Oxytocin augmentation Show forest plot | 1 | 200 | Risk Ratio (M‐H, Fixed, 95% CI) | 1.5 [0.81, 2.78] |
| 3 Uterine hyperstimulation (FHR change not mentioned) Show forest plot | 1 | 200 | Risk Ratio (M‐H, Fixed, 95% CI) | 0.5 [0.05, 5.43] |
| 4 Uterine rupture Show forest plot | 1 | 200 | Risk Ratio (M‐H, Fixed, 95% CI) | 0.33 [0.01, 8.09] |
| 5 Apgar score < 7 at 5 minutes Show forest plot | 1 | 200 | Risk Ratio (M‐H, Fixed, 95% CI) | 0.8 [0.22, 2.89] |
| 6 Neonatal intensive care unit admission Show forest plot | 1 | 200 | Risk Ratio (M‐H, Fixed, 95% CI) | 0.75 [0.17, 3.27] |
| 7 Neonatal infection Show forest plot | 1 | 200 | Risk Ratio (M‐H, Fixed, 95% CI) | 1.0 [0.06, 15.77] |
| 8 Postpartum haemorrhage Show forest plot | 1 | 200 | Risk Ratio (M‐H, Fixed, 95% CI) | 1.0 [0.14, 6.96] |
| 9 Chorioamnionitis Show forest plot | 1 | 200 | Risk Ratio (M‐H, Fixed, 95% CI) | 1.0 [0.06, 15.77] |
| 10 Endometritis Show forest plot | 1 | 200 | Risk Ratio (M‐H, Fixed, 95% CI) | 1.5 [0.26, 8.79] |
| 11 Maternal intensive care unit admission (serious maternal complications) Show forest plot | 1 | 200 | Risk Ratio (M‐H, Fixed, 95% CI) | 0.0 [0.0, 0.0] |