Rehabilitación posquirúrgica para la estenosis lumbar
Resumen
Antecedentes
La estenosis lumbar es una causa común de dolor de espalda que también puede dar lugar a dolor en las nalgas, los muslos o las piernas, en particular al caminar. Existen varios tratamientos posibles disponibles, de los cuales la cirugía parece ser el mejor para restaurar la función y reducir el dolor. El resultado quirúrgico no es el ideal, y una proporción considerable de pacientes no recupera una buena función. No se conoce ningún enfoque aceptado a la atención posoperatoria basado en las pruebas — un hecho que ha impulsado la realización de esta revisión.
Objetivos
Determinar si los programas de rehabilitación activa después de la cirugía primaria por estenosis lumbar presentan un impacto sobre los resultados funcionales y si dichos programas son superiores a la “atención posoperatoria habitual”.
Métodos de búsqueda
Se hicieron búsquedas en las siguientes bases de datos desde sus primeros números hasta marzo 2013: CENTRAL (The Cochrane Library, número más reciente), registro de ensayos del Grupo de Revisión Cochrane de Espalda (Cochrane Back Review Group), MEDLINE, EMBASE, CINAHL y PEDro.
Criterios de selección
Se consideraron los ensayos controlados aleatorios (ECA) que comparaban la efectividad de la rehabilitación activa versus atención habitual en adultos (> 18 años de edad) con estenosis lumbar confirmada que habían sido sometidos a cirugía de descompresión espinal (con o sin fusión) por primera vez.
Obtención y análisis de los datos
Dos autores de la revisión extrajeron de forma independiente los datos de los ensayos incluidos mediante un formulario predesarrollado. Cuando fue necesario, se estableció contacto con los autores de los ensayos originales para solicitar datos no publicados adicionales. Se registraron las características iniciales de los participantes, las intervenciones, las comparaciones, el seguimiento y las medidas de resultado para permitir la evaluación de la homogeneidad clínica. La relevancia clínica se evaluó de forma independiente mediante el uso de cinco preguntas recomendadas por el Grupo de Revisión Cochrane de Espalda (CBRG) y el riesgo de sesgo de los estudios se determinó mediante el uso de los criterios del CBRG.
Cuando fue apropiado, los resultados de los estudios individuales se agruparon en un metanálisis. Para los resultados continuos, se calculó la diferencia de medias (DM) cuando se utilizaron las mismas escalas de medición en todos los estudios y la diferencia de medias estandarizada (DME) cuando se utilizaron diferentes escalas de medición. Cuando las medias informadas y las desviaciones estándar de los resultados indicaron que los datos de resultado eran asimétricos, se transformaron los datos a logaritmos para todos los estudios de la comparación y se realizó un metanálisis en la escala logarítmica. Los resultados de los análisis realizados en la escala logarítmica se volvieron a convertir a la escala original. Cuando no se encontraron pruebas considerables de heterogeneidad estadística, se utilizó un modelo de la varianza inversa de efectos fijos para medir el efecto del tratamiento. Cuando se detectó heterogeneidad estadística considerable, se utilizó un modelo de la varianza inversa de efectos aleatorios.
La medida de resultado primaria fue el estado funcional, según lo medido en una escala funcional específica de la espalda. Los resultados secundarios incluyeron medidas del dolor de la pierna, el dolor lumbar y la mejoría global / salud general. Se consideró la significación estadística y la relevancia clínica de los resultados. Se utilizó el abordaje GRADE para evaluar la calidad general de las pruebas para cada resultado sobre la base de cinco criterios, para lo cual las pruebas se clasificaron como de calidad alta a muy baja, según el número de criterios cumplidos.
Resultados principales
Las búsquedas obtuvieron 1726 resultados, y un total de tres estudios (n = 373 participantes) fueron incluidos en la revisión y metanálisis. Se consideró que todos los estudios tenían un riesgo de sesgo bajo; ningún estudio tuvo tasas de abandonos inadmisiblemente altas. Además, para el resultado primario, no se observaron tasas de abandonos inadmisiblemente desequilibradas, ni tasas de cumplimiento inadmisiblemente bajas, ni una falta de cumplimiento del protocolo ni diferencias iniciales desequilibradas claramente significativas.
Las pruebas de calidad moderada de tres ECA (N = 340) muestran que la rehabilitación activa es más efectiva que la atención habitual para el estado funcional (DME logarítmica ‐0,22; intervalo de confianza [IC] del 95%: ‐0,44 a 0,00; correspondiente a un porcentaje de mejoría promedio [reducción en la puntuación funcional estandarizada] del 20%, IC del 95%: 0% a 36%) y para el dolor lumbar informado (DM logarítmica ‐0,18; IC del 95%: ‐0,35 a ‐0,02; correspondiente a un porcentaje de mejoría promedio [reducción en la puntuación de la EAV] de 16%, IC del 95%: 2% a 30%). Por el contrario, las pruebas de baja calidad indican que la rehabilitación no es más efectiva que la atención habitual para el dolor de la pierna (DM logarítmica ‐0,17; IC del 95%: ‐0,52 a 0,19; correspondiente a un porcentaje de mejoría promedio [reducción de la puntuación de la EAV] del 16%, IC del 95%: 21% de empeoramiento a 41% de mejoría). Las pruebas de baja calidad de dos ECA (N = 238) indican que la rehabilitación no presenta ningún beneficio adicional en el estado de salud general en comparación con la atención habitual (DM 1,30; IC del 95%: ‐4,45 a 7,06).
Las pruebas de calidad moderada de tres ECA (N = 373) muestran que la rehabilitación es más efectiva que la atención habitual para el estado funcional (DME logarítmica ‐0,26; IC del 95%: ‐0,46 a ‐0,05; correspondiente a un porcentaje de mejoría promedio [reducción de la puntuación funcional estandarizada] del 23%, IC del 95%: 5% a 37%), para el dolor lumbar informado (DM logarítmica ‐0,20; IC del 95%: ‐0,36 a ‐0,05; correspondiente a un porcentaje de mejoría promedio [reducción de la puntuación de la EAV] del 18%, IC del 95%: 5% a 30%). Hay pruebas de calidad moderada (N = 373) y sobre el dolor de la pierna (DM logarítmica ‐0,24; IC del 95%: ‐0,47 a ‐0,01; correspondiente a un porcentaje de mejoría promedio [reducción de la puntuación de la EAV] del 21%, IC del 95%: 1% a 37%). Por el contrario, las pruebas de baja calidad de dos estudios (N = 273) sugieren que la rehabilitación no es más efectiva que la atención habitual en lo que se refiere a la mejoría en la salud general (DM ‐0,48; IC del 95%: ‐6,41 a 5,4).
Ninguno de los artículos incluidos informó eventos adversos relevantes.
Conclusiones de los autores
Las pruebas indican que la rehabilitación activa es más efectiva que la atención habitual para mejorar el estado funcional (relacionado con la espalda) a corto y a largo plazo. Se observaron hallazgos similares para los resultados secundarios, incluida la mejoría a corto plazo en el dolor lumbar y la mejoría a largo plazo en el dolor lumbar y el dolor de la pierna, aunque se observó un impacto limitado con relación a las mejorías en el estado de salud general. La relevancia clínica de estos efectos es de mediana a pequeña. La evaluación está limitada por el pequeño número de estudios relevantes identificados y se requiere más investigación.
PICO
Resumen en términos sencillos
¿El ejercicio puede ofrecer mejores resultados después de la cirugía de la espalda por estenosis espinal?
La estenosis espinal ocurre cuando el canal que atraviesan los nervios espinales se reduce y presiona los nervios, lo cual causa dolor en la espalda o las piernas. Tiende a suceder más a menudo en pacientes mayores. La cirugía puede ayudar a reducir la presión, pero aunque la mayoría de los pacientes encuentran que el dolor de la pierna mejora, no siempre se observa un alivio en el dolor lumbar, y los pacientes siguen presentando problemas para llevar a cabo las tareas diarias. Esta revisión se realizó para determinar si un programa supervisado de ejercicios (un programa de rehabilitación) después de la cirugía era más útil para los pacientes en la vida diaria que el asesoramiento habitual de permanecer activo.
Se encontró que se había realizado poco trabajo en esta área; sólo tres estudios fueron adecuados para la inclusión. En total, se incluyó a más de 300 participantes. Cada estudio incluyó un programa de rehabilitación de entre 30 y 90 minutos, administrado una o dos veces por semana e iniciado seis a 12 semanas después de la cirugía.
Se encontró que los programas de ejercicios especialmente diseñados para los pacientes sometidos a la cirugía de descompresión de la espalda pueden ayudar a aliviar el dolor lumbar y pueden mejorar la capacidad para realizar las tareas diarias. Lo anterior ocurrió tanto a corto plazo (dentro del plazo de los seis meses desde la cirugía) como a largo plazo (a los 12 meses). Debido a que sólo tres estudios fueron apropiados para su inclusión, no es posible tener la seguridad de que los estudios futuros no cambiarán estas conclusiones.
Authors' conclusions
Summary of findings
| Rehabilitation following surgery for lumbar spinal stenosis—short‐term outcomes | ||||||
| Patient or population: participants with lumbar spinal stenosis | ||||||
| Outcomes | Illustrative comparative risks* (95% CI) | Relative effect | No. of participants | Quality of the evidence | Comments | |
| Assumed risk | Corresponding risk | |||||
| Control | Rehabilitation after surgery | |||||
| Functional status, short term | Mean functional status short term ranged across control groups from | Mean functional status short term in the intervention groups was | 340 | ⊕⊕⊕⊝ | SMD on the log‐scale corresponds to 20% improvement (0% to 36% improvement) in the rehabilitation group. This difference is clinically relevant2 | |
| Leg pain, short term | Mean leg pain short term ranged across control groups from | Mean leg pain short term in the intervention groups was | 340 | ⊕⊕⊝⊝ | MD on the log‐scale corresponds to 16% improvement (21% worsening to 41% improvement). This difference is not statistically or clinically relevant5 | |
| Low back pain, short term | Mean low back pain short term ranged across control groups from | Mean low back pain short term in the intervention groups was | 340 | ⊕⊕⊕⊝ | MD on the log‐scale corresponds to 16% improvement (2% to 30% improvement) in low back pain. This difference is not clinically relevant5 | |
| General health, short term | Mean general health short term ranged across control groups from | Mean general health short term in the intervention groups was | 238 | ⊕⊕⊝⊝ | Mean difference is not statistically significant and is not clinically relevant | |
| Adverse Events ‐ not reported | See comment | See comment | Not estimable | See comment | None of the included studies reported any relevant adverse events | |
| *The corresponding risk (and its 95% confidence interval) is based on the assumed risk in the comparison group and the relative effect of the intervention (and its 95% CI). | ||||||
| GRADE Working Group grades of evidence. | ||||||
| 1Serious Inconsistency: due to direction. One of the three studies reported an average effect size that favoured the control; the other two favoured rehabilitation. | ||||||
| Rehabilitation following surgery for lumbar spinal stenosis—long‐term outcomes | ||||||
| Patient or population: participants with lumbar spinal stenosis | ||||||
| Outcomes | Illustrative comparative risks* (95% CI) | Relative effect | No. of participants | Quality of the evidence | Comments | |
| Assumed risk | Corresponding risk | |||||
| Control | Rehabilitation after surgery | |||||
| Functional status, long term | Mean functional status long term ranged across control groups from | Mean functional status long term in the intervention groups was | 373 | ⊕⊕⊕⊝ | SMD on the log‐scale corresponds to 23% improvement (5% to 37% improvement) in functional status. This difference is clinically relevant2 | |
| Leg pain, long term | Mean leg pain long term ranged across control groups from | Mean leg pain long term in the intervention groups was | 373 | ⊕⊕⊕⊝ | MD on the log‐scale corresponds to 21% improvement (1% to 37% improvement) in leg pain. This difference is not clinically relevant3 | |
| Low back pain, long term | Mean low back pain long term ranged across control groups from | Mean low back pain long term in the intervention groups was | 373 | ⊕⊕⊕⊝ | MD on the log‐scale corresponds to 18% improvement (5% to 30% improvement) in leg pain. This difference is not clinically relevant3 | |
| General health, long term | Mean general health long term ranged across control groups from | Mean general health long term in the intervention groups was | 273 | ⊕⊕⊝⊝ | Mean difference is not statistically significant or clinically relevant | |
| Adverse event—not reported | See comment | See comment | Not estimable | See comment | None of the included studies reported any relevant adverse events | |
| *The corresponding risk (and its 95% confidence interval) is based on the assumed risk in the comparison group and the relative effect of the intervention (and its 95% CI). | ||||||
| GRADE Working Group grades of evidence. | ||||||
| 1Serious Inconsistency: All studies were agreeable on the direction of the average effect, but only one study identified this to be a significant effect. | ||||||
Background
Spinal stenosis is a term used to describe narrowing of the spinal canal. This narrowing can put pressure on the nerve roots or spinal cord, causing pain, predominantly in the leg but also in the back. Decompression surgery is often performed to relieve this leg pain. Decompression surgery involves a posterior midline incision through the fascia and spinal muscles to obtain access to the compressed nerves. Constriction is reduced by removal of any excess bone, thickened ligaments, degenerate disc material and other fibrous tissue. Sometimes surgeons perform a fusion procedure at the same time, joining two vertebrae together to make the spine more stable.
Various surgical techniques are used in decompression surgery, the most common being a decompression laminectomy, whereby the structures compressing the nerve root are removed (Genevay 2010). When multiple nerve roots are involved, this often necessitates a fusion procedure. The use of spinal fusion is still widely debated, and a range of approaches and techniques and outcomes have been described (Gibson 2005). The concept of minimally invasive decompression surgery has been expanding over the past decade. Although it is aimed at minimising damage to associated musculature in the spine, minimally invasive decompression surgery remains a technically demanding procedure that awaits further scientific evaluation (Kim 2010b).
Decompression is one of the most common types of spinal surgery; rates seem to be increasing as a consequence of the ageing population (Chou 2009; Rhee 2006; Stromqvist 2001; Taylor 1994). The US Medicare system reported that more than 37,500 surgical procedures were performed for this condition in 2007 (Deyo 2010).
However, a sizeable proportion of participants do not regain good function after surgery, and the outcome of spinal decompression surgery is not ideal. 'Success' rates for decompression surgery vary considerably, with functional improvement ranging between 58% and 69% (Gunzburg 2003; Stromqvist 2001; Turner 1992), participant satisfaction ranging from 15% to 81% (Atlas 2005; McGregor 2002; Yee 2008) and gain in function and pain varying between studies (McGregor 2002; Yorimitsu 2001). Evidence of trunk muscle dysfunction has been noted in people with back problems (Hides 1994), and muscles are known to be damaged by surgery (Taylor 2002); thus rehabilitation would appear to be a promising approach to improving outcomes.
Postoperative care following spinal surgery is variable, with major differences reported between surgeons in the type and intensity of rehabilitation provided and in restrictions imposed and advice offered to participants (McGregor 2006). Postoperative management may include education (McGregor 2007), rehabilitation (Erdogmus 2007; McGregor 2010; Nielsen 2008; Ostelo 2009), exercise (Kim 2010), behavioural graded training (Ostelo 2004), neuromuscular training (Millisdotter 2007) and stabilisation training (Mannion 2007). Evidence is currently insufficient for researchers to determine best clinical practice, although indications suggest that some form of exercise or rehabilitation intervention may be beneficial. Given that this type of surgery is increasingly performed on the elderly, who are more likely to have comorbidities and poor preoperative functional status, the need for such interventions may be even greater in this population (Jakola 2010).
Description of the condition
This review focuses on participants who underwent surgery for lumbar spinal stenosis (LSS) when the diagnosis of LSS was confirmed by radiological evidence of central or lateral nerve root compression. These participants present with radicular pain with an associated neurological deficit or with neurogenic claudication (pain in the buttock, thigh or leg when walking that improves with rest). This review includes any surgical procedures aimed at relieving this nerve root compression and includes decompression surgery with and without fusion. Studies that focused on surgery for disc prolapse or spinal fusion for degenerative disc disease were excluded.
Description of the intervention
This review concerned active rehabilitation after surgery. We included only trials with one or more types of active rehabilitation programmes focused on functional outcomes, including group or therapist‐led active interventions that aimed to restore or improve functional status through a programme of exercises or educational materials encouraging activity. We focused on studies that are similar in terms of duration, content and timing of therapy, with rehabilitation starting between six and 12 weeks after surgery. Usual care includes no specific postoperative programme and consists of limited advice to stay active postoperatively and/or a brief general programme of exercises with the primary aim of preventing deep vein thrombosis.
How the intervention might work
Existing literature has suggested that muscle dysfunction is common in spinal patients (Hides 1994; Hodges 2009), and that further damage can occur to the muscles as a result of surgery (Rantanen 1993; Taylor 2002). This would imply that an active rehabilitation intervention may be of value in enhancing functional outcomes.
Why it is important to do this review
It is recognised that the type and extent of clinical management of patients after spinal surgery vary between surgeons; this is indicative of uncertainty as to how patients should be managed and reflects the lack of available evidence to justify some current practices (Carragee 1999; Kahanovitz 1989; Long 1992; Magnusson 1999; McGregor 2006). The purpose of this review is to determine whether postoperative active rehabilitation interventions after spinal surgery produce superior functional outcomes compared with usual postoperative care.
Objectives
To determine whether active rehabilitation programmes following primary surgery for lumbar spinal stenosis have an impact on functional outcomes and whether such programmes are superior to 'usual postoperative care'.
Methods
Criteria for considering studies for this review
Types of studies
Only randomised controlled trials (RCTs) were included in the review.
Types of participants
Adults 18 years of age or older who had spinal decompression surgery for central or lateral stenosis at single or multiple levels were included in this review. Stenosis had to be confirmed through imaging and clinical assessment, and the surgery performed had to be primary decompression surgery for stenosis (as distinct from surgery for disc herniation). We included all surgical decompression procedures, with or without vertebral fusion.
Types of interventions
This review examines the delivery of active rehabilitation after surgery. Interventions were classified as active rehabilitation or usual care. Postsurgical interventions included all forms of active rehabilitation treatment that aimed to restore or improve function. This encompasses all forms of group or therapist‐led exercise training or stabilisation training involving muscle‐strengthening exercises and flexibility training, as well as educational materials encouraging activity. Usual care ranged from limited advice provided postoperatively to stay active to a brief general programme of exercises with the primary aim of preventing deep vein thrombosis.
Types of outcome measures
We evaluated the standardised outcome measures recommended by the Cochrane Back Review Group (Furlan 2009), which are specified as follows.
-
Disease‐specific measure of functional and/or disability status, including the Oswestry Disability Index, the Roland Morris Disability Questionnaire Score, the Aberdeen Back Score and any other validated scale specific for back‐related disability.
-
Global measures of health, including the Short Form 36 (SF‐36)/the Short Form 12 (SF‐12)/EQ‐5D (a generic measure of health status).
-
Global improvement (proportion of participants recovered or improved, as measured by an overall judgement of improvement or treatment effectiveness).
-
Pain severity (self‐reported on a visual analogue scale (VAS) or a numerical rating scale (NRS)), when possible, separately for back and leg pain.
-
Work absenteeism (number of days of sick leave, proportion of individuals returning to work, employment status, number receiving disability pension, and proportion taking early retirement).
We report short‐term (within six months of surgery) and long‐term (12 months after surgery) outcomes separately. The analysis was carried out using two comparisons.
-
Effect of rehabilitation within six months postoperatively (short term).
-
Effect of rehabilitation at 12 months postoperatively (long term).
The decision to consider only the 12 months postoperative outcome (for long‐term follow‐up) was a reflection of the data available because only two of the included studies provided further postoperative follow‐up data.
We have accounted for any adverse events reported in the included studies.
Data on return to work were poorly and inconsistently reported and therefore were not considered in the analysis.
Primary outcomes
The primary outcome measure considered by this review was functional status as measured by a back‐specific scale (Roland Morris Disability Questionnaire (RMDQ) or Oswestry Disability Index (ODI)).
Secondary outcomes
Secondary outcomes included measures of pain severity (and location, i.e. back pain/leg pain) and global improvement/overall health.
Search methods for identification of studies
We used the updated search strategy recommended by the CBRG for RCTs (Furlan 2009). This strategy consists of the use of subject headings (MeSH) and text words, including methodological terms, disorder terms and treatment terms. No language restriction was used.
Electronic searches
We searched the following databases from their first issues to March 2013: CENTRAL (The Cochrane Library, most recent issue (March 2013), which includes the CBRG Trials Register (Appendix 1); MEDLINE (Appendix 2); EMBASE (Appendix 3); CINAHL (Appendix 4); and PEDro (Appendix 5).
Searching other resources
We also employed the following search strategies.
-
Screened the reference lists of all relevant papers.
-
Communicated with content experts in the field and with authors of identified RCTs.
Data collection and analysis
Methods used in conducting this review are in accordance with those provided in the Cochrane Handbook for Systematic Reviews of Interventions (Higgins 2011) and the Updated Method Guidelines for Systematic Reviews from the Cochrane Back Review Group (Furlan 2009).
Authors of individual trials were excluded from any decisions regarding inclusion/exclusion, data extraction and risk of bias.
Selection of studies
Two review authors (AMcG and KP) independently screened the search results by reading titles and abstracts. Potentially relevant studies were obtained in full text and were independently assessed for inclusion by two review authors. Disagreement was resolved through discussion. A third, fourth and fifth review author (AKB, JF and FB) adjudicated unresolved disagreements. AMcG was not involved in the decision to include the study McGregor 2010, for which she served as first author.
Data extraction and management
We extracted data onto a separate, predeveloped form. Basic information was collected from each study concerning methods (study design, sample size, etc.), participants (selection criteria and diagnoses, age, gender, etc.), type of surgery, intervention treatment, control treatment and outcome variables with results. Data extraction was performed independently by two review authors (KP and SC); inconsistencies were resolved as previously outlined.
Assessment of risk of bias in included studies
We assessed the risk of bias in included RCTs using the 12 criteria recommended by the CBRG, along with the additional item, 'Other sources of bias' (Appendix 6; Furlan 2009; Higgins 2011). For each study, each criterion was rated as 'low risk', 'high risk' or 'unclear risk'.
Studies with a low risk of bias were defined as RCTs that satisfied six or more of the low risk of bias criteria and that had no serious flaws (Furlan 2009). We predefined serious flaws to include unacceptably high dropout rates (e.g. greater than 50% at first and subsequent time points); unacceptably unbalanced dropout rates (e.g. 40% greater dropout rate in one group); unacceptably low adherence rates (e.g. less than 50% with total or nearly total non‐adherence to the protocol); and clear, significantly unbalanced baseline differences for the primary outcome (functional status) that were not accounted for in the analysis. Study‐specific serious flaws were also considered. We present results in a 'Risk of bias' table and discuss them accordingly in the main text.
Measures of treatment effect
Identified studies were evaluated as clinically homogeneous regarding study populations, types of interventions and types of follow‐up and outcomes, allowing us to perform meta‐analysis to pool treatment effects.
For continuous outcomes, we calculated a pooled mean difference (MD) when the same measurement scale was used and a standardised mean difference (SMD) when different measurement scales were used. For each pooled outcome, an associated 95% confidence interval (95% CI) was computed. When continuous outcome data were skewed (see 'Data synthesis' and Additional Table 1) and consequently meta‐analysis was conducted on the log‐scale, interpretation of the resulting pooled intervention effects changed. Pooled mean differences on the log‐scale were converted back to the original state using the anti‐log, EXP(), to give a ratio of geometric means on the unlogged scale. Ratios are also expressed as percentage differences to aid interpretation of relative differences in original untransformed outcome variables between intervention groups (Bland 1996).
| Experimental | Control | Experimental | Control | Experimental | Control | |||||||
| Outcome | Mean (SD) | Mean/SD1 | Mean (SD) | Mean/SD1 | Mean (SD) | Mean/SD1 | Mean (SD) | Mean/SD1 | Mean (SD) | Mean/SD1 | Mean (SD) | Mean/SD1 |
| Short term | ||||||||||||
| Functional status | 22.5 (17.8) | 1.3 | 26.4 (19.1) | 1.4 | 8.6 (5.3) | 1.6 | 8.7 (5.8) | 1.5 | 27.0 (18.0) | 1.5 | 32.0 (19.0) | 1.7 |
| Leg pain | 24.0 (24.0) | 1.0 | 35.0 (29.0) | 1.2 | 29.0 (24.8) | 1.2 | 24.0 (25.0) | 1.0 | 32.0 (27.0) | 1.2 | 38.0 (28.0) | 1.4 |
| Back pain | 14.0 (18.0) | 0.8 | 20.0 (26.0) | 0.8 | 29.5 (29.0) | 1.0 | 24.3 (26.0) | 0.9 | 33.0 (26.0) | 1.3 | 41.0 (29.0) | 1.4 |
| General health | 71.5 (20.9) | 3.4 | 74.0 (20.0) | 3.7 | 71.0 (23.0) | 3.1 | 66.0 (24.0) | 2.8 | ||||
| Long term | ||||||||||||
| Functional status | 24.8 (19.1) | 1.3 | 31.0 (20.1) | 1.5 | 8.9 (6.0) | 1.5 | 9.1 (5.7) | 1.6 | 29.0 (21.0) | 1.4 | 34.0 (22.0) | 1.5 |
| Leg pain | 28.0 (29.0) | 1.0 | 35.0 (31.0) | 1.1 | 32.5 (28.3) | 1.1 | 33.0 (30.0) | 1.1 | 33.0 (31.0) | 1.1 | 43.0 (30.0) | 1.4 |
| Back pain | 16.0 (20.0) | 0.8 | 24.0 (26.0) | 0.9 | 28.6 (25.5) | 1.1 | 32.0 (27.0) | 1.2 | 38.0 (30.0) | 1.3 | 42.0 (29.0) | 1.4 |
| General health | 67.0 (23.9) | 2.8 | 70.0 (22.0) | 3.2 | 67.0 (26.0) | 2.6 | 64.0 (25.0) | 2.6 | ||||
| Note: Mean/SD < 2 Indicates skewed data (Higgins 2011). | ||||||||||||
1When mean/SD < 2 indicating skewness data was log‐transformed for analysis in accordance with the methods outlined in the Cochrane Handbook for Systematic Reviews of Interventions.
The clinical relevance of each included study was independently assessed by the review authors using the five questions outlined in Appendix 7 (Furlan 2009).
We evaluated the statistical importance and the clinical importance of pooled results. Effect sizes were assessed and interpreted using Cohen’s levels, as outlined in Appendix 7 (Higgins 2011).
Unit of analysis issues
The unit of analysis was the participant. One of the included studies (Mannion 2007) compared two treatment groups against one usual care group. This raised a unit of analysis problem, as in a meta‐analysis, every individual must appear only once in every comparison. So that all individuals and both of the treatment groups could be included, the two treatment groups were combined into one treatment group (as compared with one control group). This is a recommended approach and is in accordance with the Cochrane Handbook for Systematic Reviews of Interventions (Higgins 2011).
Dealing with missing data
We contacted the authors of trials when further information was required. In two of the papers selected, only subgroups were suitable for inclusion in the review; relevant data from these subgroups were not published in the papers but were retrieved directly from the authors.
Assessment of heterogeneity
We assessed clinical and methodological heterogeneity by examining characteristics of study participants, types of interventions, comparisons, follow‐up and assessment of primary and secondary outcomes. We used the Chi2 test and the I2 statistic to assess statistical heterogeneity of studies assessed as clinically homogeneous. A P value for the Chi2 test of less than 0.05 or I2 > 50% was considered to indicate significant statistical heterogeneity. Forest plots were also used to assess heterogeneity visually. We inspected the forest plots for the degree of overlap of the confidence intervals of included studies, which is another indication for the presence of heterogeneity.
Assessment of reporting biases
We searched trial registers and published reports of trials to look for any inconsistencies between published trials and registered trials. We planned to assess the presence of possible publication bias and heterogeneity using funnel plots. For continuous outcomes, we planned to use the test proposed by Egger 1997 to formally assess the presence of possible publication bias. As a rule of thumb, tests for funnel plot asymmetry should be used only when at least 10 studies are included in the meta‐analysis (Higgins 2011); therefore, given the small number of identified studies (N = 3), we did not proceed with this proposed analysis.
Another method used to assess whether publication bias was present was to consider the significance levels associated with the statistical test used in the primary studies (Normand 1999). Because none of the primary studies included in this analysis reported significant results, publication bias seems unlikely. However, with this method, the possibility of publication bias cannot be ruled out, as generally even when non‐significant results are published, there could be studies that were not published, as journals typically are more likely to publish results that establish a difference than those that do not (Normand 1999).
Data synthesis
We first assessed the studies for clinical heterogeneity. As a sufficient number (≥ 2) of clinically similar studies (not significantly heterogeneous) were available, the results were pooled in meta‐analyses using Review Manager software (Review Manager 2011).
A fixed‐effect inverse variance model was used to pool results when no substantial evidence of statistical heterogeneity was found (Chi2 P > 0.05, I2 ≤ 50%). When substantial statistical heterogeneity was detected, a random‐effects inverse variance model was used as an alternative.
Because the inverse variance method that was chosen to pool treatment effects in this review requires approximately normally distributed data to obtain valid results, in accordance with guidelines set out in the Cochrane Handbook for Systematic Reviews of Interventions, before performing the data synthesis, we performed a test for skewness on all outcome data using reported means and standard deviations of the outcomes.
Skewed outcome data were detected for a trial in a comparison when the mean outcome divided by the standard deviation in the treatment or control group was < 2 (Altman 1996).
Calculations identified that the data for functional status, leg pain and low back pain were skewed in both arms in all three studies (Table 1), so we log‐transformed these data for analysis. In all three studies, the authors published or provided the means and standard deviations of the unlogged data, enabling us to use method 1 in Higgins 2008 to calculate the mean and the standard deviation on the log‐scale. This was done in accordance with recommendations provided in the Cochrane Handbook for Systematic Reviews of Interventions (Higgins 2011). Method 1 of Higgins involves applying a log‐transformation to the observed mean and standard deviation in each treatment group (transformation formulae detailed in Higgins 2008); this method was selected because it allows for different standard deviations in each treatment group.
We assessed the overall quality of the evidence for each outcome using the GRADE approach, as recommended in the Cochrane Handbook for Systematic Reviews of Interventions (Higgins 2011) and adapted in the Updated Method Guidelines for Systematic Reviews in the Cochrane Back Review Group (Furlan 2009). The quality of the evidence on a specific outcome is based on the performance of the studies against five criteria: (1) study design and limitations, (2) consistency of results, (3) directness (generalisability), (4) precision (sufficient data) and (5) reporting of results across all studies that measure that particular outcome.
Study design and limitations refer to the results of the risk of bias assessment, as outlined above. Consistency of results refers to the similarity of treatment effects of the individual studies included in the meta‐analysis with respect to direction, effect size and statistical significance. Inconsistency in direction was noted if less than 75% of the included studies showed benefit or no benefit; inconsistency in effect size was noted if less than 75% of the studies showed a clinically important or unimportant effect size (Appendix 7); and inconsistency with respect to statistical significance was documented if the Chi2 test for heterogeneity revealed significant statistical heterogeneity (P < 0.05). Directness refers to the comparability of participants, interventions and outcomes of the included trials. Any identified concerns regarding comparability of the studies included in the meta‐analysis were described. Imprecision refers to the number of participants included in the meta‐analysis and the width of the 95% CI that accompanies the pooled treatment effect. If the 95% CI could support the intervention or control group, it was judged as insufficiently wide. Any concerns regarding the numbers of participants included were to be discussed. The fifth criterion—publication bias—refers to the probability of selective publication of trials and outcomes. Any publication bias concerns were to be noted and described alongside the presented GRADE results.
The overall GRADE quality rating starts at high when RCTs with a low risk of bias provide results for the outcome, and it is reduced by one level for each of the criteria not met as outlined below.
High‐quality evidence:Findings among at least 75% of RCTs are consistent with no limitations of study design or consistent, direct and precise data and no known or suspected publication biases. Further research is unlikely to change the estimate or our confidence in the results.
Moderate‐quality evidence: One of the domains is not met. Further research is likely to have an important impact on our confidence in the estimate of effect and may change the estimate.
Low‐quality evidence: Two of the domains are not met. Further research is very likely to have an important impact on our confidence in the estimate of effect and is likely to change the estimate.
Very low‐quality evidence: Three of the domains are not met. We are very uncertain about the results.
No evidence: No RCTs were identified that addressed this outcome.
Sensitivity analysis
We planned to perform sensitivity analyses to determine the validity of the review findings, in particular to explore the robustness of results by study quality if a sufficient number of trials (≥ 10) were found. Because of the small number of identified studies (3), we did not proceed with the proposed sensitivity analyses.
Results
Description of studies
In total, three studies (N = 373 participants) met the inclusion criteria and were considered in this review. All three trials were clinically homogeneous regarding the baseline characteristics of participants and outcome measures. Interventions were comparable regarding starting point, type, intensity and duration of treatment. Interventions were started at six weeks postoperatively (McGregor 2010), two months postoperatively (Mannion 2007) and three months postoperatively (Aalto 2011). Intervention duration ranged from six weeks, with twice‐weekly 60‐minute sessions (McGregor 2010), to 12 weeks, with a 90‐minute session once a week (Aalto 2011), or 12 weeks, with twice‐weekly 30‐minute sessions (Mannion 2007).
The control groups in all trials were comparable, insofar as they did not include specific postoperative interventions and were treated with either "usual care" or "self management" and were given either advice postoperatively to “stay active” or a brief general programme of exercises with the primary aim of preventing deep vein thrombosis, or both.
Results of the search
In total, the search, after duplicates were removed, yielded 1,726 results. Titles and abstracts were screened, and 1,712 records were excluded. Papers were excluded primarily for one of the following reasons: incorrect type of surgery (e.g. discectomy), comparison of surgical interventions, comparison of surgery with conservative interventions, investigation of conservative treatment for low back pain, focus on rehabilitation for other conditions such as knee replacement, cardiovascular illness, etc., or they were review papers. Fourteen records were retrieved in full text, and 11 of them were excluded for reasons that can be found in Characteristics of excluded studies. The remaining three studies were included in the review. See also Figure 1.

Study flow diagram.
Included studies
In total, three studies were included in the review; characteristics of these studies can be found in Characteristics of included studies.
These three studies included a total of 373 participants; however, as not all of the participants attended the short‐term follow‐up assessment in McGregor 2010, fewer participants (340) are included in the meta‐analysis of the short‐term follow‐up outcomes than were included for the long‐term follow‐up outcomes. Although McGregor 2010 had greater follow‐up at 12 months (the study's primary endpoint) than at three months, sensitivity analyses conducted by McGregor et al verified consistent findings with different missing data assumptions, giving us no reason to exclude this study.
The included studies were similar with regard to baseline characteristics (Table 2); however, some unexplained heterogeneity with respect to gender and age was noted. Mannion 2007 analysed a greater number of male participants (59% vs 41% and 51.5%) who on average were five years older than those in the other two studies. For the purposes of this review, it was decided that the studies were similar enoughthat their data should be pooled for meta‐analysis.
| Age, years | 62.5 (34 to 86; 11.1) | 67.1 (10.6) | 62 (15) |
| BMI | 29.5 (4.0) | 27 (4.5) | 27(5) |
| Gender: female/male | 59%/41% | 41%/59% | 49.5%/51.5% |
Postoperative baseline values of outcome variables at the start of the intervention (Table 3) were also assessed for each included study and were found to be adequately similar between groups. Baseline values for functional outcome in Mannion 2007 were less than those in the other two studies. This may be due to the slightly later starting point of the intervention in this trial. Baseline imbalances between rehabilitation and control groups were noted for the outcome 'leg pain' in Mannion 2007, which in a (relatively small) randomised trial can happen through chance alone (Higgins 2011).
| Reha mean (SD) | Control mean (SD) | Reha mean (SD) | Control mean (SD) | Reha mean (SD) | Control mean (SD) | |
| Functional status | 24.3 (15.9) | 29.7 (20,5) | 10.9 (4.9) | 10.6 (4.7) | 30(18) | 32(21) |
| Low back pain (VAS 0 to 100) | 16 (19) | 20 (26) | 24.6 (19.8) | 29 (21) | 35 (26) | 35 (29) |
| Leg pain (VAS 0 to 100) | 27 (26) | 32 (28) | 29.5 (22.9) | 22 (24) | 33 (27) | 32 (28) |
| General health (VAS 100 to 0) | ‐ | ‐ | 68.6 (21) | 69 (26) | 69 (22) | 66 (26) |
Excluded studies
Eleven studies that were retrieved in full text were excluded for various reasons (see Characteristics of excluded studies).
Risk of bias in included studies
All included studies were rated as having low risk of bias because they fulfilled six or more of the risk of bias criteria and had no serious flaws. No study had unacceptably high dropout rates, and no unacceptably unbalanced dropout rates, unacceptably low adherence rates or total or nearly total non‐adherence to the protocol was noted; clearly significantly unbalanced baseline differences for the primary outcome (functional status) were not accounted for in the analysis. The main risk of bias within all of the included studies was lack of blinding, which could not be avoided because of the nature of the intervention under study.
See also Figure 2, which provides review authors' judgements about each risk of bias item for each included study.

Risk of bias summary: review authors' judgements about each risk of bias item for each included study.
Allocation
Two studies showed an unclear risk of selection bias because this was not adequately described in the papers.
Blinding
Within all three included studies, high risk of performance bias was assessed because participants and care providers had knowledge of the allocated interventions during the studies. Blinding of participants and care providers across studies was not feasible because of the nature of the intervention. Consequently, high risk of detection bias was associated with knowledge of the allocated intervention by outcome assessors, as outcomes are participant reported and the participants were not blinded.
Incomplete outcome data
Low risk of attrition bias was detected. Dropout rates were described and acceptable.
Selective reporting
Low risk of reporting bias was determined because the study protocol was available and all of the study's prespecified primary and secondary outcomes of interest for this review were reported, or because when the study protocol was not available, it was clear that the published report included all expected outcomes.
Other potential sources of bias
Groups were similar at baseline across all included studies regarding demographic factors and the most important prognostic factors. Co‐interventions were avoided or were the same between groups. Compliance was not adequately described in two studies; this shows an unclear risk of bias. The timing of outcome assessments was similar between studies.
Effects of interventions
See: Summary of findings for the main comparison Rehabilitation following surgery for lumbar spinal stenosis—short‐term outcomes; Summary of findings 2 Rehabilitation following surgery for lumbar spinal stenosis—long‐term outcomes
All three included studies reported the primary outcome of interest—functional status—and the secondary outcomes—leg pain and low back pain. In addition, two of the included studies reported the secondary outcome of general health.
None of the included studies reported any relevant adverse events: Aalto 2011 reported no adverse events, as did McGregor 2010. Mannion 2007 reported that one participant had to stop exercising because of increased pain, but this participant did not belong to the relevant subgroup included in this review.
McGregor 2010 reported short‐term outcomes at three months, Mannion 2007 at five months, and Aalto 2011 at six months. All three trials reported long‐term outcomes at 12 months postoperatively. We judged the three identified studies to be clinically homogeneous regarding study population, types of interventions, comparisons, follow‐up and outcome, allowing us to perform a meta‐analysis to pool treatment effects across all three studies.
-
Outcomes in the short term (within six months)
In the short term, moderate‐quality evidence from three RCTs (340 people) indicate that active rehabilitation is more effective than usual care for functional status (log SMD ‐0.22, 95% CI ‐0.44 to 0.00, corresponding to an average percentage improvement (reduction in standardised functional score) of 20%, 95% CI 0% to 36%; Figure 3), and moderate quality evidence (from three RCTs, 340 people) suggest that rehabilitation is more effective than usual care for reported low back pain (log MD ‐0.18, 95% CI ‐0.35 to ‐0.02, corresponding to an average percentage improvement (reduction in VAS score) of 16%, 95% CI 2% to 30%; Figure 4).

Forest plot of comparison: 1 Short term, outcome: 1.1 Functional status short term on log‐scale.

Forest plot of comparison: 1 Short term, outcome: 1.3 Low back pain short term on log‐scale.
Low‐quality evidence from three RCTs (340 people) show no statistically significant difference in leg pain (log MD ‐0.17, 95% CI ‐0.52 to 0.19, corresponding to an average percentage improvement (reduction in VAS score) of 16%, 95% CI 21% worsening (increase in VAS) to 41% improvement (decrease in VAS)) between individuals who received active rehabilitation and those who received usual care (Figure 5). Low‐quality evidence from two RCTs (238 people) reveal no statistically significant difference in general health (MD 1.30, 95% CI ‐4.45 to 7.06) between individuals who received rehabilitation and those who received usual care (Figure 6).

Forest plot of comparison: 1 Short term, outcome: 1.2 Leg pain short term on log‐scale.

Forest plot of comparison: 1 Short term, outcome: 1.4 General health.
-
Outcomes over the long term (12 months postoperative)
Over the long term, moderate‐quality evidence from three RCTs (373 people) indicate that active rehabilitation is more effective than usual care for functional status (log SMD ‐0.26, 95% CI ‐0.46 to ‐0.05, corresponding to an average percentage improvement (reduction in standardised functional score) of 23%, 95% CI 5% to 37%; Figure 7).

Forest plot of comparison: 2 Long term, outcome: 2.1 Functional status long term on log‐scale.
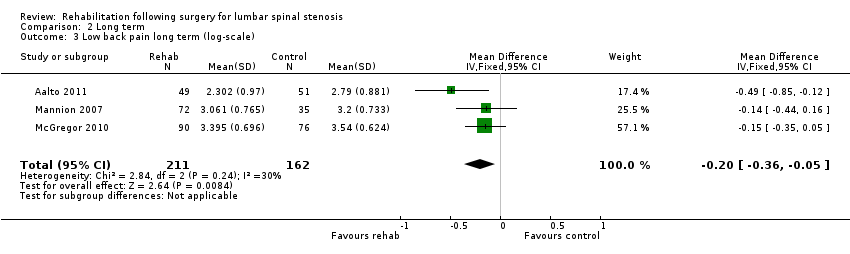
Moderate‐quality evidence from three RCTs (373 people) suggest that active rehabilitation is more effective than usual care for low back pain (log MD ‐0.20, 95% CI ‐0.36 to ‐0.05, corresponding to an average percentage improvement (reduction in VAS score) of 18%, 95% CI 5% to 30%; Figure 8).

Forest plot of comparison: 2 Long term, outcome: 2.3 Low back pain long term on log‐scale.
Moderate‐quality evidence from three RCTs (373 people) also suggest that active rehabilitation is more effective than usual care for leg pain (log MD ‐0.24, 95% CI ‐0.47 to ‐0.01, corresponding to an average percentage improvement (reduction in VAS score) of 21%, 95% CI 1% to 37%; Figure 9).

Forest plot of comparison: 2 Long term, outcome: 2.2 Leg pain long term on log‐scale.
Low‐quality evidence from two RCTs (273 people) show no statistically significant difference in general health (MD ‐0.48, 95% CI ‐6.41 to 5.4) between individuals who receive rehabilitation and those who receive usual care (Figure 10).

Forest plot of comparison: 2 Long term, outcome: 2.4 General health long term.
As the main analyses were performed on logarithmic scales for the outcomes of functional status, leg pain and low back pain, sensitivity analyses were conducted, and all log‐transformed data were additionally analysed on the raw scales. These analyses did not produce valid results; this finding supports our expectation that data could not be analysed on the original scales because they were skewed.
-
Effect sizes
To interpret effect sizes, Cohen’s three levels were used (Cohen 1988). These levels of effect sizes serve as a rule of thumb for interpreting the magnitude of the effect and are recommended for consideration by the CBRG (Furlan 2009). However, some methodologists believe that such interpretations are problematic because the clinical importance of a finding is always context‐dependent and is not amenable to generic statements (Higgins 2011). Even if an effect is interpreted as small, it may well be meaningful to an individual participant, or it may be clinically meaningful, depending on the setting and the circumstances, and the other way around—even if an effect is interpreted as large, it may not be considered an important effect by an individual participant, or it may not be clinically meaningful—again, depending on the setting and the circumstances. Thus both clinical meaningfulness and meaningfulness of the results from the participant perspective should be assessed to validate the effects found.
We have also used established predefined outcome‐specific minimal clinically important differences (Appendix 7) to interpret effect sizes. The minimum clinically important difference (MCID) represents "the smallest change that is important to patients" (Copay 2008), making this a pertinent evaluation criterion for use in measuring treatment effectiveness.
Consideration of the magnitude of the effects (differences between groups when the data are analysed on the raw scale, or relative differences between groups when the data are analysed on the logged scale) based on Cohen’s levels and predefined outcome‐specific clinically relevant effect sizes (Appendix 7) indicates that in the short term, on average a clinically significant medium effect of rehabilitation on functional status is noted (above the predefined relative functional outcome threshold of 8% to 12% for clinical relevance). A medium effect of rehabilitation on low back pain has been observed; however, this finding is not clinically significant, as it is below the predefined clinically relevant difference for low back pain of 30%. The effects of rehabilitation on leg pain and general health are small and are neither statistically nor clinically significant.
Over the long term, on average a clinically significant medium effect of rehabilitation on functional status has been reported. A medium effect of rehabilitation on low back pain has been noted, but this is not clinically significant because it is below the predefined clinically relevant difference of 30% for low back pain. The effects of rehabilitation on leg pain and on general health are small and statistically significant but are not clinically significant because they are below the predefined clinically relevant difference for leg pain.
In other words, the difference between the effect of active rehabilitation and the effect of usual care is medium to small. It must be noted, however, that this result has yet to be validated, should be considered in context and is dependent on setting and circumstances in practice. The importance of the observed medium or small effect is influenced by when it occurs, where it occurs and for whom it occurs (Ellis 2010). Clinical meaningfulness of the treatment effect must be determined by a multi‐factorial evaluation of the benefits and risks of the treatment and of other available treatments for the condition with regard to important outcomes (Dworkin 2009), as well as by validation of the results from the participant's perspective.
Discussion
Summary of main results
Pooled results indicate that active rehabilitation is clinically more effective than usual care in improving both short‐term and long‐term functional status, and moderate‐quality evidence supports this. Moderate‐quality evidence suggests that active rehabilitation is more effective than usual care for short‐term (within six months postoperatively) improvement in low back pain and for long‐term (12 months postoperatively) improvement in low back pain and leg pain. However, observed pooled differences in low back pain were smaller than the predefined clinically relevant difference for low back pain improvement in both long‐term and short‐term follow‐up. The observed pooled difference for leg pain in the long term was also smaller than the predefined clinically relevant difference. With respect to changes in other secondary outcomes, active rehabilitation could not be confirmed to be more effective than usual care in both short‐term and long‐term follow‐up; however, these results should be interpreted cautiously because the quality of the evidence was low.
No adverse events were reported.
The main findings of this review are summarised in summary of findings Table for the main comparison and summary of findings Table 2.
Overall completeness and applicability of evidence
Only three studies were suitable for inclusion in this review, and for two of these, only subgroups of the original study population met the inclusion criteria for this review. However, we were successful in obtaining required data for these subgroups directly from the study authors. This allowed us to include these studies and to determine the effects of active rehabilitation after surgery for lumbar spinal stenosis, as was originally intended.
The diagnosis of spinal stenosis in the study populations was consistent between studies. Although local variations in surgical procedures may have occurred, the intention to relieve nerve root compression was common to all participants, and their surgery did not necessitate a fusion procedure nor the need for instrumentation. Postoperative usual care varies widely between surgeons and regions, but in the included studies, this typically included only advice to stay active. Previous research has demonstrated great variability in postoperative management across the UK; less is known with respect to the rest of the world, but literature reviews suggest that structured active postoperative rehabilitation is at present rare. However, sufficient commonality between the included studies was seen in terms of outcome measures and follow‐up data to allow performance of a meta‐analysis of pooled treatment effects and application of our results to the population intended.
All included studies measured and reported functional status, which was the primary outcome considered in this review, allowing us to assess the impact of rehabilitation on function.
In addition, all included studies measured and reported low back pain and leg pain. Only two studies measured and reported quality of life. High‐quality evidence was insufficient to fully reveal the impact of rehabilitation on general health. We found no additional outcomes in these trials that we had not prespecified for investigation, confirming the appropriateness of our outcomes.
Clinical relevance
The effect of active rehabilitation on the main outcome of functional status is clinically significant in the short term and over the long term, and the effect size is medium when viewed in the context of Cohen’s levels. The effect of active rehabilitation on the secondary outcomes of low back pain and leg pain is not clinically significant, as effect sizes are below the predefined clinically relevant relative differences for these two outcomes.
All three included studies comprised a range of surgical approaches and focused on the criteria for surgery as opposed to the surgical approach; therefore, these results are applicable to the diverse range of surgical approaches used to decompress the lumbar spine.
Quality of the evidence
In total, three studies, including a total of 373 participants, could be included in this review.
Although the risk of bias of the three studies can be considered low, it should be noted that participant and practitioner blinding was not implemented in any of the included studies, and this was an inevitable consequence of the nature of the intervention.
The quality of findings ranks from moderate to low across the different outcomes. The main limiting factor, which was the reason for a decrease in quality in some outcomes, was the inconsistency of results across the small number of included studies. With only three studies included, it is important to acknowledge the large potential impact if the average effect of one study differs in size or direction. More studies are required to permit assessment of the impact of these inconsistencies and to allow conclusions based on higher quality of evidence. Further research is also needed to obtain higher‐quality evidence on the effects of active rehabilitation on leg pain and low back pain in the short term and on general health in the short term and over the long term. Only low‐level evidence was available for these outcomes, meaning that these pooled results must be interpreted with caution. Only two of the included studies provided data on general health. The results of these two studies were contradictory, so it was not possible for the review authors to draw any robust conclusions with respect to general health.
Moderate‐quality evidence was obtained for our primary outcome—functional status—in both short‐term and long‐term follow‐up, as well as for leg pain and low back pain over the long term, allowing us to reach a more robust conclusion for these long‐term outcomes.
Potential biases in the review process
As only three studies were identified, we were unable to perform sensitivity analysis to investigate the effect of study quality on bias. Generally, however, the included studies were deemed to have low risk of bias. Blinding was not implemented in any of the included studies, but this was a limitation of the intervention itself.
Agreements and disagreements with other studies or reviews
Spinal surgery to relieve leg pain is routine and is commonly performed for disc herniation and for spinal stenosis. McGregor 2010 suggested that outcomes may be influenced by underlying pathology. It was postulated that as spinal stenotic patients are older and have lesser preoperative function and consequently a greater risk of comorbidities, they would have a greater need for rehabilitation to improve the functional outcome of surgery, but they experience lower levels of improvement after surgery as a consequence of their age, comorbidities and reduced function. Therefore, we have compared this review with the literature on decompression surgery for disc herniation and spinal fusion surgery performed for instability and low back pain.
A recent updated Cochrane review of postoperative rehabilitation after surgery to relieve a disc herniation (Ostelo 2009) indicated that active rehabilitation led to a faster decrease in pain and disability than no treatment, with some suggestion that the rehabilitation provided should be of high intensity. However, since the time of that publication, several new studies have emerged, and a further update to this topic is under way.
Nielsen 2010 explored the outcomes of spinal decompression surgery in participants with degenerative disc disease. However, this study included both preoperative and postoperative rehabilitation, which consisted of exercise, dietary changes and general advice. Outcomes compared with those following usual care were positive, suggesting a beneficial impact on functional recovery and on hospital length of stay, and lending further support to the benefits of rehabilitation provided to spinal surgery patients. This study was excluded from the current review because of the combined complex intervention.
Other investigations into the provision of postoperative rehabilitation have explored spinal surgery performed in conjunction with a fusion procedure. Rushton 2012 performed a systematic review of the literature; these investigatorsnoted very low‐quality evidence supporting the use of postoperative rehabilitation and highlighted that best practice in relation to rehabilitation was unclear.
In this review, we excluded the Abbott 2010 study, which compared exercise therapy after fusion surgery with cognitive‐behavioural therapy because no usual care control arm was included in this study. Nevertheless, it is worth noting that this work suggested that additional improvements could be achieved through the inclusion of psychomotor therapy. Similarly, Christensen 2003 indicated that simple support provided through a back‐café group achieved greater improvements in physical function than were attained through regular exercise classes. The intervention was instigated only three months after surgery; again, no control arm was included, but study findings do support the inferences of the Abbott 2010 study and warrant consideration in the design of future rehabilitation strategies.

Study flow diagram.

Risk of bias summary: review authors' judgements about each risk of bias item for each included study.

Forest plot of comparison: 1 Short term, outcome: 1.1 Functional status short term on log‐scale.

Forest plot of comparison: 1 Short term, outcome: 1.3 Low back pain short term on log‐scale.

Forest plot of comparison: 1 Short term, outcome: 1.2 Leg pain short term on log‐scale.

Forest plot of comparison: 1 Short term, outcome: 1.4 General health.

Forest plot of comparison: 2 Long term, outcome: 2.1 Functional status long term on log‐scale.

Forest plot of comparison: 2 Long term, outcome: 2.3 Low back pain long term on log‐scale.

Forest plot of comparison: 2 Long term, outcome: 2.2 Leg pain long term on log‐scale.

Forest plot of comparison: 2 Long term, outcome: 2.4 General health long term.

Comparison 1 Short term, Outcome 1 Functional status short term (log‐scale).

Comparison 1 Short term, Outcome 2 Leg pain short term (log‐scale).

Comparison 1 Short term, Outcome 3 Low back pain short term (log‐scale).

Comparison 1 Short term, Outcome 4 General health.

Comparison 2 Long term, Outcome 1 Functional status long term (log‐scale).

Comparison 2 Long term, Outcome 2 Leg pain long term (log‐scale).
Comparison 2 Long term, Outcome 3 Low back pain long term (log‐scale).

Comparison 2 Long term, Outcome 4 General health long term.
| Rehabilitation following surgery for lumbar spinal stenosis—short‐term outcomes | ||||||
| Patient or population: participants with lumbar spinal stenosis | ||||||
| Outcomes | Illustrative comparative risks* (95% CI) | Relative effect | No. of participants | Quality of the evidence | Comments | |
| Assumed risk | Corresponding risk | |||||
| Control | Rehabilitation after surgery | |||||
| Functional status, short term | Mean functional status short term ranged across control groups from | Mean functional status short term in the intervention groups was | 340 | ⊕⊕⊕⊝ | SMD on the log‐scale corresponds to 20% improvement (0% to 36% improvement) in the rehabilitation group. This difference is clinically relevant2 | |
| Leg pain, short term | Mean leg pain short term ranged across control groups from | Mean leg pain short term in the intervention groups was | 340 | ⊕⊕⊝⊝ | MD on the log‐scale corresponds to 16% improvement (21% worsening to 41% improvement). This difference is not statistically or clinically relevant5 | |
| Low back pain, short term | Mean low back pain short term ranged across control groups from | Mean low back pain short term in the intervention groups was | 340 | ⊕⊕⊕⊝ | MD on the log‐scale corresponds to 16% improvement (2% to 30% improvement) in low back pain. This difference is not clinically relevant5 | |
| General health, short term | Mean general health short term ranged across control groups from | Mean general health short term in the intervention groups was | 238 | ⊕⊕⊝⊝ | Mean difference is not statistically significant and is not clinically relevant | |
| Adverse Events ‐ not reported | See comment | See comment | Not estimable | See comment | None of the included studies reported any relevant adverse events | |
| *The corresponding risk (and its 95% confidence interval) is based on the assumed risk in the comparison group and the relative effect of the intervention (and its 95% CI). | ||||||
| GRADE Working Group grades of evidence. | ||||||
| 1Serious Inconsistency: due to direction. One of the three studies reported an average effect size that favoured the control; the other two favoured rehabilitation. | ||||||
| Rehabilitation following surgery for lumbar spinal stenosis—long‐term outcomes | ||||||
| Patient or population: participants with lumbar spinal stenosis | ||||||
| Outcomes | Illustrative comparative risks* (95% CI) | Relative effect | No. of participants | Quality of the evidence | Comments | |
| Assumed risk | Corresponding risk | |||||
| Control | Rehabilitation after surgery | |||||
| Functional status, long term | Mean functional status long term ranged across control groups from | Mean functional status long term in the intervention groups was | 373 | ⊕⊕⊕⊝ | SMD on the log‐scale corresponds to 23% improvement (5% to 37% improvement) in functional status. This difference is clinically relevant2 | |
| Leg pain, long term | Mean leg pain long term ranged across control groups from | Mean leg pain long term in the intervention groups was | 373 | ⊕⊕⊕⊝ | MD on the log‐scale corresponds to 21% improvement (1% to 37% improvement) in leg pain. This difference is not clinically relevant3 | |
| Low back pain, long term | Mean low back pain long term ranged across control groups from | Mean low back pain long term in the intervention groups was | 373 | ⊕⊕⊕⊝ | MD on the log‐scale corresponds to 18% improvement (5% to 30% improvement) in leg pain. This difference is not clinically relevant3 | |
| General health, long term | Mean general health long term ranged across control groups from | Mean general health long term in the intervention groups was | 273 | ⊕⊕⊝⊝ | Mean difference is not statistically significant or clinically relevant | |
| Adverse event—not reported | See comment | See comment | Not estimable | See comment | None of the included studies reported any relevant adverse events | |
| *The corresponding risk (and its 95% confidence interval) is based on the assumed risk in the comparison group and the relative effect of the intervention (and its 95% CI). | ||||||
| GRADE Working Group grades of evidence. | ||||||
| 1Serious Inconsistency: All studies were agreeable on the direction of the average effect, but only one study identified this to be a significant effect. | ||||||
| Experimental | Control | Experimental | Control | Experimental | Control | |||||||
| Outcome | Mean (SD) | Mean/SD1 | Mean (SD) | Mean/SD1 | Mean (SD) | Mean/SD1 | Mean (SD) | Mean/SD1 | Mean (SD) | Mean/SD1 | Mean (SD) | Mean/SD1 |
| Short term | ||||||||||||
| Functional status | 22.5 (17.8) | 1.3 | 26.4 (19.1) | 1.4 | 8.6 (5.3) | 1.6 | 8.7 (5.8) | 1.5 | 27.0 (18.0) | 1.5 | 32.0 (19.0) | 1.7 |
| Leg pain | 24.0 (24.0) | 1.0 | 35.0 (29.0) | 1.2 | 29.0 (24.8) | 1.2 | 24.0 (25.0) | 1.0 | 32.0 (27.0) | 1.2 | 38.0 (28.0) | 1.4 |
| Back pain | 14.0 (18.0) | 0.8 | 20.0 (26.0) | 0.8 | 29.5 (29.0) | 1.0 | 24.3 (26.0) | 0.9 | 33.0 (26.0) | 1.3 | 41.0 (29.0) | 1.4 |
| General health | 71.5 (20.9) | 3.4 | 74.0 (20.0) | 3.7 | 71.0 (23.0) | 3.1 | 66.0 (24.0) | 2.8 | ||||
| Long term | ||||||||||||
| Functional status | 24.8 (19.1) | 1.3 | 31.0 (20.1) | 1.5 | 8.9 (6.0) | 1.5 | 9.1 (5.7) | 1.6 | 29.0 (21.0) | 1.4 | 34.0 (22.0) | 1.5 |
| Leg pain | 28.0 (29.0) | 1.0 | 35.0 (31.0) | 1.1 | 32.5 (28.3) | 1.1 | 33.0 (30.0) | 1.1 | 33.0 (31.0) | 1.1 | 43.0 (30.0) | 1.4 |
| Back pain | 16.0 (20.0) | 0.8 | 24.0 (26.0) | 0.9 | 28.6 (25.5) | 1.1 | 32.0 (27.0) | 1.2 | 38.0 (30.0) | 1.3 | 42.0 (29.0) | 1.4 |
| General health | 67.0 (23.9) | 2.8 | 70.0 (22.0) | 3.2 | 67.0 (26.0) | 2.6 | 64.0 (25.0) | 2.6 | ||||
| Note: Mean/SD < 2 Indicates skewed data (Higgins 2011). | ||||||||||||
| 1When mean/SD < 2 indicating skewness data was log‐transformed for analysis in accordance with the methods outlined in the Cochrane Handbook for Systematic Reviews of Interventions. | ||||||||||||
| Age, years | 62.5 (34 to 86; 11.1) | 67.1 (10.6) | 62 (15) |
| BMI | 29.5 (4.0) | 27 (4.5) | 27(5) |
| Gender: female/male | 59%/41% | 41%/59% | 49.5%/51.5% |
| Reha mean (SD) | Control mean (SD) | Reha mean (SD) | Control mean (SD) | Reha mean (SD) | Control mean (SD) | |
| Functional status | 24.3 (15.9) | 29.7 (20,5) | 10.9 (4.9) | 10.6 (4.7) | 30(18) | 32(21) |
| Low back pain (VAS 0 to 100) | 16 (19) | 20 (26) | 24.6 (19.8) | 29 (21) | 35 (26) | 35 (29) |
| Leg pain (VAS 0 to 100) | 27 (26) | 32 (28) | 29.5 (22.9) | 22 (24) | 33 (27) | 32 (28) |
| General health (VAS 100 to 0) | ‐ | ‐ | 68.6 (21) | 69 (26) | 69 (22) | 66 (26) |
| 1. Are participants | Yes | Yes | Yes |
| 2. Are the interventions | Yes | Yes | Yes |
| 3. Were all | Yes | Yes | Yes |
| 4. Is the | No | No | No |
| 5. Are the | Yes | Yes | Yes |
| Outcome or subgroup title | No. of studies | No. of participants | Statistical method | Effect size |
| 1 Functional status short term (log‐scale) Show forest plot | 3 | 340 | Std. Mean Difference (IV, Fixed, 95% CI) | ‐0.22 [‐0.44, ‐0.00] |
| 2 Leg pain short term (log‐scale) Show forest plot | 3 | 340 | Mean Difference (IV, Random, 95% CI) | ‐0.17 [‐0.52, 0.19] |
| 3 Low back pain short term (log‐scale) Show forest plot | 3 | 340 | Mean Difference (IV, Fixed, 95% CI) | ‐0.18 [‐0.35, ‐0.02] |
| 4 General health Show forest plot | 2 | 238 | Mean Difference (IV, Fixed, 95% CI) | 1.30 [‐4.45, 7.06] |
| Outcome or subgroup title | No. of studies | No. of participants | Statistical method | Effect size |
| 1 Functional status long term (log‐scale) Show forest plot | 3 | 373 | Std. Mean Difference (IV, Fixed, 95% CI) | ‐0.26 [‐0.46, ‐0.05] |
| 2 Leg pain long term (log‐scale) Show forest plot | 3 | 373 | Mean Difference (IV, Random, 95% CI) | ‐0.24 [‐0.47, ‐0.01] |
| 3 Low back pain long term (log‐scale) Show forest plot | 3 | 373 | Mean Difference (IV, Fixed, 95% CI) | ‐0.20 [‐0.36, ‐0.05] |
| 4 General health long term Show forest plot | 2 | 273 | Mean Difference (IV, Fixed, 95% CI) | 0.48 [‐5.44, 6.41] |