Rehabilitación posquirúrgica para la estenosis lumbar
Información
- DOI:
- https://doi.org/10.1002/14651858.CD009644.pub2Copiar DOI

- Base de datos:
-
- Cochrane Database of Systematic Reviews
- Versión publicada:
-
- 09 diciembre 2013see what's new
- Tipo:
-
- Intervention
- Etapa:
-
- Review
- Grupo Editorial Cochrane:
-
Grupo Cochrane de Espalda y cuello
- Copyright:
-
- Copyright © 2013 The Cochrane Collaboration. Published by John Wiley & Sons, Ltd.
Cifras del artículo
Altmetric:
Citado por:
Autores
Contributions of authors
All authors have contributed to the development of this review. AMcG and KP screened the search results and selected studies. AKB, FB, TP and JF were involved in the final decision making. AMcG, KP and SC extracted the data (AMcG was not involved in data extraction from the trial McGregor 2010, for which she served as first author). Risk of bias assessment was completed by KP and SC. GRADE assessment and assessment of clinical relevance were completed by KP and SC. Analysis was done by KP and SC, and CJD was also involved in the process. AMcG, KP and SC were the main authors of the text. All review authors contributed to the review writing process.
Sources of support
Internal sources
-
International Society for the Study of the Lumbar Spine, UK.
This work is being supported by prize money from the International Society for the Study of the Lumbar Spine held in a trust account by Alison McGregor
External sources
-
No external sources of support given, Not specified.
Declarations of interest
None known.
Acknowledgements
We thank Teresa Marin, Rachel Couban and Allison Kelly from the Cochrane Back Review Group for their help.
Version history
| Published | Title | Stage | Authors | Version |
| 2013 Dec 09 | Rehabilitation following surgery for lumbar spinal stenosis | Review | Alison H McGregor, Katrin Probyn, Suzie Cro, Caroline J Doré, A Kim Burton, Federico Balagué, Tamar Pincus, Jeremy Fairbank | |
| 2012 Feb 15 | Rehabilitation following surgery for lumbar spinal stenosis | Protocol | Alison H McGregor, Katrin Probyn, Caroline J Doré, A Kim Burton, Suzie Cro, Alexander Crispin, Federico Balagué, Stephen Morris, Tamar Pincus, Jeremy Fairbank | |
Differences between protocol and review
In the published study protocol (Protocol), we originally planned for the primary outcome to be 'change in functional status'; however,
We were unable to obtain reported changes in functional status plus standard deviations for all three studies included in this review.
Because data from the included trials were lacking, we decided to analyse 'functional status' as the primary outcome. This analysis does not take into account where participants were at the start of the study and immediately post surgery; therefore, a lower postrehabilitation value could theoretically be caused by a lower value at baseline; however, exploration of baseline data revealed no substantial differences between groups at baseline (Table 2).
We did consider imputing the change score standard deviation from available study data, but because follow‐up times of the short‐term outcomes varied (McGregor 2010—three months, Mannion 2007—five months and Aalto 2011—six months), we concluded that using a method that involves an imputed correlation coefficient would be inappropriate.
Reporting of adverse events was not specified as an outcome in our Protocol; however, it has been documented as an outcome in summary of findings Table for the main comparison and summary of findings Table 2 in this review.
Keywords
MeSH
Medical Subject Headings (MeSH) Keywords
Medical Subject Headings Check Words
Humans;
PICO

Study flow diagram.

Risk of bias summary: review authors' judgements about each risk of bias item for each included study.

Forest plot of comparison: 1 Short term, outcome: 1.1 Functional status short term on log‐scale.

Forest plot of comparison: 1 Short term, outcome: 1.3 Low back pain short term on log‐scale.

Forest plot of comparison: 1 Short term, outcome: 1.2 Leg pain short term on log‐scale.

Forest plot of comparison: 1 Short term, outcome: 1.4 General health.

Forest plot of comparison: 2 Long term, outcome: 2.1 Functional status long term on log‐scale.

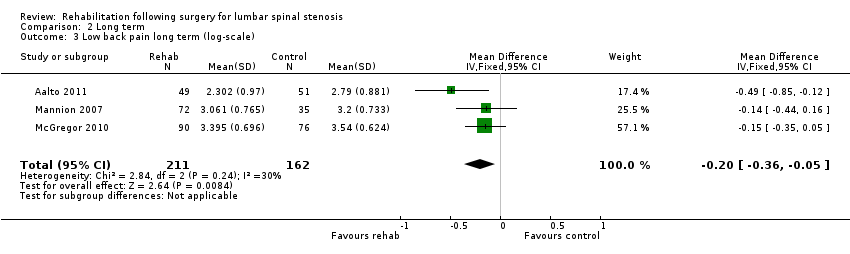
Forest plot of comparison: 2 Long term, outcome: 2.3 Low back pain long term on log‐scale.

Forest plot of comparison: 2 Long term, outcome: 2.2 Leg pain long term on log‐scale.

Forest plot of comparison: 2 Long term, outcome: 2.4 General health long term.

Comparison 1 Short term, Outcome 1 Functional status short term (log‐scale).

Comparison 1 Short term, Outcome 2 Leg pain short term (log‐scale).

Comparison 1 Short term, Outcome 3 Low back pain short term (log‐scale).

Comparison 1 Short term, Outcome 4 General health.

Comparison 2 Long term, Outcome 1 Functional status long term (log‐scale).

Comparison 2 Long term, Outcome 2 Leg pain long term (log‐scale).
Comparison 2 Long term, Outcome 3 Low back pain long term (log‐scale).

Comparison 2 Long term, Outcome 4 General health long term.
| Rehabilitation following surgery for lumbar spinal stenosis—short‐term outcomes | ||||||
| Patient or population: participants with lumbar spinal stenosis | ||||||
| Outcomes | Illustrative comparative risks* (95% CI) | Relative effect | No. of participants | Quality of the evidence | Comments | |
| Assumed risk | Corresponding risk | |||||
| Control | Rehabilitation after surgery | |||||
| Functional status, short term | Mean functional status short term ranged across control groups from | Mean functional status short term in the intervention groups was | 340 | ⊕⊕⊕⊝ | SMD on the log‐scale corresponds to 20% improvement (0% to 36% improvement) in the rehabilitation group. This difference is clinically relevant2 | |
| Leg pain, short term | Mean leg pain short term ranged across control groups from | Mean leg pain short term in the intervention groups was | 340 | ⊕⊕⊝⊝ | MD on the log‐scale corresponds to 16% improvement (21% worsening to 41% improvement). This difference is not statistically or clinically relevant5 | |
| Low back pain, short term | Mean low back pain short term ranged across control groups from | Mean low back pain short term in the intervention groups was | 340 | ⊕⊕⊕⊝ | MD on the log‐scale corresponds to 16% improvement (2% to 30% improvement) in low back pain. This difference is not clinically relevant5 | |
| General health, short term | Mean general health short term ranged across control groups from | Mean general health short term in the intervention groups was | 238 | ⊕⊕⊝⊝ | Mean difference is not statistically significant and is not clinically relevant | |
| Adverse Events ‐ not reported | See comment | See comment | Not estimable | See comment | None of the included studies reported any relevant adverse events | |
| *The corresponding risk (and its 95% confidence interval) is based on the assumed risk in the comparison group and the relative effect of the intervention (and its 95% CI). | ||||||
| GRADE Working Group grades of evidence. | ||||||
| 1Serious Inconsistency: due to direction. One of the three studies reported an average effect size that favoured the control; the other two favoured rehabilitation. | ||||||
| Rehabilitation following surgery for lumbar spinal stenosis—long‐term outcomes | ||||||
| Patient or population: participants with lumbar spinal stenosis | ||||||
| Outcomes | Illustrative comparative risks* (95% CI) | Relative effect | No. of participants | Quality of the evidence | Comments | |
| Assumed risk | Corresponding risk | |||||
| Control | Rehabilitation after surgery | |||||
| Functional status, long term | Mean functional status long term ranged across control groups from | Mean functional status long term in the intervention groups was | 373 | ⊕⊕⊕⊝ | SMD on the log‐scale corresponds to 23% improvement (5% to 37% improvement) in functional status. This difference is clinically relevant2 | |
| Leg pain, long term | Mean leg pain long term ranged across control groups from | Mean leg pain long term in the intervention groups was | 373 | ⊕⊕⊕⊝ | MD on the log‐scale corresponds to 21% improvement (1% to 37% improvement) in leg pain. This difference is not clinically relevant3 | |
| Low back pain, long term | Mean low back pain long term ranged across control groups from | Mean low back pain long term in the intervention groups was | 373 | ⊕⊕⊕⊝ | MD on the log‐scale corresponds to 18% improvement (5% to 30% improvement) in leg pain. This difference is not clinically relevant3 | |
| General health, long term | Mean general health long term ranged across control groups from | Mean general health long term in the intervention groups was | 273 | ⊕⊕⊝⊝ | Mean difference is not statistically significant or clinically relevant | |
| Adverse event—not reported | See comment | See comment | Not estimable | See comment | None of the included studies reported any relevant adverse events | |
| *The corresponding risk (and its 95% confidence interval) is based on the assumed risk in the comparison group and the relative effect of the intervention (and its 95% CI). | ||||||
| GRADE Working Group grades of evidence. | ||||||
| 1Serious Inconsistency: All studies were agreeable on the direction of the average effect, but only one study identified this to be a significant effect. | ||||||
| Experimental | Control | Experimental | Control | Experimental | Control | |||||||
| Outcome | Mean (SD) | Mean/SD1 | Mean (SD) | Mean/SD1 | Mean (SD) | Mean/SD1 | Mean (SD) | Mean/SD1 | Mean (SD) | Mean/SD1 | Mean (SD) | Mean/SD1 |
| Short term | ||||||||||||
| Functional status | 22.5 (17.8) | 1.3 | 26.4 (19.1) | 1.4 | 8.6 (5.3) | 1.6 | 8.7 (5.8) | 1.5 | 27.0 (18.0) | 1.5 | 32.0 (19.0) | 1.7 |
| Leg pain | 24.0 (24.0) | 1.0 | 35.0 (29.0) | 1.2 | 29.0 (24.8) | 1.2 | 24.0 (25.0) | 1.0 | 32.0 (27.0) | 1.2 | 38.0 (28.0) | 1.4 |
| Back pain | 14.0 (18.0) | 0.8 | 20.0 (26.0) | 0.8 | 29.5 (29.0) | 1.0 | 24.3 (26.0) | 0.9 | 33.0 (26.0) | 1.3 | 41.0 (29.0) | 1.4 |
| General health | 71.5 (20.9) | 3.4 | 74.0 (20.0) | 3.7 | 71.0 (23.0) | 3.1 | 66.0 (24.0) | 2.8 | ||||
| Long term | ||||||||||||
| Functional status | 24.8 (19.1) | 1.3 | 31.0 (20.1) | 1.5 | 8.9 (6.0) | 1.5 | 9.1 (5.7) | 1.6 | 29.0 (21.0) | 1.4 | 34.0 (22.0) | 1.5 |
| Leg pain | 28.0 (29.0) | 1.0 | 35.0 (31.0) | 1.1 | 32.5 (28.3) | 1.1 | 33.0 (30.0) | 1.1 | 33.0 (31.0) | 1.1 | 43.0 (30.0) | 1.4 |
| Back pain | 16.0 (20.0) | 0.8 | 24.0 (26.0) | 0.9 | 28.6 (25.5) | 1.1 | 32.0 (27.0) | 1.2 | 38.0 (30.0) | 1.3 | 42.0 (29.0) | 1.4 |
| General health | 67.0 (23.9) | 2.8 | 70.0 (22.0) | 3.2 | 67.0 (26.0) | 2.6 | 64.0 (25.0) | 2.6 | ||||
| Note: Mean/SD < 2 Indicates skewed data (Higgins 2011). | ||||||||||||
| 1When mean/SD < 2 indicating skewness data was log‐transformed for analysis in accordance with the methods outlined in the Cochrane Handbook for Systematic Reviews of Interventions. | ||||||||||||
| Age, years | 62.5 (34 to 86; 11.1) | 67.1 (10.6) | 62 (15) |
| BMI | 29.5 (4.0) | 27 (4.5) | 27(5) |
| Gender: female/male | 59%/41% | 41%/59% | 49.5%/51.5% |
| Reha mean (SD) | Control mean (SD) | Reha mean (SD) | Control mean (SD) | Reha mean (SD) | Control mean (SD) | |
| Functional status | 24.3 (15.9) | 29.7 (20,5) | 10.9 (4.9) | 10.6 (4.7) | 30(18) | 32(21) |
| Low back pain (VAS 0 to 100) | 16 (19) | 20 (26) | 24.6 (19.8) | 29 (21) | 35 (26) | 35 (29) |
| Leg pain (VAS 0 to 100) | 27 (26) | 32 (28) | 29.5 (22.9) | 22 (24) | 33 (27) | 32 (28) |
| General health (VAS 100 to 0) | ‐ | ‐ | 68.6 (21) | 69 (26) | 69 (22) | 66 (26) |
| 1. Are participants | Yes | Yes | Yes |
| 2. Are the interventions | Yes | Yes | Yes |
| 3. Were all | Yes | Yes | Yes |
| 4. Is the | No | No | No |
| 5. Are the | Yes | Yes | Yes |
| Outcome or subgroup title | No. of studies | No. of participants | Statistical method | Effect size |
| 1 Functional status short term (log‐scale) Show forest plot | 3 | 340 | Std. Mean Difference (IV, Fixed, 95% CI) | ‐0.22 [‐0.44, ‐0.00] |
| 2 Leg pain short term (log‐scale) Show forest plot | 3 | 340 | Mean Difference (IV, Random, 95% CI) | ‐0.17 [‐0.52, 0.19] |
| 3 Low back pain short term (log‐scale) Show forest plot | 3 | 340 | Mean Difference (IV, Fixed, 95% CI) | ‐0.18 [‐0.35, ‐0.02] |
| 4 General health Show forest plot | 2 | 238 | Mean Difference (IV, Fixed, 95% CI) | 1.30 [‐4.45, 7.06] |
| Outcome or subgroup title | No. of studies | No. of participants | Statistical method | Effect size |
| 1 Functional status long term (log‐scale) Show forest plot | 3 | 373 | Std. Mean Difference (IV, Fixed, 95% CI) | ‐0.26 [‐0.46, ‐0.05] |
| 2 Leg pain long term (log‐scale) Show forest plot | 3 | 373 | Mean Difference (IV, Random, 95% CI) | ‐0.24 [‐0.47, ‐0.01] |
| 3 Low back pain long term (log‐scale) Show forest plot | 3 | 373 | Mean Difference (IV, Fixed, 95% CI) | ‐0.20 [‐0.36, ‐0.05] |
| 4 General health long term Show forest plot | 2 | 273 | Mean Difference (IV, Fixed, 95% CI) | 0.48 [‐5.44, 6.41] |