Techniques of monitoring blood glucose during pregnancy for women with pre‐existing diabetes
Información
- DOI:
- https://doi.org/10.1002/14651858.CD009613.pub3Copiar DOI

- Base de datos:
-
- Cochrane Database of Systematic Reviews
- Versión publicada:
-
- 11 junio 2017see what's new
- Tipo:
-
- Intervention
- Etapa:
-
- Review
- Grupo Editorial Cochrane:
-
Grupo Cochrane de Embarazo y parto
- Copyright:
-
- Copyright © 2017 The Cochrane Collaboration. Published by John Wiley & Sons, Ltd.
Cifras del artículo
Altmetric:
Citado por:
Autores
Contributions of authors
Foong Ming Moy (FMM), the contact person, is the guarantor of the review. Three review authors (FMM, Amita Ray and Brian S Buckely) provided co‐ordination, methodological perspective, clinical perspective and policy perspective of the review. Three authors contributed to developing and writing the review, and commented on drafts of the review update. Helen West drafted the review update, extracted additional data, assessed study quality, undertook data entry and analysis in Review Manager, and prepared 'Summary of findings' tables.
Sources of support
Internal sources
-
University of Malaya, Malaysia.
-
(HW) Cochrane Pregnancy and Childbirth Group, Department of Women's and Children's Health, The University of Liverpool, Liverpool, UK.
External sources
-
High Impact Research Grant (E000010‐20001), Malaysia.
Funding in providing the Cochrane Library data base and support in retrieving full text articles
-
(HW) NIHR Cochrane Programme Grant Project: 13/89/05 – Pregnancy and childbirth systematic reviews to support clinical guidelines, UK.
Declarations of interest
Foong Ming Moy: none declared.
Amita Ray: none declared.
Brian Buckley: none declared.
Helen West: was paid to work on Cochrane reviews by a grant to Cochrane Pregnancy and Childbirth. The views and opinions expressed therein are those of the authors and do not necessarily reflect those of the Systematic Reviews Programme, NIHR, NHS or the Department of Health.
Acknowledgements
We would like to thank Dr Prathap Tharyan's motivation and assistance in the completion of the previous version of this review.
Helen West's contribution to this project was supported by the National Institute for Health Research, via Cochrane Programme Grant funding to Cochrane Pregnancy and Childbirth. The views and opinions expressed therein are those of the authors and do not necessarily reflect those of the Systematic Reviews Programme, NIHR, NHS or the Department of Health.
For this update, we used the Cochrane Pregnancy and Childbirth core outcome set for reviews of diabetes in pregnancy, developed by the Cochrane Pregnancy and Childbirth Australasian satellite.
Version history
| Published | Title | Stage | Authors | Version |
| 2019 May 23 | Techniques of monitoring blood glucose during pregnancy for women with pre‐existing diabetes | Review | Leanne V Jones, Amita Ray, Foong Ming Moy, Brian S Buckley | |
| 2017 Jun 11 | Techniques of monitoring blood glucose during pregnancy for women with pre‐existing diabetes | Review | Foong Ming Moy, Amita Ray, Brian S Buckley, Helen M West | |
| 2014 Apr 30 | Techniques of monitoring blood glucose during pregnancy for women with pre‐existing diabetes | Review | Foong Ming Moy, Amita Ray, Brian S Buckley | |
| 2012 Feb 15 | Techniques of monitoring blood glucose during pregnancy for women with pre‐existing diabetes | Protocol | Foong Ming Moy, Amita Ray, Brian S Buckley | |
Differences between protocol and review
1. For this update, in order to improve consistency across reviews, we have used the Cochrane Pregnancy and Childbirth core outcome set for reviews of diabetes in pregnancy, developed by the Cochrane Pregnancy and Childbirth Australasian satellite.
The outcomes specified in the last version of the review have been expanded to incorporate the core outcome set, but were as follows.
Primary outcomes
Maternal
-
Glycaemic control (HbA1c, fructosamine, fasting blood glucose, post‐prandial blood glucose)
Infant
-
Birthweight
-
Macrosomia greater than 4.5 kg
Secondary outcomes
Maternal
-
Frequency of hypoglycaemia
-
Antenatal hospital stay (percentage requiring admission, length of stay)
-
Induction of labour
-
Caesarean section rates
-
Miscarriage
Infant
-
Gestational age (at birth) or preterm birth less than 37/less than 34 weeks
-
Frequency of neonatal hypoglycaemia
-
Shoulder dystocia
-
Major and minor anomalies
-
Neonatal intensive care admissions
-
Death of baby including stillbirth/neonatal death
to the following.
2. The following outcomes were not pre‐specified.
-
Birth trauma (shoulder dystocia, bone fracture, nerve palsy) (not pre‐specified as a composite)
-
Neonatal glucose at age one hour
-
Transient tachypnoea
-
Diabetic ketoacidosis
-
Feeding difficulties
3. We have added 'Summary of findings' tables and an assessment of the quality of the evidence using the GRADE approach.
Keywords
MeSH
Medical Subject Headings (MeSH) Keywords
- Blood Glucose [*metabolism];
- Blood Glucose Self-Monitoring [*methods];
- Canada;
- Diabetes Mellitus, Type 1 [*blood];
- Diabetes Mellitus, Type 2 [*blood];
- Europe;
- Hypertension [prevention & control];
- Hypoglycemia [chemically induced];
- Perinatal Mortality;
- Pre-Eclampsia [prevention & control];
- United States;
Medical Subject Headings Check Words
Adult; Female; Humans; Infant, Newborn; Pregnancy;
PICO
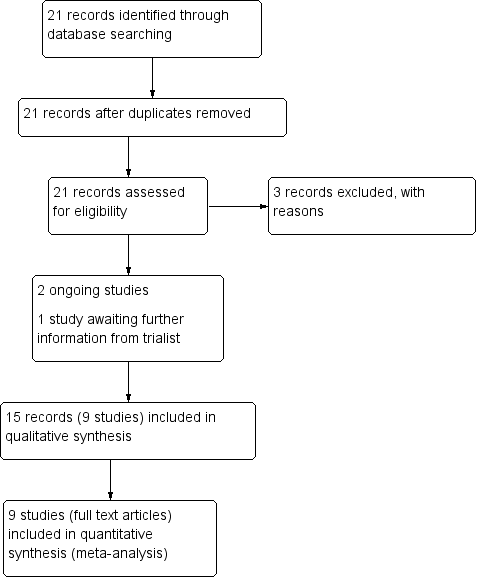
Study flow diagram.

Study flow diagram 2016

'Risk of bias' summary: review authors' judgements about each risk of bias item for each included study.
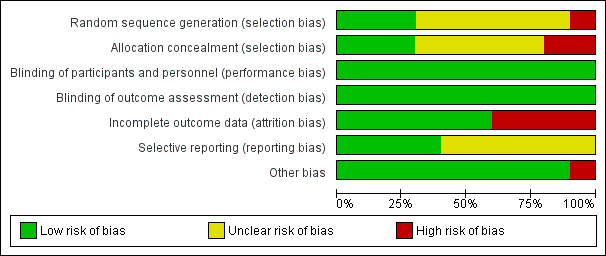
'Risk of bias' graph: review authors' judgements about each risk of bias item presented as percentages across all included studies.
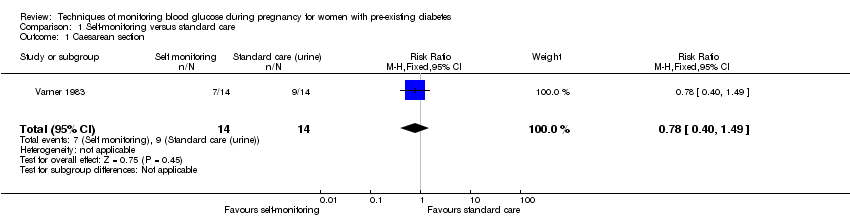
Comparison 1 Self‐monitoring versus standard care, Outcome 1 Caesarean section.

Comparison 1 Self‐monitoring versus standard care, Outcome 2 Perinatal mortality.

Comparison 1 Self‐monitoring versus standard care, Outcome 3 Neonatal mortality and morbidity composite.

Comparison 1 Self‐monitoring versus standard care, Outcome 4 Glycaemic control during/end of treatment (maternal post‐prandial blood glucose).

Comparison 1 Self‐monitoring versus standard care, Outcome 5 Glycaemic control during/end of treatment (maternal HbA1c).
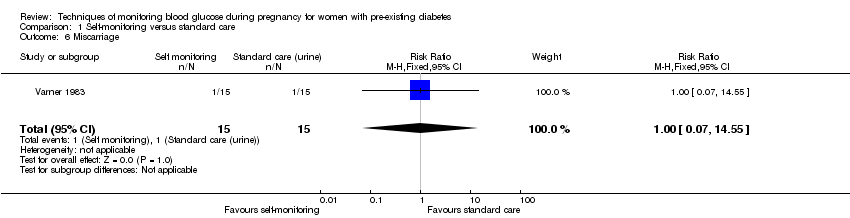
Comparison 1 Self‐monitoring versus standard care, Outcome 6 Miscarriage.
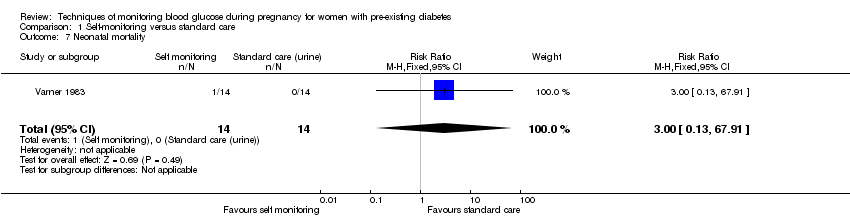
Comparison 1 Self‐monitoring versus standard care, Outcome 7 Neonatal mortality.
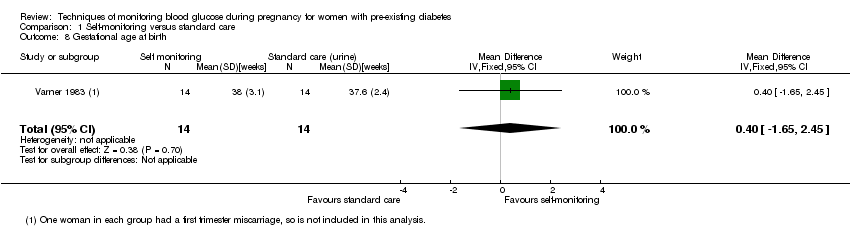
Comparison 1 Self‐monitoring versus standard care, Outcome 8 Gestational age at birth.
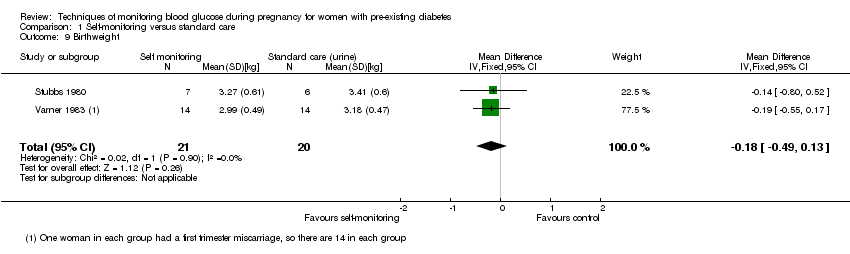
Comparison 1 Self‐monitoring versus standard care, Outcome 9 Birthweight.

Comparison 1 Self‐monitoring versus standard care, Outcome 10 Respiratory distress syndrome.
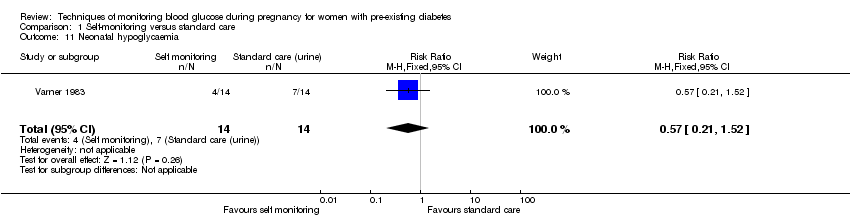
Comparison 1 Self‐monitoring versus standard care, Outcome 11 Neonatal hypoglycaemia.

Comparison 1 Self‐monitoring versus standard care, Outcome 12 Neonatal jaundice (hyperbilirubinaemia).
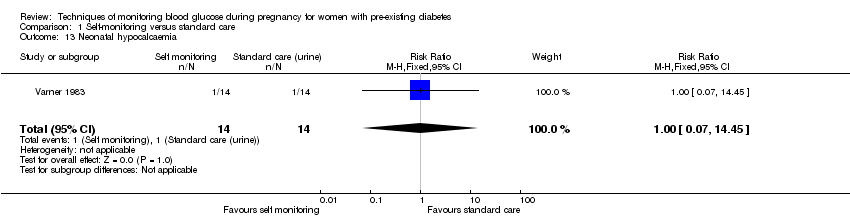
Comparison 1 Self‐monitoring versus standard care, Outcome 13 Neonatal hypocalcaemia.
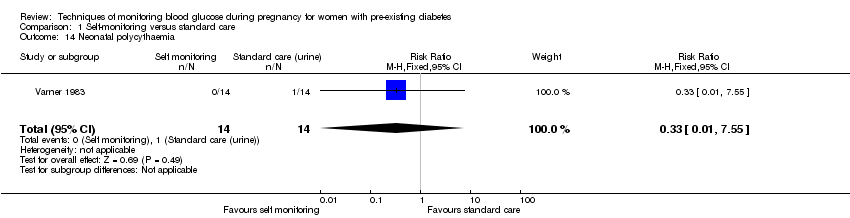
Comparison 1 Self‐monitoring versus standard care, Outcome 14 Neonatal polycythaemia.

Comparison 1 Self‐monitoring versus standard care, Outcome 15 Neonatal cord vein C‐peptide.

Comparison 2 Self‐monitoring versus hospitalisation, Outcome 1 Pre‐eclampsia.
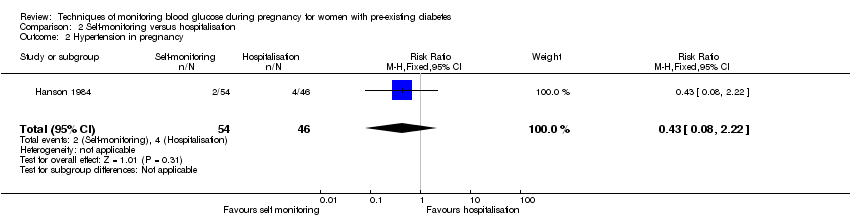
Comparison 2 Self‐monitoring versus hospitalisation, Outcome 2 Hypertension in pregnancy.

Comparison 2 Self‐monitoring versus hospitalisation, Outcome 3 Caesarean section.

Comparison 2 Self‐monitoring versus hospitalisation, Outcome 4 Perinatal mortality.

Comparison 2 Self‐monitoring versus hospitalisation, Outcome 5 Placental abruption.

Comparison 2 Self‐monitoring versus hospitalisation, Outcome 6 Preterm birth < 37 weeks.

Comparison 2 Self‐monitoring versus hospitalisation, Outcome 7 Respiratory distress syndrome.

Comparison 2 Self‐monitoring versus hospitalisation, Outcome 8 Neonatal hypoglycaemia.
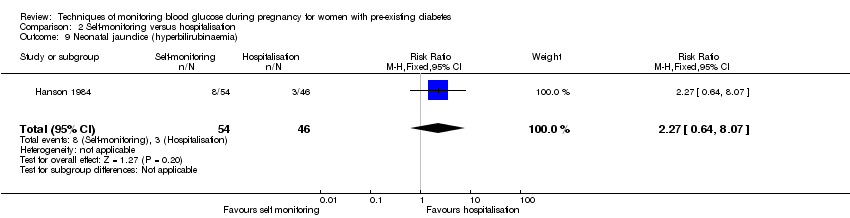
Comparison 2 Self‐monitoring versus hospitalisation, Outcome 9 Neonatal jaundice (hyperbilirubinaemia).
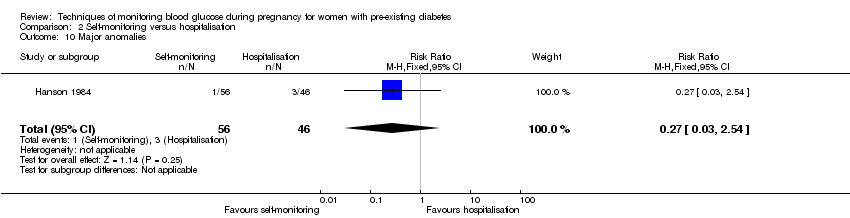
Comparison 2 Self‐monitoring versus hospitalisation, Outcome 10 Major anomalies.
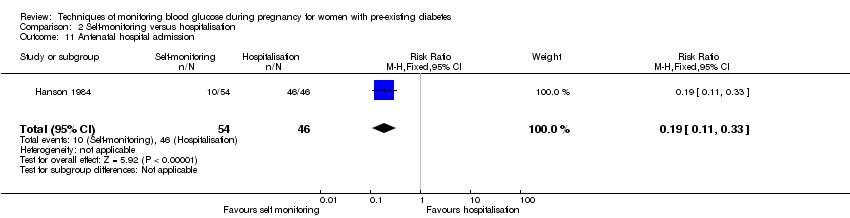
Comparison 2 Self‐monitoring versus hospitalisation, Outcome 11 Antenatal hospital admission.
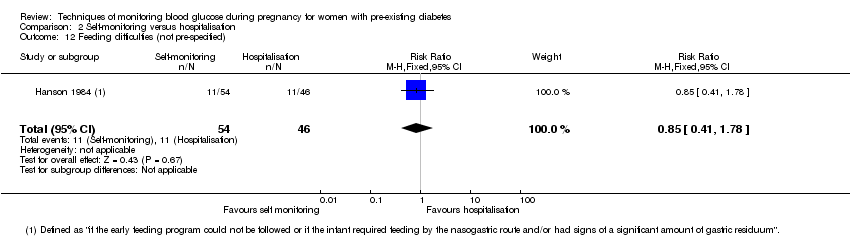
Comparison 2 Self‐monitoring versus hospitalisation, Outcome 12 Feeding difficulties (not pre‐specified).

Comparison 3 Pre‐prandial versus post‐prandial glucose monitoring, Outcome 1 Pre‐eclampsia.
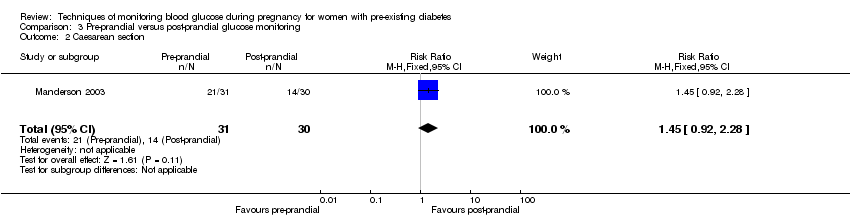
Comparison 3 Pre‐prandial versus post‐prandial glucose monitoring, Outcome 2 Caesarean section.
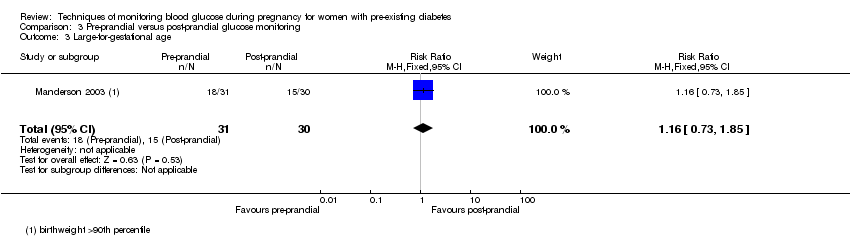
Comparison 3 Pre‐prandial versus post‐prandial glucose monitoring, Outcome 3 Large‐for‐gestational age.

Comparison 3 Pre‐prandial versus post‐prandial glucose monitoring, Outcome 4 Perinatal mortality.

Comparison 3 Pre‐prandial versus post‐prandial glucose monitoring, Outcome 5 Weight gain during pregnancy.
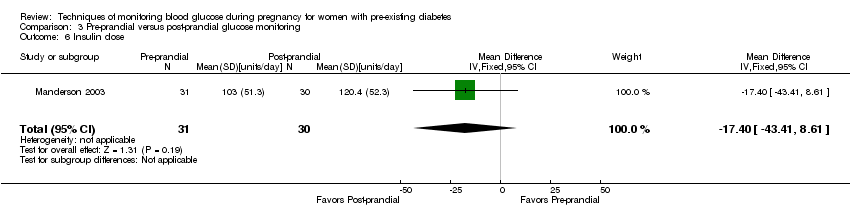
Comparison 3 Pre‐prandial versus post‐prandial glucose monitoring, Outcome 6 Insulin dose.

Comparison 3 Pre‐prandial versus post‐prandial glucose monitoring, Outcome 7 Glycaemic control ‐ Insulin dose.
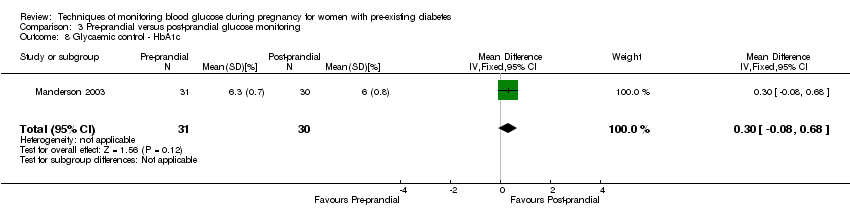
Comparison 3 Pre‐prandial versus post‐prandial glucose monitoring, Outcome 8 Glycaemic control ‐ HbA1c.
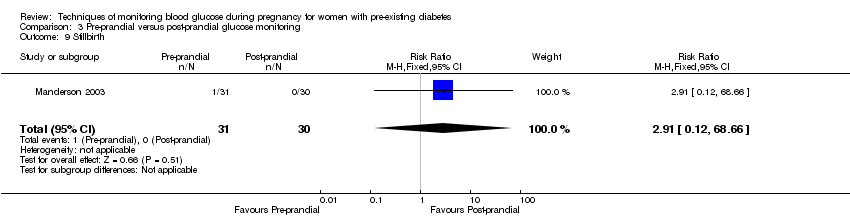
Comparison 3 Pre‐prandial versus post‐prandial glucose monitoring, Outcome 9 Stillbirth.

Comparison 3 Pre‐prandial versus post‐prandial glucose monitoring, Outcome 10 Gestational age at birth.
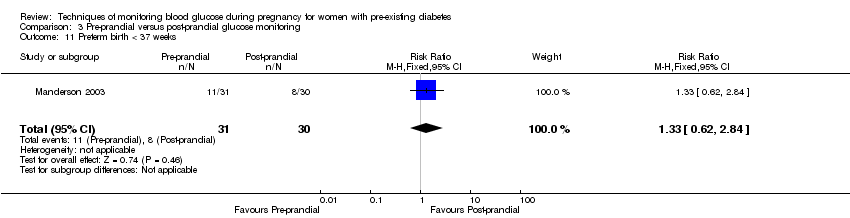
Comparison 3 Pre‐prandial versus post‐prandial glucose monitoring, Outcome 11 Preterm birth < 37 weeks.
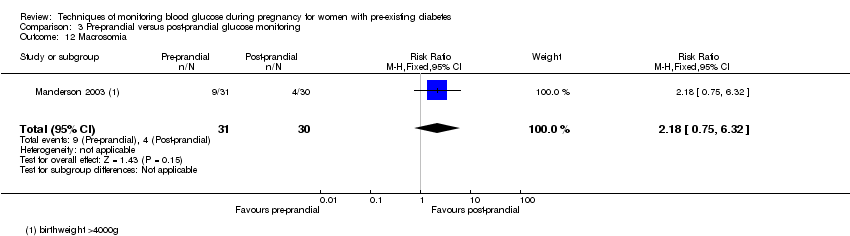
Comparison 3 Pre‐prandial versus post‐prandial glucose monitoring, Outcome 12 Macrosomia.

Comparison 3 Pre‐prandial versus post‐prandial glucose monitoring, Outcome 13 Birthweight.

Comparison 3 Pre‐prandial versus post‐prandial glucose monitoring, Outcome 14 Adiposity ‐ Subscapula skinfold thickness.

Comparison 3 Pre‐prandial versus post‐prandial glucose monitoring, Outcome 15 Adiposity ‐ Triceps skinfold thickness.
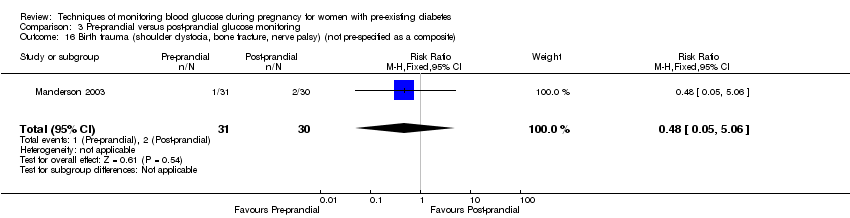
Comparison 3 Pre‐prandial versus post‐prandial glucose monitoring, Outcome 16 Birth trauma (shoulder dystocia, bone fracture, nerve palsy) (not pre‐specified as a composite).
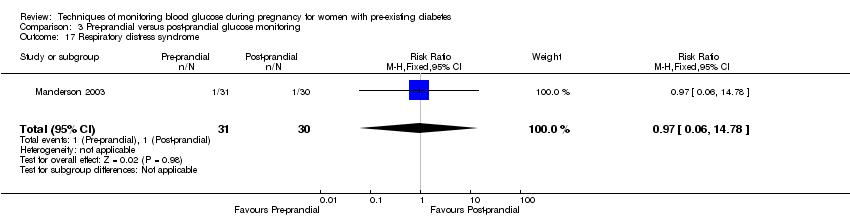
Comparison 3 Pre‐prandial versus post‐prandial glucose monitoring, Outcome 17 Respiratory distress syndrome.

Comparison 3 Pre‐prandial versus post‐prandial glucose monitoring, Outcome 18 Neonatal hypoglycaemia.

Comparison 3 Pre‐prandial versus post‐prandial glucose monitoring, Outcome 19 Neonatal jaundice (hyperbilirubinaemia).
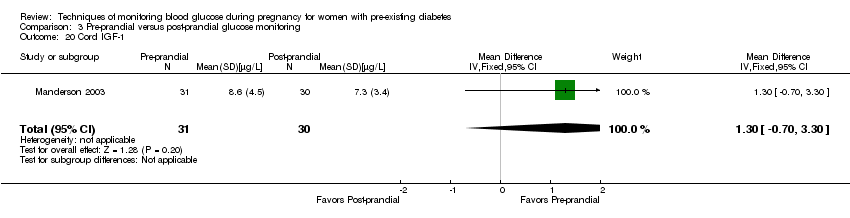
Comparison 3 Pre‐prandial versus post‐prandial glucose monitoring, Outcome 20 Cord IGF‐1.

Comparison 3 Pre‐prandial versus post‐prandial glucose monitoring, Outcome 21 Neonatal glucose at age 1 hour (not pre‐specified).
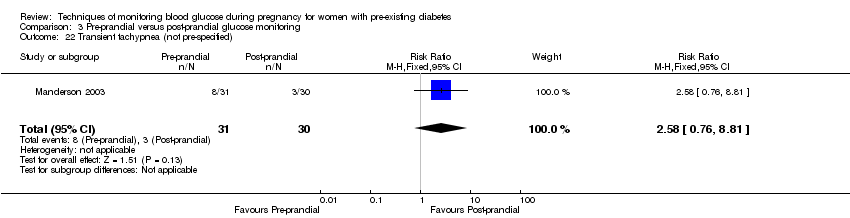
Comparison 3 Pre‐prandial versus post‐prandial glucose monitoring, Outcome 22 Transient tachypnea (not pre‐specified).

Comparison 3 Pre‐prandial versus post‐prandial glucose monitoring, Outcome 23 Neonatal intensive care admissions.

Comparison 4 Automated telemedicine monitoring versus conventional, Outcome 1 Caesarean section.

Comparison 4 Automated telemedicine monitoring versus conventional, Outcome 2 Neonatal morbidity composite.
![Comparison 4 Automated telemedicine monitoring versus conventional, Outcome 3 Weight gain during pregnancy [kg].](/es/cdsr/doi/10.1002/14651858.CD009613.pub3/media/CDSR/CD009613/rel0003/CD009613/image_n/nCD009613-CMP-004-03.png)
Comparison 4 Automated telemedicine monitoring versus conventional, Outcome 3 Weight gain during pregnancy [kg].

Comparison 4 Automated telemedicine monitoring versus conventional, Outcome 4 Use of additional insulin therapy.

Comparison 4 Automated telemedicine monitoring versus conventional, Outcome 5 Insulin requirement at end of study.

Comparison 4 Automated telemedicine monitoring versus conventional, Outcome 6 Glycaemic control ‐ Maternal fasting blood glucose: before breakfast.
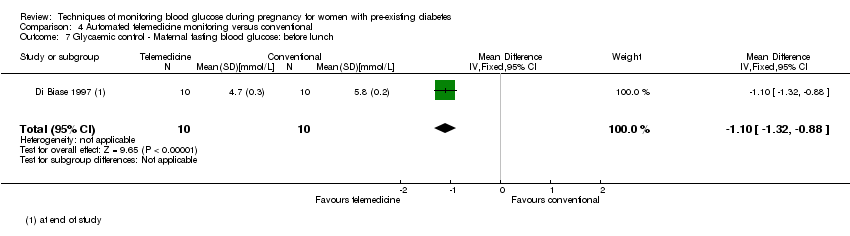
Comparison 4 Automated telemedicine monitoring versus conventional, Outcome 7 Glycaemic control ‐ Maternal fasting blood glucose: before lunch.

Comparison 4 Automated telemedicine monitoring versus conventional, Outcome 8 Glycaemic control ‐ Maternal HbA1c.

Comparison 4 Automated telemedicine monitoring versus conventional, Outcome 9 Glycaemic control ‐ Maternal post‐prandial blood glucose.
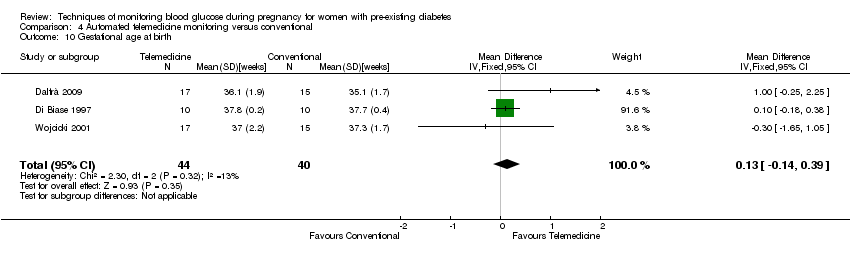
Comparison 4 Automated telemedicine monitoring versus conventional, Outcome 10 Gestational age at birth.

Comparison 4 Automated telemedicine monitoring versus conventional, Outcome 11 Macrosomia.
Comparison 4 Automated telemedicine monitoring versus conventional, Outcome 12 Birthweight.

Comparison 5 Continuous glucose monitoring versus intermittent glucose monitoring, Outcome 1 Pre‐eclampsia.

Comparison 5 Continuous glucose monitoring versus intermittent glucose monitoring, Outcome 2 Caesarean section.

Comparison 5 Continuous glucose monitoring versus intermittent glucose monitoring, Outcome 3 Large‐for‐gestational age.
Comparison 5 Continuous glucose monitoring versus intermittent glucose monitoring, Outcome 4 Perinatal mortality.

Comparison 5 Continuous glucose monitoring versus intermittent glucose monitoring, Outcome 5 Glycaemic control ‐ Maternal HbA1c.

Comparison 5 Continuous glucose monitoring versus intermittent glucose monitoring, Outcome 6 Miscarriage.

Comparison 5 Continuous glucose monitoring versus intermittent glucose monitoring, Outcome 7 Neonatal mortality.
Comparison 5 Continuous glucose monitoring versus intermittent glucose monitoring, Outcome 8 Gestational age at birth.
Comparison 5 Continuous glucose monitoring versus intermittent glucose monitoring, Outcome 9 Preterm birth < 37 weeks.
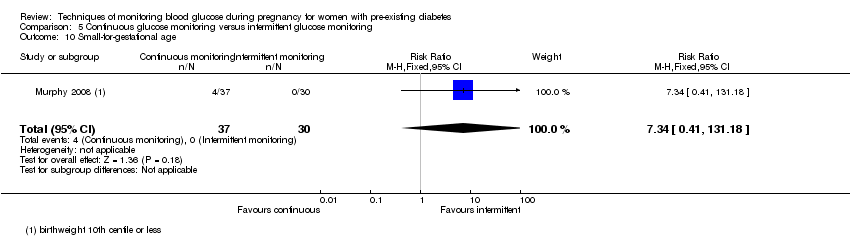
Comparison 5 Continuous glucose monitoring versus intermittent glucose monitoring, Outcome 10 Small‐for‐gestational age.

Comparison 5 Continuous glucose monitoring versus intermittent glucose monitoring, Outcome 11 Birthweight.

Comparison 5 Continuous glucose monitoring versus intermittent glucose monitoring, Outcome 12 Neonatal hypoglycaemia.

Comparison 5 Continuous glucose monitoring versus intermittent glucose monitoring, Outcome 13 Major anomalies.
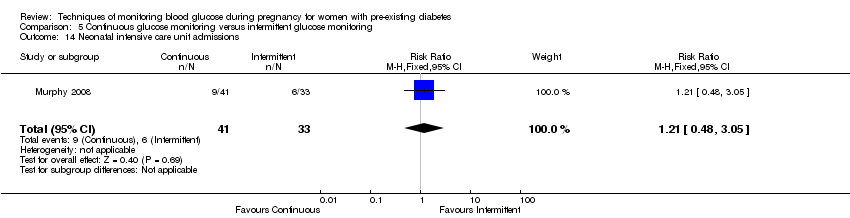
Comparison 5 Continuous glucose monitoring versus intermittent glucose monitoring, Outcome 14 Neonatal intensive care unit admissions.
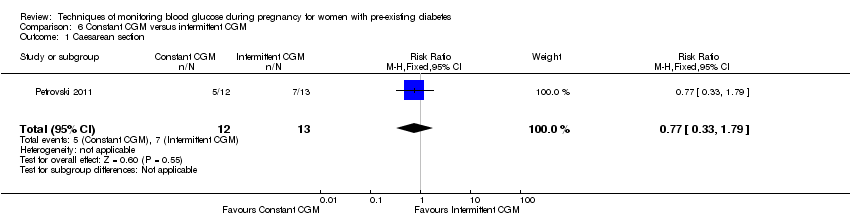
Comparison 6 Constant CGM versus intermittent CGM, Outcome 1 Caesarean section.
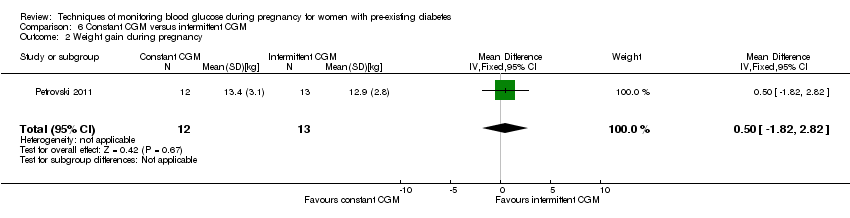
Comparison 6 Constant CGM versus intermittent CGM, Outcome 2 Weight gain during pregnancy.

Comparison 6 Constant CGM versus intermittent CGM, Outcome 3 Insulin dosage, 3rd trimester (IU/kg/day).

Comparison 6 Constant CGM versus intermittent CGM, Outcome 4 Glycaemic control ‐ Maternal blood glucose (1st trimester).
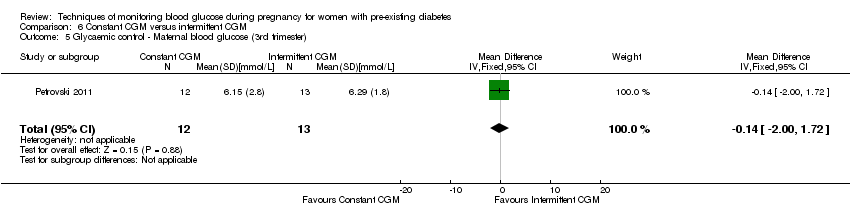
Comparison 6 Constant CGM versus intermittent CGM, Outcome 5 Glycaemic control ‐ Maternal blood glucose (3rd trimester).

Comparison 6 Constant CGM versus intermittent CGM, Outcome 6 Glycaemic control ‐ Maternal HbA1c (1st trimester).
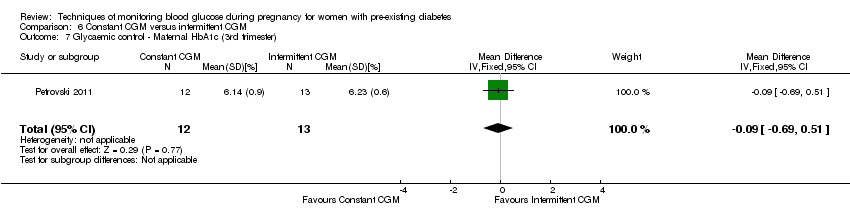
Comparison 6 Constant CGM versus intermittent CGM, Outcome 7 Glycaemic control ‐ Maternal HbA1c (3rd trimester).

Comparison 6 Constant CGM versus intermittent CGM, Outcome 8 Maternal hypoglycemia.
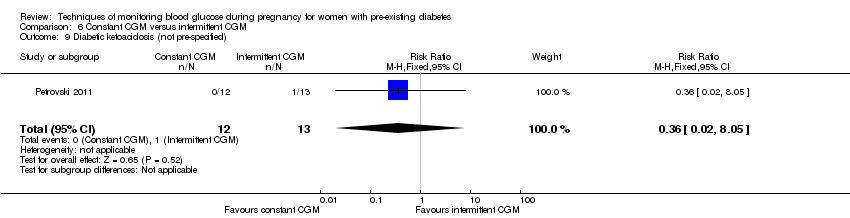
Comparison 6 Constant CGM versus intermittent CGM, Outcome 9 Diabetic ketoacidosis (not pre‐specified).
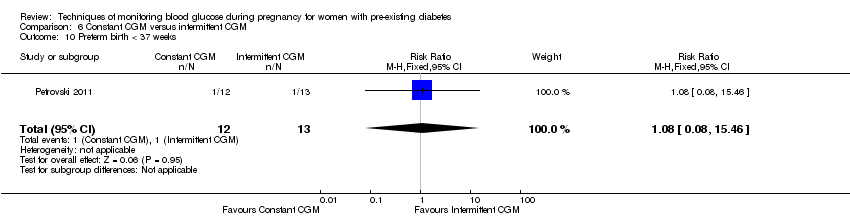
Comparison 6 Constant CGM versus intermittent CGM, Outcome 10 Preterm birth < 37 weeks.

Comparison 6 Constant CGM versus intermittent CGM, Outcome 11 Macrosomia.
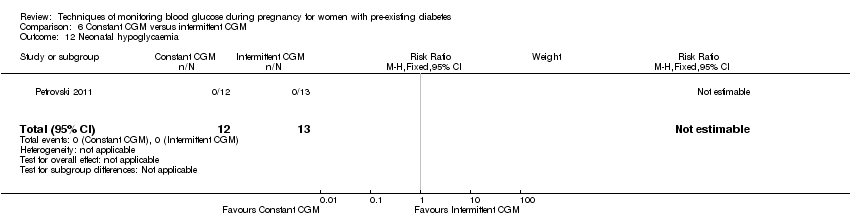
Comparison 6 Constant CGM versus intermittent CGM, Outcome 12 Neonatal hypoglycaemia.
| Self‐monitoring compared to standard care for women with pre‐existing diabetes | ||||||
| Patient or population: women with pre‐existing diabetes | ||||||
| Outcomes | Anticipated absolute effects* (95% CI) | Relative effect | № of participants | Quality of the evidence | Comments | |
| Risk with standard care | Risk with self‐monitoring | |||||
| Hypertensive disorders of pregnancy: pre‐eclampsia | Study population | (0 studies) | The included study did not report this outcome. | |||
| Hypertensive disorders of pregnancy: gestational hypertension | Study population | (0 studies) | The included study did not report this outcome. | |||
| Caesarean section | Study population | RR 0.78 | 28 | ⊕⊝⊝⊝ | ||
| 643 per 1000 | 501 per 1000 | |||||
| Glycaemic control during/end of treatment: Maternal HbA1c (%) | The mean maternal HbA1c was 7.2% | The mean maternal HbA1c with self‐monitoring was 0.10 lower (1.93 lower to 1.73 higher) | 28 | ⊕⊝⊝⊝ | ||
| Glycaemic control during/end of treatment: Maternal post‐prandial blood glucose (mmmol/L) | The mean maternal post‐prandial blood glucose was 5.3 mmol/L | MD 0.70 lower | 13 | ⊕⊝⊝⊝ | ||
| Large‐for‐gestational age | Study population | (0 studies) | The included study did not report this outcome. | |||
| Perinatal mortality | Study population | RR 3.00 | 28 | ⊕⊝⊝⊝ | There were no events in the standard care group and so anticipated absolute effects could not be calculated. | |
| 0 per 1000 | 0 per 1000 | |||||
| Preterm birth less than 37 weeks' gestation | Study population | (0 studies) | The included study did not report this outcome. | |||
| Preterm birth less than 34 weeks' gestation | Study population | (0 studies) | The included study did not report this outcome. | |||
| *The risk in the intervention group (and its 95% confidence interval) is based on the assumed risk in the comparison group and the relative effect of the intervention (and its 95% CI). | ||||||
| GRADE Working Group grades of evidence | ||||||
| 1 One study with design limitations. 2 Wide CI crossing the line of no effect, few events and small sample size. 3 Wide CI crossing the line of no effect, and small sample size. | ||||||
| Self‐monitoring compared to hospitalisation for women with pre‐existing diabetes | ||||||
| Patient or population: women with pre‐existing diabetes | ||||||
| Outcomes | Anticipated absolute effects* (95% CI) | Relative effect | № of participants | Quality of the evidence | Comments | |
| Risk with hospitalisation | Risk with self‐monitoring | |||||
| Hypertensive disorders of pregnancy: pre‐eclampsia | Study population | RR 4.26 | 100 | ⊕⊝⊝⊝ | ||
| 22 per 1000 | 93 per 1000 | |||||
| Hypertensive disorders of pregnancy: hypertension in pregnancy | Study population | RR 0.43 | 100 | ⊕⊝⊝⊝ | ||
| 87 per 1000 | 37 per 1000 | |||||
| Caesarean section | Study population | RR 0.96 | 100 | ⊕⊝⊝⊝ | ||
| 500 per 1000 | 480 per 1000 | |||||
| Glycaemic control during/end of treatment: maternal HbA1c | (0 studies) | The included study did not report this outcome. | ||||
| Glycaemic control during/end of treatment: maternal post‐prandial blood glucose | (0 studies) | The included study did not report this outcome. | ||||
| Large‐for‐gestational age | Study population | (0 studies) | The included study did not report this outcome. | |||
| Perinatal mortality | Study population | RR 0.85 | 100 | ⊕⊝⊝⊝ | ||
| 22 per 1000 | 18 per 1000 | |||||
| Preterm birth less than 37 weeks' gestation | Study population | RR 0.85 | 100 | ⊕⊝⊝⊝ | ||
| 304 per 1000 | 259 per 1000 | |||||
| Preterm birth less than 34 weeks' gestation | Study population | (0 studies) | The included study did not report this outcome. | |||
| *The risk in the intervention group (and its 95% confidence interval) is based on the assumed risk in the comparison group and the relative effect of the intervention (and its 95% CI). | ||||||
| GRADE Working Group grades of evidence | ||||||
| 1 One study with design limitations. 2 Wide CI crossing the line of no effect, few events and small sample size. | ||||||
| Pre‐prandial compared to post‐prandial glucose monitoring for women with pre‐existing diabetes | ||||||
| Patient or population: women with pre‐existing diabetes | ||||||
| Outcomes | Anticipated absolute effects* (95% CI) | Relative effect | № of participants | Quality of the evidence | Comments | |
| Risk with post‐prandial glucose monitoring | Risk with pre‐prandial | |||||
| Hypertensive disorders of pregnancy: pre‐eclampsia | Study population | RR 6.43 | 58 | ⊕⊝⊝⊝ | ||
| 33 per 1000 | 214 per 1000 | |||||
| Hypertensive disorders of pregnancy: gestational hypertension | Study population | (0 studies) | The included study did not report this outcome. | |||
| Caesarean section | Study population | RR 1.45 | 61 | ⊕⊝⊝⊝ | ||
| 467 per 1000 | 677 per 1000 | |||||
| Glycaemic control during/end of treatment: HbA1c (%) | The mean hbA1c was 6% | The mean maternal HbA1c with pre‐prandial monitoring as 0.30 higher (0.08 lower to 0.68 higher) | 61 | ⊕⊝⊝⊝ | ||
| Glycaemic control during/end of treatment: post‐prandial blood glucose | (0 studies) | The included study did not report this outcome. | ||||
| Large‐for‐gestational age | Study population | RR 1.16 | 61 | ⊕⊝⊝⊝ | ||
| 500 per 1000 | 580 per 1000 | |||||
| Perinatal mortality | Study population | RR 2.91 | 61 | ⊕⊝⊝⊝ | There were no events in the standard care group and so anticipated absolute effects could not be calculated. | |
| 0 per 1000 | 0 per 1000 | |||||
| Preterm birth less than 37 weeks | Study population | RR 1.33 | 61 | ⊕⊝⊝⊝ | ||
| 267 per 1000 | 355 per 1000 | |||||
| Preterm birth less than 34 weeks' gestation | Study population | (0 studies) | The included study did not report this outcome. | |||
| *The risk in the intervention group (and its 95% confidence interval) is based on the assumed risk in the comparison group and the relative effect of the intervention (and its 95% CI). | ||||||
| GRADE Working Group grades of evidence | ||||||
| 1 One study with design limitations. 2 Wide CI crossing the line of no effect, few events and small sample size. 3 Wide CI crossing the line of no effect, and small sample size. | ||||||
| Automated telemedicine monitoring compared to conventional for women with pre‐existing diabetes | ||||||
| Patient or population: women with pre‐existing diabetes | ||||||
| Outcomes | Anticipated absolute effects* (95% CI) | Relative effect | № of participants | Quality of the evidence | Comments | |
| Risk with conventional monitoring | Risk with automated telemedicine monitoring | |||||
| Hypertensive disorders of pregnancy: pre‐eclampsia, gestational hypertension | Study population | (0 studies) | The included studies did not report this outcome. | |||
| Hypertensive disorders of pregnancy: gestational hypertension | Study population | (0 studies) | The included studies did not report this outcome. | |||
| Caesarean section | Study population | RR 0.96 | 32 | ⊕⊝⊝⊝ | ||
| 733 per 1000 | 704 per 1000 | |||||
| Glycaemic control during/end of treatment: maternal HbA1c (%) | The mean maternal HbA1c ranged from 5.7 to 6.7% | The mean maternal HbA1c with automated telemedicine monitoring as 0.17 lower (0.82 lower to 0.48 higher) | 82 | ⊕⊝⊝⊝ | ||
| Glycaemic control during/end of treatment: maternal post‐prandial blood glucose (mmol/L) | The mean maternal post‐prandial blood glucose ranged from 6.9 to 7.6% | The mean post‐prandial blood glucose with automated telemedicine monitoring as 0.80 lower (1.67 lower to 0.08 higher) | 50 | ⊕⊝⊝⊝ | ||
| Large‐for‐gestational age | Study population | (0 studies) | The included studies did not report this outcome. | |||
| Perinatal mortality | Study population | (0 studies) | The included studies did not report this outcome. | |||
| Preterm birth less than 37 weeks' gestation | Study population | (0 studies) | The included studies did not report this outcome. | |||
| Preterm birth less than 34 weeks' gestation | Study population | (0 studies) | The included studies did not report this outcome. | |||
| *The risk in the intervention group (and its 95% confidence interval) is based on the assumed risk in the comparison group and the relative effect of the intervention (and its 95% CI). | ||||||
| GRADE Working Group grades of evidence | ||||||
| 1 One study with serious design limitations. 2 Wide CI crossing the line of no effect, few events and small sample size. 3 Studies had design limitations. 4 Statistical heterogeneity (I² = 82%). 5 Wide CI crossing the line of no effect, and small sample size. 6 Statistical heterogeneity (I² = 86%). | ||||||
| Continuous glucose monitoring compared to intermittent glucose monitoring for women with pre‐existing diabetes | ||||||
| Patient or population: women with pre‐existing diabetes | ||||||
| Outcomes | Anticipated absolute effects* (95% CI) | Relative effect | № of participants | Quality of the evidence | Comments | |
| Risk with intermittent glucose monitoring | Risk with continuous glucose monitoring | |||||
| Hypertensive disorders of pregnancy: pre‐eclampsia | Study population | RR 1.37 | 225 | ⊕⊕⊝⊝ | ||
| 56 per 1000 | 76 per 1000 | |||||
| Hypertensive disorders of pregnancy: gestational hypertension | Study population | (0 studies) | The included studies did not report this outcome. | |||
| Caesarean section | Study population | RR 1.00 | 225 | ⊕⊝⊝⊝ | ||
| 481 per 1000 | 481 per 1000 | |||||
| Glycaemic control during/end of treatment: maternal HbA1c (%) | The mean maternal HbA1c was 6.4% | The mean maternal HbA1c with continuous glucose monitoring was 0.60 lower (0.91 lower to 0.29 higher) | 71 | ⊕⊕⊕⊝ | ||
| Glycaemic control during/end of treatment: post‐prandial blood glucose | (0 studies) | The included studies did not report this outcome. | ||||
| Large‐for‐gestational age | Study population | RR 0.89 | 221 | ⊕⊝⊝⊝ | ||
| 410 per 1000 | 364 per 1000 | |||||
| Perinatal mortality | Study population | RR 0.82 | 71 | ⊕⊕⊝⊝ | ||
| 31 per 1000 | 26 per 1000 | |||||
| Preterm birth less than 37 weeks | Study population | RR 1.10 | 228 | ⊕⊕⊝⊝ | ||
| 167 per 1000 | 183 per 1000 | |||||
| Preterm birth less than 34 weeks' gestation | Study population | (0 studies) | The included studies did not report this outcome. | |||
| *The risk in the intervention group (and its 95% confidence interval) is based on the assumed risk in the comparison group and the relative effect of the intervention (and its 95% CI). | ||||||
| GRADE Working Group grades of evidence | ||||||
| 1 Wide CI crossing the line of no effect, few events and small sample size. 2 Statistical heterogeneity (I² = 62%). 3 Wide CI crossing the line of no effect, and small sample size. 4 Small sample size. 5 Statistical heterogeneity (I² = 82%). | ||||||
| Constant CGM compared to Intermittent CGM for women with pre‐existing diabetes | ||||||
| Patient or population: women with pre‐existing diabetes | ||||||
| Outcomes | Anticipated absolute effects* (95% CI) | Relative effect | № of participants | Quality of the evidence | Comments | |
| Risk with Intermittent CGM | Risk with constant CGM | |||||
| Hypertensive disorders of pregnancy: pre‐eclampsia | Study population | (0 studies) | The included study did not report this outcome. | |||
| Hypertensive disorders of pregnancy: gestational hypertension | Study population | (0 studies) | The included study did not report this outcome. | |||
| Caesarean section | Study population | RR 0.77 | 25 | ⊕⊝⊝⊝ | ||
| 538 per 1000 | 415 per 1000 | |||||
| Glycaemic control during/end of treatment: maternal HbA1c (3rd trimester) (%) | The mean maternal HbA1c (3rd trimester) was 6.23% | The mean maternal HbA1c with constant CGM was 0.09 lower (0.69 lower to 0.51 higher) | 25 | ⊕⊝⊝⊝ | ||
| Glycaemic control during/end of treatment: maternal blood glucose (3rd trimester) (mmmol/L) | The mean maternal blood glucose (3rd trimester) was 0 | The mean maternal blood glucose (3rd trimester) with constant CGM was 0.14 lower (2.00 lower to 1.72 higher) | 25 | ⊕⊝⊝⊝ | ||
| Large‐for‐gestational age | Study population | (0 studies) | The included study did not report this outcome. | |||
| Perinatal mortality | Study population | (0 studies) | The included study did not report this outcome. | |||
| Preterm birth less than 37 weeks' gestation | Study population | RR 1.08 | 25 | ⊕⊝⊝⊝ | ||
| 77 per 1000 | 83 per 1000 | |||||
| Preterm birth less than 34 weeks' gestation | Study population | (0 studies) | The included study did not report this outcome. | |||
| *The risk in the intervention group (and its 95% confidence interval) is based on the assumed risk in the comparison group and the relative effect of the intervention (and its 95% CI). | ||||||
| GRADE Working Group grades of evidence | ||||||
| 1 One study with design limitations. 2 Wide CI crossing the line of no effect, few events and small sample size. 3 Wide CI crossing the line of no effect, and small sample size. | ||||||
| Outcome or subgroup title | No. of studies | No. of participants | Statistical method | Effect size |
| 1 Caesarean section Show forest plot | 1 | 28 | Risk Ratio (M‐H, Fixed, 95% CI) | 0.78 [0.40, 1.49] |
| 2 Perinatal mortality Show forest plot | 1 | 28 | Risk Ratio (M‐H, Fixed, 95% CI) | 3.0 [0.13, 67.91] |
| 3 Neonatal mortality and morbidity composite Show forest plot | 1 | 28 | Risk Ratio (M‐H, Fixed, 95% CI) | 3.0 [0.13, 67.91] |
| 4 Glycaemic control during/end of treatment (maternal post‐prandial blood glucose) Show forest plot | 1 | 13 | Mean Difference (IV, Fixed, 95% CI) | ‐0.70 [‐2.15, 0.75] |
| 5 Glycaemic control during/end of treatment (maternal HbA1c) Show forest plot | 1 | 28 | Mean Difference (IV, Fixed, 95% CI) | ‐0.10 [‐1.93, 1.73] |
| 6 Miscarriage Show forest plot | 1 | 30 | Risk Ratio (M‐H, Fixed, 95% CI) | 1.0 [0.07, 14.55] |
| 7 Neonatal mortality Show forest plot | 1 | 28 | Risk Ratio (M‐H, Fixed, 95% CI) | 3.0 [0.13, 67.91] |
| 8 Gestational age at birth Show forest plot | 1 | 28 | Mean Difference (IV, Fixed, 95% CI) | 0.40 [‐1.65, 2.45] |
| 9 Birthweight Show forest plot | 2 | 41 | Mean Difference (IV, Fixed, 95% CI) | ‐0.18 [‐0.49, 0.13] |
| 10 Respiratory distress syndrome Show forest plot | 1 | 28 | Risk Ratio (M‐H, Fixed, 95% CI) | 3.0 [0.13, 67.91] |
| 11 Neonatal hypoglycaemia Show forest plot | 1 | 28 | Risk Ratio (M‐H, Fixed, 95% CI) | 0.57 [0.21, 1.52] |
| 12 Neonatal jaundice (hyperbilirubinaemia) Show forest plot | 1 | 28 | Risk Ratio (M‐H, Fixed, 95% CI) | 0.56 [0.25, 1.24] |
| 13 Neonatal hypocalcaemia Show forest plot | 1 | 28 | Risk Ratio (M‐H, Fixed, 95% CI) | 1.0 [0.07, 14.45] |
| 14 Neonatal polycythaemia Show forest plot | 1 | 28 | Risk Ratio (M‐H, Fixed, 95% CI) | 0.33 [0.01, 7.55] |
| 15 Neonatal cord vein C‐peptide Show forest plot | 1 | 28 | Mean Difference (IV, Fixed, 95% CI) | 0.13 [‐0.50, 0.76] |
| Outcome or subgroup title | No. of studies | No. of participants | Statistical method | Effect size |
| 1 Pre‐eclampsia Show forest plot | 1 | 100 | Risk Ratio (M‐H, Fixed, 95% CI) | 4.26 [0.52, 35.16] |
| 2 Hypertension in pregnancy Show forest plot | 1 | 100 | Risk Ratio (M‐H, Fixed, 95% CI) | 0.43 [0.08, 2.22] |
| 3 Caesarean section Show forest plot | 1 | 100 | Risk Ratio (M‐H, Fixed, 95% CI) | 0.96 [0.65, 1.44] |
| 4 Perinatal mortality Show forest plot | 1 | 100 | Risk Ratio (M‐H, Fixed, 95% CI) | 0.85 [0.05, 13.24] |
| 5 Placental abruption Show forest plot | 1 | 100 | Risk Ratio (M‐H, Fixed, 95% CI) | 1.70 [0.16, 18.19] |
| 6 Preterm birth < 37 weeks Show forest plot | 1 | 100 | Risk Ratio (M‐H, Fixed, 95% CI) | 0.85 [0.45, 1.60] |
| 7 Respiratory distress syndrome Show forest plot | 1 | 100 | Risk Ratio (M‐H, Fixed, 95% CI) | 2.56 [0.28, 23.74] |
| 8 Neonatal hypoglycaemia Show forest plot | 1 | 100 | Risk Ratio (M‐H, Fixed, 95% CI) | 1.01 [0.50, 2.03] |
| 9 Neonatal jaundice (hyperbilirubinaemia) Show forest plot | 1 | 100 | Risk Ratio (M‐H, Fixed, 95% CI) | 2.27 [0.64, 8.07] |
| 10 Major anomalies Show forest plot | 1 | 102 | Risk Ratio (M‐H, Fixed, 95% CI) | 0.27 [0.03, 2.54] |
| 11 Antenatal hospital admission Show forest plot | 1 | 100 | Risk Ratio (M‐H, Fixed, 95% CI) | 0.19 [0.11, 0.33] |
| 12 Feeding difficulties (not pre‐specified) Show forest plot | 1 | 100 | Risk Ratio (M‐H, Fixed, 95% CI) | 0.85 [0.41, 1.78] |
| Outcome or subgroup title | No. of studies | No. of participants | Statistical method | Effect size |
| 1 Pre‐eclampsia Show forest plot | 1 | 58 | Risk Ratio (M‐H, Fixed, 95% CI) | 6.43 [0.82, 50.11] |
| 2 Caesarean section Show forest plot | 1 | 61 | Risk Ratio (M‐H, Fixed, 95% CI) | 1.45 [0.92, 2.28] |
| 3 Large‐for‐gestational age Show forest plot | 1 | 61 | Risk Ratio (M‐H, Fixed, 95% CI) | 1.16 [0.73, 1.85] |
| 4 Perinatal mortality Show forest plot | 1 | 61 | Risk Ratio (M‐H, Fixed, 95% CI) | 2.91 [0.12, 68.66] |
| 5 Weight gain during pregnancy Show forest plot | 1 | 61 | Mean Difference (IV, Fixed, 95% CI) | ‐0.90 [‐3.86, 2.06] |
| 6 Insulin dose Show forest plot | 1 | 61 | Mean Difference (IV, Fixed, 95% CI) | ‐17.40 [‐43.41, 8.61] |
| 7 Glycaemic control ‐ Insulin dose Show forest plot | 1 | 61 | Mean Difference (IV, Fixed, 95% CI) | ‐0.20 [‐0.45, 0.05] |
| 8 Glycaemic control ‐ HbA1c Show forest plot | 1 | 61 | Mean Difference (IV, Fixed, 95% CI) | 0.30 [‐0.08, 0.68] |
| 9 Stillbirth Show forest plot | 1 | 61 | Risk Ratio (M‐H, Fixed, 95% CI) | 2.91 [0.12, 68.66] |
| 10 Gestational age at birth Show forest plot | 1 | 61 | Mean Difference (IV, Fixed, 95% CI) | 0.20 [‐0.84, 1.24] |
| 11 Preterm birth < 37 weeks Show forest plot | 1 | 61 | Risk Ratio (M‐H, Fixed, 95% CI) | 1.33 [0.62, 2.84] |
| 12 Macrosomia Show forest plot | 1 | 61 | Risk Ratio (M‐H, Fixed, 95% CI) | 2.18 [0.75, 6.32] |
| 13 Birthweight Show forest plot | 1 | 61 | Mean Difference (IV, Fixed, 95% CI) | 0.24 [‐0.10, 0.58] |
| 14 Adiposity ‐ Subscapula skinfold thickness Show forest plot | 1 | 61 | Mean Difference (IV, Fixed, 95% CI) | 0.60 [‐0.18, 1.38] |
| 15 Adiposity ‐ Triceps skinfold thickness Show forest plot | 1 | 61 | Mean Difference (IV, Fixed, 95% CI) | 0.60 [0.04, 1.16] |
| 16 Birth trauma (shoulder dystocia, bone fracture, nerve palsy) (not pre‐specified as a composite) Show forest plot | 1 | 61 | Risk Ratio (M‐H, Fixed, 95% CI) | 0.48 [0.05, 5.06] |
| 17 Respiratory distress syndrome Show forest plot | 1 | 61 | Risk Ratio (M‐H, Fixed, 95% CI) | 0.97 [0.06, 14.78] |
| 18 Neonatal hypoglycaemia Show forest plot | 1 | 61 | Risk Ratio (M‐H, Fixed, 95% CI) | 1.09 [0.48, 2.45] |
| 19 Neonatal jaundice (hyperbilirubinaemia) Show forest plot | 1 | 61 | Risk Ratio (M‐H, Fixed, 95% CI) | 1.16 [0.40, 3.40] |
| 20 Cord IGF‐1 Show forest plot | 1 | 61 | Mean Difference (IV, Fixed, 95% CI) | 1.30 [‐0.70, 3.30] |
| 21 Neonatal glucose at age 1 hour (not pre‐specified) Show forest plot | 1 | 61 | Mean Difference (IV, Fixed, 95% CI) | ‐0.20 [‐0.88, 0.48] |
| 22 Transient tachypnea (not pre‐specified) Show forest plot | 1 | 61 | Risk Ratio (M‐H, Fixed, 95% CI) | 2.58 [0.76, 8.81] |
| 23 Neonatal intensive care admissions Show forest plot | 1 | 59 | Risk Ratio (M‐H, Fixed, 95% CI) | 1.04 [0.62, 1.74] |
| Outcome or subgroup title | No. of studies | No. of participants | Statistical method | Effect size |
| 1 Caesarean section Show forest plot | 1 | 32 | Risk Ratio (M‐H, Fixed, 95% CI) | 0.96 [0.62, 1.48] |
| 2 Neonatal morbidity composite Show forest plot | 1 | 32 | Risk Ratio (M‐H, Fixed, 95% CI) | 1.18 [0.53, 2.62] |
| 3 Weight gain during pregnancy [kg] Show forest plot | 1 | 32 | Mean Difference (IV, Fixed, 95% CI) | ‐0.70 [‐4.95, 3.55] |
| 4 Use of additional insulin therapy Show forest plot | 1 | 32 | Risk Ratio (M‐H, Fixed, 95% CI) | 1.0 [0.89, 1.12] |
| 5 Insulin requirement at end of study Show forest plot | 1 | 20 | Mean Difference (IV, Fixed, 95% CI) | 18.4 [12.88, 23.92] |
| 6 Glycaemic control ‐ Maternal fasting blood glucose: before breakfast Show forest plot | 1 | 20 | Mean Difference (IV, Fixed, 95% CI) | ‐1.0 [‐1.22, ‐0.78] |
| 7 Glycaemic control ‐ Maternal fasting blood glucose: before lunch Show forest plot | 1 | 20 | Mean Difference (IV, Fixed, 95% CI) | ‐1.10 [‐1.32, ‐0.88] |
| 8 Glycaemic control ‐ Maternal HbA1c Show forest plot | 3 | 82 | Mean Difference (IV, Random, 95% CI) | ‐0.17 [‐0.82, 0.48] |
| 9 Glycaemic control ‐ Maternal post‐prandial blood glucose Show forest plot | 2 | 50 | Mean Difference (IV, Random, 95% CI) | ‐0.80 [‐1.67, 0.08] |
| 10 Gestational age at birth Show forest plot | 3 | 84 | Mean Difference (IV, Fixed, 95% CI) | 0.13 [‐0.14, 0.39] |
| 11 Macrosomia Show forest plot | 1 | 32 | Risk Ratio (M‐H, Fixed, 95% CI) | 1.18 [0.31, 4.43] |
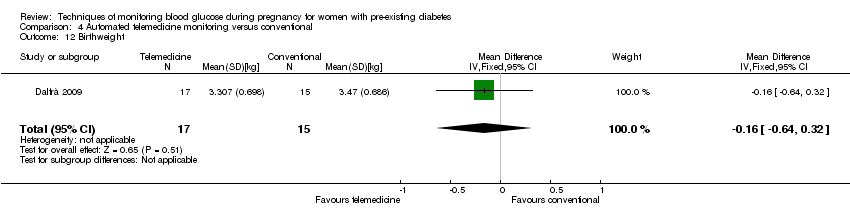
| 12 Birthweight Show forest plot | 1 | 32 | Mean Difference (IV, Fixed, 95% CI) | ‐0.16 [‐0.64, 0.32] |
| Outcome or subgroup title | No. of studies | No. of participants | Statistical method | Effect size |
| 1 Pre‐eclampsia Show forest plot | 2 | 225 | Risk Ratio (M‐H, Fixed, 95% CI) | 1.37 [0.52, 3.59] |
| 2 Caesarean section Show forest plot | 2 | 225 | Risk Ratio (M‐H, Random, 95% CI) | 1.00 [0.65, 1.54] |
| 3 Large‐for‐gestational age Show forest plot | 2 | 221 | Risk Ratio (M‐H, Random, 95% CI) | 0.89 [0.41, 1.92] |
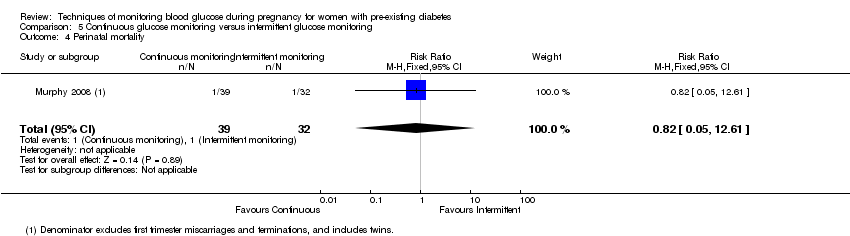
| 4 Perinatal mortality Show forest plot | 1 | 71 | Risk Ratio (M‐H, Fixed, 95% CI) | 0.82 [0.05, 12.61] |
| 5 Glycaemic control ‐ Maternal HbA1c Show forest plot | 1 | 71 | Mean Difference (IV, Fixed, 95% CI) | ‐0.60 [‐0.91, ‐0.29] |
| 6 Miscarriage Show forest plot | 2 | 228 | Risk Ratio (M‐H, Fixed, 95% CI) | 1.21 [0.28, 5.24] |
| 7 Neonatal mortality Show forest plot | 1 | 74 | Risk Ratio (M‐H, Fixed, 95% CI) | 0.80 [0.05, 12.39] |
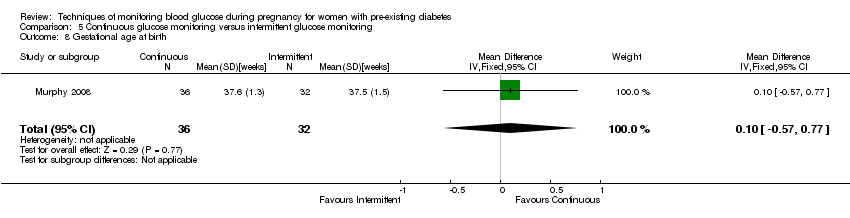
| 8 Gestational age at birth Show forest plot | 1 | 68 | Mean Difference (IV, Fixed, 95% CI) | 0.10 [‐0.57, 0.77] |
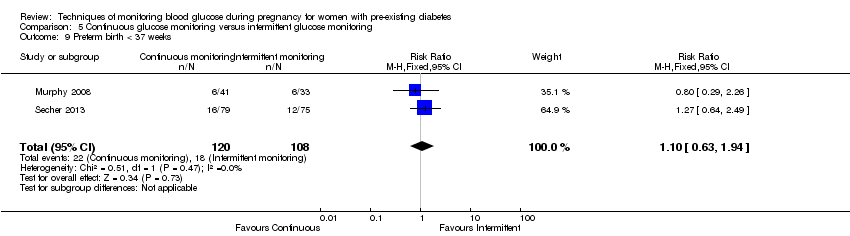
| 9 Preterm birth < 37 weeks Show forest plot | 2 | 228 | Risk Ratio (M‐H, Fixed, 95% CI) | 1.10 [0.63, 1.94] |
| 10 Small‐for‐gestational age Show forest plot | 1 | 67 | Risk Ratio (M‐H, Fixed, 95% CI) | 7.34 [0.41, 131.18] |
| 11 Birthweight Show forest plot | 1 | 67 | Mean Difference (IV, Fixed, 95% CI) | ‐0.29 [‐0.59, 0.01] |
| 12 Neonatal hypoglycaemia Show forest plot | 2 | 228 | Risk Ratio (M‐H, Fixed, 95% CI) | 0.77 [0.51, 1.16] |
| 13 Major anomalies Show forest plot | 1 | 74 | Risk Ratio (M‐H, Fixed, 95% CI) | 0.80 [0.05, 12.39] |
| 14 Neonatal intensive care unit admissions Show forest plot | 1 | 74 | Risk Ratio (M‐H, Fixed, 95% CI) | 1.21 [0.48, 3.05] |
| Outcome or subgroup title | No. of studies | No. of participants | Statistical method | Effect size |
| 1 Caesarean section Show forest plot | 1 | 25 | Risk Ratio (M‐H, Fixed, 95% CI) | 0.77 [0.33, 1.79] |
| 2 Weight gain during pregnancy Show forest plot | 1 | 25 | Mean Difference (IV, Fixed, 95% CI) | 0.5 [‐1.82, 2.82] |
| 3 Insulin dosage, 3rd trimester (IU/kg/day) Show forest plot | 1 | 25 | Mean Difference (IV, Fixed, 95% CI) | ‐0.03 [‐1.30, 1.24] |
| 4 Glycaemic control ‐ Maternal blood glucose (1st trimester) Show forest plot | 1 | 25 | Mean Difference (IV, Fixed, 95% CI) | ‐0.5 [‐2.70, 1.70] |
| 5 Glycaemic control ‐ Maternal blood glucose (3rd trimester) Show forest plot | 1 | 25 | Mean Difference (IV, Fixed, 95% CI) | ‐0.14 [‐2.00, 1.72] |
| 6 Glycaemic control ‐ Maternal HbA1c (1st trimester) Show forest plot | 1 | 25 | Mean Difference (IV, Fixed, 95% CI) | ‐0.30 [‐1.13, 0.53] |
| 7 Glycaemic control ‐ Maternal HbA1c (3rd trimester) Show forest plot | 1 | 25 | Mean Difference (IV, Fixed, 95% CI) | ‐0.09 [‐0.69, 0.51] |
| 8 Maternal hypoglycemia Show forest plot | 1 | 25 | Risk Ratio (M‐H, Fixed, 95% CI) | 0.54 [0.06, 5.24] |
| 9 Diabetic ketoacidosis (not pre‐specified) Show forest plot | 1 | 25 | Risk Ratio (M‐H, Fixed, 95% CI) | 0.36 [0.02, 8.05] |
| 10 Preterm birth < 37 weeks Show forest plot | 1 | 25 | Risk Ratio (M‐H, Fixed, 95% CI) | 1.08 [0.08, 15.46] |
| 11 Macrosomia Show forest plot | 1 | 25 | Risk Ratio (M‐H, Fixed, 95% CI) | 1.08 [0.08, 15.46] |
| 12 Neonatal hypoglycaemia Show forest plot | 1 | 25 | Risk Ratio (M‐H, Fixed, 95% CI) | 0.0 [0.0, 0.0] |