妊娠前已有糖尿病的妇女在孕期的血糖监测技术
摘要
研究背景
有多种监测已患糖尿病妇女的孕期血糖水平的方法,建议将血糖自我监测(self‐monitoring of blood glucose, SMBG)作为管理计划的关键组成部分。现存的系统综述没有考虑不同的血糖监测技术对于孕前已患糖尿病的妇女在其怀孕后女性及胎儿结局的益处和有效性。各种监测技术的有效性尚不明确。本系统综述首次发表于2014年,现在在2017年更新的基础上再次进行更新。
研究目的
比较不同血糖监测技术对孕前已患糖尿病的妇女在其怀孕后母体及胎儿结局的影响。
检索策略
此次更新中,我们检索了Cochrane妊娠及分娩试验注册库(Cochrane Pregnency and Childbirth's Trials Register)、临床试验(ClinicalTrials .gov)、世界卫生组织国际临床试验注册平台(the WHO International Clinical Trials Registry Platform,ICTRP)(2018年,11月1日),及纳入研究的参考文献。
纳入排除标准
采用随机对照试验(Randomised controlled trials, RCTs)和准随机对照试验(quasi–RTCs)来比较孕前已患糖尿病(包括1型和2型)的妇女在其怀孕后监测血糖的各种技术,包括自我血糖监测技术(SMBG)、动态血糖监测(Continuous glucose monitoring, CGM)、自动化远程医疗监测(automated telemedicine monitoring)或诊室监测。试验的监测时间和监测频率也有条件纳入其中。一系列随机设计的随机试验也有条件被纳入,但是都没有被确证。调查了监测时间和频率的研究也纳入其中。整群随机对照试验也符合纳入条件,但是没有找到相关研究。
资料收集与分析
两名系统综述作者独立评估了研究是否符合条件,提取资料,并评估了纳入研究的风险偏倚。对数据的准确性进行了核查。我们使用GRADE方法来评估证据的质量。
主要结果
本更新综述纳入113项试验(22,373名女性),共21项对照类型的数据。660名;2型糖尿病:113名女性;类型1或类型2(未指定):171名妇女。试验开展于欧洲,美国和加拿大。12项纳入研究中有三项为低等风险偏倚,八项为中等风险偏倚,一项为高等风险偏倚。四项试验报告由生产商免费或以较低成本提供动态血糖监测。
动态血糖监测(CGM)与间歇性血糖监测(intermittent glucose monitoring,四项研究,609名妇女)
动态血糖监测可能会减少妊娠期高血压疾病(子痫前期和妊娠高血压)(RR=0.58, 95%CI[ 0.39, 0.85 ];两项研究,384名妇女;低等质量证据),虽然四项相关研究中仅两项报告了此结局。相反地,子痫前期却没有明显减少(RR=0.05, 95%CI[0.39, 1.08];四项研究,609名妇女,中等质量证据)。同时流产(平均RR=0.94, 95%CI[0.75, 1.18];三项研究,427名妇女;I2=41%,中等质量证据)或者巨大儿(平均RR=0.84, 95%CI[0.57, 1.26];三项研究,421名妇女;I2=70%,低质量证据)也没有明显降低。因为基于一个低质量的单项研究,因此没有足够的证据评估围生期死亡率(RR=0.82, 95%CI[0.05, 12.61], 71名婴儿,一项研究,低质量证据)或死亡率和发病率综合指标(RR=0.80, 95%CI[0.61, 1.06];一项研究,200名妇女)。CGM似乎降低了新生儿低血糖症(RR=0.66, 95%CI[0.48, 0.93];三项研究,428名婴儿)。神经感觉障碍未被报告。
其他血糖监测方法
以下五组比较中,尚不明确任何的干预措施对我们的GRADE结局(妊娠期高血压、剖腹产、巨大儿)有任何影响:自我监测与另一种不同的自我监测(两项研究,43名妇女);在家自我监测与住院(一项研究,100名妇女);餐前与餐后血糖监测(一项研究,61名妇女);自动化远程医疗监测与常规系统监测(三项研究,84名妇女)和持续性CGM与间歇性CGM(一项研究,25名妇女)。原因是证据质量非常低。具体指,证据多来源于有设计和精确度局限性的单个研究(宽可信区间,小样本量,少量事件)。没有足够的证据评价围生期死亡率、新生儿死亡率和发病率综合指标。在任何比较中也没有报告其他重要结局,如神经感觉障碍。
作者结论
有两项新的研究(406名妇女)纳入此次更新的比较之一。虽然证据表明,与间歇性血糖监测相比,CGM可能会减少妊娠期高血压病,但是并没有明显减少子痫前期。所以这个结果应该谨慎对待。这次比较中没有证据证明其他主要结局的差异。其他五组比较中,对于其他的监测技术,有效性的证据基础是薄弱的,主要是基于低质量的单一研究证据。需要更多的设计完好的大型随机试验证据,以确定CGM的有效性。
PICO
简语概要
血糖监测方法改善糖尿病孕妇结局
问题是什么,为什么重要?
如果女性在怀孕前就有了糖尿病,那么她的孩子出现各种问题的风险更高。在受孕及孕期前三个月未能良好控制血糖的糖尿病妇女流产、婴儿发育问题或者死产的风险增加。婴儿在童年期患糖尿病的风险也会增加。母亲的问题包括高血压及相关问题、早产、巨大儿、难产及剖腹产。在分娩时,婴儿肩难产(shoulder dystocia)和颅内出血(intracranial haemorrhage)的风险增加。出生后,婴儿也可能出现低血糖(hypoglycaemia)、黄疸和呼吸问题。这意味着他们更可能需要重症监护。在孕期,女性进行血糖监测,以便采取适当的步骤来控制血糖。
几种血糖监测方法已被采用,包括产前诊所的定期监测和在家的自我监测。监测时间及频率多样,如餐前监测和餐后监测。动态血糖监测(continuous glucose monitoring, CGM)是直接将妇女血糖资料信息传递给其临床医生的一种技术,包括远程医疗(电话和视频系统、信息技术)和数字技术(移动电话、平板)。这些方法的目的是提供一个更准确的血糖水平,以便于有效控制血糖,减少潜在问题的发生。
我们找到了什么证据?
本次更新的系统综述,首次发表于2014年,更新于2017年。我们从2018年11月的随机对照试验中检索证据。确定了12项试验,涉及944名妇女(1型糖尿病:660名;2型糖尿病:113名;有两项试验,涉及171名妇女,是1型和2型混合型糖尿病)。试验开展于欧洲、美国和加拿大。
有六组比较。它们是:持续性与间歇性血糖监测(四项研究,609名妇女);两种不同的自我血糖监测(两项研究,43名妇女);在家自我监测与住院治疗控制血糖(一项研究,100名妇女);餐前血糖监测与餐后血糖监测(一项研究,61名妇女);自动化远程医疗监测与常规护理(三项研究,84名妇女);和持续性动态血糖监测与间歇性动态血糖监测(一项研究,25名妇女)。
持续性与间歇性监测可能减少总体的高血压问题(两项研究,384名妇女,低质量证据)。然而,值得注意的是四项相关研究中仅有两项报告了此结局。高血压及尿蛋白(子痫前期)有更多的证据,但是没有明显差异(四项研究,609名妇女)。我们也没有发现剖腹产妇女的数量有任何差异(三项研究,427名妇女,中等质量证据)。没有足够的证据评估婴儿死亡率或者合并婴儿死亡与不健康结局,这些结局仅是基于单一研究的结果。四项研究从商业合作伙伴获得了一些支持。
其他不同血糖监测技术的比较基于一些很小的研究或者低质量的单个研究,并没有明确的差异性结果。
这意味着什么?
虽然随机对照试验的证据表明,持续血糖监测对减少孕期高血压问题可能更有效,但仅只有两项研究对此进行了报告。基于四项研究的证据表明,对于子痫前期并没有明显的降低。对于其他的监测方法,本系统综述显示,没有足够的证据能够证明哪一种监测方法更好。虽然随机对照试验的证据表明,持续血糖监测对减少孕期高血压问题可能更有效,但仅只有两项研究对此进行了报告。基于四项研究的证据表明,对于子痫前期并没有明显的降低。对于其他的监测方法,本系统综述显示,没有足够的证据能够证明哪一种监测方法更好。需要开展更多的研究,以分析哪种血糖监测方法最有利于减少孕前就患有糖尿病的妇女怀孕后的合并症风险,及持续血糖监测的有效性。
Authors' conclusions
Summary of findings
| Continuous glucose monitoring compared to intermittent glucose monitoring for women with pre‐existing diabetes | ||||||
| Patient or population: women with pre‐existing diabetes Intervention: continuous glucose monitoring | ||||||
| Outcomes | Anticipated absolute effects* (95% CI) | Relative effect | № of participants | Certainty of the evidence | Comments | |
| Risk with intermittent self‐glucose monitoring | Risk with continuous glucose monitoring | |||||
| Hypertensive disorders of pregnancy (including pre‐eclampsia, pregnancy‐induced hypertension, eclampsia) | Study population | RR 0.58 | 384 | ⊕⊕⊝⊝ | ||
| 292 per 1000 | 170 per 1000 | |||||
| Caesarean section | Study population | RR 0.94 | 427 | ⊕⊕⊕⊝ | ||
| 600 per 1000 | 564 per 1000 | |||||
| Large‐for‐gestational age | Study population | RR 0.84 | 421 | ⊕⊕⊝⊝ | ||
| 546 per 1000 | 459 per 1000 | |||||
| Perinatal mortality (stillbirth and neonatal mortality) | Study population | RR 0.82 | 71 | ⊕⊕⊝⊝ | ||
| 31 per 1000 | 26 per 1000 | |||||
| *The risk in the intervention group (and its 95% confidence interval) is based on the assumed risk in the comparison group and the relative effect of the intervention (and its 95% CI). | ||||||
| GRADE Working Group grades of evidence | ||||||
| 1 We downgraded (1) level for serious limitations in study design due to unclear risk of allocation concealment and high risk for selective outcome reporting 2 We downgraded (1) level for serious indirectness due to the two studies reporting this composite outcome in different ways: Voormolen 2018 reported a composite of pregnancy‐induced hypertension and pre‐eclampsia for women with type 1 diabetes and type 2 diabetes for; and Feig 2017 reporting a composite of worsening chronic, gestational and pre‐eclampsia for women with type 1 diabetes 3 We downgraded (1) level for serious inconsistency due to evidence of statistical heterogeneity I2 = 41% 4 We downgraded (1) level for serious imprecision due to wide CI crossing the line of no effect 5 We downgraded (1) level for serious inconsistency due to evidence of statistical heterogeneity I2 = 70% 6 We downgrade (2) levels for very serious imprecision due to evidence derived from a single study, with a small number of events, wide CI crossing the line of no effect | ||||||
| Self‐monitoring compared to standard care for women with pre‐existing diabetes | ||||||
| Patient or population: women with pre‐existing diabetes | ||||||
| Outcomes | Anticipated absolute effects* (95% CI) | Relative effect | № of participants | Quality of the evidence | Comments | |
| Risk with standard care | Risk with self‐monitoring | |||||
| Hypertensive disorders of pregnancy (including pre‐eclampsia, pregnancy‐induced hypertension, eclampsia) | Study population | (0 studies) | The included study did not report this outcome. | |||
| Caesarean section | Study population | RR 0.78 | 28 | ⊕⊝⊝⊝ | ||
| 643 per 1000 | 501 per 1000 | |||||
| Large‐for‐gestational age | Study population | (0 studies) | The included study did not report this outcome. | |||
| Perinatal mortality (stillbirth and neonatal mortality) | Study population | RR 3.00 | 28 | ⊕⊝⊝⊝ | There were no events in the standard care group and so anticipated absolute effects could not be calculated. | |
| 0 per 1000 | 0 per 1000 | |||||
| *The risk in the intervention group (and its 95% confidence interval) is based on the assumed risk in the comparison group and the relative effect of the intervention (and its 95% CI). | ||||||
| GRADE Working Group grades of evidence | ||||||
| 1 We downgraded (1) level for serious limitations in design limitations due unclear allocation concealment and high risk for attrition 2 We downgraded (2) levels for very serious imprecision due to wide CI crossing the line of no effect, few events and small sample size | ||||||
| Self‐monitoring compared to hospitalisation for women with pre‐existing diabetes | ||||||
| Patient or population: women with pre‐existing diabetes | ||||||
| Outcomes | Anticipated absolute effects* (95% CI) | Relative effect | № of participants | Quality of the evidence | Comments | |
| Risk with hospitalisation | Risk with self‐monitoring | |||||
| Hypertensive disorders of pregnancy (including pre‐eclampsia, pregnancy‐induced hypertension, eclampsia) | Study population | RR 1.19 (0.41 to 3.51) | 100 (1 RCT) | ⊕⊝⊝⊝ | ||
| 109 per 1000 | 129 per 1000 (45 to 381) | |||||
| Caesarean section | Study population | RR 0.96 | 100 | ⊕⊝⊝⊝ | ||
| 500 per 1000 | 480 per 1000 | |||||
| Large‐for‐gestational age | Study population | (0 studies) | The included study did not report this outcome. | |||
| Perinatal mortality (stillbirth and neonatal mortality) | Study population | RR 0.85 | 100 | ⊕⊝⊝⊝ | ||
| 22 per 1000 | 18 per 1000 | |||||
| *The risk in the intervention group (and its 95% confidence interval) is based on the assumed risk in the comparison group and the relative effect of the intervention (and its 95% CI). | ||||||
| GRADE Working Group grades of evidence | ||||||
| 1 We downgraded (1) level for serious limitations in study design due to unclear randomisation, allocation concealment and high risk for attrition 2 We downgraded (2) levels for very serious imprecision due to wide CI crossing the line of no effect, few events and small sample size | ||||||
| Pre‐prandial compared to post‐prandial glucose monitoring for women with pre‐existing diabetes | ||||||
| Patient or population: women with pre‐existing diabetes Intervention: pre‐prandial | ||||||
| Outcomes | Anticipated absolute effects* (95% CI) | Relative effect | № of participants | Quality of the evidence | Comments | |
| Risk with post‐prandial glucose monitoring | Risk with pre‐prandial | |||||
| Hypertensive disorders of pregnancy (including pre‐eclampsia, pregnancy‐induced hypertension, eclampsia) | Study population | (0 studies) | The included study did not report this composite outcome. | |||
| Caesarean section | Study population | RR 1.45 | 61 | ⊕⊝⊝⊝ | ||
| 467 per 1000 | 677 per 1000 | |||||
| Large‐for‐gestational age | Study population | RR 1.16 | 61 | ⊕⊝⊝⊝ | ||
| 500 per 1000 | 580 per 1000 | |||||
| Perinatal mortality (stillbirth and neonatal mortality) | Study population | RR 2.91 | 61 | ⊕⊝⊝⊝ | There were no events in the standard care group and so anticipated absolute effects could not be calculated. | |
| 0 per 1000 | 0 per 1000 | |||||
| *The risk in the intervention group (and its 95% confidence interval) is based on the assumed risk in the comparison group and the relative effect of the intervention (and its 95% CI). | ||||||
| GRADE Working Group grades of evidence | ||||||
| 1 We downgraded (1) level for serious limitations in study design due to unclear methods of randomisation and high risk of attrition 2 We downgrade (2) levels for very serious limitations in imprecision due to wide CI crossing the line of no effect, few events and small sample size | ||||||
| Automated telemedicine monitoring compared to conventional for women with pre‐existing diabetes | ||||||
| Patient or population: women with pre‐existing diabetes | ||||||
| Outcomes | Anticipated absolute effects* (95% CI) | Relative effect | № of participants | Quality of the evidence | Comments | |
| Risk with conventional monitoring | Risk with automated telemedicine monitoring | |||||
| Hypertensive disorders of pregnancy (including pre‐eclampsia, pregnancy‐induced hypertension, eclampsia) | Study population | (0 studies) | The included studies did not report this composite outcome. | |||
| Caesarean section | Study population | RR 0.96 | 32 | ⊕⊝⊝⊝ | ||
| 733 per 1000 | 704 per 1000 | |||||
| Large‐for‐gestational age | Study population | (0 studies) | The included studies did not report this outcome. | |||
| Perinatal mortality (stillbirth and neonatal mortality) | Study population | (0 studies) | The included studies did not report this outcome. | |||
| *The risk in the intervention group (and its 95% confidence interval) is based on the assumed risk in the comparison group and the relative effect of the intervention (and its 95% CI). | ||||||
| GRADE Working Group grades of evidence | ||||||
| 1 We downgraded (2) levels for very serious design limitations due to high risk for randomisation, allocation concealment, attrition and other bias 2 We downgraded (2) levels for very serious imprecision due to wide CI crossing the line of no effect, few events and small sample size | ||||||
| Constant CGM compared to Intermittent CGM for women with pre‐existing diabetes | ||||||
| Patient or population: women with pre‐existing diabetes | ||||||
| Outcomes | Anticipated absolute effects* (95% CI) | Relative effect | № of participants | Quality of the evidence | Comments | |
| Risk with Intermittent CGM | Risk with constant CGM | |||||
| Hypertensive disorders of pregnancy (including pre‐eclampsia, pregnancy‐induced hypertension, eclampsia) | Study population | (0 studies) | The included study did not report this outcome. | |||
| Caesarean section | Study population | RR 0.77 | 25 | ⊕⊝⊝⊝ | ||
| 538 per 1000 | 415 per 1000 | |||||
| Large‐for‐gestational age | Study population | (0 studies) | The included study did not report this outcome. | |||
| Perinatal mortality (stillbirth and neonatal mortality) | Study population | (0 studies) | The included study did not report this outcome. | |||
| *The risk in the intervention group (and its 95% confidence interval) is based on the assumed risk in the comparison group and the relative effect of the intervention (and its 95% CI). | ||||||
| GRADE Working Group grades of evidence | ||||||
| 1 We downgraded (1) level for serious limitations in design due to unclear randomisation and allocation concealment 2 We downgraded (2) levels for very serious limitations in imprecision due to wide CI crossing the line of no effect, few events and small sample size | ||||||
Background
Description of the condition
Types of diabetes
There are three main types of diabetes mellitus: type 1, type 2 and gestational diabetes mellitus (GDM). Type 1 or insulin‐dependent diabetes results from the body’s failure to produce sufficient insulin and accounts for a minority of the total burden of diabetes in a population. Type 2 diabetes results from a failure of the body to utilise insulin, causing high blood sugar levels. Type 2 diabetes alone constitutes about 85% to 95% of all diabetes globally (IDF 2010). Type 2 diabetes is a serious and growing global health problem that has evolved in association with rapid cultural and social changes, ageing populations, increasing urbanisation, dietary changes, reduced physical activity and other unhealthy lifestyle and behavioural patterns (WHO 1994). In GDM, women who were not previously diabetic develop carbohydrate intolerance resulting in hyperglycaemia (high blood sugar levels) with first onset or detection occurring during pregnancy (HAPO 2002). GDM develops in one in 25 pregnancies worldwide and it is associated with the increasing incidence of type 2 diabetes post‐pregnancy. There are also women who are diagnosed with type 1 or type 2 diabetes before they get pregnant and so have pre‐existing diabetes. This review focuses on women with pre‐existing diabetes.
Prevalence of diabetes
Diabetes mellitus is found in every population in the world and it is estimated that 6.6% of the global population in the age group of 20 to 79 years old had diabetes in 2010. By 2030, it is estimated that 7.8% of the adult population will have diabetes (IDF 2010).
Diabetes mellitus complicates about 2% to 3% of all pregnancies. Approximately 90% of diabetes in pregnancy is accounted for by GDM. Pre‐existing type 1 and type 2 diabetes account for the remaining 10% of diabetes during pregnancy (Moore 2010). This review considers only the care of pregnant women with pre‐existing diabetes. A separate Cochrane Review on GDM has been published (Raman 2017).
Complications of diabetes in pregnancy: for mother and baby
Women with diabetes of any kind are at increased risk of morbidity and mortality during pregnancy. Pregnancy outcomes for women with pre‐existing diabetes and their infants are poor compared to those for women who do not have diabetes (NICE 2008; NICE 2015). The risks to both women and infants include fetal macrosomia (large baby), preterm birth, birth trauma (to mother and infant), induction of labour or caesarean section, miscarriage, congenital malformation, stillbirth, transient neonatal morbidity, neonatal death, obesity or diabetes, or both developing later in the baby’s life (Gonzalez‐Gonzalez 2008; Kitzmiller 2008; NICE 2008; NICE 2015).
Women with diabetes have an increased risk of an early miscarriage and are at increased risk of having a baby with malformations. Both of these risks are associated with less than optimal glycaemic control around the time of conception and in the first trimester. The risks appear to be approximately equivalent for women with type 1 and type 2 diabetes. The increased rate of spontaneous miscarriages and fetal malformation appears to be low when glycaemic control is moderately raised, and higher with increasingly poor glycaemic control (IDF 2010; Jensen 2009). Women with diabetes should be encouraged to obtain the best possible glycaemic control before conception (Kitzmiller 2010). Women with uncontrolled glycaemic levels should be discouraged from becoming pregnant until their blood glucose control can be improved.
Macrosomia, defined as infant birthweight greater than 4.5 kg, remains the commonest complication of pregnancy in women with diabetes (IDF 2010; Kitzmiller 2008; NICE 2008; NICE 2015). Macrosomia occurs in 27% to 62% of infants of diabetic mothers compared with 10% of non‐diabetic mothers (Gabbe 2003). Nationwide studies from the Netherlands, the UK, and Denmark estimate that the risk of a mother with type 1 diabetes giving birth to a baby who is large‐for‐gestational age, or has macrosomia ranges from 48.8% to 62.5% (Kitzmiller 2008). Recent data confirm that women with type 2 diabetes have an equally high risk of giving birth to an infant with macrosomia (ACOG 2005; ADA 2004; Roland 2005). For mothers with diabetes, macrosomia leads to an increased risk of perineal lacerations, complications in labour, and delivery by caesarean section (Slocum 2004). There are increased risks for the infants of intracranial haemorrhage, shoulder dystocia, neonatal hypoglycaemia, jaundice, and respiratory distress (Thomas 2006), as well as the longer‐term health risks of insulin resistance, obesity and type 2 diabetes (McElduff 2005). Overt diabetes is an undisputed factor for preterm birth (Sibai 2000).
Fetal hyperglycaemia causes fetal hypoxia and acidosis, which may explain the excess stillbirth rates observed in women with poorly controlled diabetes (Kitzmiller 2008). Infants with macrosomia due to poor maternal glycaemic control and fetal hyperinsulinaemia are more likely to develop obesity and glucose intolerance later in life (Fetita 2006; Kitzmiller 2008). Long‐term (five to 15 years) follow‐up studies of infants of mothers with diabetes suggest that poor glycaemic control during pregnancy has a negative influence on intellectual and psychomotor development (Kitzmiller 2008). Both findings highlight the prolonged effects on offspring of intrauterine exposure to diabetes (Fetita 2006; Kitzmiller 2008).
Glycaemic control prior to conception and in early pregnancy
The increased risks in women with diabetes of an early miscarriage and of having a baby with malformations are associated with suboptimal glycaemic control before or around the time of conception, and in the first trimester. Guidelines recommend that women should achieve the best possible glycaemic control before conception: women who improve their glycaemic control before conception have a reduced rate of fetal malformation (Fuhrmann 1983; IDF 2010; NICE 2008; NICE 2015).
Maternal hyperglycaemia during the first few weeks of pregnancy is strongly associated with increased spontaneous abortions and major congenital malformations (Kitzmiller 1996; Ray 2001). After 12 weeks’ gestation, hyperglycaemia induces fetal hyperinsulinaemia, accelerated growth, and excess adiposity in animal models and in women with diabetes (Gabbe 2003). These risks appear to be approximately equivalent for women with type 1 and type 2 diabetes. The increased rate of spontaneous miscarriages appears to be low when the HbA1c is modestly raised, and higher with increasingly poor glycaemic control (Mills 1988; Rosenn 1991). The same pattern is also found with respect to the rate of fetal malformations (Greene 1989; Suhonen 2000).
Description of the intervention
Techniques of blood glucose monitoring
Glucose readings supply trend information that helps to identify and prevent unwanted periods of hypo‐ and hyperglycaemia that are associated with adverse outcomes for both mother and baby. Women with type 1 and type 2 diabetes are advised to self‐monitor their blood glucose throughout pregnancy (IDF 2010).
Techniques of blood glucose monitoring to be considered in this review include self‐monitoring of blood glucose (SMBG), continuous glucose monitoring (CGM) and clinic monitoring (for which timing and frequency of monitoring are also considered).
-
Self‐monitoring of blood glucose (SMBG): a glucose meter (glucometer), with or without memory, can be used to measure capillary glucose. Conventional intensified glucose monitoring is defined as three to four blood glucose measurements per day (ADA 2011). Post‐prandial glucose during pregnancy has been identified as the best predictor of neonatal macrosomia (de Veciana 1995; Moses 1999). Therefore, SMBG protocols for women with type 1 or type 2 diabetes during pregnancy stress the importance of measuring blood glucose after meals (Jovanovič 2009), while for non‐pregnant women with diabetes, pre‐prandial values are recommended (ADA 2011; NICE 2008; NICE 2015).
-
Continuous glucose monitoring (CGM): the continuous glucose monitors currently available measure blood glucose either with minimal invasiveness through continuous measurement of interstitial fluid (ISF) or with the non‐invasive method of applying electromagnetic radiation through the skin to blood vessels in the body. The technologies for bringing a sensor into contact with ISF include inserting an indwelling sensor subcutaneously (into the abdominal wall or arm) to measure ISF in situ or harvesting this fluid by various mechanisms that compromise the skin barrier and delivering the fluid to an external sensor (Choleau 2002). After a warm‐up period of up to two hours and a device‐specific calibration process, each device’s sensor provides a blood glucose reading every one to 10 minutes for up to 72 hours with the minimally invasive technology and up to three months with the non‐invasive technology. CGM can provide up to 288 measurements a day (Murphy 2007).
-
Clinic monitoring refers to routine glucose monitoring during antenatal visits either using capillary or whole blood.
Timing and frequency of glucose monitoring
Post‐prandial glucose monitoring has been shown to be able to improve glycaemic control and thus reduce the risk of neonatal hypoglycaemia, macrosomia and caesarean delivery (de Veciana 1995), as well as to reduce the incidence of pre‐eclampsia and neonatal triceps skinfold thickness (Manderson 2003). Post‐prandial glucose values were most strongly associated with increased birthweight in the studies in which both pre‐ and post‐meal glucose were measured (Mello 2000).
Pregnant women with diabetes mellitus are advised to test fasting and one‐hour post‐prandial blood glucose levels after every meal during pregnancy and those taking insulin are encouraged to test their blood glucose before going to bed at night (NICE 2008; NICE 2015). The American Diabetes Association also recommends SMBG before and after meals and occasionally at night time, to provide optimal results in pregnancy (Kitzmiller 2008).
The optimal frequency and timing of home glucose testing during pregnancy is unknown. In reality the frequency of glucose monitoring will depend on women's compliance, with few managing to carry out high numbers of tests daily (Kerssen 2006).
Educational approaches incorporating additional glucose testing after meals to improve glycaemic control in late gestation have shown potential to reduce birthweight (Howorka 2001).
Glycaemic control during pregnancy among women with pre‐existing diabetes
Pregnancy profoundly affects the management of diabetes (Gabbe 2003; Jovanovic 2006). Pregnancy is associated with changes in insulin sensitivity, which may lead to changes in plasma glucose levels. Hormonal changes during pregnancy cause a progressive increase in insulin resistance, necessitating intensive medical nutrition therapy and frequently adjusted insulin administration throughout the pregnancy. The control of hyperglycaemia in pregnant women with pre‐existing diabetes is essential in order to avoid the above mentioned adverse maternal and infant outcomes (Kitzmiller 2008). Macrosomia and other neonatal complications are minimised with intensified glycaemic control (Kerssen 2007; Kitzmiller 2008; Suhonen 2000).
If it is safely achievable, women with diabetes should aim to keep fasting blood glucose between 3.5 mmol/L and 5.9 mmol/L and one‐hour post‐prandial blood glucose below 7.8 mmol/L during pregnancy (NICE 2008; NICE 2015); HbA1c should be kept below 6.0% (ADA 2011). Excellent glycaemic control throughout the pregnancy is associated with the lowest risk for both maternal, fetal and neonatal complications (Kitzmiller 2008). On the other hand, the targets of glycaemic control for non‐pregnant women with type 1 or type 2 diabetes are less stringent, i.e. fasting blood glucose to be 3.9 mmol/L to 7.2 mmol/L and HbA1c less than 7.0% (ADA 2011).
How the intervention might work
Maternal glucose levels in women with pre‐existing diabetes directly influence those of the fetus. Fetal metabolic complications may give rise to macrosomia, congenital malformation, stillbirth and increased perinatal mortality (IDF 2010; Kapoor 2007; Kitzmiller 2008; NICE 2008; NICE 2015). Blood glucose monitoring allows adjustment of insulin dosage in relation to meal size and type, physical activity, stress and time of the day for women with pre‐existing diabetes during pregnancy (Davidson 2005). This will limit the maternal risk of hypoglycaemic episodes while avoiding prolonged periods of hyperglycaemia. However, the frequency and timing of glucose monitoring will also influence maternal and fetal outcomes.
Why it is important to do this review
Self‐monitoring of blood glucose is recommended as a key component of diabetes therapy during pregnancy and is included in the management plan (IDF 2010; Kitzmiller 2008; NICE 2008; ). No existing systematic reviews consider the benefits of various techniques of blood glucose monitoring on maternal and infant outcomes among pregnant women with pre‐existing diabetes. The effectiveness of the various monitoring techniques is unclear. This systematic review aims to generate information to guide pregnant women with pre‐existing diabetes and their clinicians in their choice of monitoring techniques in order to optimise maternal and infant outcomes. All trials that evaluate any techniques of blood glucose monitoring among pregnant women with pre‐existing diabetes will be considered. This Cochrane Review is an update of a review that was first published in 2014 (Moy 2014) and subsequently updated in 2017 (Moy 2017).
Objectives
To compare techniques of blood glucose monitoring and their impact on maternal and infant outcomes among pregnant women with pre‐existing diabetes.
Methods
Criteria for considering studies for this review
Types of studies
We included randomised controlled trials and quasi‐randomised trials. Cluster‐randomised trials were eligible for inclusion but none were identified. Trials using a cross‐over design were not eligible for inclusion. Abstracts were eligible for inclusion if sufficient information was provided to judge the quality and potential for bias of these trials.
Types of participants
Pregnant women with pre‐existing diabetes mellitus (type 1 or type 2). Women with gestational diabetes mellitus (GDM) were excluded.
Types of interventions
Techniques of blood glucose monitoring including continuous glucose monitoring (CGM), self‐monitoring of blood glucose (SMBG) or clinic monitoring. We also considered the timing and frequency of monitoring.
The following comparisons were considered in this update.
-
Continuous glucose monitoring (CGM) versus intermittent glucose monitoring (i.e. CGM versus standard care)
-
Self‐monitoring of blood glucose (SMBG) versus different type of SMBG
-
SMBG at home versus hospitalisation
-
Pre‐prandial versus post‐prandial glucose monitoring
-
Automated telemedicine monitoring versus conventional system
-
Constant CGM versus intermittent CGM (e.g. use of a glucose monitor 24 hours per day versus use of a monitor 14 days per month)
Types of outcome measures
For this update, we used the Cochrane Pregnancy and Childbirth core outcome set for reviews of diabetes in pregnancy, developed by the Cochrane Pregnancy and Childbirth Australasian satellite.
Primary outcomes
Mother
-
Hypertensive disorders of pregnancy (including pre‐eclampsia, pregnancy‐induced hypertension, eclampsia)
-
Caesarean section
Neonatal/infant
-
Large‐for‐gestational age
-
Perinatal mortality (stillbirth and neonatal mortality)
-
Mortality or morbidity composite (e.g. pregnancy loss (miscarriage, stillbirth, and neonatal death); birth injury; neonatal glycaemia; hyperbilirubinaemia; respiratory distress; and high level neonatal care of more than 24 hours)
-
Neurosensory disability
Secondary outcomes
Mother
-
Pre‐eclampsia
-
Pregnancy‐induced hypertension
-
Eclampsia
-
Induction of labour
-
Perineal trauma
-
Placental abruption
-
Postpartum haemorrhage
-
Postpartum infection
-
Weight gain during pregnancy
-
Adherence to the intervention
-
Behaviour changes associated with the intervention
-
Relevant biomarker changes associated with the intervention (e.g. adiponectin, free fatty acids, triglycerides, high‐density lipoproteins, low‐density lipoproteins, insulin)
-
Sense of well‐being and quality of life
-
Views of the intervention
-
Breastfeeding (e.g. at discharge, six weeks postpartum)
-
Use of additional pharmacotherapy
-
Glycaemic control during/end of treatment (as defined by trialists) (e.g. HbA1c, fructosamine, fasting blood glucose, post‐prandial blood glucose)
-
Maternal hypoglycaemia
-
Maternal mortality
-
Miscarriage
-
Instrumental vaginal birth*
Long‐term maternal outcomes
-
Postnatal depression
-
Postnatal weight retention or return to pre‐pregnancy weight
-
Body mass index (BMI)
-
GDM in a subsequent pregnancy
-
Type 1 diabetes
-
Impaired glucose tolerance
-
Cardiovascular health (as defined by trialists, including blood pressure, hypertension, cardiovascular disease, metabolic syndrome)
Neonatal/infant
-
Stillbirth
-
Neonatal mortality
-
Gestational age at birth
-
Preterm birth (less than 37 weeks' gestation and less than 34 weeks' gestation)
-
Apgar score (less than seven at five minutes)
-
Macrosomia
-
Small‐for‐gestational age
-
Birthweight and z‐score
-
Head circumference and z‐score
-
Length and z‐score
-
Ponderal index
-
Adiposity (e.g. BMI, skinfold thickness)
-
Shoulder dystocia
-
Bone fracture
-
Nerve palsy
-
Respiratory distress syndrome
-
Hypoglycaemia (variously defined)
-
Hyperbilirubinaemia
-
Neonatal hypocalcaemia
-
Polycythaemia
-
Relevant biomarker changes associated with the intervention (e.g. cord c peptide, cord insulin)
-
Major and minor anomalies
Later infant and childhood secondary outcomes
-
Weight and z‐scores
-
Height and z‐scores
-
Head circumference and z‐scores
-
Adiposity (e.g. as measured by BMI, skinfold thickness)
-
Blood pressure
-
Type 1 diabetes
-
Type 2 diabetes
-
Impaired glucose tolerance
-
Dyslipidaemia or metabolic syndrome
-
Educational achievement
Child in adulthood
-
Weight
-
Height
-
Adiposity (e.g. as measured by BMI, skinfold thickness)
-
Cardiovascular health (as defined by trialists, including blood pressure, hypertension, cardiovascular disease, metabolic syndrome)
-
Type 1 diabetes
-
Type 2 diabetes
-
Impaired glucose tolerance
-
Dyslipidaemia or metabolic syndrome
-
Employment, education and social status/achievement
Health service use
-
Number of hospital or health professional visits (e.g. midwife, obstetrician, physician, dietician, diabetic nurse)
-
Number of antenatal visits or admissions
-
Length of antenatal stay
-
Neonatal intensive care unit admission
-
Neonatal intensive care unit length of stay greater than 24 hours*
-
Length of postnatal stay (mother)
-
Length of postnatal stay (baby)
-
Costs to families associated with the management provided
-
Costs associated with the intervention
-
Cost of maternal care
-
Cost of offspring care
Not pre‐specified
-
Birth trauma (shoulder dystocia, bone fracture, nerve palsy) (not pre‐specified as a composite)
-
Neonatal glucose at age one hour
-
Transient tachypnoea
-
Diabetic ketoacidosis
-
Feeding difficulties
*Outcomes not pre‐specified in our protocol ‐ see Differences between protocol and review.
Search methods for identification of studies
The following methods section of this review is based on a standard template used by Cochrane Pregnancy and Childbirth.
Electronic searches
For this update, we searched Cochrane Pregnancy and Childbirth’s Trials Register by contacting their Information Specialist (1 November 2018).
The Register is a database containing over 25,000 reports of controlled trials in the field of pregnancy and childbirth. It represents over 30 years of searching. For full current search methods used to populate Pregnancy and Childbirth’s Trials Register including the detailed search strategies for CENTRAL, MEDLINE, Embase and CINAHL; the list of handsearched journals and conference proceedings, and the list of journals reviewed via the current awareness service, please follow this link.
Briefly, Cochrane Pregnancy and Childbirth’s Trials Register is maintained by their Information Specialist and contains trials identified from:
-
monthly searches of the Cochrane Central Register of Controlled Trials (CENTRAL);
-
weekly searches of MEDLINE (Ovid);
-
weekly searches of Embase (Ovid);
-
monthly searches of CINAHL (EBSCO);
-
handsearches of 30 journals and the proceedings of major conferences;
-
weekly current awareness alerts for a further 44 journals plus monthly BioMed Central email alerts.
Search results are screened by two people and the full text of all relevant trial reports identified through the searching activities described above is reviewed. Based on the intervention described, each trial report is assigned a number that corresponds to a specific Pregnancy and Childbirth review topic (or topics), and is then added to the Register. The Information Specialist searches the Register for each review using this topic number rather than keywords. This results in a more specific search set that has been fully accounted for in the relevant review sections (Included studies; Excluded studies; Ongoing studies).
In addition, we searched ClinicalTrials.gov and the WHO International Clinical Trials Registry Platform (ICTRP) for unpublished, planned and ongoing trial reports (1 November 2018 using the search methods detailed in Appendix 1.
Searching other resources
We contacted the author of Feig 2017 for additional information (19 March 2019), no reply received to date (26 April 2019).
We searched the reference lists of retrieved studies.
We did not apply any language or date restrictions.
Data collection and analysis
For methods used in the previous version of this review, seeMoy 2017.
For this update, the following methods were used for assessing the seven reports that were identified as a result of the updated search.
The following methods section of this review is based on a standard template used by Cochrane Pregnancy and Childbirth.
Selection of studies
Two review authors independently assessed for inclusion all the potential studies identified as a result of the search strategy. We resolved any disagreement through discussion or, if required, we consulted a third review author.
Data extraction and management
We designed a form to extract data. For eligible studies, two review authors extracted the data using the agreed form. We resolved discrepancies through discussion or, if required, we consulted a third review author. Data were entered into Review Manager software (RevMan 2014) and checked for accuracy.
When information regarding any of the above was unclear, we planned to contact authors of the original reports to provide further details.
Assessment of risk of bias in included studies
Two review authors independently assessed risk of bias for each study using the criteria outlined in the Cochrane Handbook for Systematic Reviews of Interventions (Higgins 2011). Any disagreement was resolved by discussion or by involving a third assessor.
(1) Random sequence generation (checking for possible selection bias)
We described for each included study the method used to generate the allocation sequence in sufficient detail to allow an assessment of whether it should produce comparable groups.
We assessed the method as:
-
low risk of bias (any truly random process, e.g. random number table; computer random number generator);
-
high risk of bias (any non‐random process, e.g. odd or even date of birth; hospital or clinic record number);
-
unclear risk of bias.
(2) Allocation concealment (checking for possible selection bias)
We described for each included study the method used to conceal allocation to interventions prior to assignment and assessed whether intervention allocation could have been foreseen in advance of, or during recruitment, or changed after assignment.
We assessed the methods as:
-
low risk of bias (e.g. telephone or central randomisation; consecutively numbered sealed opaque envelopes);
-
high risk of bias (open random allocation; unsealed or non‐opaque envelopes, alternation; date of birth);
-
unclear risk of bias.
(3.1) Blinding of participants and personnel (checking for possible performance bias)
We described for each included study the methods used, if any, to blind study participants and personnel from knowledge of which intervention a participant received. We considered that studies were at low risk of bias if they were blinded, or if we judged that the lack of blinding was unlikely to affect results. We assessed blinding separately for different outcomes or classes of outcomes.
We assessed the methods as:
-
low, high or unclear risk of bias for participants;
-
low, high or unclear risk of bias for personnel.
(3.2) Blinding of outcome assessment (checking for possible detection bias)
We described for each included study the methods used, if any, to blind outcome assessors from knowledge of which intervention a participant received. We assessed blinding separately for different outcomes or classes of outcomes.
We assessed methods used to blind outcome assessment as:
-
low, high or unclear risk of bias.
(4) Incomplete outcome data (checking for possible attrition bias due to the amount, nature and handling of incomplete outcome data)
We described for each included study, and for each outcome or class of outcomes, the completeness of data including attrition and exclusions from the analysis. We stated whether attrition and exclusions were reported and the numbers included in the analysis at each stage (compared with the total randomised participants), reasons for attrition or exclusion where reported, and whether missing data were balanced across groups or were related to outcomes. Where sufficient information was reported, or could be supplied by the trial authors, we planned to re‐include missing data in the analyses which we undertook.
We assessed methods as:
-
low risk of bias (e.g. no missing outcome data; missing outcome data balanced across groups);
-
high risk of bias (e.g. numbers or reasons for missing data imbalanced across groups; ‘as treated’ analysis done with substantial departure of intervention received from that assigned at randomisation);
-
unclear risk of bias.
(5) Selective reporting (checking for reporting bias)
We described for each included study how we investigated the possibility of selective outcome reporting bias and what we found.
We assessed the methods as:
-
low risk of bias (where it is clear that all of the study’s pre‐specified outcomes and all expected outcomes of interest to the review have been reported);
-
high risk of bias (where not all the study’s pre‐specified outcomes have been reported; one or more reported primary outcomes were not pre‐specified; outcomes of interest are reported incompletely and so cannot be used; study fails to include results of a key outcome that would have been expected to have been reported);
-
unclear risk of bias.
(6) Other bias (checking for bias due to problems not covered by (1) to (5) above)
We described for each included study any important concerns we had about other possible sources of bias.
(7) Overall risk of bias
We made explicit judgements about whether studies were at high risk of bias, according to the criteria given in the Cochrane Handbook for Systematic Reviews of Interventions (Higgins 2011). With reference to (1) to (6) above, we planned to assess the likely magnitude and direction of the bias and whether we considered it is likely to impact on the findings. In future updates, we will explore the impact of the level of bias through undertaking sensitivity analyses ‐ seeSensitivity analysis.
Assessment of the quality of the evidence using the GRADE approach
For this update we assessed the quality of the evidence using the GRADE approach as outlined in the GRADE handbook in order to assess the quality of the body of evidence relating to the following outcomes for all comparisons.
-
Hypertensive disorders of pregnancy (including pre‐eclampsia, pregnancy‐induced hypertension, eclampsia)
-
Caesarean section
-
Large‐for‐gestational age
-
Perinatal mortality (stillbirth and neonatal mortality)
We used the GRADEpro Guideline Development Tool to import data from Review Manager 5.3 (RevMan 2014) in order to create ’Summary of findings’ tables. A summary of the intervention effect and a measure of quality for each of the above outcomes was produced using the GRADE approach. The GRADE approach uses five considerations (study limitations, consistency of effect, imprecision, indirectness and publication bias) to assess the quality of the body of evidence for each outcome. The evidence can be downgraded from 'high quality' by one level for serious (or by two levels for very serious) limitations, depending on assessments for risk of bias, indirectness of evidence, serious inconsistency, imprecision of effect estimates or potential publication bias.
Measures of treatment effect
Dichotomous data
For dichotomous data, we presented results as summary risk ratio with 95% confidence intervals.
Continuous data
We used the mean difference if outcomes were measured in the same way between trials. In future updates, if appropriate, we will use the standardised mean difference to combine trials that measure the same outcome, but use different methods.
Unit of analysis issues
Trials with more than two intervention groups
Had we included trials with more than two techniques of glucose monitoring, we planned to analyse them according to the methods described in the Cochrane Handbook for Systematic Reviews of Interventions (Higgins 2011); the relevant pair of interventions would have been selected and the others excluded.
Cluster‐randomised trials
We did not identify any cluster‐randomised trials for inclusion. However, in future updates, if we identify any cluster‐randomised trials we will include them in the analyses along with individually‐randomised trials. We will adjust their sample sizes using the methods described in the Cochrane Handbook for Systematic Reviews of Interventions using an estimate of the intracluster correlation co‐efficient (ICC) derived from the trial (if possible), from a similar trial or from a study of a similar population. If we use ICCs from other sources, we will report this and conduct sensitivity analyses to investigate the effect of variation in the ICC. If we identify both cluster‐randomised trials and individually‐randomised trials, we plan to synthesise the relevant information. We will consider it reasonable to combine the results from both if there is little heterogeneity between the study designs and the interaction between the effect of intervention and the choice of randomisation unit is considered to be unlikely. We will also acknowledge heterogeneity in the randomisation unit and perform a sensitivity analysis to investigate the effects of the randomisation unit.
Dealing with missing data
For included studies, levels of attrition were noted. In future updates, if more eligible studies are included, the impact of including studies with high levels of missing data in the overall assessment of treatment effect will be explored by using sensitivity analysis.
For all outcomes, analyses were carried out, as far as possible, on an intention‐to‐treat basis, i.e. we attempted to include all participants randomised to each group in the analyses. The denominator for each outcome in each trial was the number randomised minus any participants whose outcomes were known to be missing.
Assessment of heterogeneity
We assessed statistical heterogeneity in each meta‐analysis using the Tau², I² and Chi² statistics. We regarded heterogeneity as substantial if an I² was greater than 30% and either a Tau² was greater than zero, or there was a low P value (less than 0.10) in the Chi² test for heterogeneity. Had we identified substantial heterogeneity (above 30%), we planned to explore it by pre‐specified subgroup analysis.
Assessment of reporting biases
In future updates, if there are 10 or more studies in the meta‐analysis we will investigate reporting biases (such as publication bias) using funnel plots. We will assess funnel plot asymmetry visually. If asymmetry is suggested by a visual assessment, we will perform exploratory analyses to investigate it.
Data synthesis
We carried out statistical analysis using the Review Manager software (RevMan 2014). We used fixed‐effect meta‐analysis for combining data where it was reasonable to assume that studies were estimating the same underlying treatment effect: i.e. where trials were examining the same intervention, and the trials’ populations and methods were judged sufficiently similar.
If there was clinical heterogeneity sufficient to expect that the underlying treatment effects differed between trials, or if substantial statistical heterogeneity was detected, we used random‐effects meta‐analysis to produce an overall summary, if an average treatment effect across trials was considered clinically meaningful. The random‐effects summary was treated as the average of the range of possible treatment effects and we discuss the clinical implications of treatment effects differing between trials. If the average treatment effect was not clinically meaningful, we did not combine trials. Where we used random‐effects analyses, the results are presented as the average treatment effect with 95% confidence intervals, and the estimates of Tau² and I².
Subgroup analysis and investigation of heterogeneity
Had we identified substantial heterogeneity, we planned to investigate it using subgroup analyses and to consider whether an overall summary was meaningful, and if it was, to use a random‐effects analysis to produce it.
We planned to restrict subgroup analyses to primary outcomes for the following subgroups:
-
types of diabetes mellitus (type 1 versus type 2 diabetes);
-
glycaemic control prior to pregnancy (pre‐pregnancy HbA1c within target range versus pre‐pregnancy HbA1c out of target range).
However, we did not carry out any subgroup analysis as there were too few trials included in any one comparison. Data for outcomes in included trials were also not reported separately by type of diabetes. Pre‐pregnancy glycaemic control for all women was comparable at baseline. These analyses will be conducted in future updates of the review, if more data become available.
Sensitivity analysis
We planned to undertake sensitivity analysis to explore differences between fixed‐effect or random‐effects analyses for outcomes with statistical heterogeneity.
We also planned to undertake sensitivity analysis to assess the effect on pooled results of studies considered to have a high risk of bias.
However, due to the scarcity of data in any one comparison, no sensitivity analyses were conducted. If more data become available, the planned sensitivity analyses will be carried out in future updates.
Results
Description of studies
See Characteristics of included studies; Characteristics of excluded studies.
Results of the search
See: Figure 1.

Study flow diagram 2018
For this 2018 update, we identified 149 trial reports to assess and 113 in total after duplicates had been removed. One‐hundred and six reports were screened out because they did not meet the scope for this review or were not randomised controlled trials. We then assessed seven trial reports for inclusion. We also reassessed the two ongoing studies listed in the previous version of the review (five reports).
We included two new trials (Feig 2017; Voormolen 2018) (three reports), added one trial report to an already included study (di Biase 1997), and added one trial report to an already excluded study (Bartholomew 2011). No new studies were excluded in this update. Two trials (two reports) are ongoing (Link 2018; Logan 2011), see Ongoing studies. The two studies previously listed in ongoing were additional reports of the newly included studies (five reports).
Included studies
Altogether, this review now comprises 12 included studies (944 women), all of which contributed data. Three of the 12 included trials were from the UK (Manderson 2003; Murphy 2008; Stubbs 1980), two were from Italy (Dalfrà 2009; di Biase 1997), and one each was from Sweden (Hanson 1984), Denmark (Secher 2013), Macedonia (Petrovski 2011), Poland (Wojcicki 2001), the US (Varner 1983), Canada (Feig 2017) and the Netherlands (Voormolen 2018).
For full details, see Characteristics of included studies.
Methods
All included studies were parallel group randomised controlled trials and involved two arms. The randomisation method was not always well described and in one study the allocation process was not truly random, and so was assessed as being 'quasi‐randomised' (Dalfrà 2009). All of the studies were described as being 'open‐label' and therefore not blinded. Two studies were multi‐centre trials: one was based in Canada and involved 31 hospitals in Canada, England, Scotland, Spain, Italy, Ireland and the USA (Feig 2017); and one involved 22 hospitals, university, teaching and non‐teaching hospitals in the Netherlands and one university hospital in Belgium (Voormolen 2018). The remaining trials were single centre (Dalfrà 2009; di Biase 1997; Hanson 1984; Manderson 2003; Murphy 2008; Petrovski 2011; Secher 2013; Stubbs 1980; Varner 1983; Wojcicki 2001).
Trial dates
Trial dates were not reported in the study reports for six trials (Dalfrà 2009; di Biase 1997; Manderson 2003; Petrovski 2011; Stubbs 1980; Wojcicki 2001).
For the remaining studies, trials dates were reported as follows: 25 March 2013 to 22 March 2016 (Feig 2017); 1 October 1979 to 1 October 1982 (Hanson 1984); September 2003 to 2006 (Murphy 2008); 15 February 2009 to 15 February 2011 (Secher 2013); 1 February 1980 to 16 September 1981 (Varner 1983); and July 2011 to September 2015 (Voormolen 2018).
Participants
The trials included in this review involved a total of 944 women; 660 with type 1 diabetes, 113 with type 2 diabetes, and 171 women with either type 1 or type 2 diabetes (data not reported separately).
Hanson 1984, Murphy 2008 and Secher 2013 included women with pre‐existing type 1 and type 2 diabetes (however, only Secher 2013 presented the results separately for type 1 and type 2 diabetes). Only women with pre‐existing type 1 diabetes were eligible to participate in di Biase 1997Feig 2017, Manderson 2003,Petrovski 2011,Stubbs 1980,Varner 1983, and Wojcicki 2001. In one trial (Feig 2017), they ran two trials in parallel for pregnant women and for women planning a pregnancy with type 1 diabetes. However the results for most outcomes were reported separately and so we have included the data for the pregnant women in this review. Women with pre‐existing type 1 diabetes and gestational diabetes participated in Dalfrà 2009, however the results are presented separately so only data for women with type 1 diabetes are included in this review. Women with pre‐existing type 1 and type 2 diabetes and gestational diabetes participated in Voormolen 2018, however the results are presented separately for some of the outcomes, so only data for women with type 1 and type 2 diabetes are included in this review. The ethnicity of the women was not mentioned in all trials. As these trials originated from the European countries and the USA, it is assumed that majority of the women were white or Caucasians.
Interventions and comparisons
Continuous glucose monitoring (CGM) was compared with intermittent glucose monitoring in trials by Feig 2017, Murphy 2008, Secher 2013 and Voormolen 2018. Stubbs 1980 and Varner 1983 compared self‐monitoring of blood glucose (SMBG) at home with standard care. In Stubbs 1980 the SMBG group measured blood glucose with a glucometer seven times a day, twice weekly and the standard care group (non‐meter group) checked urine glucose four times daily, with random blood glucose measured at fortnightly clinic visits. In Varner 1983, the SMBG group carried out daily home glucose monitoring four times daily and the standard care group carried out weekly venipuncture three times daily, measured on one day weekly. Hanson 1984 compared self‐monitoring blood glucose at home from the 32nd week until the 36th week of gestation, with weekly hospital visits, and hospitalisation during the 37th week to delivery with a group who were hospitalised from 32nd week until delivery. Manderson 2003 compared timing of glucose monitoring, i.e. pre‐prandial versus post‐prandial. Pre‐prandial refers to measurement of blood glucose before meals while post‐prandial refers to blood glucose measured two hours after a meal. Automated telemedicine monitoring versus conventional system were compared in studies by Dalfrà 2009, di Biase 1997 and Wojcicki 2001. Automated telemedicine monitoring refers to automated transmission of blood glucose values via telephone or Internet to the physicians, which allows immediate attention from the physicians. Petrovski 2011 compared constant CGM with intermittent CGM. CGM refers to glucose measured in subcutaneous tissues every 10 seconds and an average value is stored every five minutes, providing up to 288 measurements per day.
Outcomes
The primary outcome composite outcome, hypertensive disorders of pregnancy was reported by Feig 2017 (including pre‐eclampsia, pregnancy‐induced hypertension and worsening chronic hypertension), and by Voormolen 2018 (pre‐eclampsia and pregnancy‐induced hypertension); caesarean section was reported by Dalfrà 2009; Feig 2017; Hanson 1984; Manderson 2003; Murphy 2008; Petrovski 2011; Secher 2013; Varner 1983; large‐for‐gestational age was reported by Feig 2017; Manderson 2003; Murphy 2008;Secher 2013, (defined as birthweight 90th centile or above); perinatal mortality was reported by Hanson 1984; Manderson 2003; Murphy 2008;Varner 1983); neonatal mortality or morbidity composite was reported by Dalfrà 2009; Feig 2017; Varner 1983; and neurosensory disability was not reported by any trials.
Secondary maternal outcomes reported by the included studies were pre‐eclampsia (Feig 2017; Hanson 1984; Manderson 2003; Murphy 2008;Secher 2013; Voormolen 2018), pregnancy‐induced hypertension (Feig 2017; Hanson 1984; Voormolen 2018), placental abruption (Hanson 1984), weight gain during pregnancy (Feig 2017; Dalfrà 2009; Manderson 2003;Petrovski 2011), behaviour changes associated with the intervention (Feig 2017 (using hypoglycaemia fear survey (HFS II) behaviour subscale which measures two distinct aspects of behavioural avoidance to prevent hypoglycaemia), sense of well‐being and quality of life (Feig 2017 (using three different questionnaires (blood glucose monitoring system rating questionnaire (BGMSRQ), problem areas in diabetes (PAID), short‐form‐12)), use of additional pharmacotherapy (use of additional insulin therapy: Dalfrà 2009; insulin dose: di Biase 1997; Manderson 2003;Petrovski 2011), glycaemic control during/end of treatment (HbA1c) (Dalfrà 2009; di Biase 1997; Feig 2017; Manderson 2003; Murphy 2008; Petrovski 2011; Varner 1983;Wojcicki 2001), maternal hypoglycaemia (Feig 2017; Petrovski 2011) and miscarriage (Feig 2017; Murphy 2008; Secher 2013;Varner 1983).
Secondary perinatal/neonatal outcomes reported by the included studies were stillbirth (reported by Feig 2017; Manderson 2003), neonatal mortality (Murphy 2008; Varner 1983; Voormolen 2018), gestational age at birth (Dalfrà 2009; di Biase 1997; Manderson 2003; Murphy 2008; Varner 1983; Wojcicki 2001), preterm birth less than 37 weeks' gestation (Feig 2017; Hanson 1984; Manderson 2003; Murphy 2008; Petrovski 2011; Secher 2013), preterm birth less than 34 weeks' gestation (Feig 2017;) macrosomia (Feig 2017; Dalfrà 2009; Feig 2017; Manderson 2003; Petrovski 2011; Voormolen 2018: defined as birthweight greater than 4 kg in four studies and birthweight above 90th centile in two studies), small‐for‐gestational age (Feig 2017; Murphy 2008: defined as birthweight 10th centile or below), birthweight (Feig 2017; Dalfrà 2009; Manderson 2003; Murphy 2008; Stubbs 1980; Varner 1983), head circumference (Feig 2017), length (Feig 2017), adiposity (sum of four skin folds (triceps, subscapular, biceps, flank: Feig 2017 ) and (triceps skinfold thickness and subscapular skinfold thickness: Manderson 2003), shoulder dystocia (Feig 2017), respiratory distress syndrome (Feig 2017, Hanson 1984; Manderson 2003; Varner 1983), hypoglycaemia (Feig 2017; Hanson 1984; Manderson 2003; Murphy 2008; Petrovski 2011; Secher 2013; Varner 1983), hyperbilirubinaemia (Feig 2017; Hanson 1984; Manderson 2003; Varner 1983), neonatal hypocalcaemia (Varner 1983), polycythaemia (Varner 1983), relevant biomarker changes associated with the intervention (neonatal cord vein c‐peptide: Feig 2017; Varner 1983, (cord IGF‐1: Manderson 2003), and major anomalies (Feig 2017; Hanson 1984; Murphy 2008).
The only secondary health service use outcomes reported were antenatal hospital admission (Feig 2017; Hanson 1984), neonatal intensive care (NICU) admissions (Manderson 2003; Murphy 2008) and NICU length of admission > 24 hours (Feig 2017).
Outcomes that were not pre‐specified, but are reported in this review are maternal diabetic ketoacidosis (Feig 2017; Petrovski 2011), birth trauma (shoulder dystocia, bone fracture and nerve palsy, pre‐specified as individual outcomes but reported as a composite: Feig 2017; Manderson 2003), neonatal glucose at age one hour (Manderson 2003), transient tachypnoea (Manderson 2003), and feeding difficulties (Hanson 1984). Instrumental vaginal birth was reported in one trial (Voormolen 2018), but the data were not presented separately for women with pre‐existing diabetes and women with GDM. No other trial reported on instrumental vaginal birth.
Secondary maternal outcomes not reported by any of the included studies were: induction of labour, perineal trauma, postpartum haemorrhage, postpartum infection, adherence to the intervention, relevant biomarker changes associated with the intervention (e.g. adiponectin, free fatty acids, triglycerides, high‐density lipoproteins, low‐density lipoproteins, insulin), views of the intervention, maternal mortality.
Secondary perinatal/neonatal outcomes not reported by any of the included studies were: Apgar score (less than seven at five minutes), head circumference and z‐score, length and z‐score, ponderal index, adiposity measured by body mass index (BMI), and minor anomalies.
Health service use outcomes not reported by any of the included studies were: health service use, number of hospital or health professional visits (e.g. midwife, obstetrician, physician, dietician, diabetic nurse), number of antenatal visits, length of antenatal stay, length of postnatal stay (mother), length of postnatal stay (baby), costs to families associated with the management provided, costs associated with the intervention, cost of maternal care, and cost of offspring care.
No studies reported long‐term maternal outcomes (postnatal depression, postnatal weight retention or return to pre‐pregnancy weight, BMI, impaired glucose tolerance, cardiovascular health (as defined by trialists, including blood pressure, hypertension, cardiovascular disease, metabolic syndrome)), later infant or childhood outcomes (weight and z‐scores, height and z‐scores, head circumference and z‐scores, adiposity (e.g. as measured by BMI, skinfold thickness), blood pressure, type 1 diabetes, type 2 diabetes, impaired glucose tolerance, dyslipidaemia or metabolic syndrome, educational achievement), or child in adulthood outcomes (weight, height, adiposity (e.g. as measured by BMI, skinfold thickness), cardiovascular health (as defined by trialists, including blood pressure, hypertension, cardiovascular disease, metabolic syndrome), type 1 diabetes, type 2 diabetes, impaired glucose tolerance, dyslipidaemia or metabolic syndrome, employment, education and social status/achievement).
Some outcomes were reported in a form that could not be used in this review. Hanson 1984 reported the median antenatal hospital stay and neonatal hospital stay, but did not report the standard deviation of blood glucose values, and only reported HbA1c graphically. Manderson 2003 reported the median and interquartile range for cord insulin and length of stay in neonatal unit, and Secher 2013 reported weight gain in pregnancy, HbA1c, plasma glucose, gestational age at birth, and birthweight as median and range. Where results were reported as medians, we felt it was unlikely that the results were normally distributed, and excluded them from meta‐analyses. Percentage of maternal hypoglycaemic episodes was reported by Wojcicki 2001, however the total of all blood glucose data was not available, therefore the frequency was not estimable. Feig 2017 reported the median and interquartile range for the following outcomes, weight gain during pregnancy, postnatal weight retention or return to pre‐pregnancy weight, gestational age at birth and length of antenatal stay. Voormolen 2018 reported on many of the outcomes of this review (see Characteristics of included studies), but did not report these separately for pre‐gestational and gestational diabetes (we have written to authors requesting separate data for the pre‐gestational diabetes group of women).
Sources of trial funding
Sources of trial funding were not reported in two trials (Dalfrà 2009; di Biase 1997).
In Feig 2017, the trial was funded by the Juvenile Diabetes Research Foundation (JDRF) and grants under the JDRF Canadian Clinical Trial Network, a public‐private partnership. Metronic supplied the CGM sensors and CGM systems at reduced cost. In Hanson 1984, the source of funding was reported as being Expressens Perinatal forskningsfond, AIImanna Barnbordshusets Minnesfond, Svenska Diabetesstiftelsen, Nordisk Insulinfond, Swedish Medical Research Council (Project No. 3787), and Tielman's Fund for Pediatric Research. The Department of Health and Social Sevices, Northern lreland, the Northern Ireland Mother and Baby Appeal, the Metabolic Unit Research Fund, Royal Victoria Hospital Belfast, the Royal Maternity Hospital, and the Irish Perinatal Society funded the trial by Manderson 2003. Murphy 2008 was an investigator‐initiated study funded by the Ipswich Diabetes Centre Charity Research Fund. The study equipment (six CGMS Gold monitors and 300 sensors) was donated free of charge by Medtronic UK. The research was sponsored by Ipswich Hospital NHS Trust and was independent of all the study funders (Murphy 2008). The Macedonion Ministry of Health and the Health Care Fund of Macedonia funded Petrovski 2011. In Secher 2013, one of the authors received financial support from the European Foundation of the Study of Diabetes and LifeScan, Rigshopitalet's Research Foundation, the Capital Region of Denmark, the Medical Facuty Foundation of Copenhagen University, Aase and Ejnar Danielsen Foundation, and Master Joiner Sophus Jacobsen and his wife Astrid Jacobsens' Foundation. Stubbs 1980 was funded by the Medical Research Council Project Grant and the British Diabetic Association. Varner 1983 was funded by a Research Fellowship from the Iowa Affiliate of the American Diabetes Association. Voormolen 2018 was funded by ZonMw, The Dutch Organization for Health Research and Development .Continuous glucose monitors were purchased at a discounted price from Medtronic® and were reported as having no role in the study design, data collection, data analysis, data interpretation, or writing of the report. Wojcicki 2001 was supported by grants from the Polish State Committee for Scientific Research, the Bayer Diagnostic Division Warsaw, and the Polish Cellular Telephony Centertel.
Trial authors' declarations of interest
Trial authors' declarations of interest were not reported in Dalfrà 2009; di Biase 1997; Manderson 2003; Stubbs 1980; Varner 1983; Wojcicki 2001.
In Murphy 2008, two trial authors received honorariums for speaking at research symposiums sponsored by Medtronic in 2004 and 2005. In Feig 2017, eight authors report grants from the Juvenile Diabetes Research Foundation during the conduct of the study. Two authors report personal fees from Novo Nordisk, Roche and Medtronic, outside the submitted work. One author reports personal fees from Abbott Diabetes Care and Medtronic (MiniMed Academia), outside the submitted work. One author sits on the Medtronic European Scientific Advisory Board. All remaining authors declare no competing interests. The authors declared that they had no competing financial interests in Petrovski 2011 and in Secher 2013, other than those reported under 'funding' interests. In Voormolen 2018, one of the trial authors received a research grant from ZonMW (the Netherlands Organization for Health Research and Development) and a second author received research grants from Abbott, Dexcom, Medtronic and Sensonics, and also received personal fees from Roche Diabetes Care and Sensonics. A third author is supported by an NHMRC Practitioner Fellowshop (GNT1082548) and reports consultancy for ObsEVa, Merck and Guerbet. All other authors declare no support from any organization or conflict of interest.
See the Characteristics of included studies table for more details.
Excluded studies
No new trials were excluded in this update (2019), but one trial report was identified relating to an already excluded study (Bartholomew 2011).
Bartholomew 2011 was excluded as it is a cross‐over trial. Two trial registrations (NCT01630759; Walker 1999) were excluded; the former was a trial on women with gestational diabetes mellitus (GDM) while the latter was a clinical trial registration containing insufficient evidence to assess. We contacted the author, but there were no available data or published reports. Temple 2006 was excluded as it was an abstract on an observational study of eight pregnant women with type 1 diabetes using continuous glucose monitoring system (CGMS).
See the Characteristics of excluded studies table for more details.
Risk of bias in included studies
Three of the 12 included studies were at low risk of bias (Feig 2017; Murphy 2008; Secher 2013), eight studies were at moderate risk of bias (di Biase 1997; Hanson 1984; Manderson 2003; Petrovski 2011; Stubbs 1980; Varner 1983; Voormolen 2018; Wojcicki 2001), and one study was at high risk of bias (Dalfrà 2009). See Figure 2 and Figure 3.

'Risk of bias' summary: review authors' judgements about each risk of bias item for each included study.
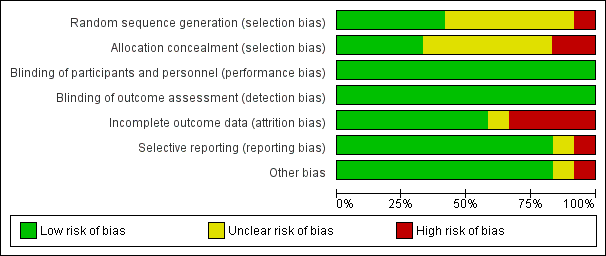
'Risk of bias' graph: review authors' judgements about each risk of bias item presented as percentages across all included studies.
Allocation
Random sequence generation
Five studies (Feig 2017; Murphy 2008; Secher 2013; Varner 1983; Voormolen 2018) described the random sequence generation using computer‐generated random numbers or a random number sequence (low risk of bias). Six trials (di Biase 1997; Hanson 1984; Manderson 2003; Petrovski 2011; Stubbs 1980; Wojcicki 2001) did not report how the sequence was generated (unclear risk of bias). One study was quasi‐randomised, allocating women to alternating groups (Dalfrà 2009) (high risk of bias).
Allocation concealment
Adequate and secure concealment of allocation was described in four trials (low risk of bias) (Feig 2017; Manderson 2003; Murphy 2008; Secher 2013); in one trial the randomisation schedule was created remotely by a programme manager, encrypted, and maintained in a secure database, with no access from the research team (Feig 2017), sealed envelopes were used in two of the trials (Manderson 2003; Murphy 2008), while the fourth (Secher 2013) used an automated telephone allocation service (Paravox) provided by an independent organisation. There was no concealment of allocation in Wojcicki 2001 and Dalfrà 2009 (high risk of bias). The other trials only mentioned the participants were randomly allocated into intervention or control groups without describing if there was any concealment of allocation (unclear risk of bias).
Blinding
Blinding of participants and personnel
As different techniques or timing of glucose monitoring were compared, blinding of neither participants nor assessors was feasible. However, since outcome measures were objective it is unlikely that lack of blinding introduced a risk of bias and so all studies were assessed as being at low risk.
Blinding of outcome assessors
As different techniques or timing of glucose monitoring were compared, blinding of neither participants nor assessors was feasible. However, since outcome measures were objective it is unlikely that lack of blinding introduced a risk of bias so all studies were assessed as being at low risk.
Incomplete outcome data
Four trials had high risk of bias for incomplete outcome data. Reasons given for attrition were women not completing the questionnaire (Dalfrà 2009), severe drug addiction, spontaneous abortions and death of mother (Hanson 1984), no results for analysis participants (Manderson 2003) and spontaneous miscarriage (Varner 1983). In other included studies, all women were accounted for in the analysis, or rates of attrition were described (low risk of bias). di Biase 1997and Wojcicki 2001 reported all outcome data. Four trials reported using intention‐to‐treat analysis (Murphy 2008; Petrovski 2011; Secher 2013; Stubbs 1980). One trial was assessed as being at unclear risk of bias (Voormolen 2018), because there were a high number of women refused to continue using CGM after the first or second time.
Selective reporting
It was unclear if there was any selective reporting in one trial (Dalfrà 2009),10 trials reported all expected outcome data (di Biase 1997; Feig 2017; Hanson 1984; Manderson 2003; Murphy 2008; Petrovski 2011; Secher 2013; Stubbs 1980; Varner 1983; Wojcicki 2001) (low risk of bias). One trial (Voormolen 2018) was assessed as being at high risk of bias because there were a number of maternal outcomes that were described in the methods of the full report and the protocol, but were not reported in the results section.
Other potential sources of bias
There were no other obvious potential sources of bias with the exception of Dalfrà 2009 and Voormolen 2018. Dalfrà 2009 did not use an intention‐to‐treat analysis, and there was no sample size calculation, or information on whether groups were comparable at baseline (high risk of bias). In Voormolen 2018, we had some concerns over missing outcomes and were unsure of the impact of this, (unclear risk of bias).
Effects of interventions
See: Summary of findings for the main comparison Continuous glucose monitoring compared to intermittent glucose monitoring for women with pre‐existing diabetes; Summary of findings 2 Self‐monitoring compared to a different type of self‐monitoring for women with pre‐existing diabetes; Summary of findings 3 Self‐monitoring at home compared to hospitalisation for women with pre‐existing diabetes; Summary of findings 4 Pre‐prandial compared to post‐prandial glucose monitoring for women with pre‐existing diabetes; Summary of findings 5 Automated telemedicine monitoring compared to conventional for women with pre‐existing diabetes; Summary of findings 6 Constant CGM compared to Intermittent CGM for women with pre‐existing diabetes
As there were various methods of glucose monitoring being implemented in the included trials, we structured the review using the following comparisons.
-
Continuous glucose monitoring (CGM) versus intermittent glucose monitoring
-
Self‐monitoring versus different types of self‐monitoring
-
Self‐monitoring at home versus hospitalisation
-
Pre‐prandial versus post‐prandial glucose monitoring
-
Automated telemedicine monitoring versus conventional system
-
Constant CGM versus intermittent CGM
Comparison 1 ‐ Continuous glucose monitoring (CGM) versus intermittent glucose monitoring
See summary of findings Table for the main comparison.
Four studies compared CGM versus intermittent blood glucose monitoring (Feig 2017; Murphy 2008; Secher 2013; Voormolen 2018). The total number of women was 609, 384 type 1 diabetes (T1DM) and 191 with type 2 diabetes (T2DM). Feig 2017 contributed the largest number of women in this comparison (n = 215), all T1DM.
Feig 2017 used a CGM system to measure blood glucose. Women were trained to use the study devices and instructed to use them daily by local diabetes or antenatal clinic teams. CGM users were advised to verify the accuracy of their CGM measurements using their capillary glucose meter before insulin dose adjustment (n = 108). Women in the control group continued their usual method of capillary glucose monitoring (n = 107). Women in both groups were advised to test capillary blood glucose levels at least seven times daily and given written instructions for how to use capillary or CGM measures for insulin dose adjustment. Feig 2017 randomised both pregnant (n = 215) and women planning pregnancy (n = 110), but reported the results separately for the two cohorts. We have only included the data for the pregnant women in this review.
Voormolen 2018 randomised 300 pregnant women with T1DM (n = 109) and T2DM (n = 82), or with gestational diabetes (n = 109). We have only included the data for the women with T1DM and T2DM. However, many of our review outcomes were not reported separately, but mixed with the gestational diabetes cohort and so we have been unable to include all of the data. The CGM group had continuous glucose monitoring in addition to standard care. Women allocated to CGM were instructed to use the device for five to seven days every six weeks and glucose profiles were obtained retrospectively, directly after each use and evaluated by the local endocrinologist. Self‐monitoring of blood glucose (SMBG) was required for calibration of CGM. Readings from the CGM were uploaded to a web‐based program (n = 147 all women, 90 with T1DM and T2DM). Standard treatment consisted of self‐monitoring of blood glucose only (n = 153 all women, 97 with T1DM and T2DM). Women in both intervention and control groups performed SMBG (four to eight times/day: at least fasting, after every meal, at bedtime and, preferably before every meal).
Murphy 2008 used the CGM, which measured glucose in subcutaneous tissues every 10 seconds and an average value is stored every five minutes, providing up to 288 measurements per day (n = 38). The women were required to wear the CGM for seven days at intervals of four to six weeks. They were also advised to measure blood glucose at least seven times a day. The intermittent monitoring of glucose levels was the standard care in which women were advised to monitor glucose at least seven times a day (n = 33).
In Secher 2013, real time CGM for six days at pregnancy visits during eight, 12, 21, 27 and 33 weeks, in addition to routine pregnancy care was implemented on 79 women and intermittent monitoring with self‐monitored plasma glucose measurements of seven times daily was implemented on 75 women.
Primary outcomes
Continuous glucose monitoring may reduce the composite outcome of hypertensive disorders of pregnancy (risk ratio (RR) 0.58, 95% confidence interval (CI) 0.39 to 0.84; 2 studies, 384 women; low‐quality evidence,Analysis 1.1), although this did not translate into a clear reduction for pre‐eclampsia, see secondary outcomes below.
Due to moderate heterogeneity, we used random‐effects analysis for caesarean section and there was no clear reduction in rate of caesarean section (average RR 0.94, 95% CI 0.75 to 1.18; 3 studies, 427 women; I2 = 41%; moderate‐quality evidence, Analysis 1.2), or large‐for‐gestational age (average RR 0.84, 95% CI 0.57 to 1.26; 3 studies, 421 women; I2 = 70%; low‐quality evidence, Analysis 1.3). There was not enough evidence to assess perinatal mortality (RR 0.82, 95% CI 0.05 to 12.61, 71 infants, 1 study, Analysis 1.4, low‐quality evidence) or the composite of neonatal mortality or morbidity (RR 0.80, 95% CI 0.61 to 1.06; 1 study, 200 women) as the evidence was based on single studies of low‐quality.
Neurosensory disability
This outcome was not reported.
Secondary outcomes
There was no clear reduction in pre‐eclampsia (RR 0.65, 95% CI 0.39 to 1.08; 4 studies, 609 women; moderate‐quality evidence,Analysis 1.6) or to pregnancy‐induced hypertension (RR 0.67, 95% CI 0.38 to 1.16; 2 studies, 384 women; low‐quality evidence,Analysis 1.7) with CGM. There was little difference between groups in behaviour changes associated with the intervention as measured using the Hypoglycaemia Fear Survey (HFS II) (Lamb 2017) behaviour subscale at 34 weeks' gestation (mean difference (MD) 1.00, 95% CI ‐1.06 to 3.06; 1 study, 214 women, Analysis 1.8). The 15 items in HFS behaviour subscale measures behaviours aimed at avoiding hypoglycaemia and its possible negative consequences, with higher scores indicating higher fear of hypoglycaemia, with scores ranging from zero to 60.
There was also little difference in sense of well‐being and quality of life as measured using the Short‐Form‐12 (SF‐12) and Problem Areas in Diabetes (PAID) (Venkataraman 2015) which were measured at 34 weeks' gestation (total score) (MD ‐0.70, 95% CI ‐2.50 to 1.10; 1 study, 214 women, Analysis 1.9) (MD 0.80, 95% CI ‐3.06 to 4.66; 1 study, 214 women, Analysis 1.10). The Short‐Form‐12 (SF‐12) is a health‐related quality‐of‐life questionnaire. It consists of 12 questions that measure eight domains assessing physical and mental health. Physical health domains include General Health (GH), Physical Functioning (PF), Role Physical (RP), and Body Pain (BP). Mental health domains include Vitality (VT), Social Functioning (SF), Role Emotional (RE), and Mental Health (MH). The instrument has been validated across a number of chronic diseases and conditions. Physical and Mental Health Composite Scales combine the 12 items, with a high score of 50 equating to good mental and physical health (Huo 2018). The Problem Areas in Diabetes (PAID) instrument was developed to measure emotional distress in people with diabetes. It is a 20‐item scale consisting of emotional problems commonly reported in type 1 and type 2 diabetes mellitus, and has been found to be a valid and reliable scale in Western populations (Venkataraman 2015), with scores ranging from zero to 100, with higher scores reflecting greater emotional distress. The CGM group scored slightly higher in their Blood Glucose Monitoring System Rating Questionnaire (BGMSRQ) (Peyrot 2009) total score at 34 weeks' gestation (MD 4.30, 95% CI 0.73 to 7.87; 1 study, 214 women, Analysis 1.11). This questionnaire aims to measure different aspects about the method of blood glucose monitoring: measures relate to convenience, interference, burden, control, overall satisfaction, desire to switch monitoring system, willingness to recommend current monitoring system, and comparison of current and prior blood glucose monitoring system.
CGM may make little or no difference to maternal glycaemic control as indicated by HbA1c levels (glycated haemoglobin): the mean HbA1c level in the continuous monitoring group was 0.37% lower, 0.78% lower to 0.04% higher (MD ‐0.37 %, 95% CI ‐0.78 to 0.04; 2 studies, 258 women; I2 = 81%, Analysis 1.12) and although more women in the continuous monitoring group achieved HbA1c levels less than or equal to 6.5% (48 mmol/mol) at 34 weeks (RR 1.27, 95% CI 1.00 to 1.62; 1 study, 187 women, Analysis 1.13), the results are based on a single study.
There was no clear difference between groups for the following outcomes.
-
Maternal hypoglycaemia (severe) (RR 0.92, 95% CI 0.43 to 1.95; 1 study,154 women, Analysis 1.14)
-
Miscarriage (RR 1.24, 95% CI 0.47 to 3.26; 3 studies, 439 women, Analysis 1.15)
-
Stillbirth (RR 0.34, 95% CI 0.01 to 8.17; 1 study, 211 infants, Analysis 1.16)
-
Neonatal mortality (RR 0.92, 95% CI 0.13 to 6.37; 2 studies, 256 infants, Analysis 1.17)
-
Gestational age at birth (weeks) (MD 0.10 weeks, 95% CI ‐0.57 to 0.77; 1 study, 68 women, Analysis 1.18)
-
Preterm birth < 37 weeks (RR 0.96, 95% CI 0.72 to 1.29; 3 studies, 430 women, Analysis 1.19)
-
Preterm birth < 34 weeks (RR 0.46, 95% CI 0.17 to 1.28; 1 study, 211 women, Analysis 1.20)
-
Macrosomia (average RR 0.84, 95% CI 0.61 to 1.17; 3 studies, 451 women, I2 = 34%, Analysis 1.21)
-
Birthweight (kg) (MD ‐0.13 kg, 95% CI ‐0.38 to 0.12; 2 studies, 267 infants, I2 = 49%, Analysis 1.22)
-
Small‐for‐gestational age (RR 2.40, 95% CI 0.55 to 10.51; 2 studies, 269 infants, Analysis 1.23)
-
Head circumference (cm) (MD ‐0.20, 95% CI ‐0.79 to 0.39; 1 study, 160 infants, Analysis 1.24)
-
Length (crown‐heel length cm) (MD ‐0.20, 95% CI ‐0.79 to 0.39; 1 study, 160 infants, Analysis 1.25)
-
Adipositiy (sum of four skin folds mm) (MD ‐0.20, 95% CI ‐1.98 to 1.58; 1 study, 160 infants, Analysis 1.26)
-
Shoulder dystocia (RR 3.00, 95% CI 0.12 to 72.77; 1 study, 200 infants, Analysis 1.27)
-
Respiratory distress syndrome (RR 1.00, 95% CI 0.41 to 2.41; 1 study, 200 infants, Analysis 1.28)
-
Neonatal hypoglycaemia (RR 0.66, 95% CI 0.48 to 0.93; 3 studies, 428 infants, Analysis 1.29)
-
Neonatal hyperbilirubinaemia (RR 0.81, 95% CI 0.52 to 1.26; 1 study, 200 infants, Analysis 1.30)
-
Relevant biomarkers associated with the intervention (cord blood c‐peptide levels > 566 pmol/L) (RR 0.95, 95% CI 0.68 to 1.33; 1 study, 200 infants, Analysis 1.31)
-
Relevant biomarkers associated with the intervention (cord blood c‐peptide levels > 2725 pmol/L) (RR 1.00, 95% CI 0.33 to 3.00; 1 study, 200 infants, Analysis 1.32)
-
Major and minor anomalies (RR 0.71, 95% CI 0.16 to 3.13; 2 studies, 285 infants, Analysis 1.33)
-
Number of hospital admissions (mother) (RR 1.25, 95% CI 0.84 to 1.85; 1 study, 207 women, Analysis 1.34)
-
Neonatal intensive care unit admissions (average RR 0.76, 95% CI 0.42 to 1.35; 2 studies, 274 infants, Analysis 1.35)
-
Birth trauma (shoulder dystocia, bone fracture, nerve palsy) (RR 5.00, 95% CI 0.24 to 102.85; 1 study, 200 infants, Analysis 1.37)
-
Diabetic ketoacidosis (RR 1.01, 95% CI 0.14 to 7.03; 1 study, 207 women, Analysis 1.38)
It may reduce neonatal hypoglycaemia (RR 0.66, 95% CI 0.48 to 0.93; 3 studies, 428 infants, Analysis 1.29) and NICU admission of more than 24 hours (RR 0.63, 95% CI 0.42 to 0.93; 1 study, 200 infants, Analysis 1.36).
None of the studies reported on our remaining secondary outcomes.
Comparison 2 ‐ Self‐monitoring versus a different type of self‐monitoring
See summary of findings Table 2.
Two trials (Stubbs 1980; Varner 1983) compared self‐monitoring with a different type of self‐monitoring (standard care). In one trial (Stubbs 1980), a total of 13 pregnant women with T1DM were randomly allocated into self‐monitoring of blood glucose (SMBG) at home, seven times a day, twice per week. Another six women were allocated to standard care (urine check four times daily) and random blood glucose testing measured fortnightly during clinic visits.
In the other trial (Varner 1983), 30 T1DM women were assigned to self‐monitoring (n = 15) and standard care (n = 15). The self‐monitoring group carried out daily home glucose monitoring four times daily and the standard care group carried out weekly venipuncture three times daily, measured on one day weekly. One woman in each group had a first trimester spontaneous miscarriage, so results are presented for the remaining 28 women and infants. The self‐monitoring group was required to monitor fasting plus two‐hour post‐prandial morning, afternoon and evening glucose daily, while the standard care group were measured one day per week.
Primary outcomes
It is uncertain whether self‐monitoring reduces the risk of caesarean section (risk ratio (RR) 0.78, 95% confidence interval (CI) 0.40 to 1.49, 1 study, 28 women, Analysis 2.1, very low‐quality evidence) (Varner 1983). Varner 1983 also reported perinatal mortality and it was too small to show any differences between groups (perinatal mortality: RR 3.00, 95% CI 0.13 to 67.91, 1 study, 28 infants, very low‐quality evidence, Analysis 2.2).
Hypertensive disorders of pregnancy, large‐for‐gestational age, neonatal mortality and morbidity composite and neurosensory disability were not reported in either study.
Secondary outcomes
It is uncertain whether self‐monitoring makes any difference in maternal glycaemic control for post‐prandial blood glucose (MD ‐0.70 mmol/L, 95% CI ‐2.15 to 0.75; 1 study, 13 women, Analysis 2.3), or HbA1c (MD ‐0.10 %, 95% CI ‐1.93 to 1.73, 1 study, 28 women, Analysis 2.4). There were too few women to show any differences in miscarriage (RR 1.00, 95% CI 0.07 to 14.55, 1 study, 30 women, Analysis 2.5), neonatal mortality (RR 3.00, 95% CI 0.13 to 67.91, 1 study, 28 women, Analysis 2.6), or respiratory distress syndrome (RR 3.00, 95% CI 0.13 to 67.91, 1 study, 28 infants, Analysis 2.9). It is uncertain whether there are any differences in gestational age between self‐monitoring groups (MD 0.40 weeks, 95% CI ‐1.65 to 2.45, 1 study, 28 infants, Analysis 2.7), and or in infant birthweight (MD ‐0.18 kg, 95% CI ‐0.49 to 0.13, 2 studies, 41 infants, Analysis 2.8) due to limitations in small sample sizes.
Again it is uncertain whether there are any differences for neonatal hypoglycaemia (RR 0.57, 95% CI 0.21 to 1.52, 1 study, 28 infants, Analysis 2.10), neonatal jaundice (hyperbilirubinaemia) (RR 0.56, 95% CI 0.25 to 1.24, 1 study, 28 infants, Analysis 2.11), hypocalcaemia (RR 1.00, 95% CI 0.07 to 14.45, 1 study, 28 infants, Analysis 2.12), polycythaemia (RR 0.33, 95% CI 0.01 to 7.55, 1 study, 28 infants, Analysis 2.13) and neonatal cord vein C‐peptide (MD 0.13 ng/nl, 95% CI ‐0.50 to 0.76, 1 study, 28 infants, Analysis 2.14).
None of the studies reported on our remaining secondary outcomes.
Comparison 3 ‐ Self‐monitoring at home versus hospitalisation
See summary of findings Table 3.
Only one study compared home self‐monitoring with hospitalisation (Hanson 1984). In this study, a total of 100 pregnant women with T1DM and T2DM were randomised. The home self‐monitoring group had 54 women while the hospital group had 46 women. The women from the home group self‐monitored their blood glucose from the 32nd until 36th week of gestation and then were hospitalised during the 37th week until delivery; the hospital group women were hospitalised from 32nd week until delivery. Blood glucose was monitored four times daily (7 AM, 9.30 AM, 3 PM and 7 PM) in both groups.
Primary outcomes
This study of 100 women did not report on the composite outcome, hypertensive disorders of pregnancy. It reported pre‐eclampsia and hypertension in pregnancy, but as separate outcomes.
The results were uncertain for caesarean section (RR 0.96, 95% CI 0.65 to 1.44, Analysis 3.2, very low‐quality evidence), and the sample size was too small to assess perinatal mortality (RR 0.85, 95% CI 0.05 to 13.24, Analysis 3.3, very low‐quality evidence).
Large‐for‐gestational age, mortality or morbidity composite, and neurosensory disability were not reported.
Secondary outcomes
It is uncertain whether there is any difference between self‐monitoring and hospitalisation were shown in the reported secondary outcomes: placental abruption (RR 1.70, 95% CI 0.16 to 18.19, Analysis 3.6); preterm birth < 37 weeks (RR 0.85, 95% CI 0.45 to 1.60, Analysis 3.7); respiratory distress syndrome (RR 2.56, 95% CI 0.28 to 23.74, Analysis 3.8); neonatal hypoglycaemia (RR 1.01, 95% CI 0.50 to 2.03, Analysis 3.9); neonatal jaundice (hyperbilirubinaemia) (RR 2.27, 95% CI 0.64 to 8.07, Analysis 3.10); major anomalies (RR 0.27, 95% CI 0.03 to 2.54, Analysis 3.11).
As would be expected from the nature of the intervention, a lower proportion of women in the self‐monitoring group had antenatal hospital admission (RR 0.19, 95% CI 0.11 to 0.33, Analysis 3.12).
Maternal glycaemic control was reported, however only mean blood glucose was given without standard deviations, and HbA1c was only presented graphically, so we were not able to include these data in the analyses. The mean blood glucose values during the study period were 6.0 mmol/L for the hospital group and 5.9 mmol/L for the home group.
Outcomes that were not pre‐specified
There were no differences between self‐monitoring and hospitalisation in terms of feeding difficulties (RR 0.85, 95% CI 0.41 to 1.78, Analysis 3.13).
None of the studies reported on our remaining secondary outcomes.
Comparison 4 ‐ Pre‐prandial versus post‐prandial glucose monitoring
See summary of findings Table 4.
Only one trial compared pre‐prandial and post‐prandial glucose monitoring (Manderson 2003). Sixty‐one T1DM women were randomly assigned to pre‐prandial (n = 31) or post‐prandial (n = 30) blood glucose monitoring. The pre‐prandial group monitored their blood glucose before breakfast and pre‐prandially for each meal. The post‐prandial group monitored blood glucose after breakfast and one hour after the commencement of each meal.
Primary outcomes
In one study of 61 women (61 infants), it is uncertain whether there is any difference between pre‐prandial and post‐prandial glucose monitoring for caesarean section (RR 1.45, 95% CI 0.92 to 2.28, Analysis 4.1, very low‐quality evidence), large‐for‐gestational age (RR 1.16, 95% CI 0.73 to 1.85; Analysis 4.2, very low‐quality evidence) and perinatal mortality (RR 2.91, 95% CI 0.12 to 68.66, Analysis 4.3, very low‐quality evidence).
The study did not report the composite outcomes, hypertensive disorders of pregnancy (including pre‐eclampsia, pregnancy‐induced hypertension, eclampsia), mortality or morbidity composite, or neurosensory disability.
Secondary outcomes
It is uncertain whether there are any differences between pre‐prandial and post‐prandial glucose monitoring for the following outcomes: pre‐eclampsia (RR 6.43, 95% CI 0.82 to 50.11, Analysis 4.4); weight gain in pregnancy (MD ‐0.90 kg, 95% CI ‐3.86 to 2.06, Analysis 4.5); use of additional pharmacotherapy shown by insulin dose in units/day and units/kg (MD ‐17.40 units/day, 95% CI ‐43.41 to 8.61, Analysis 4.6; MD ‐0.20 units/kg, 95% CI ‐0.45 to 0.05, Analysis 4.7); glycaemic control shown by mean HbA1c (MD 0.30 %, 95% CI ‐0.08 to 0.68, Analysis 4.8); stillbirth (RR 2.91, 95% CI 0.12 to 68.66, Analysis 4.9); gestational age at birth (MD 0.20 weeks, 95% CI ‐0.84 to 1.24, Analysis 4.10); preterm birth < 37 weeks (RR 1.33, 95% CI 0.62 to 2.84, Analysis 4.11); macrosomia (RR 2.18, 95% CI 0.75 to 6.32, Analysis 4.12), birthweight (MD 0.24 kg, 95% CI ‐0.10 to 0.58, Analysis 4.13); subscapular skinfold thickness (adiposity) (MD 0.60 mm, 95% CI ‐0.18 to 1.38, Analysis 4.14); birth trauma (shoulder dystocia, bone fracture, nerve palsy) (RR 0.48, 95% CI 0.05 to 5.06, Analysis 4.16); respiratory distress syndrome (RR 0.97, 95% CI 0.06 to 14.78, Analysis 4.17); neonatal hypoglycaemia (RR 1.09, 95% CI 0.48 to 2.45, Analysis 4.18); neonatal jaundice (hyperbilirubinaemia) (RR 1.16, 95% CI 0.40 to 3.40, Analysis 4.19); cord IGF‐1 (MD 1.30 μg/L, 95% CI ‐0.70 to 3.30, Analysis 4.20); neonatal glucose at age one hour (not pre‐specified) (MD ‐0.20, 95% CI ‐0.88 to 0.48, Analysis 4.21); transient tachypnoea (not pre‐specified) (RR 2.58, 95% CI 0.76 to 8.81, Analysis 4.22); and neonatal intensive care admissions (RR 1.04, 95% CI 0.62 to 1.74, Analysis 4.23).
Infants in the pre‐prandial monitoring group had higher triceps skinfold thickness (adiposity) (MD 0.60 mm, 95% CI 0.04 to 1.16, Analysis 4.15), although the difference is small and should be considered in the context of no clear difference in large‐for‐gestational age, birthweight, macrosomia, and subscapular skinfold thickness.
None of the studies reported on our remaining secondary outcomes.
Comparison 5 ‐ Automated telemedicine monitoring versus conventional system
See summary of findings Table 5.
Three studies (Dalfrà 2009; di Biase 1997; Wojcicki 2001) compared automated telemedicine monitoring versus conventional system. Dalfrà 2009 included both pregnant women with T1DM (n = 32, data included in this review) and women with gestational diabetes (n = 203, data excluded from this review). Women in the telemedicine group were asked to submit their blood glucose data every week, and had a medical examination at the diabetes clinic once a month, while women in the control group had a medical examination every two weeks. di Biase 1997 (n = 20) and Wojcicki 2001 (n = 32) recruited T1DM women. di Biase 1997 used a DIANET system, which was an automated monitoring system using a telemedicine system with patient unit, diabetes workstation and the communication link to send all data to the diabetologist. The intermittent monitoring was conventional monitoring where the women were instructed to perform three or more tests of blood glucose per day using BM20‐800 strips with the results checked during routine clinic visits. Wojcicki 2001 used a telematic management system with the a glucometer connected to a modem interface where the blood glucose measurements could be transmitted to the central clinical control unit. The conventional group would only have their measurements examined during the routine clinical examinations every three weeks. All women (in both groups) were encouraged to measure their blood glucose at least six times per day.
Primary outcomes
Again, it is uncertain from one study (Dalfrà 2009) whether there is any difference between automated telemedicine monitoring and conventional monitoring for caesarean section (RR 0.96, 95% CI 0.62 to 1.48, 1 study, 32 women, Analysis 5.1, very low‐quality evidence) and the composite of neonatal mortality or morbidity (RR 1.18, 95% CI 0.53 to 2.62, 1 study, 32 infants, Analysis 5.2).
di Biase 1997 and Wojcicki 2001 did not report these primary outcomes, and none of the studies contributing data to this comparison reported hypertensive disorders of pregnancy, large‐for‐gestational age, perinatal mortality (stillbirth and neonatal mortality), and neurosensory disability.
Secondary outcomes
In one study of 20 women (di Biase 1997), women in the automated telemedicine group had a higher mean insulin requirement at the end of the study (MD 18.40 units/day, 95% CI 12.88 to 23.92, Analysis 5.5). The women in the automated telemedicine group also had lower mean maternal fasting blood glucose before breakfast and before lunch at the end of the study (before breakfast: MD ‐1.00 mmol/L, 95% CI ‐1.22 to ‐0.78, Analysis 5.6; before lunch: MD ‐1.10 mmol/L, 95% CI ‐1.32 to ‐0.88, Analysis 5.7). There was high heterogeneity between studies for maternal HbA1c (random‐effects MD ‐0.17 %, 95% CI ‐0.82 to 0.48, 3 studies, 82 women, Tau² = 0.27, I² = 82%, Analysis 5.8) and maternal post‐prandial blood glucose (random‐effects MD ‐0.80 mmol/L, 95% CI ‐1.67 to 0.08, 3 studies, 50 women,Tau² = 0.35, I² = 86%, Analysis 5.9). Post hoc sensitivity analyses show that this was due to measurements from di Biase 1997. This study showed differences between groups in HbA1c and post‐prandial blood glucose, however the other two studies did not. It seems likely that the higher insulin doses given to women in the automated telemedicine group resulted in lower blood glucose measures.
It was uncertain whether there was any difference between groups for: weight gain in pregnancy (MD ‐0.70, 95% CI ‐4.95 to 3.55, 1 study, 32 women, Analysis 5.10); use of additional insulin therapy (RR 1.00, 95% CI 0.89 to 1.12, 1 study, 32 women, Analysis 5.4); gestational age (MD 0.24 weeks, 95% CI ‐0.39 to 0.88, 3 studies, 84 women,Analysis 5.3); macrosomia (RR 1.18, 95% CI 0.31 to 4.43, 1 study, 32 infants, Analysis 5.11); or birthweight (MD ‐0.16 kg, 95% CI ‐0.64 to 0.32, 1 study, 32 infants, Analysis 5.12).
The percentage of maternal hypoglycaemic episodes was reported by Wojcicki 2001, however, the total of all blood glucose data were not available, therefore the frequency was not estimable.
None of the studies reported on our remaining secondary outcomes.
Comparison 6 ‐ Constant CGM versus intermittent CGM
See summary of findings Table 6.
Only one study compared constant CGM and intermittent CGM (Petrovski 2011). Twenty‐five T1DM women were randomised into constant CGM (n = 12) and intermittent CGM (n = 13) groups. The women in the constant CGM group wore the glucose sensor 24 hours per day while the intermittent CGM group wore the glucose sensor 14 days per month. The women in the intermittent CGM group measured blood glucose at least six times daily when not using the glucose sensor.
Primary outcomes
It is uncertain whether constant CGM makes any difference to rates of caesarean section (RR 0.77, 95% CI 0.33 to 1.79, 1 study, 25 women, very low‐quality evidence, Analysis 6.1). Other primary outcomes were not reported (hypertensive disorders of pregnancy, large‐for‐gestational age, perinatal mortality (stillbirth and neonatal mortality), mortality or morbidity composite, and neurosensory disability).
Secondary outcomes
Constant CGM makes little or no difference to weight gain in pregnancy (MD 0.50 kg, 95% CI ‐1.82 to 2.82, 1 study, 25 women, Analysis 6.2), insulin dosage (third trimester: MD ‐0.03, 95% CI ‐1.30 to 1.24, 1 study, 25 women, Analysis 6.3); maternal blood glucose (first trimester: MD ‐0.50 mmol/L, 95% CI ‐2.70 to 1.70, 1 study, 25 women, Analysis 6.4; third trimester: MD ‐0.14 mmol/L, 95% CI ‐2.00 to 1.72, 1 study, 25 women, Analysis 6.5); maternal HbA1c (first trimester: MD ‐0.30 %, 95% CI ‐1.13 to 0.53, 1 study, 25 women, Analysis 6.6; third trimester: MD ‐0.09 %, 95% CI ‐0.69 to 0.51, 1 study, 25 women, Analysis 6.7), maternal hypoglycaemia (RR 0.54, 95% CI 0.06 to 5.24, 1 study, 25 women, Analysis 6.8), diabetic ketoacidosis (not pre‐specified) (RR 0.36, 95% CI 0.02 to 8.05, 1 study, 25 women, Analysis 6.9), preterm birth < 37 weeks (RR 1.08, 95% CI 0.08 to 15.46, 1 study, 25 infants, Analysis 6.10), and macrosomia (RR 1.08, 95% CI 0.08 to 15.46, 1 study, 25 infants, Analysis 6.11). There were no events for neonatal hypoglycaemia (1 study, 25 infants Analysis 6.12).
None of the studies reported on our remaining secondary outcomes.
Discussion
Summary of main results
The objective of this review was to assess the various techniques of glucose monitoring among pregnant women with pre‐existing type 1 and type 2 diabetes and their impact on maternal and infant outcomes. We included 12 trials comparing six different pairs of glucose monitoring techniques: continuous glucose monitoring (CGM) versus intermittent glucose monitoring (Feig 2017; Murphy 2008; Secher 2013; Voormolen 2018), self‐monitoring versus a different type of self‐monitoring (Stubbs 1980; Varner 1983), self‐monitoring versus hospitalisation (Hanson 1984), pre‐prandial versus post‐prandial glucose monitoring (Manderson 2003), automated telemedicine monitoring versus conventional (Dalfrà 2009; di Biase 1997; Wojcicki 2001), and constant CGM versus intermittent CGM (Petrovski 2011). This review update includes a total of 12 trials (944) women (type 1 diabetes: 660 women; type 2 diabetes: 113 women; type 1 or type 2 (unspecified): 171 women. All trials originated from European countries, the USA and Canada.
With the addition of two new studies (406 women) to one of the comparisons (comparison 1 ‐ continuous glucose monitoring (CGM) versus intermittent glucose monitoring), the evidence suggests that CGM may reduce hypertensive disorders of pregnancy, though it should be noted that only two of the four relevant studies reported data for this composite outcome. Conversely, this did not translate into a clear reduction for pre‐eclampsia. There was no clear reduction in caesarean section or large‐for‐gestational age with CGM. There was not enough evidence to assess perinatal mortality or mortality or morbidity composite as the evidence was based on single studies of low quality. CGM appears to reduce neonatal hypoglycaemia. Neurosensory disability was not reported.
For the remaining five comparisons: self‐monitoring versus a different type of self‐monitoring (two studies, 43 women); self‐monitoring at home versus hospitalisation (one study, 100 women); pre‐prandial versus post‐prandial glucose monitoring (one study, 61 women); automated telemedicine monitoring versus conventional system (three studies, 84 women); and constant CGM versus intermittent CGM (one study, 25 women), it is uncertain whether any of the interventions has any impact on any of our GRADE outcomes (hypertensive disorders of pregnancy, caesarean section, large‐for‐gestational age) because the quality of the evidence was found to be very low. There was not enough evidence to assess perinatal mortality and neonatal mortality and morbidity composite. Other important outcomes, such as neurosensory disability, were not reported in any of these comparisons.
Outcomes relating to cost were not reported by any of the studies. Resource use (antenatal hospital admissions, neonatal intensive care admissions and neonatal intensive care unit length of admission > 24 hours) was reported only by single trials in three out of the six comparisons and so pooling of data was not possible.
Overall completeness and applicability of evidence
With the addition of two new studies (406 women) to one of the comparisons examining CGM versus intermittent monitoring, there was evidence to suggest that CGM may have an impact on hypertensive disorders of pregnancy, although there was no clear reduction for other outcomes associated with hypertension, such as pre‐eclampsia. The pooling of the data for hypertension disorders needs to be viewed with caution. Only two of the four relevant studies reported on this composite outcome of 'hypertensive disorders of pregnancy' including pre‐eclampsia, pregnancy‐induced hypertension, eclampsia, and they report it slightly differently (Feig 2017; Voormolen 2018). Voormolen 2018 reports a composite of pre‐eclampsia and pregnancy‐induced hypertension for women with both type 1 and type 2 diabetes and Feig 2017 reports a composite of worsening chronic, gestational hypertension and pre‐eclampsia for women with only type 1 diabetes. The ‘worsening chronic’ could be omitted from the analysis to make the two randomised controlled trials (RCTs) more comparable for pooling, although this makes only a small difference to the overall results (17/100 CGM and 27/102 versus 18/100 and 28/102). The real issue is that Murphy 2008 and Secher 2013 cannot be included in the analysis for this composite outcome because they both only report on pre‐eclampsia and not on pregnancy‐induced hypertension. The results for pre‐eclampsia therefore must be considered the most robust result in terms of complete reporting as all four RCTs report on it. The evidence base for the effectiveness of other monitoring techniques analysed in the other five comparisons is weak and based on mainly single studies with very low‐quality evidence and cannot be said to justify overall completeness of evidence.
All the included trials were conducted in Western countries ‐ Europe, the USA and Canada ‐ and it can be assumed that a majority of the women were Caucasian. Most of the pregnant women in the included studies had type 1 diabetes (n = 792) with much fewer having type 2 diabetes (n = 152). There were six pairs of intervention techniques in the included trials. There was difficulty in pooling the results due to this variation. The review's primary outcome, neurosensory disability, was not reported in any of the trials. The only secondary health service use outcomes reported were antenatal hospital admission, neonatal intensive care admissions and neonatal intensive care unit length of admission > 24 hours. Many of the reviews secondary maternal and perinatal/neonatal outcomes were not reported: induction of labour, perineal trauma, postpartum haemorrhage, postpartum infection, adherence to the intervention, maternal mortality, Apgar score (less than seven at five minutes). No studies reported long‐term maternal or infant outcomes and patient‐reported outcomes such as behaviour changes associated with the intervention and sense of well‐being and quality of life.
Quality of the evidence
Three of the 12 included studies were at low risk of bias (Feig 2017; Murphy 2008; Secher 2013), eight studies were at moderate risk of bias (di Biase 1997; Hanson 1984; Manderson 2003; Petrovski 2011; Stubbs 1980; Varner 1983; Voormolen 2018; Wojcicki 2001), and one study was at high risk of bias (Dalfrà 2009). Five trials (Feig 2017; Murphy 2008; Secher 2013; Varner 1983; Voormolen 2018) described the random sequence generation while adequate and secure concealment of allocation was described in four trials (Feig 2017; Manderson 2003; Murphy 2008; Secher 2013). It was unclear if there was any selective reporting in one trial (Dalfrà 2009), while 10 studies reported all expected outcome data (di Biase 1997; Feig 2017; Hanson 1984; Manderson 2003; Murphy 2008; Petrovski 2011; Secher 2013; Stubbs 1980; Varner 1983; Wojcicki 2001. In one trial, some outcomes reported in the protocol and methods of the trial report did not appear to have been adequately reported in the full trial report (Voormolen 2018) and was considered to be at high risk for this domain. Most of the trials had small numbers of women; six trials (Dalfrà 2009; Di Biase 1997; Petrovski 2011; Stubbs 1980; Varner 1983; Wojcicki 2001) only had a range of 13 to 32 participants. Any potential bias is likely to have been overshadowed by the small number and size of trials with their different intervention techniques of monitoring and reported outcomes. The trials are too small to show differences in important outcomes such as macrosomia, preterm birth, miscarriage or death of baby.
All the reported GRADE outcomes for comparisons 2, 3, 4, 5 and 6 were assessed as being very low‐quality evidence (summary of findings Table 2; summary of findings Table 3; summary of findings Table 4; summary of findings Table 5; summary of findings Table 6). We downgraded most outcomes in these tables once for serious concerns due to limitations in design and twice for very serious imprecision (wide confidence intervals (CIs) crossing the line of no effect, small sample sizes, and few events).
Comparison 1 included more data than the other comparisons (four studies, 609 women), from studies assessed as being at lower risk of bias (summary of findings Table for the main comparison). Consequently, we graded caesarean section as moderate‐quality evidence with downgrading one level for serious inconsistency due to evidence of statistical heterogeneity. We graded hypertensive disorders of pregnancy as low‐quality evidence with downgrading two levels for serious limitations in study design and serious indirectness due to two studies reporting the composite outcome in different ways. We graded large‐for‐gestational as low quality with downgrading two levels due to serious imprecision (wide CI crossing line of no effect) and serious inconsistency (statistical heterogeneity). We graded perinatal mortality (stillbirth and neonatal mortality) as low quality with downgrading two levels for very serious imprecision due to evidence derived from a single study, with a small number of events and wide CI crossing the line of no effect.
GRADE outcomes were often not reported. Caesarean section was the only GRADE outcome reported by studies in every comparison. The composite outcome of hypertensive disorders of pregnancy was only reported by studies in comparison 1. Large‐for‐gestational age was only reported by studies in comparisons 1 and 4. Perinatal mortality (stillbirth and neonatal mortality) was reported by studies in comparisons 1, 2, 3 and 4.
Potential biases in the review process
We attempted to minimise bias during the review process by having two people assess the eligibility of studies, assess risk of bias and extract data. GRADE quality assessments were also checked by a second person. We attempted to be as inclusive as possible in our search. However, we cannot rule out the possibility that we have missed relevant studies that were not published or are still ongoing. In addition, the proposed subgroup and sensitivity analyses could not be performed.
Agreements and disagreements with other studies or reviews
With the addition of two new studies (406 women) to one of the comparisons (comparison 1 ‐ continuous glucose monitoring (CGM) versus intermittent glucose monitoring), the evidence suggests that CGM may reduce hypertensive disorders of pregnancy, though as already stated, only two of the four relevant studies reported data for this composite outcome. Conversely, this did not translate into a clear reduction for pre‐eclampsia. CGM probably makes little or no difference to caesarean section, but may reduce neonatal hypoglycaemia. The findings from our review are on the whole very similar to another Cochrane Review (Raman 2017), which examined different methods and settings for glucose monitoring in gestational diabetes, and observed no clear differences between the CGM and self‐monitoring groups for any of their maternal or infant outcomes (caesarean section, large‐for‐gestational age, perinatal deaths). Hypertensive disorders of pregnancy were not reported by either study for their CGM comparison. The results for other comparisons were similar to findings from our review for telemedicine and self‐monitoring, in that there was insufficient evidence to show any clear effect for any of the outcomes examined (Raman 2017). Other reviews also found limited evidence for the effectiveness of real‐time CGM use in children, adults and patients with poorly controlled diabetes (Ghandi 2011; Langendam 2012; Pickup 2011). However, these reviews indicated that higher compliance of wearing the CGM device improves glycosylated haemoglobin A1c level (HbA1c) to a larger extent, and this is in line with our finding of a possible improvement in glycaemic control for women using CGM.
There were no available reviews on self‐monitoring of blood glucose (SMBG) among pregnant women with pre‐existing diabetes and so the findings of this review cannot be compared with any other. This review's findings are not altogether consistent with the findings of others that considered methods for blood glucose monitoring techniques amongst other diabetic populations. SMBG has been found to be effective for patients with type 1 diabetes (DCCT 1993) and patients with type 2 diabetes who are using insulin (Karter 2001). One Cochrane Review (Malanda 2012), concluded that SMBG in newly diagnosed patients with type 2 diabetes who are not using insulin is beneficial in lowering HbA1c. However, when the duration of diabetes is over one year, the overall glycaemic effects of SMBG are small at short term and subside after one year.
Women with type 1 and type 2 diabetes are advised to self‐monitor their blood glucose throughout pregnancy (IDF 2010). The control of hyperglycaemia in pregnant women with pre‐existing diabetes can reduce adverse maternal and infant outcomes (Kitzmiller 2008). A Cochrane Review has reported that pregnant women with type 1 or type 2 diabetes with tight to moderate glycaemic control had significantly lower risks for pre‐eclampsia, caesarean section and macrosomia (Middleton 2016). However, the evidence base for the relative effectiveness of monitoring techniques is inconclusive.
Other than the above mentioned studies or reviews, we are not aware of any other published reviews on techniques of glucose monitoring among pregnant women with pre‐existing diabetes.
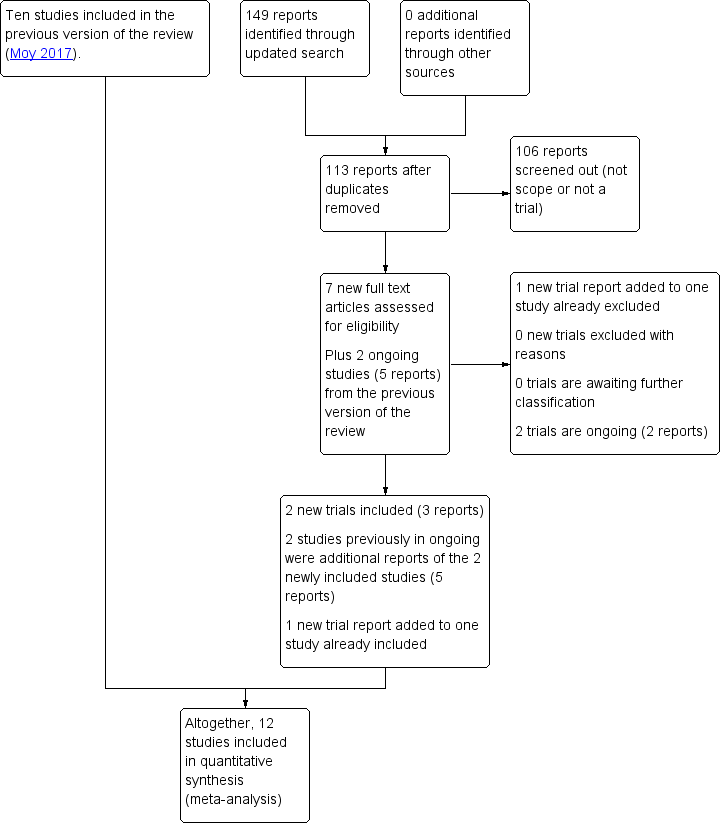
Study flow diagram 2018

'Risk of bias' summary: review authors' judgements about each risk of bias item for each included study.

'Risk of bias' graph: review authors' judgements about each risk of bias item presented as percentages across all included studies.

Comparison 1 Continuous glucose monitoring versus intermittent glucose monitoring, Outcome 1 Hypertensive disorders of pregnancy.

Comparison 1 Continuous glucose monitoring versus intermittent glucose monitoring, Outcome 2 Caesarean section.
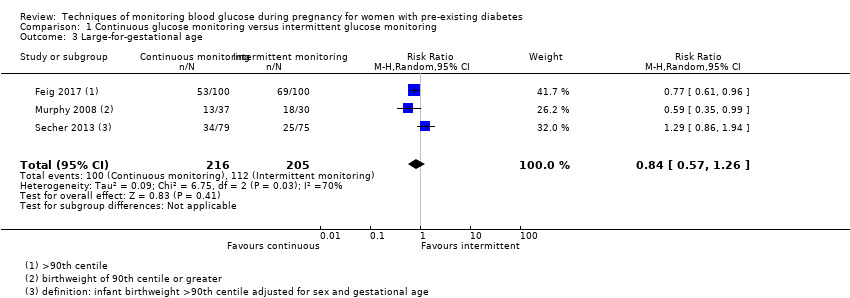
Comparison 1 Continuous glucose monitoring versus intermittent glucose monitoring, Outcome 3 Large‐for‐gestational age.

Comparison 1 Continuous glucose monitoring versus intermittent glucose monitoring, Outcome 4 Perinatal mortality (stillbirth and neonatal mortality).
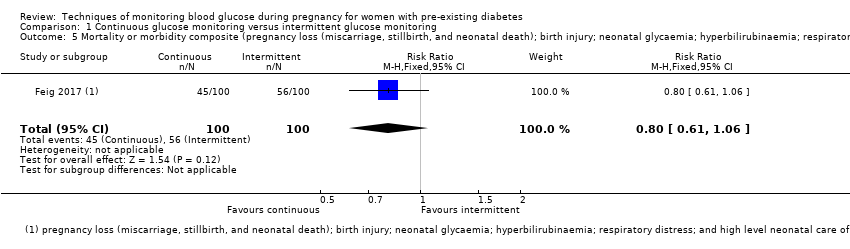
Comparison 1 Continuous glucose monitoring versus intermittent glucose monitoring, Outcome 5 Mortality or morbidity composite (pregnancy loss (miscarriage, stillbirth, and neonatal death); birth injury; neonatal glycaemia; hyperbilirubinaemia; respiratory distress; and high level neonatal care of more than 24 hours).
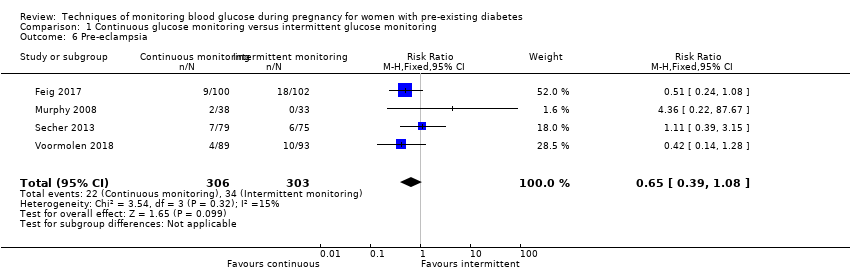
Comparison 1 Continuous glucose monitoring versus intermittent glucose monitoring, Outcome 6 Pre‐eclampsia.
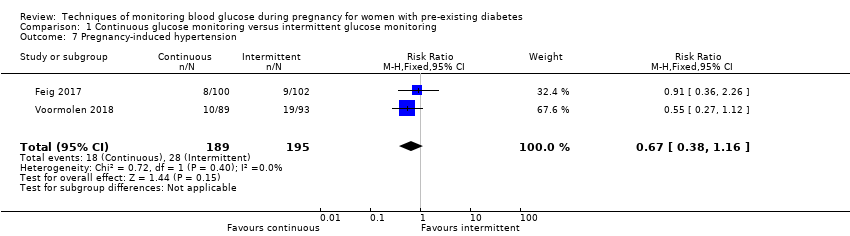
Comparison 1 Continuous glucose monitoring versus intermittent glucose monitoring, Outcome 7 Pregnancy‐induced hypertension.

Comparison 1 Continuous glucose monitoring versus intermittent glucose monitoring, Outcome 8 Behaviour changes associated with the intervention (range of score 10‐50 ‐ high score= greater fear of hypoglycaemia).
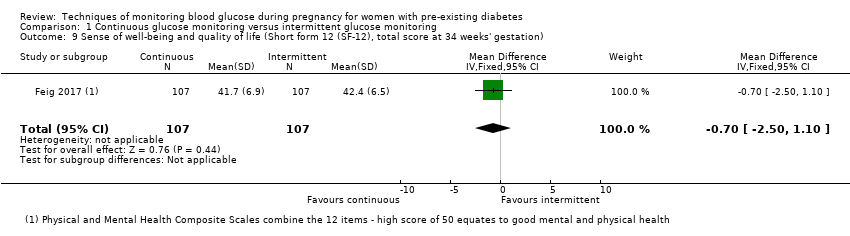
Comparison 1 Continuous glucose monitoring versus intermittent glucose monitoring, Outcome 9 Sense of well‐being and quality of life (Short form 12 (SF‐12), total score at 34 weeks' gestation).

Comparison 1 Continuous glucose monitoring versus intermittent glucose monitoring, Outcome 10 Sense of well‐being and quality of life (Problem areas in diabetes (PAID), total score at 34 weeks' gestation).

Comparison 1 Continuous glucose monitoring versus intermittent glucose monitoring, Outcome 11 Sense of well‐being and quality of life (BGMSRQ, total score at 34 weeks' gestation).
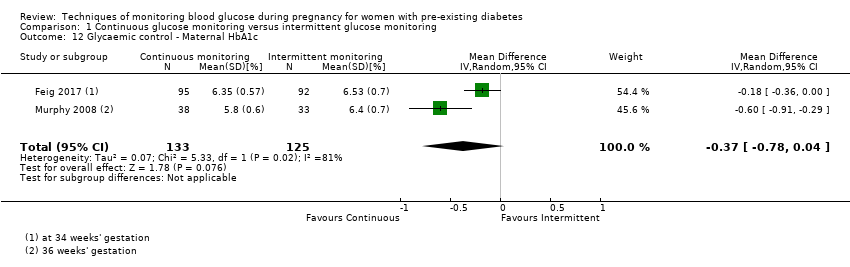
Comparison 1 Continuous glucose monitoring versus intermittent glucose monitoring, Outcome 12 Glycaemic control ‐ Maternal HbA1c.
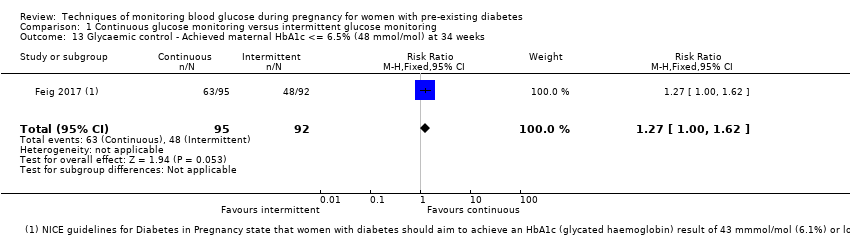
Comparison 1 Continuous glucose monitoring versus intermittent glucose monitoring, Outcome 13 Glycaemic control ‐ Achieved maternal HbA1c <= 6.5% (48 mmol/mol) at 34 weeks.
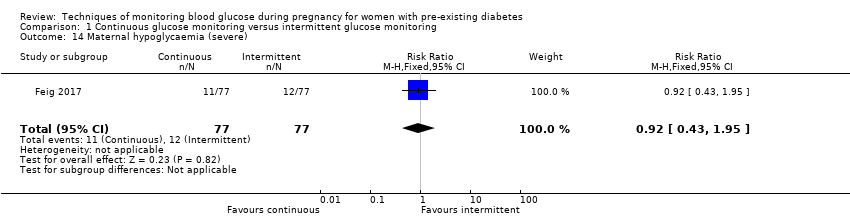
Comparison 1 Continuous glucose monitoring versus intermittent glucose monitoring, Outcome 14 Maternal hypoglycaemia (severe).

Comparison 1 Continuous glucose monitoring versus intermittent glucose monitoring, Outcome 15 Miscarriage.

Comparison 1 Continuous glucose monitoring versus intermittent glucose monitoring, Outcome 16 Stillbirth.

Comparison 1 Continuous glucose monitoring versus intermittent glucose monitoring, Outcome 17 Neonatal mortality.
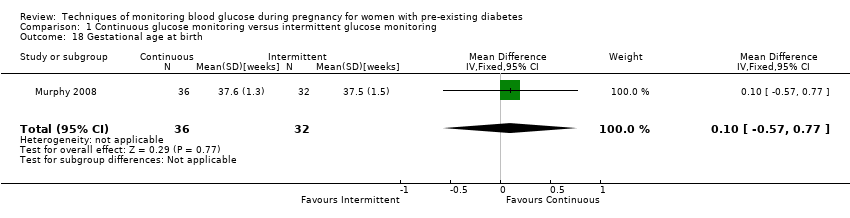
Comparison 1 Continuous glucose monitoring versus intermittent glucose monitoring, Outcome 18 Gestational age at birth.
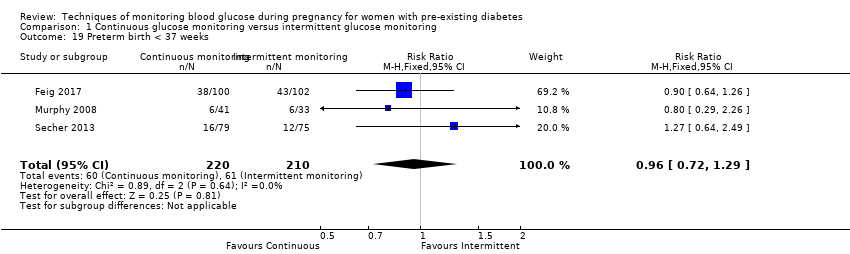
Comparison 1 Continuous glucose monitoring versus intermittent glucose monitoring, Outcome 19 Preterm birth < 37 weeks.

Comparison 1 Continuous glucose monitoring versus intermittent glucose monitoring, Outcome 20 Preterm birth < 34 weeks.

Comparison 1 Continuous glucose monitoring versus intermittent glucose monitoring, Outcome 21 Macrosomia.

Comparison 1 Continuous glucose monitoring versus intermittent glucose monitoring, Outcome 22 Birthweight.

Comparison 1 Continuous glucose monitoring versus intermittent glucose monitoring, Outcome 23 Small‐for‐gestational age.

Comparison 1 Continuous glucose monitoring versus intermittent glucose monitoring, Outcome 24 Head circumference (cm).
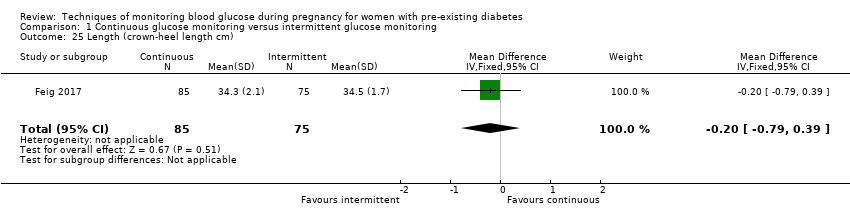
Comparison 1 Continuous glucose monitoring versus intermittent glucose monitoring, Outcome 25 Length (crown‐heel length cm).
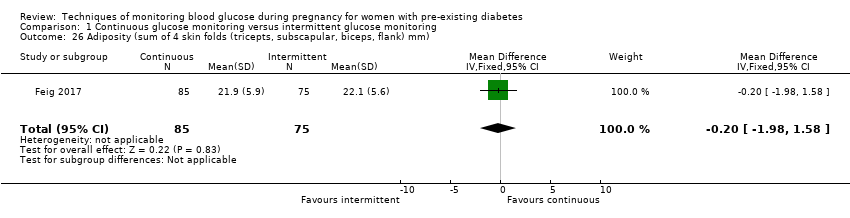
Comparison 1 Continuous glucose monitoring versus intermittent glucose monitoring, Outcome 26 Adiposity (sum of 4 skin folds (tricepts, subscapular, biceps, flank) mm).

Comparison 1 Continuous glucose monitoring versus intermittent glucose monitoring, Outcome 27 Shoulder dystocia.
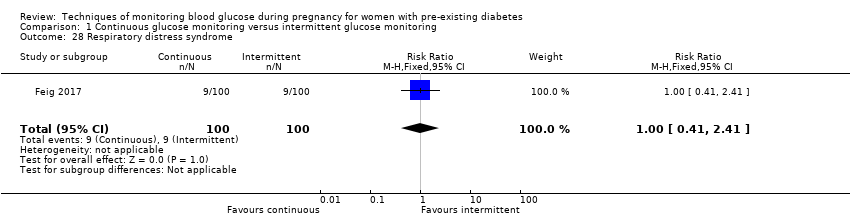
Comparison 1 Continuous glucose monitoring versus intermittent glucose monitoring, Outcome 28 Respiratory distress syndrome.
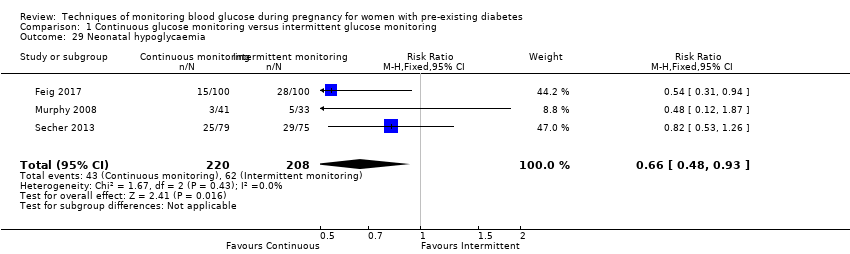
Comparison 1 Continuous glucose monitoring versus intermittent glucose monitoring, Outcome 29 Neonatal hypoglycaemia.
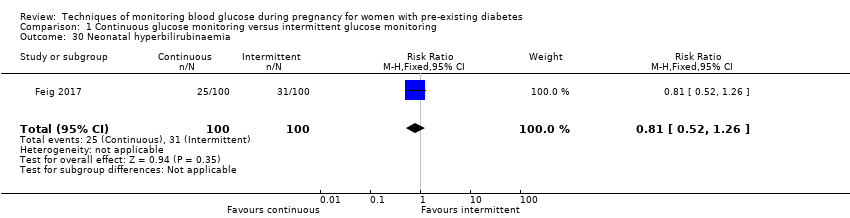
Comparison 1 Continuous glucose monitoring versus intermittent glucose monitoring, Outcome 30 Neonatal hyperbilirubinaemia.

Comparison 1 Continuous glucose monitoring versus intermittent glucose monitoring, Outcome 31 Relevant biomarker changes associated with the intervention (cord blood c‐peptide levels > 566 pmol/L).
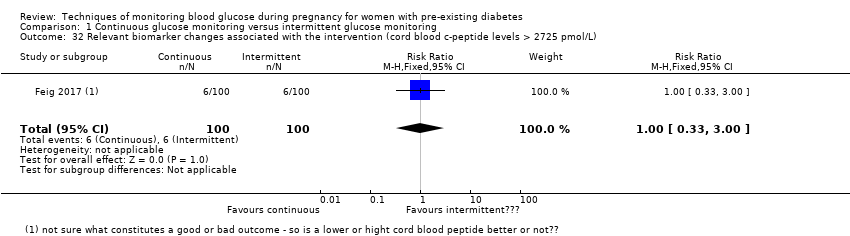
Comparison 1 Continuous glucose monitoring versus intermittent glucose monitoring, Outcome 32 Relevant biomarker changes associated with the intervention (cord blood c‐peptide levels > 2725 pmol/L).

Comparison 1 Continuous glucose monitoring versus intermittent glucose monitoring, Outcome 33 Major and minor anomalies.

Comparison 1 Continuous glucose monitoring versus intermittent glucose monitoring, Outcome 34 Number of hospital admissions (mother).

Comparison 1 Continuous glucose monitoring versus intermittent glucose monitoring, Outcome 35 Neonatal intensive care unit admissions.
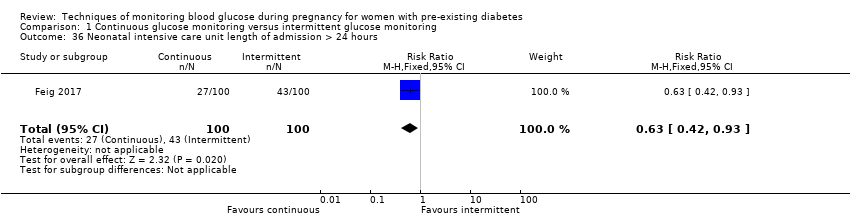
Comparison 1 Continuous glucose monitoring versus intermittent glucose monitoring, Outcome 36 Neonatal intensive care unit length of admission > 24 hours.
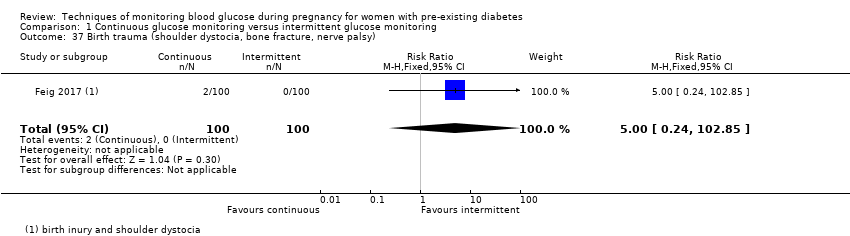
Comparison 1 Continuous glucose monitoring versus intermittent glucose monitoring, Outcome 37 Birth trauma (shoulder dystocia, bone fracture, nerve palsy).

Comparison 1 Continuous glucose monitoring versus intermittent glucose monitoring, Outcome 38 Diabetic ketoacidosis (mother).

Comparison 2 Self‐monitoring versus different type of self monitoring, Outcome 1 Caesarean section.

Comparison 2 Self‐monitoring versus different type of self monitoring, Outcome 2 Perinatal mortality (stillbirth and neonatal mortality).

Comparison 2 Self‐monitoring versus different type of self monitoring, Outcome 3 Glycaemic control during/end of treatment (maternal post‐prandial blood glucose).

Comparison 2 Self‐monitoring versus different type of self monitoring, Outcome 4 Glycaemic control during/end of treatment (maternal HbA1c).
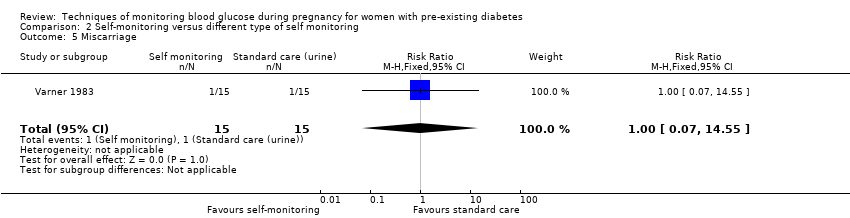
Comparison 2 Self‐monitoring versus different type of self monitoring, Outcome 5 Miscarriage.

Comparison 2 Self‐monitoring versus different type of self monitoring, Outcome 6 Neonatal mortality.
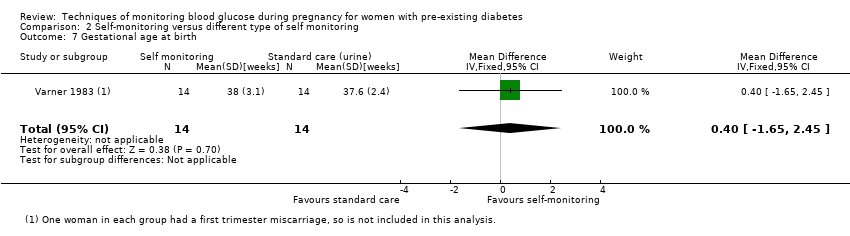
Comparison 2 Self‐monitoring versus different type of self monitoring, Outcome 7 Gestational age at birth.
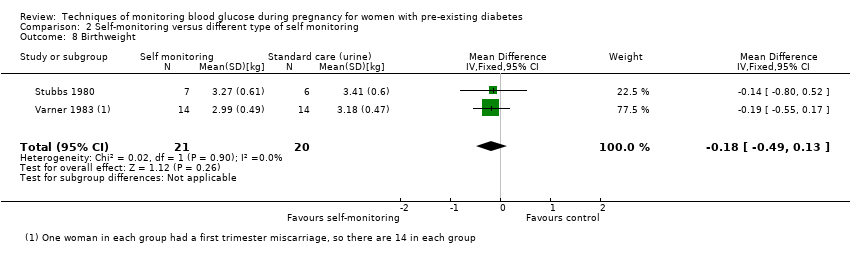
Comparison 2 Self‐monitoring versus different type of self monitoring, Outcome 8 Birthweight.

Comparison 2 Self‐monitoring versus different type of self monitoring, Outcome 9 Respiratory distress syndrome.
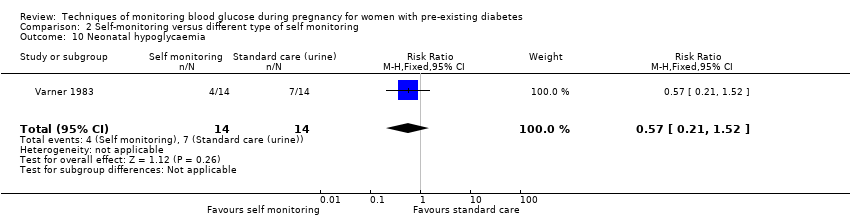
Comparison 2 Self‐monitoring versus different type of self monitoring, Outcome 10 Neonatal hypoglycaemia.

Comparison 2 Self‐monitoring versus different type of self monitoring, Outcome 11 Neonatal jaundice (hyperbilirubinaemia).

Comparison 2 Self‐monitoring versus different type of self monitoring, Outcome 12 Neonatal hypocalcaemia.
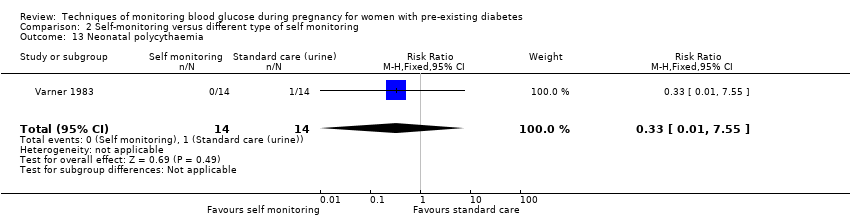
Comparison 2 Self‐monitoring versus different type of self monitoring, Outcome 13 Neonatal polycythaemia.
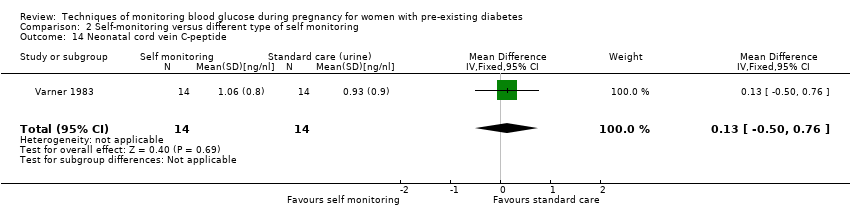
Comparison 2 Self‐monitoring versus different type of self monitoring, Outcome 14 Neonatal cord vein C‐peptide.

Comparison 3 Self‐monitoring at home versus hospitalisation, Outcome 1 Hypertensive disorders of pregnancy.

Comparison 3 Self‐monitoring at home versus hospitalisation, Outcome 2 Caesarean section.

Comparison 3 Self‐monitoring at home versus hospitalisation, Outcome 3 Perinatal mortality (stillbirth and neonatal mortality).

Comparison 3 Self‐monitoring at home versus hospitalisation, Outcome 4 Pre‐eclampsia.

Comparison 3 Self‐monitoring at home versus hospitalisation, Outcome 5 Pregnancy‐induced hypertension.

Comparison 3 Self‐monitoring at home versus hospitalisation, Outcome 6 Placental abruption.

Comparison 3 Self‐monitoring at home versus hospitalisation, Outcome 7 Preterm birth < 37 weeks.

Comparison 3 Self‐monitoring at home versus hospitalisation, Outcome 8 Respiratory distress syndrome.

Comparison 3 Self‐monitoring at home versus hospitalisation, Outcome 9 Neonatal hypoglycaemia.
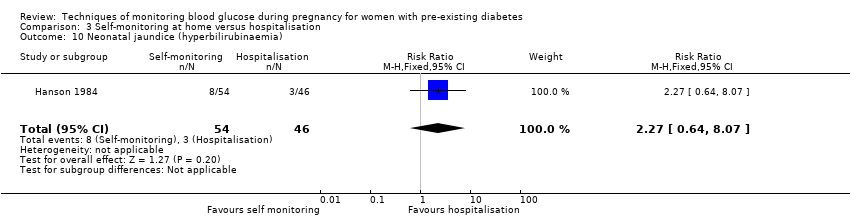
Comparison 3 Self‐monitoring at home versus hospitalisation, Outcome 10 Neonatal jaundice (hyperbilirubinaemia).

Comparison 3 Self‐monitoring at home versus hospitalisation, Outcome 11 Major anomalies.

Comparison 3 Self‐monitoring at home versus hospitalisation, Outcome 12 Antenatal hospital admission.
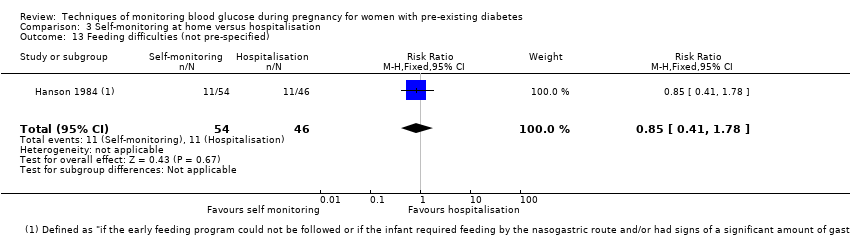
Comparison 3 Self‐monitoring at home versus hospitalisation, Outcome 13 Feeding difficulties (not pre‐specified).

Comparison 4 Pre‐prandial versus post‐prandial glucose monitoring, Outcome 1 Caesarean section.

Comparison 4 Pre‐prandial versus post‐prandial glucose monitoring, Outcome 2 Large‐for‐gestational age.

Comparison 4 Pre‐prandial versus post‐prandial glucose monitoring, Outcome 3 Perinatal mortality (stillbirth and neonatal mortality).
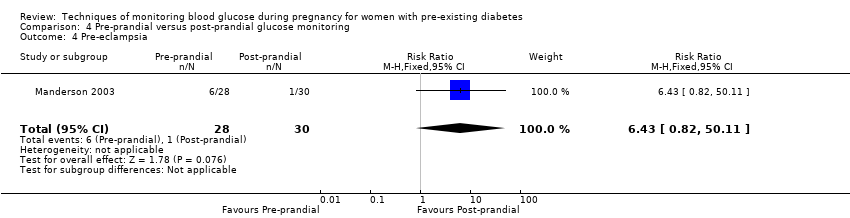
Comparison 4 Pre‐prandial versus post‐prandial glucose monitoring, Outcome 4 Pre‐eclampsia.

Comparison 4 Pre‐prandial versus post‐prandial glucose monitoring, Outcome 5 Weight gain during pregnancy.

Comparison 4 Pre‐prandial versus post‐prandial glucose monitoring, Outcome 6 Insulin dose.
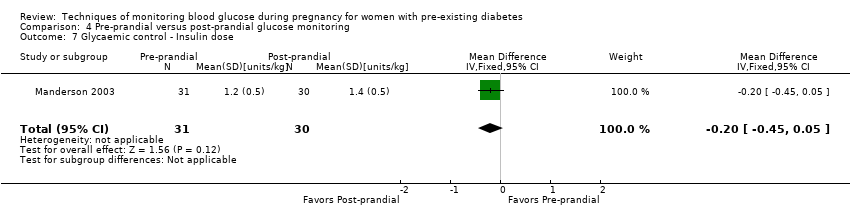
Comparison 4 Pre‐prandial versus post‐prandial glucose monitoring, Outcome 7 Glycaemic control ‐ Insulin dose.
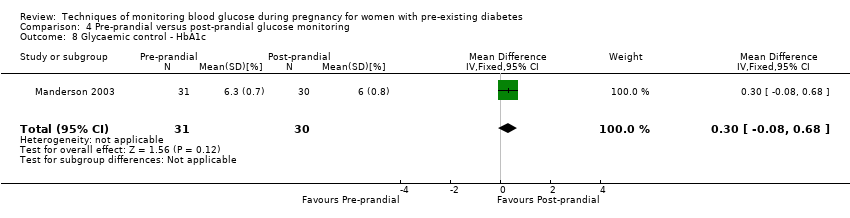
Comparison 4 Pre‐prandial versus post‐prandial glucose monitoring, Outcome 8 Glycaemic control ‐ HbA1c.

Comparison 4 Pre‐prandial versus post‐prandial glucose monitoring, Outcome 9 Stillbirth.

Comparison 4 Pre‐prandial versus post‐prandial glucose monitoring, Outcome 10 Gestational age at birth.

Comparison 4 Pre‐prandial versus post‐prandial glucose monitoring, Outcome 11 Preterm birth < 37 weeks.

Comparison 4 Pre‐prandial versus post‐prandial glucose monitoring, Outcome 12 Macrosomia.

Comparison 4 Pre‐prandial versus post‐prandial glucose monitoring, Outcome 13 Birthweight.
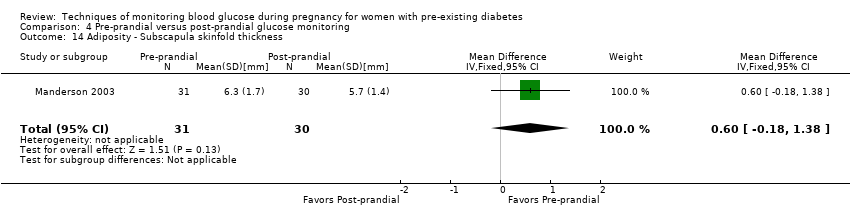
Comparison 4 Pre‐prandial versus post‐prandial glucose monitoring, Outcome 14 Adiposity ‐ Subscapula skinfold thickness.
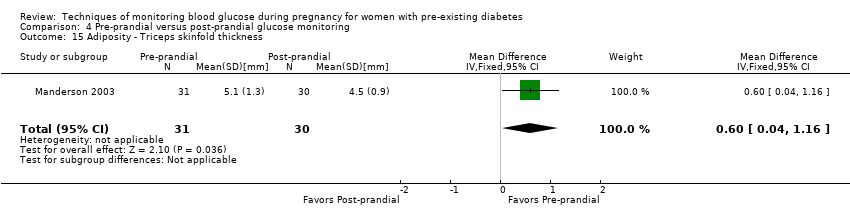
Comparison 4 Pre‐prandial versus post‐prandial glucose monitoring, Outcome 15 Adiposity ‐ Triceps skinfold thickness.
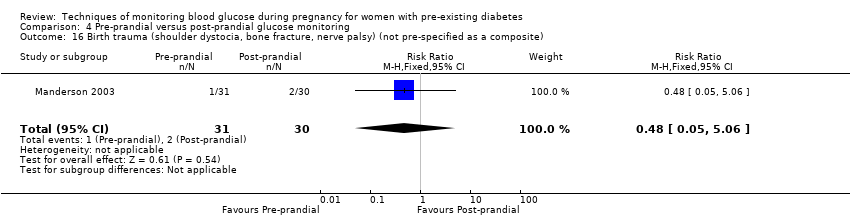
Comparison 4 Pre‐prandial versus post‐prandial glucose monitoring, Outcome 16 Birth trauma (shoulder dystocia, bone fracture, nerve palsy) (not pre‐specified as a composite).
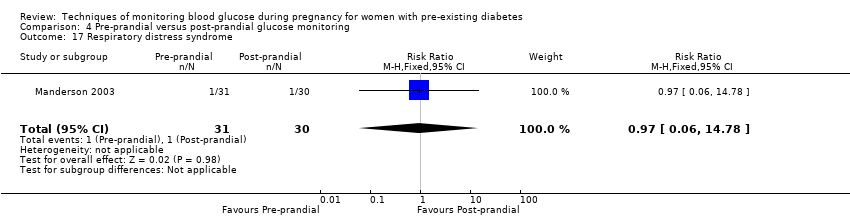
Comparison 4 Pre‐prandial versus post‐prandial glucose monitoring, Outcome 17 Respiratory distress syndrome.

Comparison 4 Pre‐prandial versus post‐prandial glucose monitoring, Outcome 18 Neonatal hypoglycaemia.

Comparison 4 Pre‐prandial versus post‐prandial glucose monitoring, Outcome 19 Neonatal jaundice (hyperbilirubinaemia).

Comparison 4 Pre‐prandial versus post‐prandial glucose monitoring, Outcome 20 Cord IGF‐1.
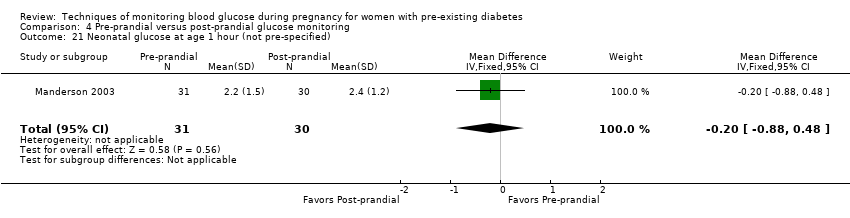
Comparison 4 Pre‐prandial versus post‐prandial glucose monitoring, Outcome 21 Neonatal glucose at age 1 hour (not pre‐specified).

Comparison 4 Pre‐prandial versus post‐prandial glucose monitoring, Outcome 22 Transient tachypnea (not pre‐specified).

Comparison 4 Pre‐prandial versus post‐prandial glucose monitoring, Outcome 23 Neonatal intensive care admissions.
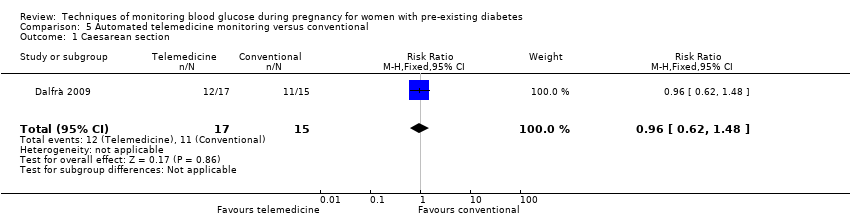
Comparison 5 Automated telemedicine monitoring versus conventional, Outcome 1 Caesarean section.
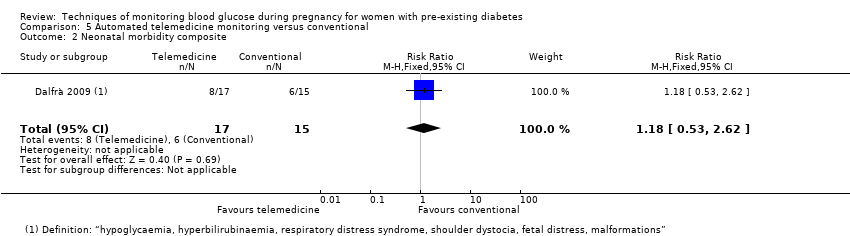
Comparison 5 Automated telemedicine monitoring versus conventional, Outcome 2 Neonatal morbidity composite.
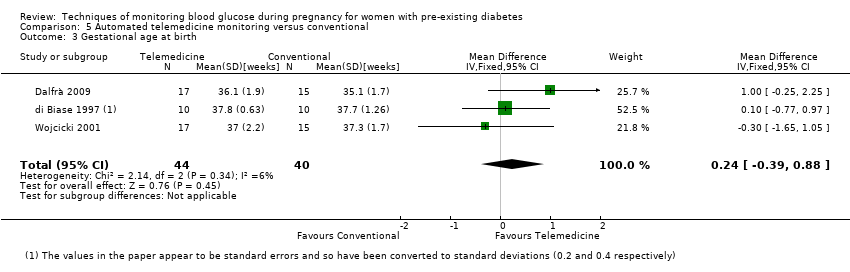
Comparison 5 Automated telemedicine monitoring versus conventional, Outcome 3 Gestational age at birth.
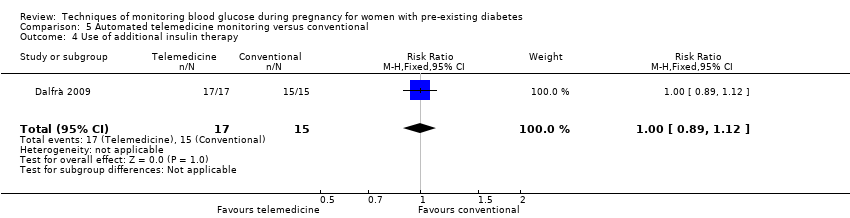
Comparison 5 Automated telemedicine monitoring versus conventional, Outcome 4 Use of additional insulin therapy.

Comparison 5 Automated telemedicine monitoring versus conventional, Outcome 5 Insulin requirement at end of study.
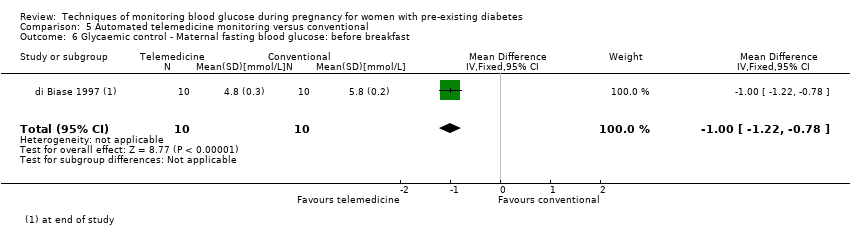
Comparison 5 Automated telemedicine monitoring versus conventional, Outcome 6 Glycaemic control ‐ Maternal fasting blood glucose: before breakfast.

Comparison 5 Automated telemedicine monitoring versus conventional, Outcome 7 Glycaemic control ‐ Maternal fasting blood glucose: before lunch.
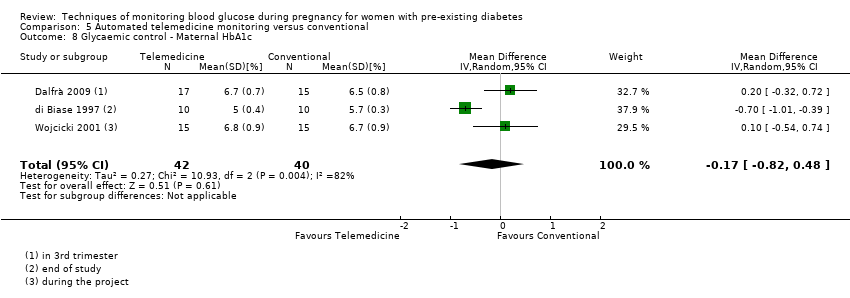
Comparison 5 Automated telemedicine monitoring versus conventional, Outcome 8 Glycaemic control ‐ Maternal HbA1c.
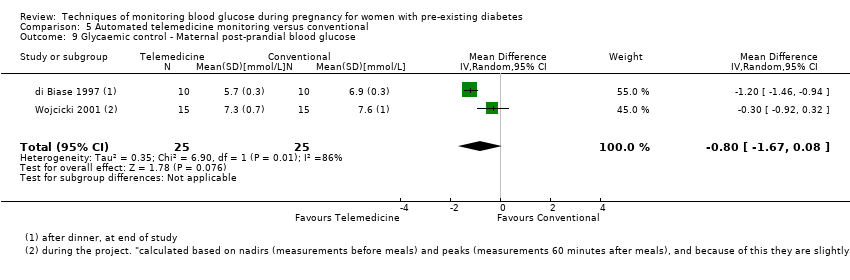
Comparison 5 Automated telemedicine monitoring versus conventional, Outcome 9 Glycaemic control ‐ Maternal post‐prandial blood glucose.
![Comparison 5 Automated telemedicine monitoring versus conventional, Outcome 10 Weight gain during pregnancy [kg].](/es/cdsr/doi/10.1002/14651858.CD009613.pub4/media/CDSR/CD009613/image_n/nCD009613-CMP-005-10.png)
Comparison 5 Automated telemedicine monitoring versus conventional, Outcome 10 Weight gain during pregnancy [kg].
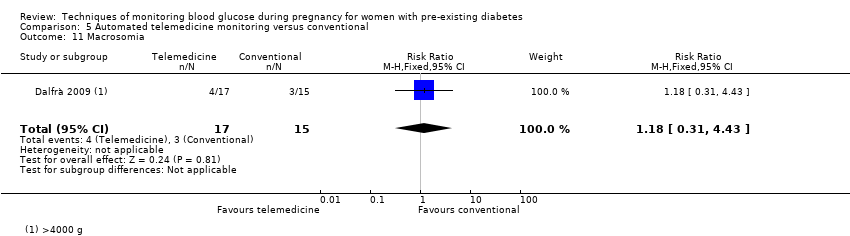
Comparison 5 Automated telemedicine monitoring versus conventional, Outcome 11 Macrosomia.

Comparison 5 Automated telemedicine monitoring versus conventional, Outcome 12 Birthweight.

Comparison 6 Constant CGM versus intermittent CGM, Outcome 1 Caesarean section.

Comparison 6 Constant CGM versus intermittent CGM, Outcome 2 Weight gain during pregnancy.

Comparison 6 Constant CGM versus intermittent CGM, Outcome 3 Insulin dosage, 3rd trimester (IU/kg/day).

Comparison 6 Constant CGM versus intermittent CGM, Outcome 4 Glycaemic control ‐ Maternal blood glucose (1st trimester).
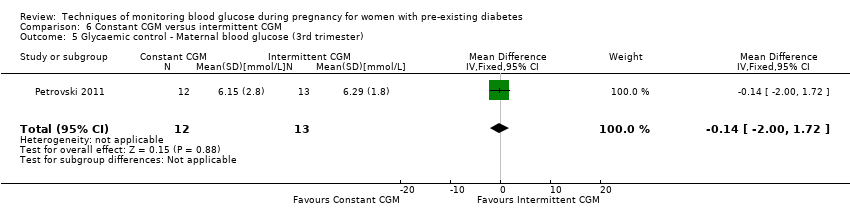
Comparison 6 Constant CGM versus intermittent CGM, Outcome 5 Glycaemic control ‐ Maternal blood glucose (3rd trimester).
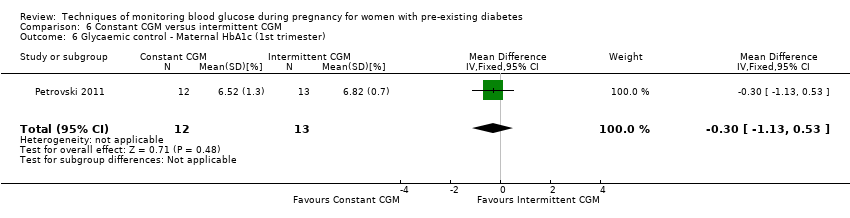
Comparison 6 Constant CGM versus intermittent CGM, Outcome 6 Glycaemic control ‐ Maternal HbA1c (1st trimester).

Comparison 6 Constant CGM versus intermittent CGM, Outcome 7 Glycaemic control ‐ Maternal HbA1c (3rd trimester).
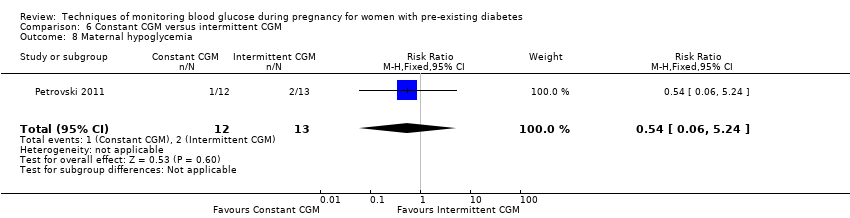
Comparison 6 Constant CGM versus intermittent CGM, Outcome 8 Maternal hypoglycemia.

Comparison 6 Constant CGM versus intermittent CGM, Outcome 9 Diabetic ketoacidosis (not pre‐specified).
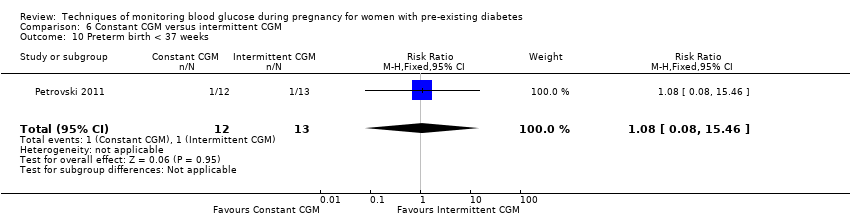
Comparison 6 Constant CGM versus intermittent CGM, Outcome 10 Preterm birth < 37 weeks.

Comparison 6 Constant CGM versus intermittent CGM, Outcome 11 Macrosomia.
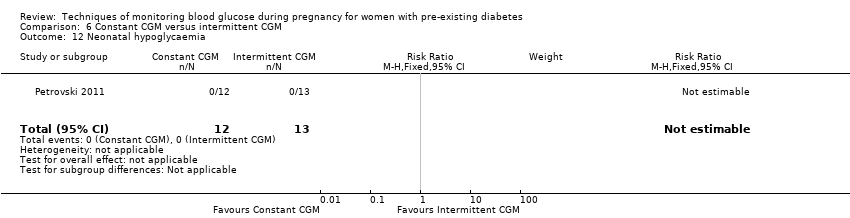
Comparison 6 Constant CGM versus intermittent CGM, Outcome 12 Neonatal hypoglycaemia.
| Continuous glucose monitoring compared to intermittent glucose monitoring for women with pre‐existing diabetes | ||||||
| Patient or population: women with pre‐existing diabetes Intervention: continuous glucose monitoring | ||||||
| Outcomes | Anticipated absolute effects* (95% CI) | Relative effect | № of participants | Certainty of the evidence | Comments | |
| Risk with intermittent self‐glucose monitoring | Risk with continuous glucose monitoring | |||||
| Hypertensive disorders of pregnancy (including pre‐eclampsia, pregnancy‐induced hypertension, eclampsia) | Study population | RR 0.58 | 384 | ⊕⊕⊝⊝ | ||
| 292 per 1000 | 170 per 1000 | |||||
| Caesarean section | Study population | RR 0.94 | 427 | ⊕⊕⊕⊝ | ||
| 600 per 1000 | 564 per 1000 | |||||
| Large‐for‐gestational age | Study population | RR 0.84 | 421 | ⊕⊕⊝⊝ | ||
| 546 per 1000 | 459 per 1000 | |||||
| Perinatal mortality (stillbirth and neonatal mortality) | Study population | RR 0.82 | 71 | ⊕⊕⊝⊝ | ||
| 31 per 1000 | 26 per 1000 | |||||
| *The risk in the intervention group (and its 95% confidence interval) is based on the assumed risk in the comparison group and the relative effect of the intervention (and its 95% CI). | ||||||
| GRADE Working Group grades of evidence | ||||||
| 1 We downgraded (1) level for serious limitations in study design due to unclear risk of allocation concealment and high risk for selective outcome reporting 2 We downgraded (1) level for serious indirectness due to the two studies reporting this composite outcome in different ways: Voormolen 2018 reported a composite of pregnancy‐induced hypertension and pre‐eclampsia for women with type 1 diabetes and type 2 diabetes for; and Feig 2017 reporting a composite of worsening chronic, gestational and pre‐eclampsia for women with type 1 diabetes 3 We downgraded (1) level for serious inconsistency due to evidence of statistical heterogeneity I2 = 41% 4 We downgraded (1) level for serious imprecision due to wide CI crossing the line of no effect 5 We downgraded (1) level for serious inconsistency due to evidence of statistical heterogeneity I2 = 70% 6 We downgrade (2) levels for very serious imprecision due to evidence derived from a single study, with a small number of events, wide CI crossing the line of no effect | ||||||
| Self‐monitoring compared to standard care for women with pre‐existing diabetes | ||||||
| Patient or population: women with pre‐existing diabetes | ||||||
| Outcomes | Anticipated absolute effects* (95% CI) | Relative effect | № of participants | Quality of the evidence | Comments | |
| Risk with standard care | Risk with self‐monitoring | |||||
| Hypertensive disorders of pregnancy (including pre‐eclampsia, pregnancy‐induced hypertension, eclampsia) | Study population | (0 studies) | The included study did not report this outcome. | |||
| Caesarean section | Study population | RR 0.78 | 28 | ⊕⊝⊝⊝ | ||
| 643 per 1000 | 501 per 1000 | |||||
| Large‐for‐gestational age | Study population | (0 studies) | The included study did not report this outcome. | |||
| Perinatal mortality (stillbirth and neonatal mortality) | Study population | RR 3.00 | 28 | ⊕⊝⊝⊝ | There were no events in the standard care group and so anticipated absolute effects could not be calculated. | |
| 0 per 1000 | 0 per 1000 | |||||
| *The risk in the intervention group (and its 95% confidence interval) is based on the assumed risk in the comparison group and the relative effect of the intervention (and its 95% CI). | ||||||
| GRADE Working Group grades of evidence | ||||||
| 1 We downgraded (1) level for serious limitations in design limitations due unclear allocation concealment and high risk for attrition 2 We downgraded (2) levels for very serious imprecision due to wide CI crossing the line of no effect, few events and small sample size | ||||||
| Self‐monitoring compared to hospitalisation for women with pre‐existing diabetes | ||||||
| Patient or population: women with pre‐existing diabetes | ||||||
| Outcomes | Anticipated absolute effects* (95% CI) | Relative effect | № of participants | Quality of the evidence | Comments | |
| Risk with hospitalisation | Risk with self‐monitoring | |||||
| Hypertensive disorders of pregnancy (including pre‐eclampsia, pregnancy‐induced hypertension, eclampsia) | Study population | RR 1.19 (0.41 to 3.51) | 100 (1 RCT) | ⊕⊝⊝⊝ | ||
| 109 per 1000 | 129 per 1000 (45 to 381) | |||||
| Caesarean section | Study population | RR 0.96 | 100 | ⊕⊝⊝⊝ | ||
| 500 per 1000 | 480 per 1000 | |||||
| Large‐for‐gestational age | Study population | (0 studies) | The included study did not report this outcome. | |||
| Perinatal mortality (stillbirth and neonatal mortality) | Study population | RR 0.85 | 100 | ⊕⊝⊝⊝ | ||
| 22 per 1000 | 18 per 1000 | |||||
| *The risk in the intervention group (and its 95% confidence interval) is based on the assumed risk in the comparison group and the relative effect of the intervention (and its 95% CI). | ||||||
| GRADE Working Group grades of evidence | ||||||
| 1 We downgraded (1) level for serious limitations in study design due to unclear randomisation, allocation concealment and high risk for attrition 2 We downgraded (2) levels for very serious imprecision due to wide CI crossing the line of no effect, few events and small sample size | ||||||
| Pre‐prandial compared to post‐prandial glucose monitoring for women with pre‐existing diabetes | ||||||
| Patient or population: women with pre‐existing diabetes Intervention: pre‐prandial | ||||||
| Outcomes | Anticipated absolute effects* (95% CI) | Relative effect | № of participants | Quality of the evidence | Comments | |
| Risk with post‐prandial glucose monitoring | Risk with pre‐prandial | |||||
| Hypertensive disorders of pregnancy (including pre‐eclampsia, pregnancy‐induced hypertension, eclampsia) | Study population | (0 studies) | The included study did not report this composite outcome. | |||
| Caesarean section | Study population | RR 1.45 | 61 | ⊕⊝⊝⊝ | ||
| 467 per 1000 | 677 per 1000 | |||||
| Large‐for‐gestational age | Study population | RR 1.16 | 61 | ⊕⊝⊝⊝ | ||
| 500 per 1000 | 580 per 1000 | |||||
| Perinatal mortality (stillbirth and neonatal mortality) | Study population | RR 2.91 | 61 | ⊕⊝⊝⊝ | There were no events in the standard care group and so anticipated absolute effects could not be calculated. | |
| 0 per 1000 | 0 per 1000 | |||||
| *The risk in the intervention group (and its 95% confidence interval) is based on the assumed risk in the comparison group and the relative effect of the intervention (and its 95% CI). | ||||||
| GRADE Working Group grades of evidence | ||||||
| 1 We downgraded (1) level for serious limitations in study design due to unclear methods of randomisation and high risk of attrition 2 We downgrade (2) levels for very serious limitations in imprecision due to wide CI crossing the line of no effect, few events and small sample size | ||||||
| Automated telemedicine monitoring compared to conventional for women with pre‐existing diabetes | ||||||
| Patient or population: women with pre‐existing diabetes | ||||||
| Outcomes | Anticipated absolute effects* (95% CI) | Relative effect | № of participants | Quality of the evidence | Comments | |
| Risk with conventional monitoring | Risk with automated telemedicine monitoring | |||||
| Hypertensive disorders of pregnancy (including pre‐eclampsia, pregnancy‐induced hypertension, eclampsia) | Study population | (0 studies) | The included studies did not report this composite outcome. | |||
| Caesarean section | Study population | RR 0.96 | 32 | ⊕⊝⊝⊝ | ||
| 733 per 1000 | 704 per 1000 | |||||
| Large‐for‐gestational age | Study population | (0 studies) | The included studies did not report this outcome. | |||
| Perinatal mortality (stillbirth and neonatal mortality) | Study population | (0 studies) | The included studies did not report this outcome. | |||
| *The risk in the intervention group (and its 95% confidence interval) is based on the assumed risk in the comparison group and the relative effect of the intervention (and its 95% CI). | ||||||
| GRADE Working Group grades of evidence | ||||||
| 1 We downgraded (2) levels for very serious design limitations due to high risk for randomisation, allocation concealment, attrition and other bias 2 We downgraded (2) levels for very serious imprecision due to wide CI crossing the line of no effect, few events and small sample size | ||||||
| Constant CGM compared to Intermittent CGM for women with pre‐existing diabetes | ||||||
| Patient or population: women with pre‐existing diabetes | ||||||
| Outcomes | Anticipated absolute effects* (95% CI) | Relative effect | № of participants | Quality of the evidence | Comments | |
| Risk with Intermittent CGM | Risk with constant CGM | |||||
| Hypertensive disorders of pregnancy (including pre‐eclampsia, pregnancy‐induced hypertension, eclampsia) | Study population | (0 studies) | The included study did not report this outcome. | |||
| Caesarean section | Study population | RR 0.77 | 25 | ⊕⊝⊝⊝ | ||
| 538 per 1000 | 415 per 1000 | |||||
| Large‐for‐gestational age | Study population | (0 studies) | The included study did not report this outcome. | |||
| Perinatal mortality (stillbirth and neonatal mortality) | Study population | (0 studies) | The included study did not report this outcome. | |||
| *The risk in the intervention group (and its 95% confidence interval) is based on the assumed risk in the comparison group and the relative effect of the intervention (and its 95% CI). | ||||||
| GRADE Working Group grades of evidence | ||||||
| 1 We downgraded (1) level for serious limitations in design due to unclear randomisation and allocation concealment 2 We downgraded (2) levels for very serious limitations in imprecision due to wide CI crossing the line of no effect, few events and small sample size | ||||||
| Outcome or subgroup title | No. of studies | No. of participants | Statistical method | Effect size |
| 1 Hypertensive disorders of pregnancy Show forest plot | 2 | 384 | Risk Ratio (M‐H, Fixed, 95% CI) | 0.58 [0.39, 0.85] |
| 2 Caesarean section Show forest plot | 3 | 427 | Risk Ratio (M‐H, Random, 95% CI) | 0.94 [0.75, 1.18] |
| 3 Large‐for‐gestational age Show forest plot | 3 | 421 | Risk Ratio (M‐H, Random, 95% CI) | 0.84 [0.57, 1.26] |
| 4 Perinatal mortality (stillbirth and neonatal mortality) Show forest plot | 1 | 71 | Risk Ratio (M‐H, Fixed, 95% CI) | 0.82 [0.05, 12.61] |
| 5 Mortality or morbidity composite (pregnancy loss (miscarriage, stillbirth, and neonatal death); birth injury; neonatal glycaemia; hyperbilirubinaemia; respiratory distress; and high level neonatal care of more than 24 hours) Show forest plot | 1 | 200 | Risk Ratio (M‐H, Fixed, 95% CI) | 0.80 [0.61, 1.06] |
| 6 Pre‐eclampsia Show forest plot | 4 | 609 | Risk Ratio (M‐H, Fixed, 95% CI) | 0.65 [0.39, 1.08] |
| 7 Pregnancy‐induced hypertension Show forest plot | 2 | 384 | Risk Ratio (M‐H, Fixed, 95% CI) | 0.67 [0.38, 1.16] |
| 8 Behaviour changes associated with the intervention (range of score 10‐50 ‐ high score= greater fear of hypoglycaemia) Show forest plot | 1 | 214 | Mean Difference (IV, Fixed, 95% CI) | 1.00 [‐1.06, 3.06] |
| 9 Sense of well‐being and quality of life (Short form 12 (SF‐12), total score at 34 weeks' gestation) Show forest plot | 1 | 214 | Mean Difference (IV, Fixed, 95% CI) | ‐0.70 [‐2.50, 1.10] |
| 10 Sense of well‐being and quality of life (Problem areas in diabetes (PAID), total score at 34 weeks' gestation) Show forest plot | 1 | 214 | Mean Difference (IV, Fixed, 95% CI) | 0.80 [‐3.06, 4.66] |
| 11 Sense of well‐being and quality of life (BGMSRQ, total score at 34 weeks' gestation) Show forest plot | 1 | 214 | Mean Difference (IV, Fixed, 95% CI) | 4.30 [0.73, 7.87] |
| 12 Glycaemic control ‐ Maternal HbA1c Show forest plot | 2 | 258 | Mean Difference (IV, Random, 95% CI) | ‐0.37 [‐0.78, 0.04] |
| 13 Glycaemic control ‐ Achieved maternal HbA1c <= 6.5% (48 mmol/mol) at 34 weeks Show forest plot | 1 | 187 | Risk Ratio (M‐H, Fixed, 95% CI) | 1.27 [1.00, 1.62] |
| 14 Maternal hypoglycaemia (severe) Show forest plot | 1 | 154 | Risk Ratio (M‐H, Fixed, 95% CI) | 0.92 [0.43, 1.95] |
| 15 Miscarriage Show forest plot | 3 | 439 | Risk Ratio (M‐H, Fixed, 95% CI) | 1.24 [0.47, 3.26] |
| 16 Stillbirth Show forest plot | 1 | 211 | Risk Ratio (M‐H, Fixed, 95% CI) | 0.34 [0.01, 8.17] |
| 17 Neonatal mortality Show forest plot | 2 | 256 | Risk Ratio (M‐H, Fixed, 95% CI) | 0.92 [0.13, 6.37] |
| 18 Gestational age at birth Show forest plot | 1 | 68 | Mean Difference (IV, Fixed, 95% CI) | 0.10 [‐0.57, 0.77] |
| 19 Preterm birth < 37 weeks Show forest plot | 3 | 430 | Risk Ratio (M‐H, Fixed, 95% CI) | 0.96 [0.72, 1.29] |
| 20 Preterm birth < 34 weeks Show forest plot | 1 | 211 | Risk Ratio (M‐H, Fixed, 95% CI) | 0.46 [0.17, 1.28] |
| 21 Macrosomia Show forest plot | 3 | 451 | Risk Ratio (M‐H, Random, 95% CI) | 0.84 [0.61, 1.17] |
| 22 Birthweight Show forest plot | 2 | 267 | Mean Difference (IV, Random, 95% CI) | ‐0.13 [‐0.38, 0.12] |
| 23 Small‐for‐gestational age Show forest plot | 2 | 269 | Risk Ratio (M‐H, Fixed, 95% CI) | 2.40 [0.55, 10.51] |
| 24 Head circumference (cm) Show forest plot | 1 | 160 | Mean Difference (IV, Fixed, 95% CI) | ‐0.20 [‐0.79, 0.39] |
| 25 Length (crown‐heel length cm) Show forest plot | 1 | 160 | Mean Difference (IV, Fixed, 95% CI) | ‐0.20 [‐0.79, 0.39] |
| 26 Adiposity (sum of 4 skin folds (tricepts, subscapular, biceps, flank) mm) Show forest plot | 1 | 160 | Mean Difference (IV, Fixed, 95% CI) | ‐0.20 [‐1.98, 1.58] |
| 27 Shoulder dystocia Show forest plot | 1 | 200 | Risk Ratio (M‐H, Fixed, 95% CI) | 3.0 [0.12, 72.77] |
| 28 Respiratory distress syndrome Show forest plot | 1 | 200 | Risk Ratio (M‐H, Fixed, 95% CI) | 1.0 [0.41, 2.41] |
| 29 Neonatal hypoglycaemia Show forest plot | 3 | 428 | Risk Ratio (M‐H, Fixed, 95% CI) | 0.66 [0.48, 0.93] |
| 30 Neonatal hyperbilirubinaemia Show forest plot | 1 | 200 | Risk Ratio (M‐H, Fixed, 95% CI) | 0.81 [0.52, 1.26] |
| 31 Relevant biomarker changes associated with the intervention (cord blood c‐peptide levels > 566 pmol/L) Show forest plot | 1 | 200 | Risk Ratio (M‐H, Fixed, 95% CI) | 0.95 [0.68, 1.33] |
| 32 Relevant biomarker changes associated with the intervention (cord blood c‐peptide levels > 2725 pmol/L) Show forest plot | 1 | 200 | Risk Ratio (M‐H, Fixed, 95% CI) | 1.0 [0.33, 3.00] |
| 33 Major and minor anomalies Show forest plot | 2 | 285 | Risk Ratio (M‐H, Fixed, 95% CI) | 0.71 [0.16, 3.13] |
| 34 Number of hospital admissions (mother) Show forest plot | 1 | 207 | Risk Ratio (M‐H, Fixed, 95% CI) | 1.25 [0.84, 1.85] |
| 35 Neonatal intensive care unit admissions Show forest plot | 2 | 274 | Risk Ratio (M‐H, Random, 95% CI) | 0.76 [0.42, 1.35] |
| 36 Neonatal intensive care unit length of admission > 24 hours Show forest plot | 1 | 200 | Risk Ratio (M‐H, Fixed, 95% CI) | 0.63 [0.42, 0.93] |
| 37 Birth trauma (shoulder dystocia, bone fracture, nerve palsy) Show forest plot | 1 | 200 | Risk Ratio (M‐H, Fixed, 95% CI) | 5.0 [0.24, 102.85] |
| 38 Diabetic ketoacidosis (mother) Show forest plot | 1 | 207 | Risk Ratio (M‐H, Fixed, 95% CI) | 1.01 [0.14, 7.03] |
| Outcome or subgroup title | No. of studies | No. of participants | Statistical method | Effect size |
| 1 Caesarean section Show forest plot | 1 | 28 | Risk Ratio (M‐H, Fixed, 95% CI) | 0.78 [0.40, 1.49] |
| 2 Perinatal mortality (stillbirth and neonatal mortality) Show forest plot | 1 | 28 | Risk Ratio (M‐H, Fixed, 95% CI) | 3.0 [0.13, 67.91] |
| 3 Glycaemic control during/end of treatment (maternal post‐prandial blood glucose) Show forest plot | 1 | 13 | Mean Difference (IV, Fixed, 95% CI) | ‐0.70 [‐2.15, 0.75] |
| 4 Glycaemic control during/end of treatment (maternal HbA1c) Show forest plot | 1 | 28 | Mean Difference (IV, Fixed, 95% CI) | ‐0.10 [‐1.93, 1.73] |
| 5 Miscarriage Show forest plot | 1 | 30 | Risk Ratio (M‐H, Fixed, 95% CI) | 1.0 [0.07, 14.55] |
| 6 Neonatal mortality Show forest plot | 1 | 28 | Risk Ratio (M‐H, Fixed, 95% CI) | 3.0 [0.13, 67.91] |
| 7 Gestational age at birth Show forest plot | 1 | 28 | Mean Difference (IV, Fixed, 95% CI) | 0.40 [‐1.65, 2.45] |
| 8 Birthweight Show forest plot | 2 | 41 | Mean Difference (IV, Fixed, 95% CI) | ‐0.18 [‐0.49, 0.13] |
| 9 Respiratory distress syndrome Show forest plot | 1 | 28 | Risk Ratio (M‐H, Fixed, 95% CI) | 3.0 [0.13, 67.91] |
| 10 Neonatal hypoglycaemia Show forest plot | 1 | 28 | Risk Ratio (M‐H, Fixed, 95% CI) | 0.57 [0.21, 1.52] |
| 11 Neonatal jaundice (hyperbilirubinaemia) Show forest plot | 1 | 28 | Risk Ratio (M‐H, Fixed, 95% CI) | 0.56 [0.25, 1.24] |
| 12 Neonatal hypocalcaemia Show forest plot | 1 | 28 | Risk Ratio (M‐H, Fixed, 95% CI) | 1.0 [0.07, 14.45] |
| 13 Neonatal polycythaemia Show forest plot | 1 | 28 | Risk Ratio (M‐H, Fixed, 95% CI) | 0.33 [0.01, 7.55] |
| 14 Neonatal cord vein C‐peptide Show forest plot | 1 | 28 | Mean Difference (IV, Fixed, 95% CI) | 0.13 [‐0.50, 0.76] |
| Outcome or subgroup title | No. of studies | No. of participants | Statistical method | Effect size |
| 1 Hypertensive disorders of pregnancy Show forest plot | 1 | 100 | Risk Ratio (M‐H, Fixed, 95% CI) | 1.19 [0.41, 3.51] |
| 2 Caesarean section Show forest plot | 1 | 100 | Risk Ratio (M‐H, Fixed, 95% CI) | 0.96 [0.65, 1.44] |
| 3 Perinatal mortality (stillbirth and neonatal mortality) Show forest plot | 1 | 100 | Risk Ratio (M‐H, Fixed, 95% CI) | 0.85 [0.05, 13.24] |
| 4 Pre‐eclampsia Show forest plot | 1 | 100 | Risk Ratio (M‐H, Fixed, 95% CI) | 4.26 [0.52, 35.16] |
| 5 Pregnancy‐induced hypertension Show forest plot | 1 | 100 | Risk Ratio (M‐H, Fixed, 95% CI) | 0.43 [0.08, 2.22] |
| 6 Placental abruption Show forest plot | 1 | 100 | Risk Ratio (M‐H, Fixed, 95% CI) | 1.70 [0.16, 18.19] |
| 7 Preterm birth < 37 weeks Show forest plot | 1 | 100 | Risk Ratio (M‐H, Fixed, 95% CI) | 0.85 [0.45, 1.60] |
| 8 Respiratory distress syndrome Show forest plot | 1 | 100 | Risk Ratio (M‐H, Fixed, 95% CI) | 2.56 [0.28, 23.74] |
| 9 Neonatal hypoglycaemia Show forest plot | 1 | 100 | Risk Ratio (M‐H, Fixed, 95% CI) | 1.01 [0.50, 2.03] |
| 10 Neonatal jaundice (hyperbilirubinaemia) Show forest plot | 1 | 100 | Risk Ratio (M‐H, Fixed, 95% CI) | 2.27 [0.64, 8.07] |
| 11 Major anomalies Show forest plot | 1 | 102 | Risk Ratio (M‐H, Fixed, 95% CI) | 0.27 [0.03, 2.54] |
| 12 Antenatal hospital admission Show forest plot | 1 | 100 | Risk Ratio (M‐H, Fixed, 95% CI) | 0.19 [0.11, 0.33] |
| 13 Feeding difficulties (not pre‐specified) Show forest plot | 1 | 100 | Risk Ratio (M‐H, Fixed, 95% CI) | 0.85 [0.41, 1.78] |
| Outcome or subgroup title | No. of studies | No. of participants | Statistical method | Effect size |
| 1 Caesarean section Show forest plot | 1 | 61 | Risk Ratio (M‐H, Fixed, 95% CI) | 1.45 [0.92, 2.28] |
| 2 Large‐for‐gestational age Show forest plot | 1 | 61 | Risk Ratio (M‐H, Fixed, 95% CI) | 1.16 [0.73, 1.85] |
| 3 Perinatal mortality (stillbirth and neonatal mortality) Show forest plot | 1 | 61 | Risk Ratio (M‐H, Fixed, 95% CI) | 2.91 [0.12, 68.66] |
| 4 Pre‐eclampsia Show forest plot | 1 | 58 | Risk Ratio (M‐H, Fixed, 95% CI) | 6.43 [0.82, 50.11] |
| 5 Weight gain during pregnancy Show forest plot | 1 | 61 | Mean Difference (IV, Fixed, 95% CI) | ‐0.90 [‐3.86, 2.06] |
| 6 Insulin dose Show forest plot | 1 | 61 | Mean Difference (IV, Fixed, 95% CI) | ‐17.40 [‐43.41, 8.61] |
| 7 Glycaemic control ‐ Insulin dose Show forest plot | 1 | 61 | Mean Difference (IV, Fixed, 95% CI) | ‐0.20 [‐0.45, 0.05] |
| 8 Glycaemic control ‐ HbA1c Show forest plot | 1 | 61 | Mean Difference (IV, Fixed, 95% CI) | 0.30 [‐0.08, 0.68] |
| 9 Stillbirth Show forest plot | 1 | 61 | Risk Ratio (M‐H, Fixed, 95% CI) | 2.91 [0.12, 68.66] |
| 10 Gestational age at birth Show forest plot | 1 | 61 | Mean Difference (IV, Fixed, 95% CI) | 0.20 [‐0.84, 1.24] |
| 11 Preterm birth < 37 weeks Show forest plot | 1 | 61 | Risk Ratio (M‐H, Fixed, 95% CI) | 1.33 [0.62, 2.84] |
| 12 Macrosomia Show forest plot | 1 | 61 | Risk Ratio (M‐H, Fixed, 95% CI) | 2.18 [0.75, 6.32] |
| 13 Birthweight Show forest plot | 1 | 61 | Mean Difference (IV, Fixed, 95% CI) | 0.24 [‐0.10, 0.58] |
| 14 Adiposity ‐ Subscapula skinfold thickness Show forest plot | 1 | 61 | Mean Difference (IV, Fixed, 95% CI) | 0.60 [‐0.18, 1.38] |
| 15 Adiposity ‐ Triceps skinfold thickness Show forest plot | 1 | 61 | Mean Difference (IV, Fixed, 95% CI) | 0.60 [0.04, 1.16] |
| 16 Birth trauma (shoulder dystocia, bone fracture, nerve palsy) (not pre‐specified as a composite) Show forest plot | 1 | 61 | Risk Ratio (M‐H, Fixed, 95% CI) | 0.48 [0.05, 5.06] |
| 17 Respiratory distress syndrome Show forest plot | 1 | 61 | Risk Ratio (M‐H, Fixed, 95% CI) | 0.97 [0.06, 14.78] |
| 18 Neonatal hypoglycaemia Show forest plot | 1 | 61 | Risk Ratio (M‐H, Fixed, 95% CI) | 1.09 [0.48, 2.45] |
| 19 Neonatal jaundice (hyperbilirubinaemia) Show forest plot | 1 | 61 | Risk Ratio (M‐H, Fixed, 95% CI) | 1.16 [0.40, 3.40] |
| 20 Cord IGF‐1 Show forest plot | 1 | 61 | Mean Difference (IV, Fixed, 95% CI) | 1.30 [‐0.70, 3.30] |
| 21 Neonatal glucose at age 1 hour (not pre‐specified) Show forest plot | 1 | 61 | Mean Difference (IV, Fixed, 95% CI) | ‐0.20 [‐0.88, 0.48] |
| 22 Transient tachypnea (not pre‐specified) Show forest plot | 1 | 61 | Risk Ratio (M‐H, Fixed, 95% CI) | 2.58 [0.76, 8.81] |
| 23 Neonatal intensive care admissions Show forest plot | 1 | 59 | Risk Ratio (M‐H, Fixed, 95% CI) | 1.04 [0.62, 1.74] |
| Outcome or subgroup title | No. of studies | No. of participants | Statistical method | Effect size |
| 1 Caesarean section Show forest plot | 1 | 32 | Risk Ratio (M‐H, Fixed, 95% CI) | 0.96 [0.62, 1.48] |
| 2 Neonatal morbidity composite Show forest plot | 1 | 32 | Risk Ratio (M‐H, Fixed, 95% CI) | 1.18 [0.53, 2.62] |
| 3 Gestational age at birth Show forest plot | 3 | 84 | Mean Difference (IV, Fixed, 95% CI) | 0.24 [‐0.39, 0.88] |
| 4 Use of additional insulin therapy Show forest plot | 1 | 32 | Risk Ratio (M‐H, Fixed, 95% CI) | 1.0 [0.89, 1.12] |
| 5 Insulin requirement at end of study Show forest plot | 1 | 20 | Mean Difference (IV, Fixed, 95% CI) | 18.4 [12.88, 23.92] |
| 6 Glycaemic control ‐ Maternal fasting blood glucose: before breakfast Show forest plot | 1 | 20 | Mean Difference (IV, Fixed, 95% CI) | ‐1.0 [‐1.22, ‐0.78] |
| 7 Glycaemic control ‐ Maternal fasting blood glucose: before lunch Show forest plot | 1 | 20 | Mean Difference (IV, Fixed, 95% CI) | ‐1.10 [‐1.32, ‐0.88] |
| 8 Glycaemic control ‐ Maternal HbA1c Show forest plot | 3 | 82 | Mean Difference (IV, Random, 95% CI) | ‐0.17 [‐0.82, 0.48] |
| 9 Glycaemic control ‐ Maternal post‐prandial blood glucose Show forest plot | 2 | 50 | Mean Difference (IV, Random, 95% CI) | ‐0.80 [‐1.67, 0.08] |
| 10 Weight gain during pregnancy [kg] Show forest plot | 1 | 32 | Mean Difference (IV, Fixed, 95% CI) | ‐0.70 [‐4.95, 3.55] |
| 11 Macrosomia Show forest plot | 1 | 32 | Risk Ratio (M‐H, Fixed, 95% CI) | 1.18 [0.31, 4.43] |
| 12 Birthweight Show forest plot | 1 | 32 | Mean Difference (IV, Fixed, 95% CI) | ‐0.16 [‐0.64, 0.32] |
| Outcome or subgroup title | No. of studies | No. of participants | Statistical method | Effect size |
| 1 Caesarean section Show forest plot | 1 | 25 | Risk Ratio (M‐H, Fixed, 95% CI) | 0.77 [0.33, 1.79] |
| 2 Weight gain during pregnancy Show forest plot | 1 | 25 | Mean Difference (IV, Fixed, 95% CI) | 0.5 [‐1.82, 2.82] |
| 3 Insulin dosage, 3rd trimester (IU/kg/day) Show forest plot | 1 | 25 | Mean Difference (IV, Fixed, 95% CI) | ‐0.03 [‐1.30, 1.24] |
| 4 Glycaemic control ‐ Maternal blood glucose (1st trimester) Show forest plot | 1 | 25 | Mean Difference (IV, Fixed, 95% CI) | ‐0.5 [‐2.70, 1.70] |
| 5 Glycaemic control ‐ Maternal blood glucose (3rd trimester) Show forest plot | 1 | 25 | Mean Difference (IV, Fixed, 95% CI) | ‐0.14 [‐2.00, 1.72] |
| 6 Glycaemic control ‐ Maternal HbA1c (1st trimester) Show forest plot | 1 | 25 | Mean Difference (IV, Fixed, 95% CI) | ‐0.30 [‐1.13, 0.53] |
| 7 Glycaemic control ‐ Maternal HbA1c (3rd trimester) Show forest plot | 1 | 25 | Mean Difference (IV, Fixed, 95% CI) | ‐0.09 [‐0.69, 0.51] |
| 8 Maternal hypoglycemia Show forest plot | 1 | 25 | Risk Ratio (M‐H, Fixed, 95% CI) | 0.54 [0.06, 5.24] |
| 9 Diabetic ketoacidosis (not pre‐specified) Show forest plot | 1 | 25 | Risk Ratio (M‐H, Fixed, 95% CI) | 0.36 [0.02, 8.05] |
| 10 Preterm birth < 37 weeks Show forest plot | 1 | 25 | Risk Ratio (M‐H, Fixed, 95% CI) | 1.08 [0.08, 15.46] |
| 11 Macrosomia Show forest plot | 1 | 25 | Risk Ratio (M‐H, Fixed, 95% CI) | 1.08 [0.08, 15.46] |
| 12 Neonatal hypoglycaemia Show forest plot | 1 | 25 | Risk Ratio (M‐H, Fixed, 95% CI) | 0.0 [0.0, 0.0] |