妊娠前已有糖尿病的妇女在孕期的血糖监测技术
Referencias
References to studies included in this review
References to studies excluded from this review
References to ongoing studies
Additional references
References to other published versions of this review
Characteristics of studies
Characteristics of included studies [ordered by study ID]
| Methods | Quasi‐randomised trial. Women were sequentially assigned to telemedicine and control groups (not randomised). Period of study: not reported. | |
| Participants | 88 women with gestational diabetes in the telemedicine group and 115 in the control group; Inclusion criteria: pregnant women with type 1 diabetes (enrolled in the study at their first visit after conception. Women with gestational diabetes included after a week from the diagnosis of gestational diabetes. Exclusion criteria: not described. | |
| Interventions | Intervention: automated telemedicine monitoring. Control: conventional system. | |
| Outcomes | Outcomes used in this review
| |
| Notes | Setting: 12 diabetes clinics. Country: Italy. Funding: not mentioned. Declarations of interest: not reported. Comments: data for women with gestational diabetes and type 1 diabetes are presented separately. | |
| Risk of bias | ||
| Bias | Authors' judgement | Support for judgement |
| Random sequence generation (selection bias) | High risk | Quote: “Women were sequentially assigned to two groups: one patient was followed up using the telemedicine approach and the next using the conventional approach (usual care).” |
| Allocation concealment (selection bias) | High risk | No attempt was made to conceal allocation. |
| Blinding of participants and personnel (performance bias) | Low risk | No attempt was made to blind women or personnel. Women were aware of whether they were being monitored using telemedicine or usual care. However, the outcomes were measured objectively and would not have been influenced by blinding or not blinding. |
| Blinding of outcome assessment (detection bias) | Low risk | No blinding of outcome assessment. However, all outcomes were objectively measured. |
| Incomplete outcome data (attrition bias) | High risk | 4/36 women with type 1 diabetes and 37/240 women with gestational diabetes were excluded because they did not complete questionnaires at the end of the study. It is unclear whether these were women with type 1 diabetes or gestational diabetes. |
| Selective reporting (reporting bias) | Unclear risk | This study was assessed from a published report, without the study protocol. The main outcomes were reported separately for type 1 diabetes and GDM, however some outcomes were not reported separately or were only reported in the text. |
| Other bias | High risk | The study did not use an intention‐to‐treat analysis. There is no sample size calculation, or information on whether groups were comparable at baseline. Women with type 1 diabetes only make up a small part of the whole study (32 out of 235 women). |
| Methods | Randomised, parallel‐group, open‐label, 2‐armed, active controlled trial. Period of study: not mentioned. | |
| Participants | Number randomised: 20. Eligible were type 1 diabetes mellitus (IDDM) pregnant patients attending the Diabetes Unit specialising in the treatment of diabetes in pregnancy during the period of study. Inclusion criteria: type 1 DM pregnant patients. Exclusion criteria: not mentioned in the text. | |
| Interventions | Intervention: DIANET system ‐ continuous automated monitoring system using a telemedicine system ‐ patient unit, diabetes workstation and the communication link (n = 10). Control: conventional monitoring ‐ performed 3 or more tests of blood glucose per day using BM20‐800 strips (n = 10). | |
| Outcomes | Outcomes used in this review
| |
| Notes | Setting: Diabetes Unit specialising in the treatment of diabetes in pregnancy. Country: Italy. Funding: not mentioned. Declarations of interest: not reported. Comments
| |
| Risk of bias | ||
| Bias | Authors' judgement | Support for judgement |
| Random sequence generation (selection bias) | Unclear risk | Quote from report ‐ "Patients were consecutively chosen by 1 of the investigators. Stratified block randomisation was used to divide patients into 2 groups at baseline." The patients were randomly assigned to a control or DIANET group. Comment: methods of sequence allocation not stated. |
| Allocation concealment (selection bias) | Unclear risk | Comment: not mentioned. |
| Blinding of participants and personnel (performance bias) | Low risk | Comment: no blinding of participants and personnel. However, this may not affect the results as all outcomes were objectively measured. |
| Blinding of outcome assessment (detection bias) | Low risk | Comment: no blinding of outcome assessment. However, all outcomes were objectively measured. |
| Incomplete outcome data (attrition bias) | Low risk | Comment: reported results of all participants (n = 20). |
| Selective reporting (reporting bias) | Low risk | As reported in the article all outcomes listed have been mentioned. |
| Other bias | Low risk | No obvious risk to other bias. |
| Methods | Multi‐centre, parallel randomised controlled trial – open‐label. They ran 2 trials in parallel for pregnant participants and for participants planning a pregnancy. Period of study: 25 March 2013 ‐ 22 March 2016. We report the results for pregnant participants. | |
| Participants | Number randomised: 325 (215 pregnant, 110 planning pregnancy). Inclusion criteria: women aged 18‐40 years, with type 1 diabetes for a minimum of 12 months, receiving intensive insulin therapy via multiple daily injections or an insulin pump, who were pregnant or planning pregnancy. Exclusion criteria: regular CGM users and women with severe nephropathy or medical conditions such as psychiatric illness requiring hospitalisation. Women using automatic insulin delivery options, such as low glucose suspend pumps, were not excluded. | |
| Interventions | Intervention: real‐time CGM in addition to capillary glucose monitoring. CGM system was aGuardian REAL‐Time or MiniMed Minilink system, both Medtronic, Northridge CA. Participants were trained to use the study devices and instructed to use them daily by local diabetes or antenatal clinic teams. CGM users were advised to verify the accuracy of CGM measurements using their capillary glucose meter before insulin dose adjustment, as per the regulatory labelling instructions (n = 108). Control: standard ‐ capillary glucose monitoring alone (home glucose monitoring). Participants in the control group continued their usual method of capillary glucose monitoring. Participants in both groups were advised to test capillary blood glucose levels at least 7 times daily (before and 1‐2 hours after meals and before bed) and given written instructions for how to use capillary or CGM measures for insulin dose adjustment, customised for methods of insulin delivery. Both groups had the same target glucose range of 3.5 to 7.8 mmol/L and same target HbA1c levels of no higher than 6.5% (48 mmol/mol) during pregnancy (n = 107). | |
| Outcomes | Outcomes used in this review
| |
| Notes | Setting: 31 hospitals in Canada, England, Scotland, Spain, Italy, Ireland and the USA. Country: Canada. Funding: the trial was funded by Juvenile Diabetes Research Foundation (JDRF) grants #17‐2011‐533, and grants under the JDRF Canadian Clinical Trial Network, a public‐private partnership including JDRF and FedDev Ontario and supported by JDRF #80‐2010‐585. Metronic supplied the CGM sensors and CGM systems at reduced cost. HRM conducts independent research supported by the National Institute for Health Research (Career Development Fellowship, CDF‐2013‐06‐035), and is supported by Tommy’s charity. The funders had no role in the trial design, data collection, data analysis, or data interpretation. Declarations of interest: 8 authors report grants from the Juvenile Diabetes Research Foundation during the conduct of the study. Two authors report personal fees from Novo Nordisk, Roche and Medtronic, outside the submitted work. 1 author reports personal fees from Abbott Diabetes Care and Medtronic (MiniMed Academia), outside the submitted work. 1 author sits on the Medtronic European Scientific Advisory Board. All remaining authors declare no completing interests. Comments
| |
| Risk of bias | ||
| Bias | Authors' judgement | Support for judgement |
| Random sequence generation (selection bias) | Low risk | Treatments allocated by a web‐based system using a computer‐generated randomisation list with permuted block sizes and stratified by method of insulin delivery (pump or multiple injections) and baseline HbA1c (< 7.5% vs ≥ 7.5% or 58 mmol/mol for the pregnancy trial). |
| Allocation concealment (selection bias) | Low risk | Randomisaton schedule created by a programming manager, encrypted, and maintained in a secure database – the co‐ordinating team and investigators had no access. |
| Blinding of participants and personnel (performance bias) | Low risk | Used masked sensors – for control group – so suggests blinding and also HbA1c measures done at a central laboratory and were unavailable to participants and healthcare teams during the trial. |
| Blinding of outcome assessment (detection bias) | Low risk | All HbA1c measures done at a central laboratory. Samples were shipped after delivery and collection of cord blood and were unavailable to participants and healthcare teams during the trial. |
| Incomplete outcome data (attrition bias) | Low risk | Authors report that about 20% data were missing, lost to follow‐up. For primary outcome – change in HbA1c – 82% (89/108) and 79% (84/107) included in analysis from CGM and home monitoring groups. Also stated that "For the primary outcome, the patterns of change were similar between analyses of imputed and available HbA1c data". There is a study flow diagram and missing data appear balanced across groups. |
| Selective reporting (reporting bias) | Low risk | Cross‐checked the protocol with main published report and methods section – also checked Appendices in supplementary file – most of the outcomes appear to have been reported. |
| Other bias | Low risk | Groups balanced at baseline – differences noted in smoking, automated insulin delivery option, hypertension, severe hypoglycaemia in past year or during early pregnancy pre‐randomisation – but report states "any minor imbalances in baseline characteristics between CGM and control group participants were within the expected bounds for random allocation". |
| Methods | Randomised, parallel‐group, open‐label, 2‐armed, active controlled trial. Period of study: 1 October 1979 ‐ 1 October 1982. | |
| Participants | Number randomised: 100. Eligible were type 1 diabetes mellitus (IDDM) and type 2 diabetes mellitus (NIDDM) pregnant patients attending the from 5 hospitals in Stockholm during the period of study. Inclusion criteria: patients with a diagnosis of diabetes, either insulin‐dependent or non‐insulin‐dependent prior to pregnancy. Exclusion criteria: not mentioned in text. | |
| Interventions | Intervention: patients self‐monitored their blood glucose at home from the 32nd week until the 36th week of gestation. Weekly hospital visit from 32‐36 weeks and then hospitalised during the 37th week until delivery (n = 54). Control: patients were hospitalised from 32nd week until delivery (n = 46). | |
| Outcomes | Outcomes used in this review
| |
| Notes | Setting: 5 hospitals in Stockholm. Country: Sweden. Funding: Expressens Perinatal forskningsfond, AIImanna Barnbordshusets Minnesfond, Svenska Diabetesstiftelsen, Nordisk Insulinfond, Swedish Medical Research Council (Project No. 3787), and Tielman's Fund for Pediatric Research. Declarations of interest: not reported. Comments
| |
| Risk of bias | ||
| Bias | Authors' judgement | Support for judgement |
| Random sequence generation (selection bias) | Unclear risk | Comment: not mentioned. |
| Allocation concealment (selection bias) | Unclear risk | Comment: not mentioned. |
| Blinding of participants and personnel (performance bias) | Low risk | Comment: no blinding of participants and personnel. However, this may not affect the results as all outcomes were objectively measured. |
| Blinding of outcome assessment (detection bias) | Low risk | Comment: no blinding of outcome assessment. Objective measurements used. |
| Incomplete outcome data (attrition bias) | High risk | Comment: 1 excluded for severe drug addiction, 8 spontaneous abortions and 1 mother died. |
| Selective reporting (reporting bias) | Low risk | No obvious risk to selective reporting. |
| Other bias | Low risk | No obvious risk to other bias. |
| Methods | Randomised, parallel‐group, open‐label, 2‐armed, active controlled trial. Period of study: not mentioned. | |
| Participants | Number randomised: 61 Eligible were type 1 diabetes mellitus (IDDM) pregnant patients attending or referred to the Regional Joint Metabolic/Antenatal Clinic at the Royal Maternity Hospital, Belfast during the period of study. Inclusion criteria: type 1 DM pregnant women at 16 weeks' gestation. Exclusion criteria: women without results due to reasons such as: stillbirth, abortions, major congenital abnormalities. | |
| Interventions | Intervention: pre‐prandial glucose monitoring (n = 31). Control: post‐prandial glucose monitoring (n = 30). | |
| Outcomes | Outcomes used in this review
| |
| Notes | Setting: Regional Joint Metabolic/Antenatal Clinic at the Royal Maternity Hospital, Belfast. Country: UK. Funding: Department of Health and Social Sevices, Northern lreland, the Northern Ireland Mother and Baby Appeal, the Metabolic Unit Research Fund, Royal Victoria Hospital, Belfast, the Royal Maternity Hospital, Royal Victoria Hospital, Belfast, and the Irish Perinatal Society. Declarations of interest: not reported. Comments
| |
| Risk of bias | ||
| Bias | Authors' judgement | Support for judgement |
| Random sequence generation (selection bias) | Unclear risk | Quote ‐ "Women were randomly assigned at 16 weeks' gestation to 1 of 2 blood glucose monitoring protocols". Comment: method not mentioned. |
| Allocation concealment (selection bias) | Low risk | Quote ‐ "allocations were via a sealed envelope system, which the patient selected from a box at the clinic visit". |
| Blinding of participants and personnel (performance bias) | Low risk | Comment: no blinding of participants and personnel. |
| Blinding of outcome assessment (detection bias) | Low risk | Comment: no blinding of outcome assessment. However, all outcomes were objectively measured. |
| Incomplete outcome data (attrition bias) | High risk | Quote ‐ "74 patients were recruited. 13 were excluded because they did not have results for analysis. This left 61 diabetic women (31 pre‐prandial and 30 post‐prandial monitoring) with results suitable for analysis". |
| Selective reporting (reporting bias) | Low risk | No obvious risk to selective reporting. |
| Other bias | Low risk | No obvious risk to other bias. |
| Methods | Randomised, parallel‐group, open‐label, 2‐armed, active controlled trial. Period of study: September 2003 to 2006. | |
| Participants | Number randomised: 71. Eligible were type 1 (IDDM) and type 2 (NIDDM) diabetes mellitus pregnant patients attending 2 secondary care diabetic antenatal clinics in the UK during the period of study. Inclusion criteria
Exclusion criteria
| |
| Interventions | Intervention: continuous glucose monitor which measured glucose in subcutaneous tissues every 10 seconds and an average value is stored every 5 minutes, providing up to 288 measurements per day (n = 38). The participants were required to wear the CGMS for 7 days at intervals of 4‐6 weeks. They were also advised to measure blood glucose at least 7 times a day. Control: intermittent self‐monitoring of glucose levels (n = 33), at least 7 times a day (standard care). | |
| Outcomes | Outcomes used in this review
| |
| Notes | Setting: secondary care diabetic antenatal clinics. Country: UK. Funding: this was an investigator initiated study funded by the Ipswich Diabetes Centre Charity Research Fund. HRM also received salary support from Diabetes UK. The study equipment (6 x CGMS Gold monitors and 300 sensors) was donated free of charge by Medtronic UK. The research was sponsored by Ipswich Hospital NHS Trust and was independent of all the study funders. Declarations of interest: 2 trial authors received honorariums for speaking at research symposiums sponsored by Medtronic in 2004 and 2005. Comments
| |
| Risk of bias | ||
| Bias | Authors' judgement | Support for judgement |
| Random sequence generation (selection bias) | Low risk | Quote ‐ "The study statistician used computer generated randomised numbers in blocks of 20". |
| Allocation concealment (selection bias) | Low risk | Quote ‐ "Concealed in sealed envelopes. Research nurses trained in accordance with good clinical practice guidelines provided the women with their group allocation". |
| Blinding of participants and personnel (performance bias) | Low risk | Comment: no blinding of participants and personnel. However, this may not affect the results as all outcomes were objectively measured. |
| Blinding of outcome assessment (detection bias) | Low risk | Comment: no blinding of outcome assessment. However, all outcomes were objectively measured. |
| Incomplete outcome data (attrition bias) | Low risk | Comment: intention‐to‐treat analysis was applied. |
| Selective reporting (reporting bias) | Low risk | All expected outcomes appear to have been reported. |
| Other bias | Low risk | No obvious risk to other bias. |
| Methods | Randomised, parallel‐group, open‐label, 2‐armed, active controlled trial. Period of study: not mentioned. | |
| Participants | Number randomised: 25. Eligible were type 1 diabetes mellitus (IDDM) pregnant patients attending the University Clinic of Endocrinology, Diabetes and Metabolic Disorders in Skopje during the period of study. Inclusion criteria
Exclusion criteria
| |
| Interventions | Intervention: constant CGM ‐ 24 hours/day (n = 12). Control: intermittent CGM ‐ 14 days per month (n = 13), measured blood glucose at least 6 times a day every second week (when not using the CGM). | |
| Outcomes | Outcomes used in this review
| |
| Notes | Setting: University Clinic of Endocrinology, Diabetes and Metabolic Disorders in Skopje. Country: Macedonia. Funding: Macedonion Ministry of Health and the Health Care Fund of Macedonia. Declarations of interest: the authors declared that they had no competing financial interests. Comments
| |
| Risk of bias | ||
| Bias | Authors' judgement | Support for judgement |
| Random sequence generation (selection bias) | Unclear risk | Quote ‐ "Patients were randomised into 2 groups". Comment: method not mentioned. |
| Allocation concealment (selection bias) | Unclear risk | Not mentioned. |
| Blinding of participants and personnel (performance bias) | Low risk | Comment: no blinding of participants and personnel. However, this may not affect the results as all outcomes were objectively measured. |
| Blinding of outcome assessment (detection bias) | Low risk | Comment: no blinding of outcome assessment. However, all outcomes were objectively measured. |
| Incomplete outcome data (attrition bias) | Low risk | Intention‐to‐treat analysis. |
| Selective reporting (reporting bias) | Low risk | All expected outcomes reported. |
| Other bias | Low risk | No obvious risk to other bias. |
| Methods | Randomised, parallel‐group, open‐label, 2‐armed, active controlled trial. Period of study: 15 February 2009 to 15 February 2011. | |
| Participants | Number randomised: 154. Eligible were 123 type 1 (IDDM) and 31 type 2 (NIDDM) pregnant patients referred to the Centre for Pregnant Women with Diabetes, Rigshospitalet, before 14 completed gestational weeks. Inclusion criteria
Exclusion criteria
| |
| Interventions | Intervention: real time CGM for 6 days at pregnancy visits during 8, 12, 21, 27 and 33 weeks, in addition to routine pregnancy care. Control: routine pregnancy care with self‐monitored plasma glucose measurements of 7 times daily. | |
| Outcomes | Outcomes used in this review
| |
| Notes | Setting: Centre for Pregnant women with Diabetes, Rigshospitalet. Country: Denmark. Funding: 1 of the authors received financial support from the European Foundation of the Study of Diabetes and LifeScan, Rigshopitalet's Research Foundation, the Capital Region of Denmark, the Medical Facuty Foundation of Copenhagen Univeristy, Aase and Ejnar Danielsen Foundation, and Master Joiner Sophus Jacobsen and his wife Astrid Jacobsens' Foundation. 1 author holds stocks in Novo Nordisk. 1 author received financial support from Novo Nordisk Foundation. The real‐time CGM monitors and links were supplied, and glucose sensors were offered at a reduced price by Medtronic. Declarations of interest: the authors declared no other potential conflicts of interest, other than those reported under 'funding'. interests. Comments
| |
| Risk of bias | ||
| Bias | Authors' judgement | Support for judgement |
| Random sequence generation (selection bias) | Low risk | Quote ‐ "a computer generated randomization program was used". |
| Allocation concealment (selection bias) | Low risk | Quote ‐ "..treatment allocation was properly concealed using automated telephone allocation service (Paravox) provided by an independent organization". |
| Blinding of participants and personnel (performance bias) | Low risk | Comment: no blinding of participants and personnel. However, this may not affect the results as all outcomes were objectively measured. |
| Blinding of outcome assessment (detection bias) | Low risk | Comment: no blinding of outcome assessment. However, all outcomes were objectively measured. |
| Incomplete outcome data (attrition bias) | Low risk | Quote ‐ "Intention‐to‐treat analysis was carried out". |
| Selective reporting (reporting bias) | Low risk | All expected outcomes reported. |
| Other bias | Low risk | No obvious risk to other bias. |
| Methods | Randomised, parallel‐group, open‐label, 2‐armed, active controlled trial. Period of study: not mentioned. | |
| Participants | Number randomised: 13. Eligible were type 1 (IDDM) diabetes mellitus pregnant patients attending King College's Hospital. Inclusion criteria: type 1 DM pregnant women at 30‐31 weeks' gestation. Exclusion criteria: not mentioned. | |
| Interventions | Intervention: 1) glucometer group (n = 7) measured blood glucose at home ‐ 7 times a day, twice weekly (before and after each main meal and before bedtime). Control: non‐meter group (n = 6) ‐ checked urine glucose 4 times daily, random blood glucose measured at the fortnightly clinic visits. | |
| Outcomes | Outcomes used in this review
| |
| Notes | Setting: King's College hospital. Country: UK. Funding: Medical Research Council Project Grant and the British Diabetic Association. Declarations of interest: not reported. Comments
| |
| Risk of bias | ||
| Bias | Authors' judgement | Support for judgement |
| Random sequence generation (selection bias) | Unclear risk | Comment: not mentioned. |
| Allocation concealment (selection bias) | Unclear risk | Comment: not mentioned. |
| Blinding of participants and personnel (performance bias) | Low risk | Comment: no blinding of participants and personnel. However, this may not affect the results as all outcomes were objectively measured. |
| Blinding of outcome assessment (detection bias) | Low risk | Comment: no blinding of outcome assessment. However, all outcomes were objectively measured. |
| Incomplete outcome data (attrition bias) | Low risk | Comment: iIntention‐to‐treat. |
| Selective reporting (reporting bias) | Low risk | All expected outcomes reported. |
| Other bias | Low risk | No obvious risk to other bias. |
| Methods | Randomised, parallel‐group, open‐label, 2‐armed, active controlled trial. Period of study: 1 February 1980 to 16 September 1981. | |
| Participants | Number randomised: 30. Eligible were type 1 diabetes mellitus (IDDM) pregnant patients attending the High Risk Obstetric Clinic at the University of Iowa Hospitals and Clinics during the period of study. Inclusion criteria: less than 20 weeks' gestation. Exclusion criteria: not mentioned. | |
| Interventions | Intervention: daily home glucose monitoring (n = 15) ‐ fasting, 2‐hour post‐prandial morning, afternoon and evening glucose values were measured daily. Control: weekly venipuncture (n = 15) ‐ fasting, 2 hours after breakfast, and 2 hours after lunch glucose levels measured on 1 day each week. | |
| Outcomes | Outcomes used in this review
| |
| Notes | Setting: High Risk Obstetric Clinic at the University of Iowa Hospitals and Clinics, Iowa. Country: USA. Funding: Research Fellowship from the Iowa Affiliate of the American Diabetes Association. Declarations of interest: not reported. Comments
| |
| Risk of bias | ||
| Bias | Authors' judgement | Support for judgement |
| Random sequence generation (selection bias) | Low risk | Quote ‐ "Patients were assigned to control and experimental groups using a random number sequence". |
| Allocation concealment (selection bias) | Unclear risk | Comment: not mentioned. |
| Blinding of participants and personnel (performance bias) | Low risk | Comment: no blinding of participants and personnel. However, this may not affect the results as all outcomes were objectively measured. |
| Blinding of outcome assessment (detection bias) | Low risk | Comment: no blinding of outcome assessment. However, all outcomes were objectively measured. |
| Incomplete outcome data (attrition bias) | High risk | 2 patients from each group had a first trimester spontaneous miscarriage and were excluded (2 out of 30 = 7%). |
| Selective reporting (reporting bias) | Low risk | All expected outcomes reported. |
| Other bias | Low risk | No obvious risk to other bias. |
| Methods | Nationwide multicentre, open‐label, parallel, pragmatic randomised controlled trial Period of study: July 2011 to September 2015 | |
| Participants | Number randomised: 300 pregnant women type 1 (n = 109), type 2 (n = 82), or with gestational diabetes (n = 109). Inclusion criteria: pregnant women with pre‐existing DM, at gestational age of before 16 weeks, or had GDM requiring insulin therapy before 30 weeks gestational age. Exclusion criteria: women with multiple pregnancies, under 18 years of age, or who had severe medical or psychological comorbidity | |
| Interventions | Intervention: CGM:iPro2 (Medtronic, Northridge, California) ‐ CGM in addition to standard care – self‐monitoring. Women allocated to CGM were instructed to use the device for 5‐7 days every 6 weeks and glucose profiles were obtained retrospectively, directly after each use and evaluated by the local endocrinologist. SMBG is required for calibration of CGM. Readings from the CGM are uploaded to a web‐based program; (n = 147 all women, 50 with T1DM, 40 T2DM). Control: standard treatment ‐ self‐monitoring of blood glucose only (n = 153 all women, 97 with type 2 diabetes). All participants in both intervention and control groups performed SMBG (4‐8 times/day: at least fasting, after every meal, at bedtime and, preferably before every meal). | |
| Outcomes | Outcomes used in this review
* outcome not reported separately for pre‐gestational and gestational diabetes | |
| Notes | Setting: 22 hospitals (university, teaching and non‐teaching in the Netherlands and 1 university hospital in Belgium. Country: the Netherlands. Funding: the trial was funded by ZonMw, The Dutch Organization for Health Research and Development 80‐82310‐97‐11157. The funder had no role in the study design, data collection, data analysis, data interpretation or writing of the report. Continuous glucose monitors were purchased at a discounted price from Medtronic® and they had no role in the study design, data collection, data analysis, data interpretation, or writing of the report. Declarations of interest: 1 of the trial authors received a research grant from ZonMW (the Netherlands Organization for Health Research and Development) and a second author received research grants from Abbott, Dexcom, Medtronic and Sensonics, and also received personal fees from Roche Diabetes Care and Sensonics. A third author is supported by an NHMRC Practitioner Fellowshop (GNT1082548) and reports consultancy for ObsEVa, Merck and Guerbet. All other authors declare no support from any organization or conflict of interest. Comments
| |
| Risk of bias | ||
| Bias | Authors' judgement | Support for judgement |
| Random sequence generation (selection bias) | Low risk | Web‐based computerised programme using 1:1 randomisation, stratified according to type of diabetes |
| Allocation concealment (selection bias) | Unclear risk | Not clearly described |
| Blinding of participants and personnel (performance bias) | Low risk | No blinding – but outcome measures mainly objective, so unlikely to be affected by lack of blinding |
| Blinding of outcome assessment (detection bias) | Low risk | No blinding – but outcome measures mainly objective, so unlikely to be affected by lack of blinding |
| Incomplete outcome data (attrition bias) | Unclear risk | High number of patients refused continued use of the CGM after the first or second time – a total of 66% of participants used CGM according to study protocol. However, there was a clear flow of participants in trial profile figure and reasons for dropouts, withdrawal provided. Conducted analyses on intention‐to‐treat and per‐protocol basis; 4 drop‐outs from CGM group and 6 from standard group so primary analyses were carried out according to the intention‐to‐treat principle – 143/147 included from the (CGM group) and 147/153 (standard group in the intention‐to‐treat analysis). Quite a high drop out rate – 95 women in the CGM group and 144 from the control group were included in the per‐protocol analyses. 48 discontinued intervention and 3 discontinued protocol for standard group leaving: 95/147 (66%) intervention group and 144/153 (98%) standard group |
| Selective reporting (reporting bias) | High risk | Maternal outcomes not reported
Neonatal outcomes not reported
The above were outcomes in the methods of the full report – but were not presented in the results section. The protocol also reported the following outcomes that were not reported in the results: mode of delivery, perinatal death, glucose variability, costs and resource utilisation |
| Other bias | Unclear risk | Baseline characteristics – groups were similar. Data not presented separately for pre‐gestational diabetes (type 1 and type 2 diabetes) and GDM patients for most of the outcomes. |
| Methods | Randomised, parallel‐group, open‐label, 2‐armed, active controlled trial. Period of study: not mentioned. | |
| Participants | Number randomised: 32. Eligible were type 1 diabetes mellitus (IDDM) pregnant patients attending the Clinic of Gastroenterology and Metabolic Diseases of the Medical Academy in Warsaw during the period of study. Inclusion criteria
Exclusion criteria
| |
| Interventions | Intervention: Telematic Management System (Central Clinical Unit and Patients' Teletransmission Modules) (n = 15) ‐ daily transfer of glycaemic data to diabetologist, at least 6 blood glucose measurements daily. Control: Standard care without Telematic Management System (n = 15), 6 blood glucose measurement daily and routine clinic visit every 3 weeks. | |
| Outcomes | Outcomes used in this review
| |
| Notes | Setting: Clinic of Gastroenterology and Metabolic Diseases of the Medical Academy in Warsaw. Country: Poland. Funding: supported by grants from the Polish State Committee for Scientific Research, the Bayer Diagnostic Division Warsaw, and the Polish Cellular Telephony Centertel. Declarations of interest: not reported. Comments
| |
| Risk of bias | ||
| Bias | Authors' judgement | Support for judgement |
| Random sequence generation (selection bias) | Unclear risk | Randomisation stated but method of sequence generation not clear. Quote: "Before randomization written consent was taken........". |
| Allocation concealment (selection bias) | High risk | Not possible as the same diabetologist was seeing both groups and knew to which group the participant belonged (control group could access the diabetologist by phone any time). |
| Blinding of participants and personnel (performance bias) | Low risk | Comment: no blinding of participants and personnel. However, this may not affect the results as all outcomes were objectively measured. |
| Blinding of outcome assessment (detection bias) | Low risk | Comment: no blinding of participants and personnel. However, all outcomes were objectively measured. |
| Incomplete outcome data (attrition bias) | Low risk | All participants accounted for and all data reported. |
| Selective reporting (reporting bias) | Low risk | No obvious risk to selective reporting. |
| Other bias | Low risk | No obvious risk to other bias. |
BMI: body mass index
CGM: continuous glucose monitoring
CGMS: continuous glucose monitoring system
DM: diabetes mellitus
GDM: gestational diabetes mellitus
IDDM: insulin‐dependent diabetes mellitus
IGF‐1: insulin‐like growth factor‐1
IQR: interquartile range
NIDDM: non insulin‐dependent diabetes mellitus
Characteristics of excluded studies [ordered by study ID]
| Study | Reason for exclusion |
| Cross‐over trial. Included women with GDM AND pre‐existing type 2 diabetes: results are not presented separately. | |
| Clinical trial registration ‐ for gestational diabetics only ‐ started in January 2012, expected to complete by April 2013. | |
| Abstract of an observational study of 8 type 1 diabetic pregnant women using CGMS. | |
| Clinical trial registration ‐ contacted author, no published data or report available. |
CGMS: continuous glucose monitoring system
GDM: gestational diabetes mellitus
Characteristics of ongoing studies [ordered by study ID]
| Trial name or title | Link H, NCT03504592. Utilizing mHealth to improve diabetes in an obstetric population. https://clinicaltrials.gov/ct2/show/NCT03504592 (first received 20 April 2018). |
| Methods | Randomised, parallel single‐centre trial, open‐label ‐ USA |
| Participants | Inclusion criteria: 18 to 60 years, pregnant, English speaking, diagnosed with diabetes during pregnancy or with known pre‐existing diabetes, have a smart phone |
| Interventions | MHealth technology ‐ participants to record blood glucose values with the assistance of a smart phone device compared to traditional care method of clinic |
| Outcomes | Primary: completeness and accuracy of blood glucose record Secondary: patient satisfaction, glucose values at goal, % change in HbA1C, clinic visits, unscheduled healthcare access episodes |
| Starting date | 1 May 2018 |
| Contact information | Heather Link, email: [email protected] |
| Notes | Estimated study completion ‐ June 2019 |
| Trial name or title | Managing diabetes during pregnancy in the wireless age: a RCT of glucose telemonitoring. https://clinicaltrials.gov/ct2/show/NCT01474525 (first received 18 November 2011). |
| Methods | Randomised, parallel single‐centre trial, open‐label ‐ Canada |
| Participants | Inclusion criteria: pregnant, diagnosed with gestational diabetes or type 2 diabetes, comfortable with instructions in English and be able to express themselves using simple phrases in English |
| Interventions | Home blood glucose telemonitoring system (system designed to send the measured blood glucose values directly to a hospital server, values recorded by glucometer are sent to a Blackberry cell phone, which services as the platform for data‐transmission to the central server) compared to usual care |
| Outcomes | Primary: mean blood glucose, based on the highest post‐prandial blood glucose reading each day, by trimester Secondary outcomes: mean fasting and post‐prandial blood glucose by trimester, percentage of values within recommended guidelines, adherence, onset of labour and mode of delivery Fetal outcomes: gestational age at delivery, birthweight, percentage of macrosomia, large‐for‐gestational age, small‐for‐gestational age, Apgar at 1 and 5 minutes Perinatal complications: premature, NICU admission, jaundice, shoulder dystocia, hypoglycaemia Provider usage: number of log‐ins onto the system, average amount of time spent on the system per week |
| Starting date | January 2010 |
| Contact information | Alexander G Logan, email: [email protected] |
| Notes | Estimated study completion ‐ March 2012 |
HbA1C: haemoglobin A1C (glycated haemoglobin)
NICU: neonatal intensive care unit
RCT: randomised controlled trial
Data and analyses
| Outcome or subgroup title | No. of studies | No. of participants | Statistical method | Effect size |
| 1 Hypertensive disorders of pregnancy Show forest plot | 2 | 384 | Risk Ratio (M‐H, Fixed, 95% CI) | 0.58 [0.39, 0.85] |
| Analysis 1.1  Comparison 1 Continuous glucose monitoring versus intermittent glucose monitoring, Outcome 1 Hypertensive disorders of pregnancy. | ||||
| 2 Caesarean section Show forest plot | 3 | 427 | Risk Ratio (M‐H, Random, 95% CI) | 0.94 [0.75, 1.18] |
| Analysis 1.2  Comparison 1 Continuous glucose monitoring versus intermittent glucose monitoring, Outcome 2 Caesarean section. | ||||
| 3 Large‐for‐gestational age Show forest plot | 3 | 421 | Risk Ratio (M‐H, Random, 95% CI) | 0.84 [0.57, 1.26] |
| Analysis 1.3  Comparison 1 Continuous glucose monitoring versus intermittent glucose monitoring, Outcome 3 Large‐for‐gestational age. | ||||
| 4 Perinatal mortality (stillbirth and neonatal mortality) Show forest plot | 1 | 71 | Risk Ratio (M‐H, Fixed, 95% CI) | 0.82 [0.05, 12.61] |
| Analysis 1.4  Comparison 1 Continuous glucose monitoring versus intermittent glucose monitoring, Outcome 4 Perinatal mortality (stillbirth and neonatal mortality). | ||||
| 5 Mortality or morbidity composite (pregnancy loss (miscarriage, stillbirth, and neonatal death); birth injury; neonatal glycaemia; hyperbilirubinaemia; respiratory distress; and high level neonatal care of more than 24 hours) Show forest plot | 1 | 200 | Risk Ratio (M‐H, Fixed, 95% CI) | 0.80 [0.61, 1.06] |
| Analysis 1.5  Comparison 1 Continuous glucose monitoring versus intermittent glucose monitoring, Outcome 5 Mortality or morbidity composite (pregnancy loss (miscarriage, stillbirth, and neonatal death); birth injury; neonatal glycaemia; hyperbilirubinaemia; respiratory distress; and high level neonatal care of more than 24 hours). | ||||
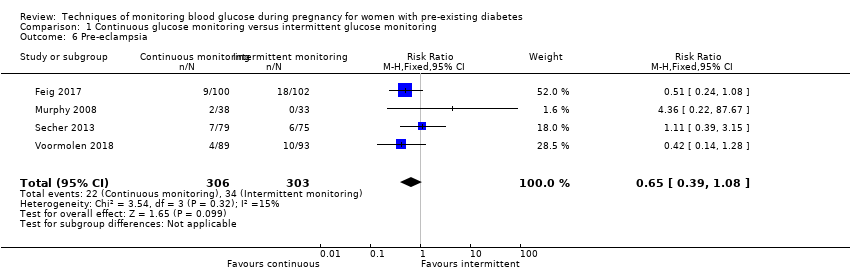
| 6 Pre‐eclampsia Show forest plot | 4 | 609 | Risk Ratio (M‐H, Fixed, 95% CI) | 0.65 [0.39, 1.08] |
| Analysis 1.6  Comparison 1 Continuous glucose monitoring versus intermittent glucose monitoring, Outcome 6 Pre‐eclampsia. | ||||
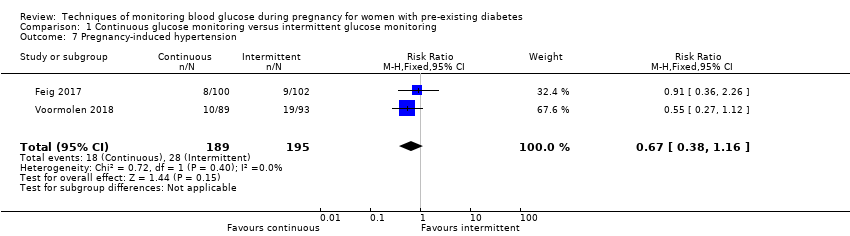
| 7 Pregnancy‐induced hypertension Show forest plot | 2 | 384 | Risk Ratio (M‐H, Fixed, 95% CI) | 0.67 [0.38, 1.16] |
| Analysis 1.7  Comparison 1 Continuous glucose monitoring versus intermittent glucose monitoring, Outcome 7 Pregnancy‐induced hypertension. | ||||
| 8 Behaviour changes associated with the intervention (range of score 10‐50 ‐ high score= greater fear of hypoglycaemia) Show forest plot | 1 | 214 | Mean Difference (IV, Fixed, 95% CI) | 1.00 [‐1.06, 3.06] |
| Analysis 1.8  Comparison 1 Continuous glucose monitoring versus intermittent glucose monitoring, Outcome 8 Behaviour changes associated with the intervention (range of score 10‐50 ‐ high score= greater fear of hypoglycaemia). | ||||
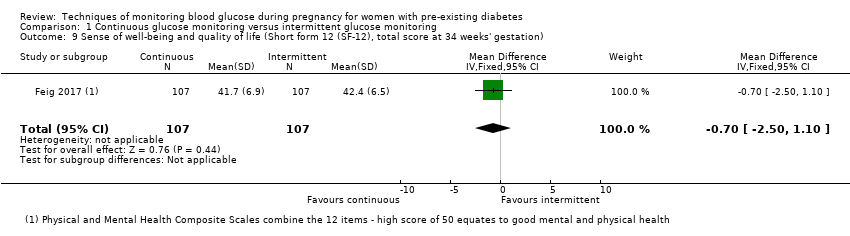
| 9 Sense of well‐being and quality of life (Short form 12 (SF‐12), total score at 34 weeks' gestation) Show forest plot | 1 | 214 | Mean Difference (IV, Fixed, 95% CI) | ‐0.70 [‐2.50, 1.10] |
| Analysis 1.9  Comparison 1 Continuous glucose monitoring versus intermittent glucose monitoring, Outcome 9 Sense of well‐being and quality of life (Short form 12 (SF‐12), total score at 34 weeks' gestation). | ||||
| 10 Sense of well‐being and quality of life (Problem areas in diabetes (PAID), total score at 34 weeks' gestation) Show forest plot | 1 | 214 | Mean Difference (IV, Fixed, 95% CI) | 0.80 [‐3.06, 4.66] |
| Analysis 1.10  Comparison 1 Continuous glucose monitoring versus intermittent glucose monitoring, Outcome 10 Sense of well‐being and quality of life (Problem areas in diabetes (PAID), total score at 34 weeks' gestation). | ||||
| 11 Sense of well‐being and quality of life (BGMSRQ, total score at 34 weeks' gestation) Show forest plot | 1 | 214 | Mean Difference (IV, Fixed, 95% CI) | 4.30 [0.73, 7.87] |
| Analysis 1.11  Comparison 1 Continuous glucose monitoring versus intermittent glucose monitoring, Outcome 11 Sense of well‐being and quality of life (BGMSRQ, total score at 34 weeks' gestation). | ||||
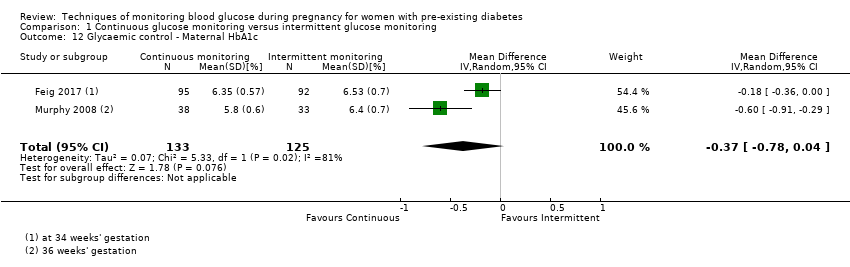
| 12 Glycaemic control ‐ Maternal HbA1c Show forest plot | 2 | 258 | Mean Difference (IV, Random, 95% CI) | ‐0.37 [‐0.78, 0.04] |
| Analysis 1.12  Comparison 1 Continuous glucose monitoring versus intermittent glucose monitoring, Outcome 12 Glycaemic control ‐ Maternal HbA1c. | ||||
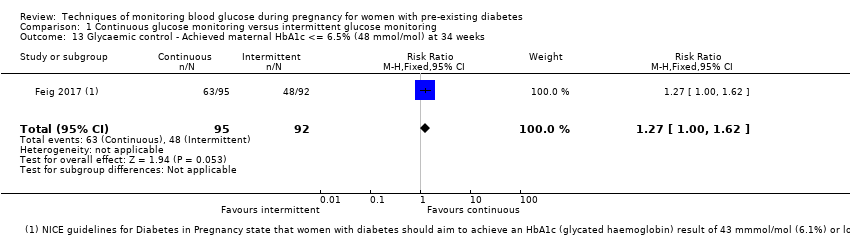
| 13 Glycaemic control ‐ Achieved maternal HbA1c <= 6.5% (48 mmol/mol) at 34 weeks Show forest plot | 1 | 187 | Risk Ratio (M‐H, Fixed, 95% CI) | 1.27 [1.00, 1.62] |
| Analysis 1.13  Comparison 1 Continuous glucose monitoring versus intermittent glucose monitoring, Outcome 13 Glycaemic control ‐ Achieved maternal HbA1c <= 6.5% (48 mmol/mol) at 34 weeks. | ||||
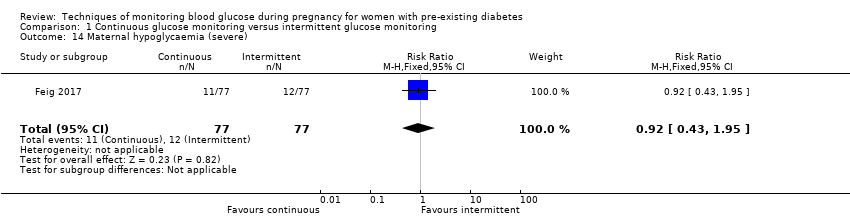
| 14 Maternal hypoglycaemia (severe) Show forest plot | 1 | 154 | Risk Ratio (M‐H, Fixed, 95% CI) | 0.92 [0.43, 1.95] |
| Analysis 1.14  Comparison 1 Continuous glucose monitoring versus intermittent glucose monitoring, Outcome 14 Maternal hypoglycaemia (severe). | ||||
| 15 Miscarriage Show forest plot | 3 | 439 | Risk Ratio (M‐H, Fixed, 95% CI) | 1.24 [0.47, 3.26] |
| Analysis 1.15  Comparison 1 Continuous glucose monitoring versus intermittent glucose monitoring, Outcome 15 Miscarriage. | ||||
| 16 Stillbirth Show forest plot | 1 | 211 | Risk Ratio (M‐H, Fixed, 95% CI) | 0.34 [0.01, 8.17] |
| Analysis 1.16  Comparison 1 Continuous glucose monitoring versus intermittent glucose monitoring, Outcome 16 Stillbirth. | ||||
| 17 Neonatal mortality Show forest plot | 2 | 256 | Risk Ratio (M‐H, Fixed, 95% CI) | 0.92 [0.13, 6.37] |
| Analysis 1.17  Comparison 1 Continuous glucose monitoring versus intermittent glucose monitoring, Outcome 17 Neonatal mortality. | ||||
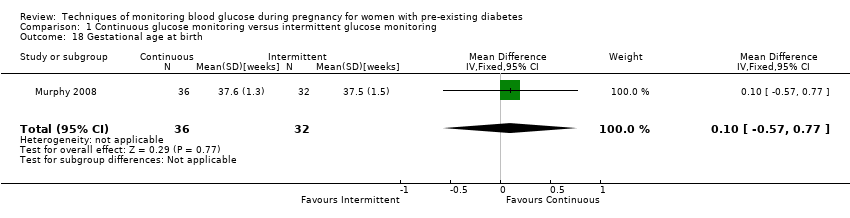
| 18 Gestational age at birth Show forest plot | 1 | 68 | Mean Difference (IV, Fixed, 95% CI) | 0.10 [‐0.57, 0.77] |
| Analysis 1.18  Comparison 1 Continuous glucose monitoring versus intermittent glucose monitoring, Outcome 18 Gestational age at birth. | ||||
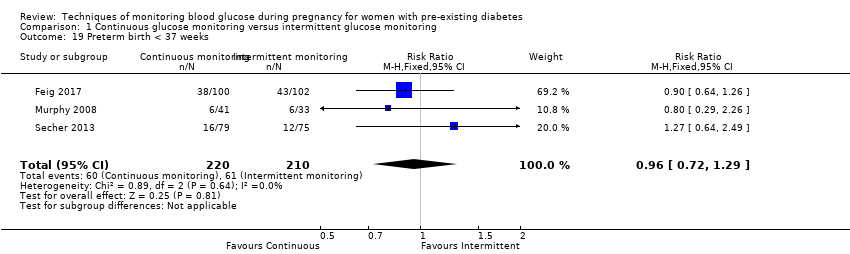
| 19 Preterm birth < 37 weeks Show forest plot | 3 | 430 | Risk Ratio (M‐H, Fixed, 95% CI) | 0.96 [0.72, 1.29] |
| Analysis 1.19  Comparison 1 Continuous glucose monitoring versus intermittent glucose monitoring, Outcome 19 Preterm birth < 37 weeks. | ||||
| 20 Preterm birth < 34 weeks Show forest plot | 1 | 211 | Risk Ratio (M‐H, Fixed, 95% CI) | 0.46 [0.17, 1.28] |
| Analysis 1.20  Comparison 1 Continuous glucose monitoring versus intermittent glucose monitoring, Outcome 20 Preterm birth < 34 weeks. | ||||
| 21 Macrosomia Show forest plot | 3 | 451 | Risk Ratio (M‐H, Random, 95% CI) | 0.84 [0.61, 1.17] |
| Analysis 1.21  Comparison 1 Continuous glucose monitoring versus intermittent glucose monitoring, Outcome 21 Macrosomia. | ||||
| 22 Birthweight Show forest plot | 2 | 267 | Mean Difference (IV, Random, 95% CI) | ‐0.13 [‐0.38, 0.12] |
| Analysis 1.22  Comparison 1 Continuous glucose monitoring versus intermittent glucose monitoring, Outcome 22 Birthweight. | ||||
| 23 Small‐for‐gestational age Show forest plot | 2 | 269 | Risk Ratio (M‐H, Fixed, 95% CI) | 2.40 [0.55, 10.51] |
| Analysis 1.23  Comparison 1 Continuous glucose monitoring versus intermittent glucose monitoring, Outcome 23 Small‐for‐gestational age. | ||||
| 24 Head circumference (cm) Show forest plot | 1 | 160 | Mean Difference (IV, Fixed, 95% CI) | ‐0.20 [‐0.79, 0.39] |
| Analysis 1.24  Comparison 1 Continuous glucose monitoring versus intermittent glucose monitoring, Outcome 24 Head circumference (cm). | ||||
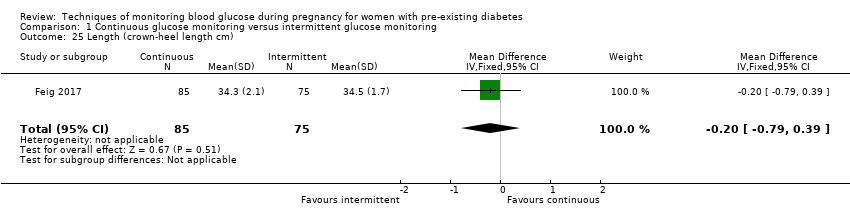
| 25 Length (crown‐heel length cm) Show forest plot | 1 | 160 | Mean Difference (IV, Fixed, 95% CI) | ‐0.20 [‐0.79, 0.39] |
| Analysis 1.25  Comparison 1 Continuous glucose monitoring versus intermittent glucose monitoring, Outcome 25 Length (crown‐heel length cm). | ||||
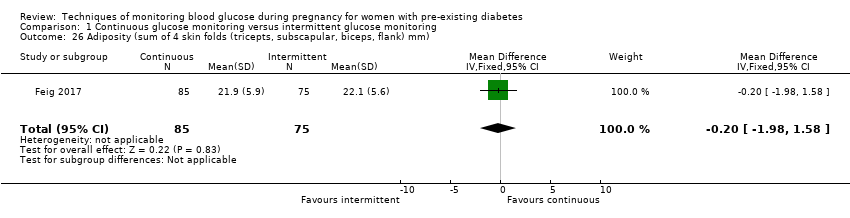
| 26 Adiposity (sum of 4 skin folds (tricepts, subscapular, biceps, flank) mm) Show forest plot | 1 | 160 | Mean Difference (IV, Fixed, 95% CI) | ‐0.20 [‐1.98, 1.58] |
| Analysis 1.26  Comparison 1 Continuous glucose monitoring versus intermittent glucose monitoring, Outcome 26 Adiposity (sum of 4 skin folds (tricepts, subscapular, biceps, flank) mm). | ||||
| 27 Shoulder dystocia Show forest plot | 1 | 200 | Risk Ratio (M‐H, Fixed, 95% CI) | 3.0 [0.12, 72.77] |
| Analysis 1.27  Comparison 1 Continuous glucose monitoring versus intermittent glucose monitoring, Outcome 27 Shoulder dystocia. | ||||
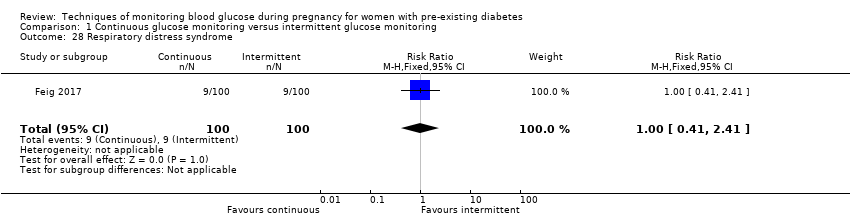
| 28 Respiratory distress syndrome Show forest plot | 1 | 200 | Risk Ratio (M‐H, Fixed, 95% CI) | 1.0 [0.41, 2.41] |
| Analysis 1.28  Comparison 1 Continuous glucose monitoring versus intermittent glucose monitoring, Outcome 28 Respiratory distress syndrome. | ||||
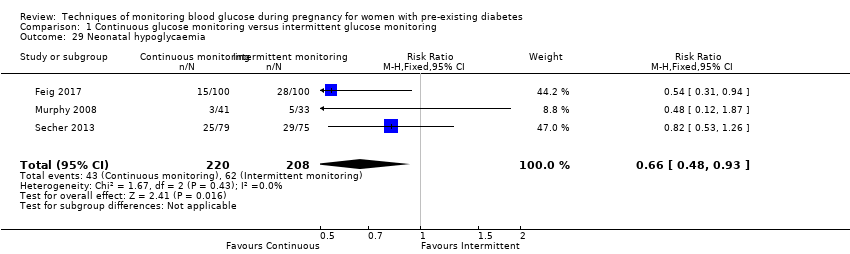
| 29 Neonatal hypoglycaemia Show forest plot | 3 | 428 | Risk Ratio (M‐H, Fixed, 95% CI) | 0.66 [0.48, 0.93] |
| Analysis 1.29  Comparison 1 Continuous glucose monitoring versus intermittent glucose monitoring, Outcome 29 Neonatal hypoglycaemia. | ||||
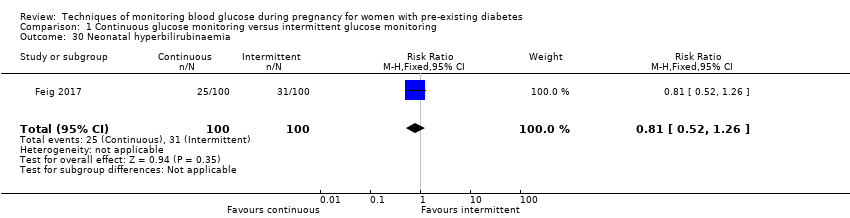
| 30 Neonatal hyperbilirubinaemia Show forest plot | 1 | 200 | Risk Ratio (M‐H, Fixed, 95% CI) | 0.81 [0.52, 1.26] |
| Analysis 1.30  Comparison 1 Continuous glucose monitoring versus intermittent glucose monitoring, Outcome 30 Neonatal hyperbilirubinaemia. | ||||
| 31 Relevant biomarker changes associated with the intervention (cord blood c‐peptide levels > 566 pmol/L) Show forest plot | 1 | 200 | Risk Ratio (M‐H, Fixed, 95% CI) | 0.95 [0.68, 1.33] |
| Analysis 1.31  Comparison 1 Continuous glucose monitoring versus intermittent glucose monitoring, Outcome 31 Relevant biomarker changes associated with the intervention (cord blood c‐peptide levels > 566 pmol/L). | ||||
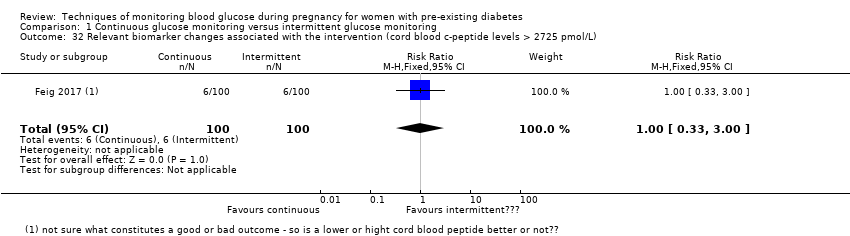
| 32 Relevant biomarker changes associated with the intervention (cord blood c‐peptide levels > 2725 pmol/L) Show forest plot | 1 | 200 | Risk Ratio (M‐H, Fixed, 95% CI) | 1.0 [0.33, 3.00] |
| Analysis 1.32  Comparison 1 Continuous glucose monitoring versus intermittent glucose monitoring, Outcome 32 Relevant biomarker changes associated with the intervention (cord blood c‐peptide levels > 2725 pmol/L). | ||||
| 33 Major and minor anomalies Show forest plot | 2 | 285 | Risk Ratio (M‐H, Fixed, 95% CI) | 0.71 [0.16, 3.13] |
| Analysis 1.33  Comparison 1 Continuous glucose monitoring versus intermittent glucose monitoring, Outcome 33 Major and minor anomalies. | ||||
| 34 Number of hospital admissions (mother) Show forest plot | 1 | 207 | Risk Ratio (M‐H, Fixed, 95% CI) | 1.25 [0.84, 1.85] |
| Analysis 1.34  Comparison 1 Continuous glucose monitoring versus intermittent glucose monitoring, Outcome 34 Number of hospital admissions (mother). | ||||
| 35 Neonatal intensive care unit admissions Show forest plot | 2 | 274 | Risk Ratio (M‐H, Random, 95% CI) | 0.76 [0.42, 1.35] |
| Analysis 1.35  Comparison 1 Continuous glucose monitoring versus intermittent glucose monitoring, Outcome 35 Neonatal intensive care unit admissions. | ||||
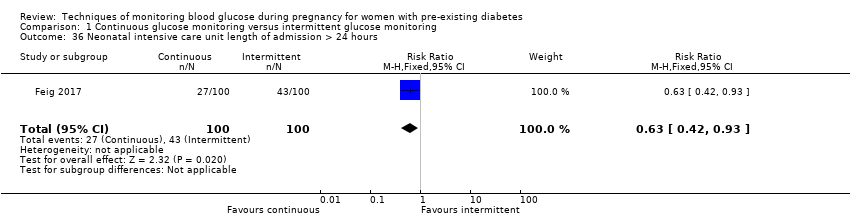
| 36 Neonatal intensive care unit length of admission > 24 hours Show forest plot | 1 | 200 | Risk Ratio (M‐H, Fixed, 95% CI) | 0.63 [0.42, 0.93] |
| Analysis 1.36  Comparison 1 Continuous glucose monitoring versus intermittent glucose monitoring, Outcome 36 Neonatal intensive care unit length of admission > 24 hours. | ||||
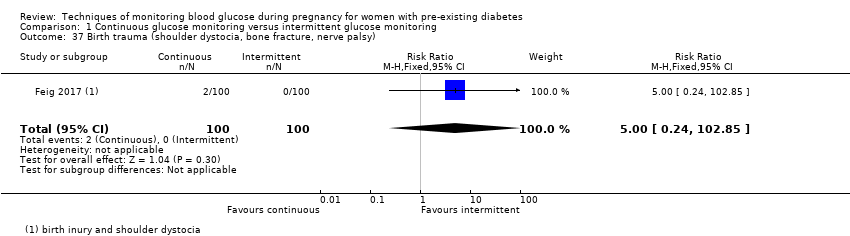
| 37 Birth trauma (shoulder dystocia, bone fracture, nerve palsy) Show forest plot | 1 | 200 | Risk Ratio (M‐H, Fixed, 95% CI) | 5.0 [0.24, 102.85] |
| Analysis 1.37  Comparison 1 Continuous glucose monitoring versus intermittent glucose monitoring, Outcome 37 Birth trauma (shoulder dystocia, bone fracture, nerve palsy). | ||||
| 38 Diabetic ketoacidosis (mother) Show forest plot | 1 | 207 | Risk Ratio (M‐H, Fixed, 95% CI) | 1.01 [0.14, 7.03] |
| Analysis 1.38  Comparison 1 Continuous glucose monitoring versus intermittent glucose monitoring, Outcome 38 Diabetic ketoacidosis (mother). | ||||
| Outcome or subgroup title | No. of studies | No. of participants | Statistical method | Effect size |
| 1 Caesarean section Show forest plot | 1 | 28 | Risk Ratio (M‐H, Fixed, 95% CI) | 0.78 [0.40, 1.49] |
| Analysis 2.1  Comparison 2 Self‐monitoring versus different type of self monitoring, Outcome 1 Caesarean section. | ||||
| 2 Perinatal mortality (stillbirth and neonatal mortality) Show forest plot | 1 | 28 | Risk Ratio (M‐H, Fixed, 95% CI) | 3.0 [0.13, 67.91] |
| Analysis 2.2  Comparison 2 Self‐monitoring versus different type of self monitoring, Outcome 2 Perinatal mortality (stillbirth and neonatal mortality). | ||||
| 3 Glycaemic control during/end of treatment (maternal post‐prandial blood glucose) Show forest plot | 1 | 13 | Mean Difference (IV, Fixed, 95% CI) | ‐0.70 [‐2.15, 0.75] |
| Analysis 2.3  Comparison 2 Self‐monitoring versus different type of self monitoring, Outcome 3 Glycaemic control during/end of treatment (maternal post‐prandial blood glucose). | ||||
| 4 Glycaemic control during/end of treatment (maternal HbA1c) Show forest plot | 1 | 28 | Mean Difference (IV, Fixed, 95% CI) | ‐0.10 [‐1.93, 1.73] |
| Analysis 2.4  Comparison 2 Self‐monitoring versus different type of self monitoring, Outcome 4 Glycaemic control during/end of treatment (maternal HbA1c). | ||||
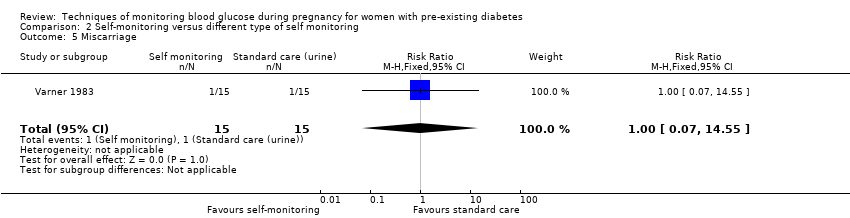
| 5 Miscarriage Show forest plot | 1 | 30 | Risk Ratio (M‐H, Fixed, 95% CI) | 1.0 [0.07, 14.55] |
| Analysis 2.5  Comparison 2 Self‐monitoring versus different type of self monitoring, Outcome 5 Miscarriage. | ||||
| 6 Neonatal mortality Show forest plot | 1 | 28 | Risk Ratio (M‐H, Fixed, 95% CI) | 3.0 [0.13, 67.91] |
| Analysis 2.6  Comparison 2 Self‐monitoring versus different type of self monitoring, Outcome 6 Neonatal mortality. | ||||
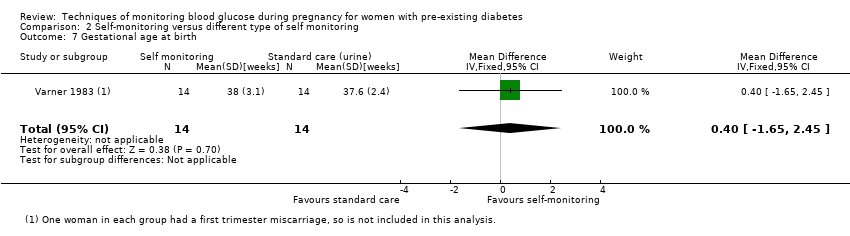
| 7 Gestational age at birth Show forest plot | 1 | 28 | Mean Difference (IV, Fixed, 95% CI) | 0.40 [‐1.65, 2.45] |
| Analysis 2.7  Comparison 2 Self‐monitoring versus different type of self monitoring, Outcome 7 Gestational age at birth. | ||||
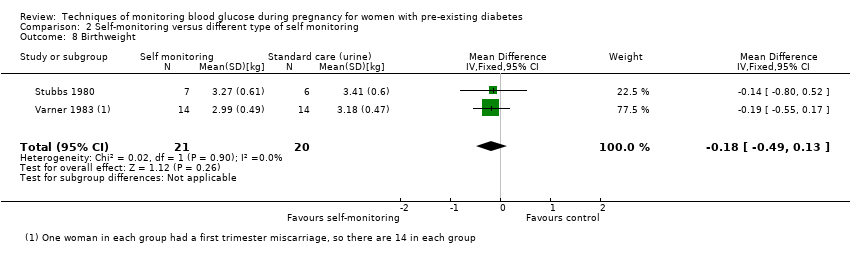
| 8 Birthweight Show forest plot | 2 | 41 | Mean Difference (IV, Fixed, 95% CI) | ‐0.18 [‐0.49, 0.13] |
| Analysis 2.8  Comparison 2 Self‐monitoring versus different type of self monitoring, Outcome 8 Birthweight. | ||||
| 9 Respiratory distress syndrome Show forest plot | 1 | 28 | Risk Ratio (M‐H, Fixed, 95% CI) | 3.0 [0.13, 67.91] |
| Analysis 2.9  Comparison 2 Self‐monitoring versus different type of self monitoring, Outcome 9 Respiratory distress syndrome. | ||||
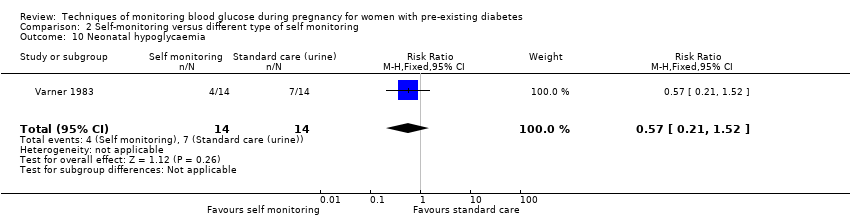
| 10 Neonatal hypoglycaemia Show forest plot | 1 | 28 | Risk Ratio (M‐H, Fixed, 95% CI) | 0.57 [0.21, 1.52] |
| Analysis 2.10  Comparison 2 Self‐monitoring versus different type of self monitoring, Outcome 10 Neonatal hypoglycaemia. | ||||
| 11 Neonatal jaundice (hyperbilirubinaemia) Show forest plot | 1 | 28 | Risk Ratio (M‐H, Fixed, 95% CI) | 0.56 [0.25, 1.24] |
| Analysis 2.11  Comparison 2 Self‐monitoring versus different type of self monitoring, Outcome 11 Neonatal jaundice (hyperbilirubinaemia). | ||||
| 12 Neonatal hypocalcaemia Show forest plot | 1 | 28 | Risk Ratio (M‐H, Fixed, 95% CI) | 1.0 [0.07, 14.45] |
| Analysis 2.12  Comparison 2 Self‐monitoring versus different type of self monitoring, Outcome 12 Neonatal hypocalcaemia. | ||||
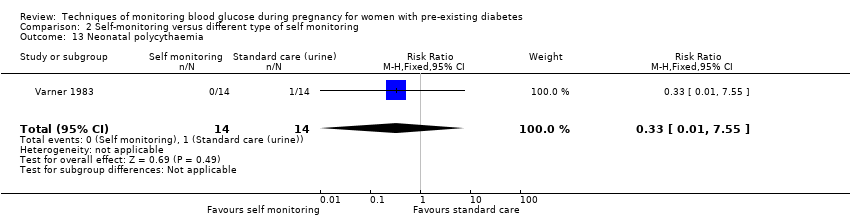
| 13 Neonatal polycythaemia Show forest plot | 1 | 28 | Risk Ratio (M‐H, Fixed, 95% CI) | 0.33 [0.01, 7.55] |
| Analysis 2.13  Comparison 2 Self‐monitoring versus different type of self monitoring, Outcome 13 Neonatal polycythaemia. | ||||
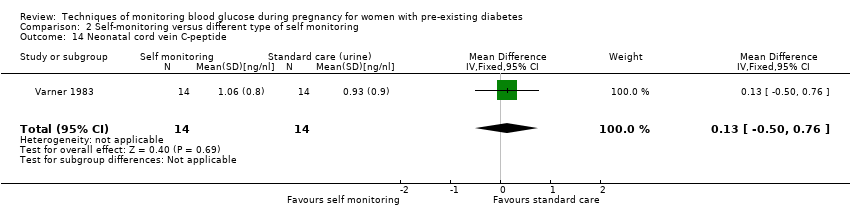
| 14 Neonatal cord vein C‐peptide Show forest plot | 1 | 28 | Mean Difference (IV, Fixed, 95% CI) | 0.13 [‐0.50, 0.76] |
| Analysis 2.14  Comparison 2 Self‐monitoring versus different type of self monitoring, Outcome 14 Neonatal cord vein C‐peptide. | ||||
| Outcome or subgroup title | No. of studies | No. of participants | Statistical method | Effect size |
| 1 Hypertensive disorders of pregnancy Show forest plot | 1 | 100 | Risk Ratio (M‐H, Fixed, 95% CI) | 1.19 [0.41, 3.51] |
| Analysis 3.1  Comparison 3 Self‐monitoring at home versus hospitalisation, Outcome 1 Hypertensive disorders of pregnancy. | ||||
| 2 Caesarean section Show forest plot | 1 | 100 | Risk Ratio (M‐H, Fixed, 95% CI) | 0.96 [0.65, 1.44] |
| Analysis 3.2  Comparison 3 Self‐monitoring at home versus hospitalisation, Outcome 2 Caesarean section. | ||||
| 3 Perinatal mortality (stillbirth and neonatal mortality) Show forest plot | 1 | 100 | Risk Ratio (M‐H, Fixed, 95% CI) | 0.85 [0.05, 13.24] |
| Analysis 3.3  Comparison 3 Self‐monitoring at home versus hospitalisation, Outcome 3 Perinatal mortality (stillbirth and neonatal mortality). | ||||
| 4 Pre‐eclampsia Show forest plot | 1 | 100 | Risk Ratio (M‐H, Fixed, 95% CI) | 4.26 [0.52, 35.16] |
| Analysis 3.4  Comparison 3 Self‐monitoring at home versus hospitalisation, Outcome 4 Pre‐eclampsia. | ||||
| 5 Pregnancy‐induced hypertension Show forest plot | 1 | 100 | Risk Ratio (M‐H, Fixed, 95% CI) | 0.43 [0.08, 2.22] |
| Analysis 3.5  Comparison 3 Self‐monitoring at home versus hospitalisation, Outcome 5 Pregnancy‐induced hypertension. | ||||
| 6 Placental abruption Show forest plot | 1 | 100 | Risk Ratio (M‐H, Fixed, 95% CI) | 1.70 [0.16, 18.19] |
| Analysis 3.6  Comparison 3 Self‐monitoring at home versus hospitalisation, Outcome 6 Placental abruption. | ||||
| 7 Preterm birth < 37 weeks Show forest plot | 1 | 100 | Risk Ratio (M‐H, Fixed, 95% CI) | 0.85 [0.45, 1.60] |
| Analysis 3.7  Comparison 3 Self‐monitoring at home versus hospitalisation, Outcome 7 Preterm birth < 37 weeks. | ||||
| 8 Respiratory distress syndrome Show forest plot | 1 | 100 | Risk Ratio (M‐H, Fixed, 95% CI) | 2.56 [0.28, 23.74] |
| Analysis 3.8  Comparison 3 Self‐monitoring at home versus hospitalisation, Outcome 8 Respiratory distress syndrome. | ||||
| 9 Neonatal hypoglycaemia Show forest plot | 1 | 100 | Risk Ratio (M‐H, Fixed, 95% CI) | 1.01 [0.50, 2.03] |
| Analysis 3.9  Comparison 3 Self‐monitoring at home versus hospitalisation, Outcome 9 Neonatal hypoglycaemia. | ||||
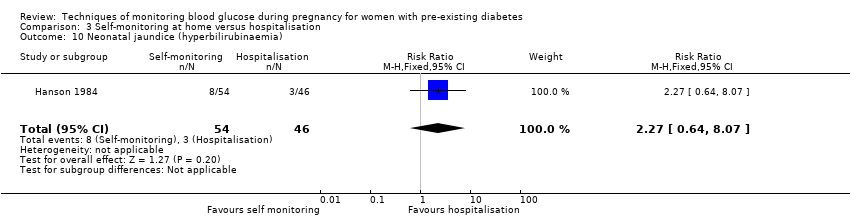
| 10 Neonatal jaundice (hyperbilirubinaemia) Show forest plot | 1 | 100 | Risk Ratio (M‐H, Fixed, 95% CI) | 2.27 [0.64, 8.07] |
| Analysis 3.10  Comparison 3 Self‐monitoring at home versus hospitalisation, Outcome 10 Neonatal jaundice (hyperbilirubinaemia). | ||||
| 11 Major anomalies Show forest plot | 1 | 102 | Risk Ratio (M‐H, Fixed, 95% CI) | 0.27 [0.03, 2.54] |
| Analysis 3.11  Comparison 3 Self‐monitoring at home versus hospitalisation, Outcome 11 Major anomalies. | ||||
| 12 Antenatal hospital admission Show forest plot | 1 | 100 | Risk Ratio (M‐H, Fixed, 95% CI) | 0.19 [0.11, 0.33] |
| Analysis 3.12  Comparison 3 Self‐monitoring at home versus hospitalisation, Outcome 12 Antenatal hospital admission. | ||||
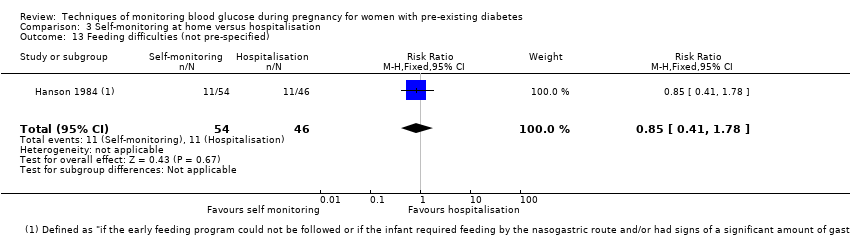
| 13 Feeding difficulties (not pre‐specified) Show forest plot | 1 | 100 | Risk Ratio (M‐H, Fixed, 95% CI) | 0.85 [0.41, 1.78] |
| Analysis 3.13  Comparison 3 Self‐monitoring at home versus hospitalisation, Outcome 13 Feeding difficulties (not pre‐specified). | ||||
| Outcome or subgroup title | No. of studies | No. of participants | Statistical method | Effect size |
| 1 Caesarean section Show forest plot | 1 | 61 | Risk Ratio (M‐H, Fixed, 95% CI) | 1.45 [0.92, 2.28] |
| Analysis 4.1  Comparison 4 Pre‐prandial versus post‐prandial glucose monitoring, Outcome 1 Caesarean section. | ||||
| 2 Large‐for‐gestational age Show forest plot | 1 | 61 | Risk Ratio (M‐H, Fixed, 95% CI) | 1.16 [0.73, 1.85] |
| Analysis 4.2  Comparison 4 Pre‐prandial versus post‐prandial glucose monitoring, Outcome 2 Large‐for‐gestational age. | ||||
| 3 Perinatal mortality (stillbirth and neonatal mortality) Show forest plot | 1 | 61 | Risk Ratio (M‐H, Fixed, 95% CI) | 2.91 [0.12, 68.66] |
| Analysis 4.3  Comparison 4 Pre‐prandial versus post‐prandial glucose monitoring, Outcome 3 Perinatal mortality (stillbirth and neonatal mortality). | ||||
| 4 Pre‐eclampsia Show forest plot | 1 | 58 | Risk Ratio (M‐H, Fixed, 95% CI) | 6.43 [0.82, 50.11] |
| Analysis 4.4  Comparison 4 Pre‐prandial versus post‐prandial glucose monitoring, Outcome 4 Pre‐eclampsia. | ||||
| 5 Weight gain during pregnancy Show forest plot | 1 | 61 | Mean Difference (IV, Fixed, 95% CI) | ‐0.90 [‐3.86, 2.06] |
| Analysis 4.5  Comparison 4 Pre‐prandial versus post‐prandial glucose monitoring, Outcome 5 Weight gain during pregnancy. | ||||
| 6 Insulin dose Show forest plot | 1 | 61 | Mean Difference (IV, Fixed, 95% CI) | ‐17.40 [‐43.41, 8.61] |
| Analysis 4.6  Comparison 4 Pre‐prandial versus post‐prandial glucose monitoring, Outcome 6 Insulin dose. | ||||
| 7 Glycaemic control ‐ Insulin dose Show forest plot | 1 | 61 | Mean Difference (IV, Fixed, 95% CI) | ‐0.20 [‐0.45, 0.05] |
| Analysis 4.7  Comparison 4 Pre‐prandial versus post‐prandial glucose monitoring, Outcome 7 Glycaemic control ‐ Insulin dose. | ||||
| 8 Glycaemic control ‐ HbA1c Show forest plot | 1 | 61 | Mean Difference (IV, Fixed, 95% CI) | 0.30 [‐0.08, 0.68] |
| Analysis 4.8  Comparison 4 Pre‐prandial versus post‐prandial glucose monitoring, Outcome 8 Glycaemic control ‐ HbA1c. | ||||
| 9 Stillbirth Show forest plot | 1 | 61 | Risk Ratio (M‐H, Fixed, 95% CI) | 2.91 [0.12, 68.66] |
| Analysis 4.9  Comparison 4 Pre‐prandial versus post‐prandial glucose monitoring, Outcome 9 Stillbirth. | ||||
| 10 Gestational age at birth Show forest plot | 1 | 61 | Mean Difference (IV, Fixed, 95% CI) | 0.20 [‐0.84, 1.24] |
| Analysis 4.10  Comparison 4 Pre‐prandial versus post‐prandial glucose monitoring, Outcome 10 Gestational age at birth. | ||||
| 11 Preterm birth < 37 weeks Show forest plot | 1 | 61 | Risk Ratio (M‐H, Fixed, 95% CI) | 1.33 [0.62, 2.84] |
| Analysis 4.11  Comparison 4 Pre‐prandial versus post‐prandial glucose monitoring, Outcome 11 Preterm birth < 37 weeks. | ||||
| 12 Macrosomia Show forest plot | 1 | 61 | Risk Ratio (M‐H, Fixed, 95% CI) | 2.18 [0.75, 6.32] |
| Analysis 4.12  Comparison 4 Pre‐prandial versus post‐prandial glucose monitoring, Outcome 12 Macrosomia. | ||||
| 13 Birthweight Show forest plot | 1 | 61 | Mean Difference (IV, Fixed, 95% CI) | 0.24 [‐0.10, 0.58] |
| Analysis 4.13  Comparison 4 Pre‐prandial versus post‐prandial glucose monitoring, Outcome 13 Birthweight. | ||||
| 14 Adiposity ‐ Subscapula skinfold thickness Show forest plot | 1 | 61 | Mean Difference (IV, Fixed, 95% CI) | 0.60 [‐0.18, 1.38] |
| Analysis 4.14  Comparison 4 Pre‐prandial versus post‐prandial glucose monitoring, Outcome 14 Adiposity ‐ Subscapula skinfold thickness. | ||||
| 15 Adiposity ‐ Triceps skinfold thickness Show forest plot | 1 | 61 | Mean Difference (IV, Fixed, 95% CI) | 0.60 [0.04, 1.16] |
| Analysis 4.15  Comparison 4 Pre‐prandial versus post‐prandial glucose monitoring, Outcome 15 Adiposity ‐ Triceps skinfold thickness. | ||||
| 16 Birth trauma (shoulder dystocia, bone fracture, nerve palsy) (not pre‐specified as a composite) Show forest plot | 1 | 61 | Risk Ratio (M‐H, Fixed, 95% CI) | 0.48 [0.05, 5.06] |
| Analysis 4.16  Comparison 4 Pre‐prandial versus post‐prandial glucose monitoring, Outcome 16 Birth trauma (shoulder dystocia, bone fracture, nerve palsy) (not pre‐specified as a composite). | ||||
| 17 Respiratory distress syndrome Show forest plot | 1 | 61 | Risk Ratio (M‐H, Fixed, 95% CI) | 0.97 [0.06, 14.78] |
| Analysis 4.17  Comparison 4 Pre‐prandial versus post‐prandial glucose monitoring, Outcome 17 Respiratory distress syndrome. | ||||
| 18 Neonatal hypoglycaemia Show forest plot | 1 | 61 | Risk Ratio (M‐H, Fixed, 95% CI) | 1.09 [0.48, 2.45] |
| Analysis 4.18  Comparison 4 Pre‐prandial versus post‐prandial glucose monitoring, Outcome 18 Neonatal hypoglycaemia. | ||||
| 19 Neonatal jaundice (hyperbilirubinaemia) Show forest plot | 1 | 61 | Risk Ratio (M‐H, Fixed, 95% CI) | 1.16 [0.40, 3.40] |
| Analysis 4.19  Comparison 4 Pre‐prandial versus post‐prandial glucose monitoring, Outcome 19 Neonatal jaundice (hyperbilirubinaemia). | ||||
| 20 Cord IGF‐1 Show forest plot | 1 | 61 | Mean Difference (IV, Fixed, 95% CI) | 1.30 [‐0.70, 3.30] |
| Analysis 4.20  Comparison 4 Pre‐prandial versus post‐prandial glucose monitoring, Outcome 20 Cord IGF‐1. | ||||
| 21 Neonatal glucose at age 1 hour (not pre‐specified) Show forest plot | 1 | 61 | Mean Difference (IV, Fixed, 95% CI) | ‐0.20 [‐0.88, 0.48] |
| Analysis 4.21  Comparison 4 Pre‐prandial versus post‐prandial glucose monitoring, Outcome 21 Neonatal glucose at age 1 hour (not pre‐specified). | ||||
| 22 Transient tachypnea (not pre‐specified) Show forest plot | 1 | 61 | Risk Ratio (M‐H, Fixed, 95% CI) | 2.58 [0.76, 8.81] |
| Analysis 4.22  Comparison 4 Pre‐prandial versus post‐prandial glucose monitoring, Outcome 22 Transient tachypnea (not pre‐specified). | ||||
| 23 Neonatal intensive care admissions Show forest plot | 1 | 59 | Risk Ratio (M‐H, Fixed, 95% CI) | 1.04 [0.62, 1.74] |
| Analysis 4.23  Comparison 4 Pre‐prandial versus post‐prandial glucose monitoring, Outcome 23 Neonatal intensive care admissions. | ||||
| Outcome or subgroup title | No. of studies | No. of participants | Statistical method | Effect size |
| 1 Caesarean section Show forest plot | 1 | 32 | Risk Ratio (M‐H, Fixed, 95% CI) | 0.96 [0.62, 1.48] |
| Analysis 5.1  Comparison 5 Automated telemedicine monitoring versus conventional, Outcome 1 Caesarean section. | ||||
| 2 Neonatal morbidity composite Show forest plot | 1 | 32 | Risk Ratio (M‐H, Fixed, 95% CI) | 1.18 [0.53, 2.62] |
| Analysis 5.2  Comparison 5 Automated telemedicine monitoring versus conventional, Outcome 2 Neonatal morbidity composite. | ||||
| 3 Gestational age at birth Show forest plot | 3 | 84 | Mean Difference (IV, Fixed, 95% CI) | 0.24 [‐0.39, 0.88] |
| Analysis 5.3  Comparison 5 Automated telemedicine monitoring versus conventional, Outcome 3 Gestational age at birth. | ||||
| 4 Use of additional insulin therapy Show forest plot | 1 | 32 | Risk Ratio (M‐H, Fixed, 95% CI) | 1.0 [0.89, 1.12] |
| Analysis 5.4  Comparison 5 Automated telemedicine monitoring versus conventional, Outcome 4 Use of additional insulin therapy. | ||||
| 5 Insulin requirement at end of study Show forest plot | 1 | 20 | Mean Difference (IV, Fixed, 95% CI) | 18.4 [12.88, 23.92] |
| Analysis 5.5  Comparison 5 Automated telemedicine monitoring versus conventional, Outcome 5 Insulin requirement at end of study. | ||||
| 6 Glycaemic control ‐ Maternal fasting blood glucose: before breakfast Show forest plot | 1 | 20 | Mean Difference (IV, Fixed, 95% CI) | ‐1.0 [‐1.22, ‐0.78] |
| Analysis 5.6  Comparison 5 Automated telemedicine monitoring versus conventional, Outcome 6 Glycaemic control ‐ Maternal fasting blood glucose: before breakfast. | ||||
| 7 Glycaemic control ‐ Maternal fasting blood glucose: before lunch Show forest plot | 1 | 20 | Mean Difference (IV, Fixed, 95% CI) | ‐1.10 [‐1.32, ‐0.88] |
| Analysis 5.7  Comparison 5 Automated telemedicine monitoring versus conventional, Outcome 7 Glycaemic control ‐ Maternal fasting blood glucose: before lunch. | ||||
| 8 Glycaemic control ‐ Maternal HbA1c Show forest plot | 3 | 82 | Mean Difference (IV, Random, 95% CI) | ‐0.17 [‐0.82, 0.48] |
| Analysis 5.8  Comparison 5 Automated telemedicine monitoring versus conventional, Outcome 8 Glycaemic control ‐ Maternal HbA1c. | ||||
| 9 Glycaemic control ‐ Maternal post‐prandial blood glucose Show forest plot | 2 | 50 | Mean Difference (IV, Random, 95% CI) | ‐0.80 [‐1.67, 0.08] |
| Analysis 5.9  Comparison 5 Automated telemedicine monitoring versus conventional, Outcome 9 Glycaemic control ‐ Maternal post‐prandial blood glucose. | ||||
| 10 Weight gain during pregnancy [kg] Show forest plot | 1 | 32 | Mean Difference (IV, Fixed, 95% CI) | ‐0.70 [‐4.95, 3.55] |
| Analysis 5.10 ![Comparison 5 Automated telemedicine monitoring versus conventional, Outcome 10 Weight gain during pregnancy [kg].](/cdsr/doi/10.1002/14651858.CD009613.pub4/media/CDSR/CD009613/image_n/nCD009613-CMP-005-10.png) Comparison 5 Automated telemedicine monitoring versus conventional, Outcome 10 Weight gain during pregnancy [kg]. | ||||
| 11 Macrosomia Show forest plot | 1 | 32 | Risk Ratio (M‐H, Fixed, 95% CI) | 1.18 [0.31, 4.43] |
| Analysis 5.11  Comparison 5 Automated telemedicine monitoring versus conventional, Outcome 11 Macrosomia. | ||||
| 12 Birthweight Show forest plot | 1 | 32 | Mean Difference (IV, Fixed, 95% CI) | ‐0.16 [‐0.64, 0.32] |
| Analysis 5.12  Comparison 5 Automated telemedicine monitoring versus conventional, Outcome 12 Birthweight. | ||||
| Outcome or subgroup title | No. of studies | No. of participants | Statistical method | Effect size |
| 1 Caesarean section Show forest plot | 1 | 25 | Risk Ratio (M‐H, Fixed, 95% CI) | 0.77 [0.33, 1.79] |
| Analysis 6.1  Comparison 6 Constant CGM versus intermittent CGM, Outcome 1 Caesarean section. | ||||
| 2 Weight gain during pregnancy Show forest plot | 1 | 25 | Mean Difference (IV, Fixed, 95% CI) | 0.5 [‐1.82, 2.82] |
| Analysis 6.2  Comparison 6 Constant CGM versus intermittent CGM, Outcome 2 Weight gain during pregnancy. | ||||
| 3 Insulin dosage, 3rd trimester (IU/kg/day) Show forest plot | 1 | 25 | Mean Difference (IV, Fixed, 95% CI) | ‐0.03 [‐1.30, 1.24] |
| Analysis 6.3  Comparison 6 Constant CGM versus intermittent CGM, Outcome 3 Insulin dosage, 3rd trimester (IU/kg/day). | ||||
| 4 Glycaemic control ‐ Maternal blood glucose (1st trimester) Show forest plot | 1 | 25 | Mean Difference (IV, Fixed, 95% CI) | ‐0.5 [‐2.70, 1.70] |
| Analysis 6.4  Comparison 6 Constant CGM versus intermittent CGM, Outcome 4 Glycaemic control ‐ Maternal blood glucose (1st trimester). | ||||
| 5 Glycaemic control ‐ Maternal blood glucose (3rd trimester) Show forest plot | 1 | 25 | Mean Difference (IV, Fixed, 95% CI) | ‐0.14 [‐2.00, 1.72] |
| Analysis 6.5  Comparison 6 Constant CGM versus intermittent CGM, Outcome 5 Glycaemic control ‐ Maternal blood glucose (3rd trimester). | ||||
| 6 Glycaemic control ‐ Maternal HbA1c (1st trimester) Show forest plot | 1 | 25 | Mean Difference (IV, Fixed, 95% CI) | ‐0.30 [‐1.13, 0.53] |
| Analysis 6.6  Comparison 6 Constant CGM versus intermittent CGM, Outcome 6 Glycaemic control ‐ Maternal HbA1c (1st trimester). | ||||
| 7 Glycaemic control ‐ Maternal HbA1c (3rd trimester) Show forest plot | 1 | 25 | Mean Difference (IV, Fixed, 95% CI) | ‐0.09 [‐0.69, 0.51] |
| Analysis 6.7  Comparison 6 Constant CGM versus intermittent CGM, Outcome 7 Glycaemic control ‐ Maternal HbA1c (3rd trimester). | ||||
| 8 Maternal hypoglycemia Show forest plot | 1 | 25 | Risk Ratio (M‐H, Fixed, 95% CI) | 0.54 [0.06, 5.24] |
| Analysis 6.8  Comparison 6 Constant CGM versus intermittent CGM, Outcome 8 Maternal hypoglycemia. | ||||
| 9 Diabetic ketoacidosis (not pre‐specified) Show forest plot | 1 | 25 | Risk Ratio (M‐H, Fixed, 95% CI) | 0.36 [0.02, 8.05] |
| Analysis 6.9  Comparison 6 Constant CGM versus intermittent CGM, Outcome 9 Diabetic ketoacidosis (not pre‐specified). | ||||
| 10 Preterm birth < 37 weeks Show forest plot | 1 | 25 | Risk Ratio (M‐H, Fixed, 95% CI) | 1.08 [0.08, 15.46] |
| Analysis 6.10  Comparison 6 Constant CGM versus intermittent CGM, Outcome 10 Preterm birth < 37 weeks. | ||||
| 11 Macrosomia Show forest plot | 1 | 25 | Risk Ratio (M‐H, Fixed, 95% CI) | 1.08 [0.08, 15.46] |
| Analysis 6.11  Comparison 6 Constant CGM versus intermittent CGM, Outcome 11 Macrosomia. | ||||
| 12 Neonatal hypoglycaemia Show forest plot | 1 | 25 | Risk Ratio (M‐H, Fixed, 95% CI) | 0.0 [0.0, 0.0] |
| Analysis 6.12  Comparison 6 Constant CGM versus intermittent CGM, Outcome 12 Neonatal hypoglycaemia. | ||||
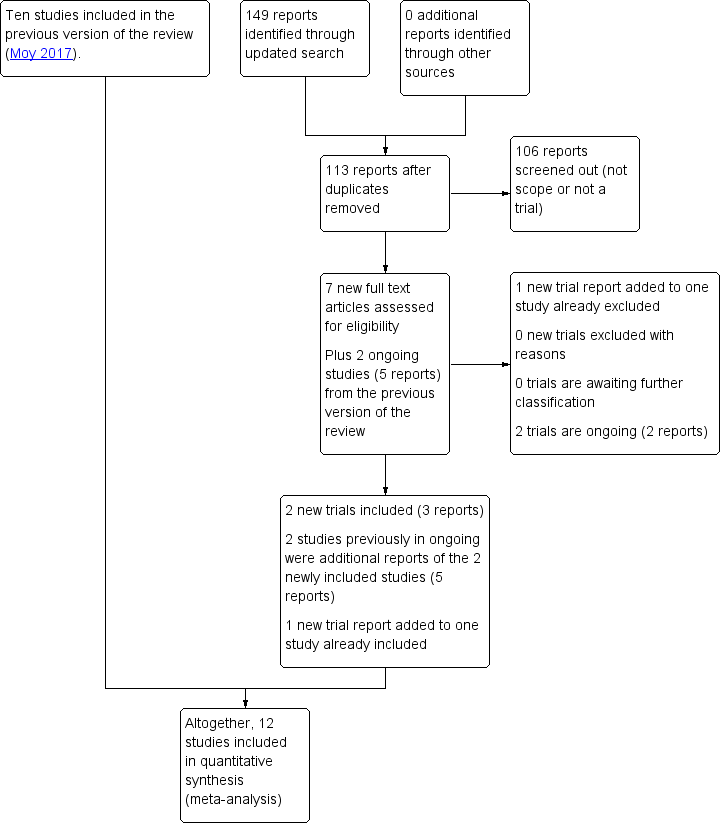
Study flow diagram 2018

'Risk of bias' summary: review authors' judgements about each risk of bias item for each included study.
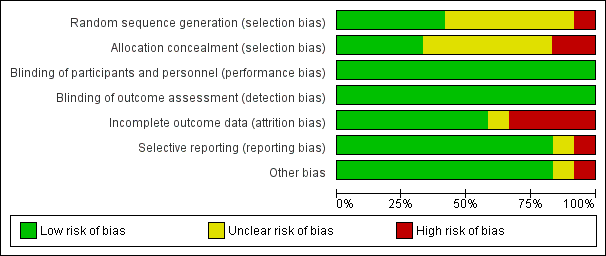
'Risk of bias' graph: review authors' judgements about each risk of bias item presented as percentages across all included studies.

Comparison 1 Continuous glucose monitoring versus intermittent glucose monitoring, Outcome 1 Hypertensive disorders of pregnancy.

Comparison 1 Continuous glucose monitoring versus intermittent glucose monitoring, Outcome 2 Caesarean section.
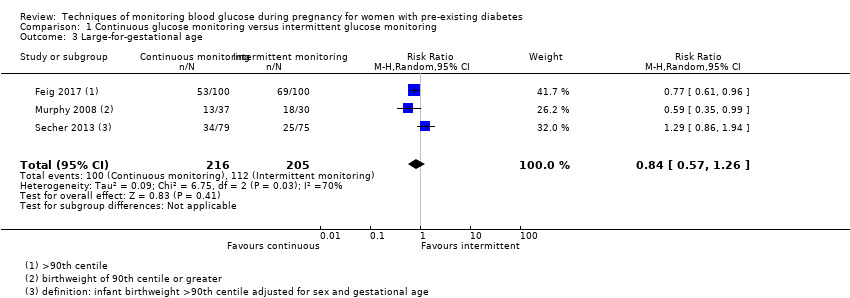
Comparison 1 Continuous glucose monitoring versus intermittent glucose monitoring, Outcome 3 Large‐for‐gestational age.

Comparison 1 Continuous glucose monitoring versus intermittent glucose monitoring, Outcome 4 Perinatal mortality (stillbirth and neonatal mortality).
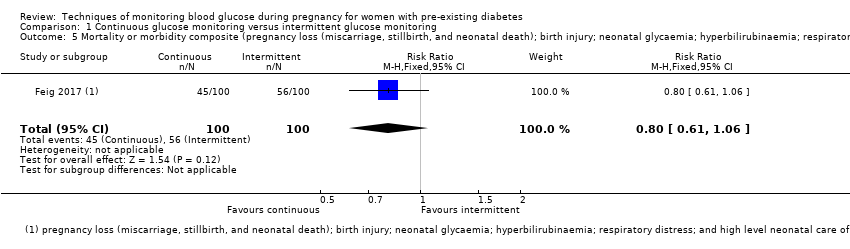
Comparison 1 Continuous glucose monitoring versus intermittent glucose monitoring, Outcome 5 Mortality or morbidity composite (pregnancy loss (miscarriage, stillbirth, and neonatal death); birth injury; neonatal glycaemia; hyperbilirubinaemia; respiratory distress; and high level neonatal care of more than 24 hours).
Comparison 1 Continuous glucose monitoring versus intermittent glucose monitoring, Outcome 6 Pre‐eclampsia.
Comparison 1 Continuous glucose monitoring versus intermittent glucose monitoring, Outcome 7 Pregnancy‐induced hypertension.

Comparison 1 Continuous glucose monitoring versus intermittent glucose monitoring, Outcome 8 Behaviour changes associated with the intervention (range of score 10‐50 ‐ high score= greater fear of hypoglycaemia).
Comparison 1 Continuous glucose monitoring versus intermittent glucose monitoring, Outcome 9 Sense of well‐being and quality of life (Short form 12 (SF‐12), total score at 34 weeks' gestation).

Comparison 1 Continuous glucose monitoring versus intermittent glucose monitoring, Outcome 10 Sense of well‐being and quality of life (Problem areas in diabetes (PAID), total score at 34 weeks' gestation).

Comparison 1 Continuous glucose monitoring versus intermittent glucose monitoring, Outcome 11 Sense of well‐being and quality of life (BGMSRQ, total score at 34 weeks' gestation).
Comparison 1 Continuous glucose monitoring versus intermittent glucose monitoring, Outcome 12 Glycaemic control ‐ Maternal HbA1c.
Comparison 1 Continuous glucose monitoring versus intermittent glucose monitoring, Outcome 13 Glycaemic control ‐ Achieved maternal HbA1c <= 6.5% (48 mmol/mol) at 34 weeks.
Comparison 1 Continuous glucose monitoring versus intermittent glucose monitoring, Outcome 14 Maternal hypoglycaemia (severe).

Comparison 1 Continuous glucose monitoring versus intermittent glucose monitoring, Outcome 15 Miscarriage.

Comparison 1 Continuous glucose monitoring versus intermittent glucose monitoring, Outcome 16 Stillbirth.

Comparison 1 Continuous glucose monitoring versus intermittent glucose monitoring, Outcome 17 Neonatal mortality.
Comparison 1 Continuous glucose monitoring versus intermittent glucose monitoring, Outcome 18 Gestational age at birth.
Comparison 1 Continuous glucose monitoring versus intermittent glucose monitoring, Outcome 19 Preterm birth < 37 weeks.

Comparison 1 Continuous glucose monitoring versus intermittent glucose monitoring, Outcome 20 Preterm birth < 34 weeks.

Comparison 1 Continuous glucose monitoring versus intermittent glucose monitoring, Outcome 21 Macrosomia.

Comparison 1 Continuous glucose monitoring versus intermittent glucose monitoring, Outcome 22 Birthweight.

Comparison 1 Continuous glucose monitoring versus intermittent glucose monitoring, Outcome 23 Small‐for‐gestational age.

Comparison 1 Continuous glucose monitoring versus intermittent glucose monitoring, Outcome 24 Head circumference (cm).
Comparison 1 Continuous glucose monitoring versus intermittent glucose monitoring, Outcome 25 Length (crown‐heel length cm).
Comparison 1 Continuous glucose monitoring versus intermittent glucose monitoring, Outcome 26 Adiposity (sum of 4 skin folds (tricepts, subscapular, biceps, flank) mm).

Comparison 1 Continuous glucose monitoring versus intermittent glucose monitoring, Outcome 27 Shoulder dystocia.
Comparison 1 Continuous glucose monitoring versus intermittent glucose monitoring, Outcome 28 Respiratory distress syndrome.
Comparison 1 Continuous glucose monitoring versus intermittent glucose monitoring, Outcome 29 Neonatal hypoglycaemia.
Comparison 1 Continuous glucose monitoring versus intermittent glucose monitoring, Outcome 30 Neonatal hyperbilirubinaemia.

Comparison 1 Continuous glucose monitoring versus intermittent glucose monitoring, Outcome 31 Relevant biomarker changes associated with the intervention (cord blood c‐peptide levels > 566 pmol/L).
Comparison 1 Continuous glucose monitoring versus intermittent glucose monitoring, Outcome 32 Relevant biomarker changes associated with the intervention (cord blood c‐peptide levels > 2725 pmol/L).

Comparison 1 Continuous glucose monitoring versus intermittent glucose monitoring, Outcome 33 Major and minor anomalies.

Comparison 1 Continuous glucose monitoring versus intermittent glucose monitoring, Outcome 34 Number of hospital admissions (mother).

Comparison 1 Continuous glucose monitoring versus intermittent glucose monitoring, Outcome 35 Neonatal intensive care unit admissions.
Comparison 1 Continuous glucose monitoring versus intermittent glucose monitoring, Outcome 36 Neonatal intensive care unit length of admission > 24 hours.
Comparison 1 Continuous glucose monitoring versus intermittent glucose monitoring, Outcome 37 Birth trauma (shoulder dystocia, bone fracture, nerve palsy).

Comparison 1 Continuous glucose monitoring versus intermittent glucose monitoring, Outcome 38 Diabetic ketoacidosis (mother).

Comparison 2 Self‐monitoring versus different type of self monitoring, Outcome 1 Caesarean section.

Comparison 2 Self‐monitoring versus different type of self monitoring, Outcome 2 Perinatal mortality (stillbirth and neonatal mortality).

Comparison 2 Self‐monitoring versus different type of self monitoring, Outcome 3 Glycaemic control during/end of treatment (maternal post‐prandial blood glucose).

Comparison 2 Self‐monitoring versus different type of self monitoring, Outcome 4 Glycaemic control during/end of treatment (maternal HbA1c).
Comparison 2 Self‐monitoring versus different type of self monitoring, Outcome 5 Miscarriage.

Comparison 2 Self‐monitoring versus different type of self monitoring, Outcome 6 Neonatal mortality.
Comparison 2 Self‐monitoring versus different type of self monitoring, Outcome 7 Gestational age at birth.
Comparison 2 Self‐monitoring versus different type of self monitoring, Outcome 8 Birthweight.

Comparison 2 Self‐monitoring versus different type of self monitoring, Outcome 9 Respiratory distress syndrome.
Comparison 2 Self‐monitoring versus different type of self monitoring, Outcome 10 Neonatal hypoglycaemia.

Comparison 2 Self‐monitoring versus different type of self monitoring, Outcome 11 Neonatal jaundice (hyperbilirubinaemia).

Comparison 2 Self‐monitoring versus different type of self monitoring, Outcome 12 Neonatal hypocalcaemia.
Comparison 2 Self‐monitoring versus different type of self monitoring, Outcome 13 Neonatal polycythaemia.
Comparison 2 Self‐monitoring versus different type of self monitoring, Outcome 14 Neonatal cord vein C‐peptide.

Comparison 3 Self‐monitoring at home versus hospitalisation, Outcome 1 Hypertensive disorders of pregnancy.

Comparison 3 Self‐monitoring at home versus hospitalisation, Outcome 2 Caesarean section.

Comparison 3 Self‐monitoring at home versus hospitalisation, Outcome 3 Perinatal mortality (stillbirth and neonatal mortality).

Comparison 3 Self‐monitoring at home versus hospitalisation, Outcome 4 Pre‐eclampsia.

Comparison 3 Self‐monitoring at home versus hospitalisation, Outcome 5 Pregnancy‐induced hypertension.

Comparison 3 Self‐monitoring at home versus hospitalisation, Outcome 6 Placental abruption.

Comparison 3 Self‐monitoring at home versus hospitalisation, Outcome 7 Preterm birth < 37 weeks.

Comparison 3 Self‐monitoring at home versus hospitalisation, Outcome 8 Respiratory distress syndrome.

Comparison 3 Self‐monitoring at home versus hospitalisation, Outcome 9 Neonatal hypoglycaemia.
Comparison 3 Self‐monitoring at home versus hospitalisation, Outcome 10 Neonatal jaundice (hyperbilirubinaemia).

Comparison 3 Self‐monitoring at home versus hospitalisation, Outcome 11 Major anomalies.

Comparison 3 Self‐monitoring at home versus hospitalisation, Outcome 12 Antenatal hospital admission.
Comparison 3 Self‐monitoring at home versus hospitalisation, Outcome 13 Feeding difficulties (not pre‐specified).

Comparison 4 Pre‐prandial versus post‐prandial glucose monitoring, Outcome 1 Caesarean section.

Comparison 4 Pre‐prandial versus post‐prandial glucose monitoring, Outcome 2 Large‐for‐gestational age.

Comparison 4 Pre‐prandial versus post‐prandial glucose monitoring, Outcome 3 Perinatal mortality (stillbirth and neonatal mortality).
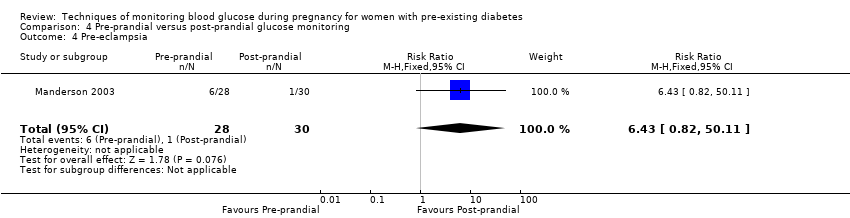
Comparison 4 Pre‐prandial versus post‐prandial glucose monitoring, Outcome 4 Pre‐eclampsia.

Comparison 4 Pre‐prandial versus post‐prandial glucose monitoring, Outcome 5 Weight gain during pregnancy.

Comparison 4 Pre‐prandial versus post‐prandial glucose monitoring, Outcome 6 Insulin dose.
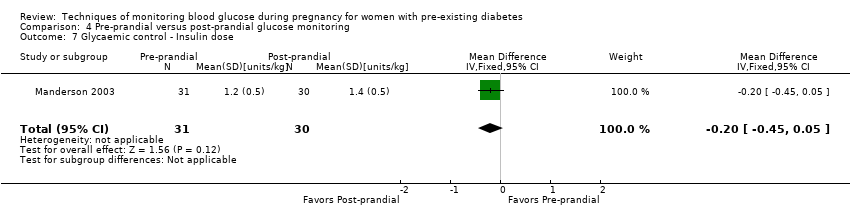
Comparison 4 Pre‐prandial versus post‐prandial glucose monitoring, Outcome 7 Glycaemic control ‐ Insulin dose.
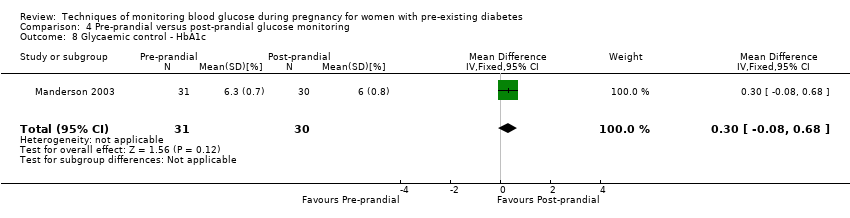
Comparison 4 Pre‐prandial versus post‐prandial glucose monitoring, Outcome 8 Glycaemic control ‐ HbA1c.

Comparison 4 Pre‐prandial versus post‐prandial glucose monitoring, Outcome 9 Stillbirth.

Comparison 4 Pre‐prandial versus post‐prandial glucose monitoring, Outcome 10 Gestational age at birth.

Comparison 4 Pre‐prandial versus post‐prandial glucose monitoring, Outcome 11 Preterm birth < 37 weeks.

Comparison 4 Pre‐prandial versus post‐prandial glucose monitoring, Outcome 12 Macrosomia.

Comparison 4 Pre‐prandial versus post‐prandial glucose monitoring, Outcome 13 Birthweight.
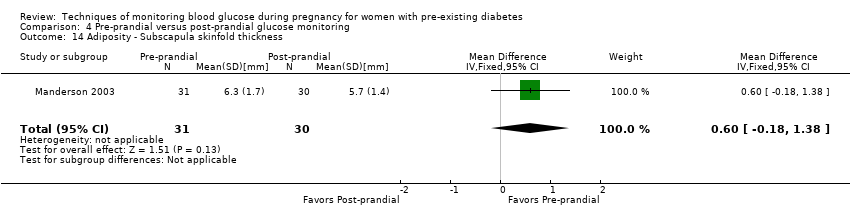
Comparison 4 Pre‐prandial versus post‐prandial glucose monitoring, Outcome 14 Adiposity ‐ Subscapula skinfold thickness.
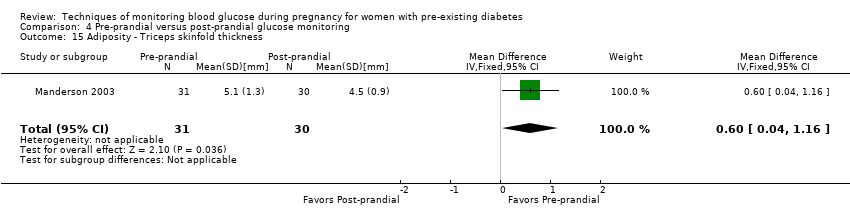
Comparison 4 Pre‐prandial versus post‐prandial glucose monitoring, Outcome 15 Adiposity ‐ Triceps skinfold thickness.
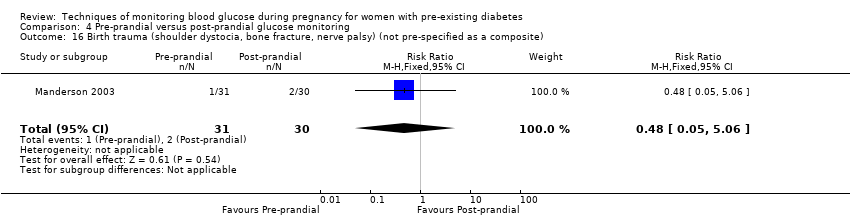
Comparison 4 Pre‐prandial versus post‐prandial glucose monitoring, Outcome 16 Birth trauma (shoulder dystocia, bone fracture, nerve palsy) (not pre‐specified as a composite).
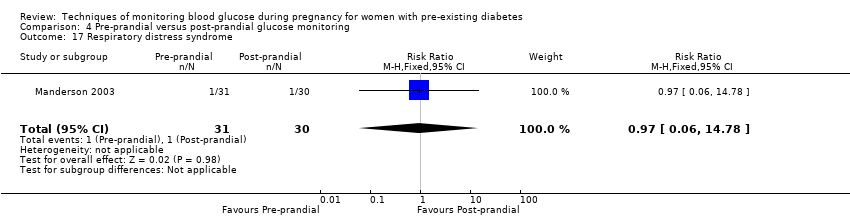
Comparison 4 Pre‐prandial versus post‐prandial glucose monitoring, Outcome 17 Respiratory distress syndrome.

Comparison 4 Pre‐prandial versus post‐prandial glucose monitoring, Outcome 18 Neonatal hypoglycaemia.

Comparison 4 Pre‐prandial versus post‐prandial glucose monitoring, Outcome 19 Neonatal jaundice (hyperbilirubinaemia).

Comparison 4 Pre‐prandial versus post‐prandial glucose monitoring, Outcome 20 Cord IGF‐1.
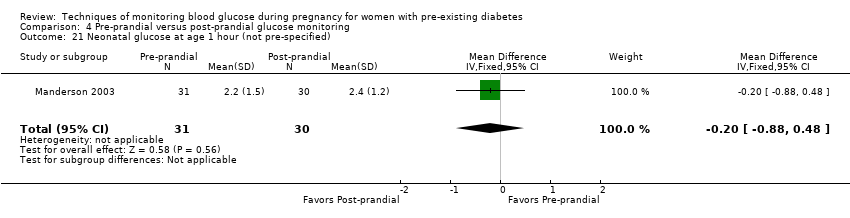
Comparison 4 Pre‐prandial versus post‐prandial glucose monitoring, Outcome 21 Neonatal glucose at age 1 hour (not pre‐specified).

Comparison 4 Pre‐prandial versus post‐prandial glucose monitoring, Outcome 22 Transient tachypnea (not pre‐specified).

Comparison 4 Pre‐prandial versus post‐prandial glucose monitoring, Outcome 23 Neonatal intensive care admissions.
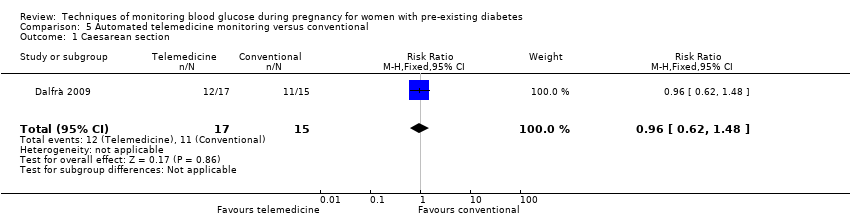
Comparison 5 Automated telemedicine monitoring versus conventional, Outcome 1 Caesarean section.
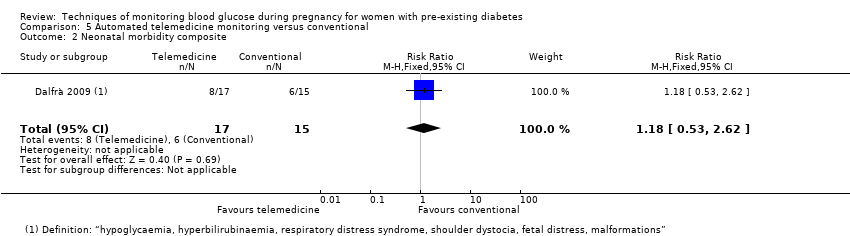
Comparison 5 Automated telemedicine monitoring versus conventional, Outcome 2 Neonatal morbidity composite.
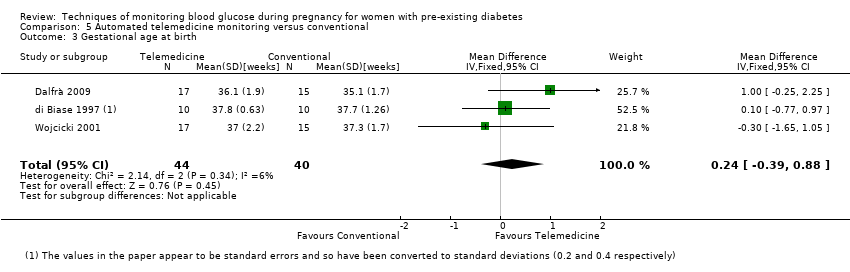
Comparison 5 Automated telemedicine monitoring versus conventional, Outcome 3 Gestational age at birth.
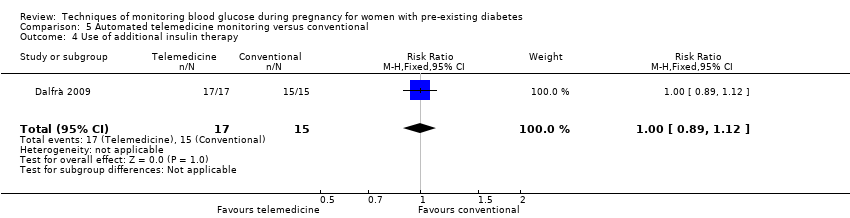
Comparison 5 Automated telemedicine monitoring versus conventional, Outcome 4 Use of additional insulin therapy.

Comparison 5 Automated telemedicine monitoring versus conventional, Outcome 5 Insulin requirement at end of study.
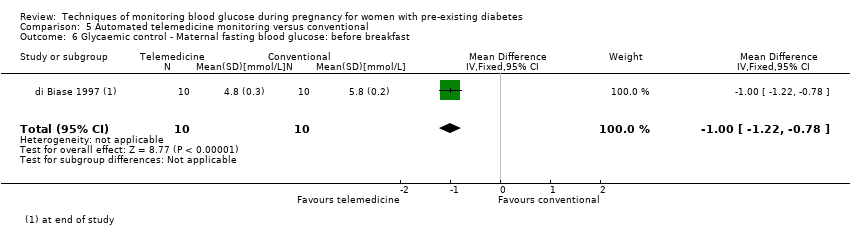
Comparison 5 Automated telemedicine monitoring versus conventional, Outcome 6 Glycaemic control ‐ Maternal fasting blood glucose: before breakfast.

Comparison 5 Automated telemedicine monitoring versus conventional, Outcome 7 Glycaemic control ‐ Maternal fasting blood glucose: before lunch.
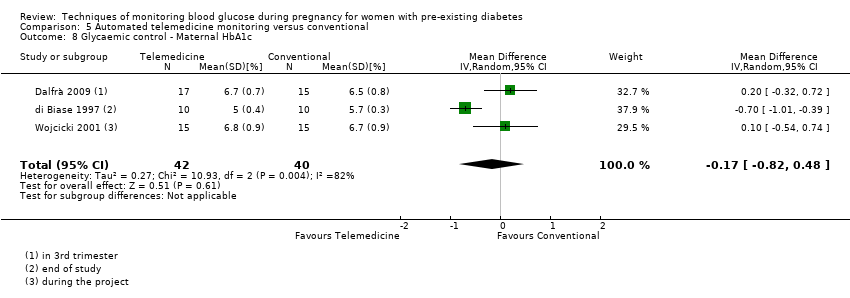
Comparison 5 Automated telemedicine monitoring versus conventional, Outcome 8 Glycaemic control ‐ Maternal HbA1c.
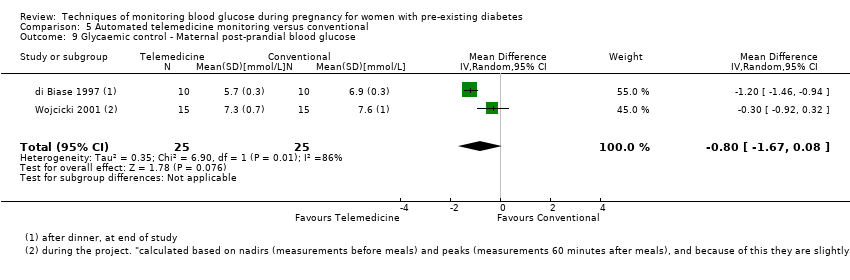
Comparison 5 Automated telemedicine monitoring versus conventional, Outcome 9 Glycaemic control ‐ Maternal post‐prandial blood glucose.
![Comparison 5 Automated telemedicine monitoring versus conventional, Outcome 10 Weight gain during pregnancy [kg].](/es/cdsr/doi/10.1002/14651858.CD009613.pub4/media/CDSR/CD009613/image_n/nCD009613-CMP-005-10.png)
Comparison 5 Automated telemedicine monitoring versus conventional, Outcome 10 Weight gain during pregnancy [kg].
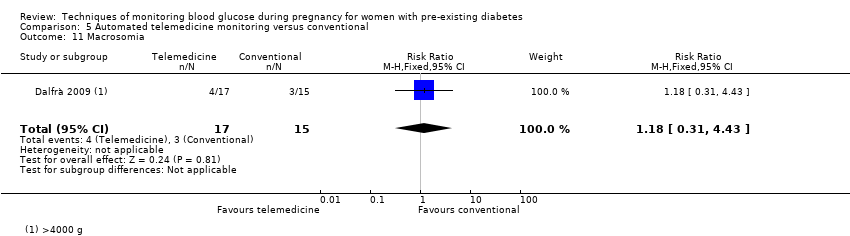
Comparison 5 Automated telemedicine monitoring versus conventional, Outcome 11 Macrosomia.

Comparison 5 Automated telemedicine monitoring versus conventional, Outcome 12 Birthweight.

Comparison 6 Constant CGM versus intermittent CGM, Outcome 1 Caesarean section.

Comparison 6 Constant CGM versus intermittent CGM, Outcome 2 Weight gain during pregnancy.

Comparison 6 Constant CGM versus intermittent CGM, Outcome 3 Insulin dosage, 3rd trimester (IU/kg/day).

Comparison 6 Constant CGM versus intermittent CGM, Outcome 4 Glycaemic control ‐ Maternal blood glucose (1st trimester).
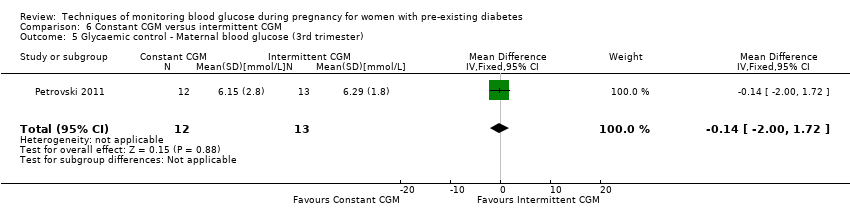
Comparison 6 Constant CGM versus intermittent CGM, Outcome 5 Glycaemic control ‐ Maternal blood glucose (3rd trimester).
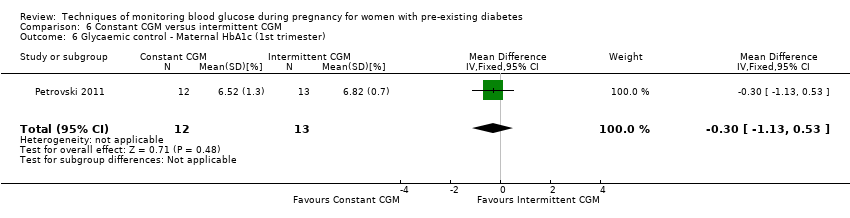
Comparison 6 Constant CGM versus intermittent CGM, Outcome 6 Glycaemic control ‐ Maternal HbA1c (1st trimester).

Comparison 6 Constant CGM versus intermittent CGM, Outcome 7 Glycaemic control ‐ Maternal HbA1c (3rd trimester).
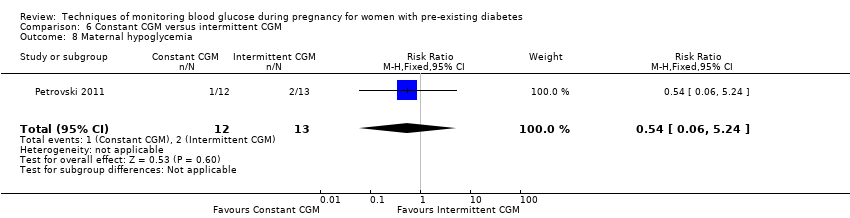
Comparison 6 Constant CGM versus intermittent CGM, Outcome 8 Maternal hypoglycemia.

Comparison 6 Constant CGM versus intermittent CGM, Outcome 9 Diabetic ketoacidosis (not pre‐specified).
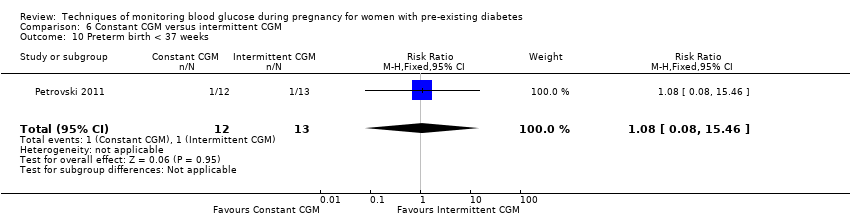
Comparison 6 Constant CGM versus intermittent CGM, Outcome 10 Preterm birth < 37 weeks.

Comparison 6 Constant CGM versus intermittent CGM, Outcome 11 Macrosomia.
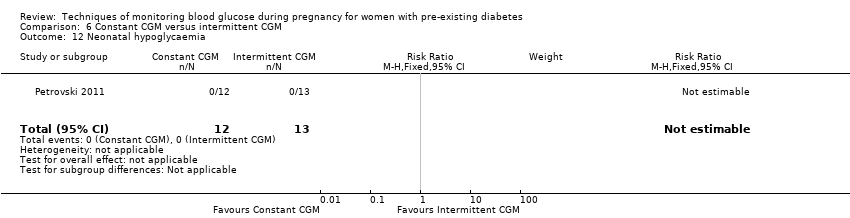
Comparison 6 Constant CGM versus intermittent CGM, Outcome 12 Neonatal hypoglycaemia.
| Continuous glucose monitoring compared to intermittent glucose monitoring for women with pre‐existing diabetes | ||||||
| Patient or population: women with pre‐existing diabetes Intervention: continuous glucose monitoring | ||||||
| Outcomes | Anticipated absolute effects* (95% CI) | Relative effect | № of participants | Certainty of the evidence | Comments | |
| Risk with intermittent self‐glucose monitoring | Risk with continuous glucose monitoring | |||||
| Hypertensive disorders of pregnancy (including pre‐eclampsia, pregnancy‐induced hypertension, eclampsia) | Study population | RR 0.58 | 384 | ⊕⊕⊝⊝ | ||
| 292 per 1000 | 170 per 1000 | |||||
| Caesarean section | Study population | RR 0.94 | 427 | ⊕⊕⊕⊝ | ||
| 600 per 1000 | 564 per 1000 | |||||
| Large‐for‐gestational age | Study population | RR 0.84 | 421 | ⊕⊕⊝⊝ | ||
| 546 per 1000 | 459 per 1000 | |||||
| Perinatal mortality (stillbirth and neonatal mortality) | Study population | RR 0.82 | 71 | ⊕⊕⊝⊝ | ||
| 31 per 1000 | 26 per 1000 | |||||
| *The risk in the intervention group (and its 95% confidence interval) is based on the assumed risk in the comparison group and the relative effect of the intervention (and its 95% CI). | ||||||
| GRADE Working Group grades of evidence | ||||||
| 1 We downgraded (1) level for serious limitations in study design due to unclear risk of allocation concealment and high risk for selective outcome reporting 2 We downgraded (1) level for serious indirectness due to the two studies reporting this composite outcome in different ways: Voormolen 2018 reported a composite of pregnancy‐induced hypertension and pre‐eclampsia for women with type 1 diabetes and type 2 diabetes for; and Feig 2017 reporting a composite of worsening chronic, gestational and pre‐eclampsia for women with type 1 diabetes 3 We downgraded (1) level for serious inconsistency due to evidence of statistical heterogeneity I2 = 41% 4 We downgraded (1) level for serious imprecision due to wide CI crossing the line of no effect 5 We downgraded (1) level for serious inconsistency due to evidence of statistical heterogeneity I2 = 70% 6 We downgrade (2) levels for very serious imprecision due to evidence derived from a single study, with a small number of events, wide CI crossing the line of no effect | ||||||
| Self‐monitoring compared to standard care for women with pre‐existing diabetes | ||||||
| Patient or population: women with pre‐existing diabetes | ||||||
| Outcomes | Anticipated absolute effects* (95% CI) | Relative effect | № of participants | Quality of the evidence | Comments | |
| Risk with standard care | Risk with self‐monitoring | |||||
| Hypertensive disorders of pregnancy (including pre‐eclampsia, pregnancy‐induced hypertension, eclampsia) | Study population | (0 studies) | The included study did not report this outcome. | |||
| Caesarean section | Study population | RR 0.78 | 28 | ⊕⊝⊝⊝ | ||
| 643 per 1000 | 501 per 1000 | |||||
| Large‐for‐gestational age | Study population | (0 studies) | The included study did not report this outcome. | |||
| Perinatal mortality (stillbirth and neonatal mortality) | Study population | RR 3.00 | 28 | ⊕⊝⊝⊝ | There were no events in the standard care group and so anticipated absolute effects could not be calculated. | |
| 0 per 1000 | 0 per 1000 | |||||
| *The risk in the intervention group (and its 95% confidence interval) is based on the assumed risk in the comparison group and the relative effect of the intervention (and its 95% CI). | ||||||
| GRADE Working Group grades of evidence | ||||||
| 1 We downgraded (1) level for serious limitations in design limitations due unclear allocation concealment and high risk for attrition 2 We downgraded (2) levels for very serious imprecision due to wide CI crossing the line of no effect, few events and small sample size | ||||||
| Self‐monitoring compared to hospitalisation for women with pre‐existing diabetes | ||||||
| Patient or population: women with pre‐existing diabetes | ||||||
| Outcomes | Anticipated absolute effects* (95% CI) | Relative effect | № of participants | Quality of the evidence | Comments | |
| Risk with hospitalisation | Risk with self‐monitoring | |||||
| Hypertensive disorders of pregnancy (including pre‐eclampsia, pregnancy‐induced hypertension, eclampsia) | Study population | RR 1.19 (0.41 to 3.51) | 100 (1 RCT) | ⊕⊝⊝⊝ | ||
| 109 per 1000 | 129 per 1000 (45 to 381) | |||||
| Caesarean section | Study population | RR 0.96 | 100 | ⊕⊝⊝⊝ | ||
| 500 per 1000 | 480 per 1000 | |||||
| Large‐for‐gestational age | Study population | (0 studies) | The included study did not report this outcome. | |||
| Perinatal mortality (stillbirth and neonatal mortality) | Study population | RR 0.85 | 100 | ⊕⊝⊝⊝ | ||
| 22 per 1000 | 18 per 1000 | |||||
| *The risk in the intervention group (and its 95% confidence interval) is based on the assumed risk in the comparison group and the relative effect of the intervention (and its 95% CI). | ||||||
| GRADE Working Group grades of evidence | ||||||
| 1 We downgraded (1) level for serious limitations in study design due to unclear randomisation, allocation concealment and high risk for attrition 2 We downgraded (2) levels for very serious imprecision due to wide CI crossing the line of no effect, few events and small sample size | ||||||
| Pre‐prandial compared to post‐prandial glucose monitoring for women with pre‐existing diabetes | ||||||
| Patient or population: women with pre‐existing diabetes Intervention: pre‐prandial | ||||||
| Outcomes | Anticipated absolute effects* (95% CI) | Relative effect | № of participants | Quality of the evidence | Comments | |
| Risk with post‐prandial glucose monitoring | Risk with pre‐prandial | |||||
| Hypertensive disorders of pregnancy (including pre‐eclampsia, pregnancy‐induced hypertension, eclampsia) | Study population | (0 studies) | The included study did not report this composite outcome. | |||
| Caesarean section | Study population | RR 1.45 | 61 | ⊕⊝⊝⊝ | ||
| 467 per 1000 | 677 per 1000 | |||||
| Large‐for‐gestational age | Study population | RR 1.16 | 61 | ⊕⊝⊝⊝ | ||
| 500 per 1000 | 580 per 1000 | |||||
| Perinatal mortality (stillbirth and neonatal mortality) | Study population | RR 2.91 | 61 | ⊕⊝⊝⊝ | There were no events in the standard care group and so anticipated absolute effects could not be calculated. | |
| 0 per 1000 | 0 per 1000 | |||||
| *The risk in the intervention group (and its 95% confidence interval) is based on the assumed risk in the comparison group and the relative effect of the intervention (and its 95% CI). | ||||||
| GRADE Working Group grades of evidence | ||||||
| 1 We downgraded (1) level for serious limitations in study design due to unclear methods of randomisation and high risk of attrition 2 We downgrade (2) levels for very serious limitations in imprecision due to wide CI crossing the line of no effect, few events and small sample size | ||||||
| Automated telemedicine monitoring compared to conventional for women with pre‐existing diabetes | ||||||
| Patient or population: women with pre‐existing diabetes | ||||||
| Outcomes | Anticipated absolute effects* (95% CI) | Relative effect | № of participants | Quality of the evidence | Comments | |
| Risk with conventional monitoring | Risk with automated telemedicine monitoring | |||||
| Hypertensive disorders of pregnancy (including pre‐eclampsia, pregnancy‐induced hypertension, eclampsia) | Study population | (0 studies) | The included studies did not report this composite outcome. | |||
| Caesarean section | Study population | RR 0.96 | 32 | ⊕⊝⊝⊝ | ||
| 733 per 1000 | 704 per 1000 | |||||
| Large‐for‐gestational age | Study population | (0 studies) | The included studies did not report this outcome. | |||
| Perinatal mortality (stillbirth and neonatal mortality) | Study population | (0 studies) | The included studies did not report this outcome. | |||
| *The risk in the intervention group (and its 95% confidence interval) is based on the assumed risk in the comparison group and the relative effect of the intervention (and its 95% CI). | ||||||
| GRADE Working Group grades of evidence | ||||||
| 1 We downgraded (2) levels for very serious design limitations due to high risk for randomisation, allocation concealment, attrition and other bias 2 We downgraded (2) levels for very serious imprecision due to wide CI crossing the line of no effect, few events and small sample size | ||||||
| Constant CGM compared to Intermittent CGM for women with pre‐existing diabetes | ||||||
| Patient or population: women with pre‐existing diabetes | ||||||
| Outcomes | Anticipated absolute effects* (95% CI) | Relative effect | № of participants | Quality of the evidence | Comments | |
| Risk with Intermittent CGM | Risk with constant CGM | |||||
| Hypertensive disorders of pregnancy (including pre‐eclampsia, pregnancy‐induced hypertension, eclampsia) | Study population | (0 studies) | The included study did not report this outcome. | |||
| Caesarean section | Study population | RR 0.77 | 25 | ⊕⊝⊝⊝ | ||
| 538 per 1000 | 415 per 1000 | |||||
| Large‐for‐gestational age | Study population | (0 studies) | The included study did not report this outcome. | |||
| Perinatal mortality (stillbirth and neonatal mortality) | Study population | (0 studies) | The included study did not report this outcome. | |||
| *The risk in the intervention group (and its 95% confidence interval) is based on the assumed risk in the comparison group and the relative effect of the intervention (and its 95% CI). | ||||||
| GRADE Working Group grades of evidence | ||||||
| 1 We downgraded (1) level for serious limitations in design due to unclear randomisation and allocation concealment 2 We downgraded (2) levels for very serious limitations in imprecision due to wide CI crossing the line of no effect, few events and small sample size | ||||||
| Outcome or subgroup title | No. of studies | No. of participants | Statistical method | Effect size |
| 1 Hypertensive disorders of pregnancy Show forest plot | 2 | 384 | Risk Ratio (M‐H, Fixed, 95% CI) | 0.58 [0.39, 0.85] |
| 2 Caesarean section Show forest plot | 3 | 427 | Risk Ratio (M‐H, Random, 95% CI) | 0.94 [0.75, 1.18] |
| 3 Large‐for‐gestational age Show forest plot | 3 | 421 | Risk Ratio (M‐H, Random, 95% CI) | 0.84 [0.57, 1.26] |
| 4 Perinatal mortality (stillbirth and neonatal mortality) Show forest plot | 1 | 71 | Risk Ratio (M‐H, Fixed, 95% CI) | 0.82 [0.05, 12.61] |
| 5 Mortality or morbidity composite (pregnancy loss (miscarriage, stillbirth, and neonatal death); birth injury; neonatal glycaemia; hyperbilirubinaemia; respiratory distress; and high level neonatal care of more than 24 hours) Show forest plot | 1 | 200 | Risk Ratio (M‐H, Fixed, 95% CI) | 0.80 [0.61, 1.06] |
| 6 Pre‐eclampsia Show forest plot | 4 | 609 | Risk Ratio (M‐H, Fixed, 95% CI) | 0.65 [0.39, 1.08] |
| 7 Pregnancy‐induced hypertension Show forest plot | 2 | 384 | Risk Ratio (M‐H, Fixed, 95% CI) | 0.67 [0.38, 1.16] |
| 8 Behaviour changes associated with the intervention (range of score 10‐50 ‐ high score= greater fear of hypoglycaemia) Show forest plot | 1 | 214 | Mean Difference (IV, Fixed, 95% CI) | 1.00 [‐1.06, 3.06] |
| 9 Sense of well‐being and quality of life (Short form 12 (SF‐12), total score at 34 weeks' gestation) Show forest plot | 1 | 214 | Mean Difference (IV, Fixed, 95% CI) | ‐0.70 [‐2.50, 1.10] |
| 10 Sense of well‐being and quality of life (Problem areas in diabetes (PAID), total score at 34 weeks' gestation) Show forest plot | 1 | 214 | Mean Difference (IV, Fixed, 95% CI) | 0.80 [‐3.06, 4.66] |
| 11 Sense of well‐being and quality of life (BGMSRQ, total score at 34 weeks' gestation) Show forest plot | 1 | 214 | Mean Difference (IV, Fixed, 95% CI) | 4.30 [0.73, 7.87] |
| 12 Glycaemic control ‐ Maternal HbA1c Show forest plot | 2 | 258 | Mean Difference (IV, Random, 95% CI) | ‐0.37 [‐0.78, 0.04] |
| 13 Glycaemic control ‐ Achieved maternal HbA1c <= 6.5% (48 mmol/mol) at 34 weeks Show forest plot | 1 | 187 | Risk Ratio (M‐H, Fixed, 95% CI) | 1.27 [1.00, 1.62] |
| 14 Maternal hypoglycaemia (severe) Show forest plot | 1 | 154 | Risk Ratio (M‐H, Fixed, 95% CI) | 0.92 [0.43, 1.95] |
| 15 Miscarriage Show forest plot | 3 | 439 | Risk Ratio (M‐H, Fixed, 95% CI) | 1.24 [0.47, 3.26] |
| 16 Stillbirth Show forest plot | 1 | 211 | Risk Ratio (M‐H, Fixed, 95% CI) | 0.34 [0.01, 8.17] |
| 17 Neonatal mortality Show forest plot | 2 | 256 | Risk Ratio (M‐H, Fixed, 95% CI) | 0.92 [0.13, 6.37] |
| 18 Gestational age at birth Show forest plot | 1 | 68 | Mean Difference (IV, Fixed, 95% CI) | 0.10 [‐0.57, 0.77] |
| 19 Preterm birth < 37 weeks Show forest plot | 3 | 430 | Risk Ratio (M‐H, Fixed, 95% CI) | 0.96 [0.72, 1.29] |
| 20 Preterm birth < 34 weeks Show forest plot | 1 | 211 | Risk Ratio (M‐H, Fixed, 95% CI) | 0.46 [0.17, 1.28] |
| 21 Macrosomia Show forest plot | 3 | 451 | Risk Ratio (M‐H, Random, 95% CI) | 0.84 [0.61, 1.17] |
| 22 Birthweight Show forest plot | 2 | 267 | Mean Difference (IV, Random, 95% CI) | ‐0.13 [‐0.38, 0.12] |
| 23 Small‐for‐gestational age Show forest plot | 2 | 269 | Risk Ratio (M‐H, Fixed, 95% CI) | 2.40 [0.55, 10.51] |
| 24 Head circumference (cm) Show forest plot | 1 | 160 | Mean Difference (IV, Fixed, 95% CI) | ‐0.20 [‐0.79, 0.39] |
| 25 Length (crown‐heel length cm) Show forest plot | 1 | 160 | Mean Difference (IV, Fixed, 95% CI) | ‐0.20 [‐0.79, 0.39] |
| 26 Adiposity (sum of 4 skin folds (tricepts, subscapular, biceps, flank) mm) Show forest plot | 1 | 160 | Mean Difference (IV, Fixed, 95% CI) | ‐0.20 [‐1.98, 1.58] |
| 27 Shoulder dystocia Show forest plot | 1 | 200 | Risk Ratio (M‐H, Fixed, 95% CI) | 3.0 [0.12, 72.77] |
| 28 Respiratory distress syndrome Show forest plot | 1 | 200 | Risk Ratio (M‐H, Fixed, 95% CI) | 1.0 [0.41, 2.41] |
| 29 Neonatal hypoglycaemia Show forest plot | 3 | 428 | Risk Ratio (M‐H, Fixed, 95% CI) | 0.66 [0.48, 0.93] |
| 30 Neonatal hyperbilirubinaemia Show forest plot | 1 | 200 | Risk Ratio (M‐H, Fixed, 95% CI) | 0.81 [0.52, 1.26] |
| 31 Relevant biomarker changes associated with the intervention (cord blood c‐peptide levels > 566 pmol/L) Show forest plot | 1 | 200 | Risk Ratio (M‐H, Fixed, 95% CI) | 0.95 [0.68, 1.33] |
| 32 Relevant biomarker changes associated with the intervention (cord blood c‐peptide levels > 2725 pmol/L) Show forest plot | 1 | 200 | Risk Ratio (M‐H, Fixed, 95% CI) | 1.0 [0.33, 3.00] |
| 33 Major and minor anomalies Show forest plot | 2 | 285 | Risk Ratio (M‐H, Fixed, 95% CI) | 0.71 [0.16, 3.13] |
| 34 Number of hospital admissions (mother) Show forest plot | 1 | 207 | Risk Ratio (M‐H, Fixed, 95% CI) | 1.25 [0.84, 1.85] |
| 35 Neonatal intensive care unit admissions Show forest plot | 2 | 274 | Risk Ratio (M‐H, Random, 95% CI) | 0.76 [0.42, 1.35] |
| 36 Neonatal intensive care unit length of admission > 24 hours Show forest plot | 1 | 200 | Risk Ratio (M‐H, Fixed, 95% CI) | 0.63 [0.42, 0.93] |
| 37 Birth trauma (shoulder dystocia, bone fracture, nerve palsy) Show forest plot | 1 | 200 | Risk Ratio (M‐H, Fixed, 95% CI) | 5.0 [0.24, 102.85] |
| 38 Diabetic ketoacidosis (mother) Show forest plot | 1 | 207 | Risk Ratio (M‐H, Fixed, 95% CI) | 1.01 [0.14, 7.03] |
| Outcome or subgroup title | No. of studies | No. of participants | Statistical method | Effect size |
| 1 Caesarean section Show forest plot | 1 | 28 | Risk Ratio (M‐H, Fixed, 95% CI) | 0.78 [0.40, 1.49] |
| 2 Perinatal mortality (stillbirth and neonatal mortality) Show forest plot | 1 | 28 | Risk Ratio (M‐H, Fixed, 95% CI) | 3.0 [0.13, 67.91] |
| 3 Glycaemic control during/end of treatment (maternal post‐prandial blood glucose) Show forest plot | 1 | 13 | Mean Difference (IV, Fixed, 95% CI) | ‐0.70 [‐2.15, 0.75] |
| 4 Glycaemic control during/end of treatment (maternal HbA1c) Show forest plot | 1 | 28 | Mean Difference (IV, Fixed, 95% CI) | ‐0.10 [‐1.93, 1.73] |
| 5 Miscarriage Show forest plot | 1 | 30 | Risk Ratio (M‐H, Fixed, 95% CI) | 1.0 [0.07, 14.55] |
| 6 Neonatal mortality Show forest plot | 1 | 28 | Risk Ratio (M‐H, Fixed, 95% CI) | 3.0 [0.13, 67.91] |
| 7 Gestational age at birth Show forest plot | 1 | 28 | Mean Difference (IV, Fixed, 95% CI) | 0.40 [‐1.65, 2.45] |
| 8 Birthweight Show forest plot | 2 | 41 | Mean Difference (IV, Fixed, 95% CI) | ‐0.18 [‐0.49, 0.13] |
| 9 Respiratory distress syndrome Show forest plot | 1 | 28 | Risk Ratio (M‐H, Fixed, 95% CI) | 3.0 [0.13, 67.91] |
| 10 Neonatal hypoglycaemia Show forest plot | 1 | 28 | Risk Ratio (M‐H, Fixed, 95% CI) | 0.57 [0.21, 1.52] |
| 11 Neonatal jaundice (hyperbilirubinaemia) Show forest plot | 1 | 28 | Risk Ratio (M‐H, Fixed, 95% CI) | 0.56 [0.25, 1.24] |
| 12 Neonatal hypocalcaemia Show forest plot | 1 | 28 | Risk Ratio (M‐H, Fixed, 95% CI) | 1.0 [0.07, 14.45] |
| 13 Neonatal polycythaemia Show forest plot | 1 | 28 | Risk Ratio (M‐H, Fixed, 95% CI) | 0.33 [0.01, 7.55] |
| 14 Neonatal cord vein C‐peptide Show forest plot | 1 | 28 | Mean Difference (IV, Fixed, 95% CI) | 0.13 [‐0.50, 0.76] |
| Outcome or subgroup title | No. of studies | No. of participants | Statistical method | Effect size |
| 1 Hypertensive disorders of pregnancy Show forest plot | 1 | 100 | Risk Ratio (M‐H, Fixed, 95% CI) | 1.19 [0.41, 3.51] |
| 2 Caesarean section Show forest plot | 1 | 100 | Risk Ratio (M‐H, Fixed, 95% CI) | 0.96 [0.65, 1.44] |
| 3 Perinatal mortality (stillbirth and neonatal mortality) Show forest plot | 1 | 100 | Risk Ratio (M‐H, Fixed, 95% CI) | 0.85 [0.05, 13.24] |
| 4 Pre‐eclampsia Show forest plot | 1 | 100 | Risk Ratio (M‐H, Fixed, 95% CI) | 4.26 [0.52, 35.16] |
| 5 Pregnancy‐induced hypertension Show forest plot | 1 | 100 | Risk Ratio (M‐H, Fixed, 95% CI) | 0.43 [0.08, 2.22] |
| 6 Placental abruption Show forest plot | 1 | 100 | Risk Ratio (M‐H, Fixed, 95% CI) | 1.70 [0.16, 18.19] |
| 7 Preterm birth < 37 weeks Show forest plot | 1 | 100 | Risk Ratio (M‐H, Fixed, 95% CI) | 0.85 [0.45, 1.60] |
| 8 Respiratory distress syndrome Show forest plot | 1 | 100 | Risk Ratio (M‐H, Fixed, 95% CI) | 2.56 [0.28, 23.74] |
| 9 Neonatal hypoglycaemia Show forest plot | 1 | 100 | Risk Ratio (M‐H, Fixed, 95% CI) | 1.01 [0.50, 2.03] |
| 10 Neonatal jaundice (hyperbilirubinaemia) Show forest plot | 1 | 100 | Risk Ratio (M‐H, Fixed, 95% CI) | 2.27 [0.64, 8.07] |
| 11 Major anomalies Show forest plot | 1 | 102 | Risk Ratio (M‐H, Fixed, 95% CI) | 0.27 [0.03, 2.54] |
| 12 Antenatal hospital admission Show forest plot | 1 | 100 | Risk Ratio (M‐H, Fixed, 95% CI) | 0.19 [0.11, 0.33] |
| 13 Feeding difficulties (not pre‐specified) Show forest plot | 1 | 100 | Risk Ratio (M‐H, Fixed, 95% CI) | 0.85 [0.41, 1.78] |
| Outcome or subgroup title | No. of studies | No. of participants | Statistical method | Effect size |
| 1 Caesarean section Show forest plot | 1 | 61 | Risk Ratio (M‐H, Fixed, 95% CI) | 1.45 [0.92, 2.28] |
| 2 Large‐for‐gestational age Show forest plot | 1 | 61 | Risk Ratio (M‐H, Fixed, 95% CI) | 1.16 [0.73, 1.85] |
| 3 Perinatal mortality (stillbirth and neonatal mortality) Show forest plot | 1 | 61 | Risk Ratio (M‐H, Fixed, 95% CI) | 2.91 [0.12, 68.66] |
| 4 Pre‐eclampsia Show forest plot | 1 | 58 | Risk Ratio (M‐H, Fixed, 95% CI) | 6.43 [0.82, 50.11] |
| 5 Weight gain during pregnancy Show forest plot | 1 | 61 | Mean Difference (IV, Fixed, 95% CI) | ‐0.90 [‐3.86, 2.06] |
| 6 Insulin dose Show forest plot | 1 | 61 | Mean Difference (IV, Fixed, 95% CI) | ‐17.40 [‐43.41, 8.61] |
| 7 Glycaemic control ‐ Insulin dose Show forest plot | 1 | 61 | Mean Difference (IV, Fixed, 95% CI) | ‐0.20 [‐0.45, 0.05] |
| 8 Glycaemic control ‐ HbA1c Show forest plot | 1 | 61 | Mean Difference (IV, Fixed, 95% CI) | 0.30 [‐0.08, 0.68] |
| 9 Stillbirth Show forest plot | 1 | 61 | Risk Ratio (M‐H, Fixed, 95% CI) | 2.91 [0.12, 68.66] |
| 10 Gestational age at birth Show forest plot | 1 | 61 | Mean Difference (IV, Fixed, 95% CI) | 0.20 [‐0.84, 1.24] |
| 11 Preterm birth < 37 weeks Show forest plot | 1 | 61 | Risk Ratio (M‐H, Fixed, 95% CI) | 1.33 [0.62, 2.84] |
| 12 Macrosomia Show forest plot | 1 | 61 | Risk Ratio (M‐H, Fixed, 95% CI) | 2.18 [0.75, 6.32] |
| 13 Birthweight Show forest plot | 1 | 61 | Mean Difference (IV, Fixed, 95% CI) | 0.24 [‐0.10, 0.58] |
| 14 Adiposity ‐ Subscapula skinfold thickness Show forest plot | 1 | 61 | Mean Difference (IV, Fixed, 95% CI) | 0.60 [‐0.18, 1.38] |
| 15 Adiposity ‐ Triceps skinfold thickness Show forest plot | 1 | 61 | Mean Difference (IV, Fixed, 95% CI) | 0.60 [0.04, 1.16] |
| 16 Birth trauma (shoulder dystocia, bone fracture, nerve palsy) (not pre‐specified as a composite) Show forest plot | 1 | 61 | Risk Ratio (M‐H, Fixed, 95% CI) | 0.48 [0.05, 5.06] |
| 17 Respiratory distress syndrome Show forest plot | 1 | 61 | Risk Ratio (M‐H, Fixed, 95% CI) | 0.97 [0.06, 14.78] |
| 18 Neonatal hypoglycaemia Show forest plot | 1 | 61 | Risk Ratio (M‐H, Fixed, 95% CI) | 1.09 [0.48, 2.45] |
| 19 Neonatal jaundice (hyperbilirubinaemia) Show forest plot | 1 | 61 | Risk Ratio (M‐H, Fixed, 95% CI) | 1.16 [0.40, 3.40] |
| 20 Cord IGF‐1 Show forest plot | 1 | 61 | Mean Difference (IV, Fixed, 95% CI) | 1.30 [‐0.70, 3.30] |
| 21 Neonatal glucose at age 1 hour (not pre‐specified) Show forest plot | 1 | 61 | Mean Difference (IV, Fixed, 95% CI) | ‐0.20 [‐0.88, 0.48] |
| 22 Transient tachypnea (not pre‐specified) Show forest plot | 1 | 61 | Risk Ratio (M‐H, Fixed, 95% CI) | 2.58 [0.76, 8.81] |
| 23 Neonatal intensive care admissions Show forest plot | 1 | 59 | Risk Ratio (M‐H, Fixed, 95% CI) | 1.04 [0.62, 1.74] |
| Outcome or subgroup title | No. of studies | No. of participants | Statistical method | Effect size |
| 1 Caesarean section Show forest plot | 1 | 32 | Risk Ratio (M‐H, Fixed, 95% CI) | 0.96 [0.62, 1.48] |
| 2 Neonatal morbidity composite Show forest plot | 1 | 32 | Risk Ratio (M‐H, Fixed, 95% CI) | 1.18 [0.53, 2.62] |
| 3 Gestational age at birth Show forest plot | 3 | 84 | Mean Difference (IV, Fixed, 95% CI) | 0.24 [‐0.39, 0.88] |
| 4 Use of additional insulin therapy Show forest plot | 1 | 32 | Risk Ratio (M‐H, Fixed, 95% CI) | 1.0 [0.89, 1.12] |
| 5 Insulin requirement at end of study Show forest plot | 1 | 20 | Mean Difference (IV, Fixed, 95% CI) | 18.4 [12.88, 23.92] |
| 6 Glycaemic control ‐ Maternal fasting blood glucose: before breakfast Show forest plot | 1 | 20 | Mean Difference (IV, Fixed, 95% CI) | ‐1.0 [‐1.22, ‐0.78] |
| 7 Glycaemic control ‐ Maternal fasting blood glucose: before lunch Show forest plot | 1 | 20 | Mean Difference (IV, Fixed, 95% CI) | ‐1.10 [‐1.32, ‐0.88] |
| 8 Glycaemic control ‐ Maternal HbA1c Show forest plot | 3 | 82 | Mean Difference (IV, Random, 95% CI) | ‐0.17 [‐0.82, 0.48] |
| 9 Glycaemic control ‐ Maternal post‐prandial blood glucose Show forest plot | 2 | 50 | Mean Difference (IV, Random, 95% CI) | ‐0.80 [‐1.67, 0.08] |
| 10 Weight gain during pregnancy [kg] Show forest plot | 1 | 32 | Mean Difference (IV, Fixed, 95% CI) | ‐0.70 [‐4.95, 3.55] |
| 11 Macrosomia Show forest plot | 1 | 32 | Risk Ratio (M‐H, Fixed, 95% CI) | 1.18 [0.31, 4.43] |
| 12 Birthweight Show forest plot | 1 | 32 | Mean Difference (IV, Fixed, 95% CI) | ‐0.16 [‐0.64, 0.32] |
| Outcome or subgroup title | No. of studies | No. of participants | Statistical method | Effect size |
| 1 Caesarean section Show forest plot | 1 | 25 | Risk Ratio (M‐H, Fixed, 95% CI) | 0.77 [0.33, 1.79] |
| 2 Weight gain during pregnancy Show forest plot | 1 | 25 | Mean Difference (IV, Fixed, 95% CI) | 0.5 [‐1.82, 2.82] |
| 3 Insulin dosage, 3rd trimester (IU/kg/day) Show forest plot | 1 | 25 | Mean Difference (IV, Fixed, 95% CI) | ‐0.03 [‐1.30, 1.24] |
| 4 Glycaemic control ‐ Maternal blood glucose (1st trimester) Show forest plot | 1 | 25 | Mean Difference (IV, Fixed, 95% CI) | ‐0.5 [‐2.70, 1.70] |
| 5 Glycaemic control ‐ Maternal blood glucose (3rd trimester) Show forest plot | 1 | 25 | Mean Difference (IV, Fixed, 95% CI) | ‐0.14 [‐2.00, 1.72] |
| 6 Glycaemic control ‐ Maternal HbA1c (1st trimester) Show forest plot | 1 | 25 | Mean Difference (IV, Fixed, 95% CI) | ‐0.30 [‐1.13, 0.53] |
| 7 Glycaemic control ‐ Maternal HbA1c (3rd trimester) Show forest plot | 1 | 25 | Mean Difference (IV, Fixed, 95% CI) | ‐0.09 [‐0.69, 0.51] |
| 8 Maternal hypoglycemia Show forest plot | 1 | 25 | Risk Ratio (M‐H, Fixed, 95% CI) | 0.54 [0.06, 5.24] |
| 9 Diabetic ketoacidosis (not pre‐specified) Show forest plot | 1 | 25 | Risk Ratio (M‐H, Fixed, 95% CI) | 0.36 [0.02, 8.05] |
| 10 Preterm birth < 37 weeks Show forest plot | 1 | 25 | Risk Ratio (M‐H, Fixed, 95% CI) | 1.08 [0.08, 15.46] |
| 11 Macrosomia Show forest plot | 1 | 25 | Risk Ratio (M‐H, Fixed, 95% CI) | 1.08 [0.08, 15.46] |
| 12 Neonatal hypoglycaemia Show forest plot | 1 | 25 | Risk Ratio (M‐H, Fixed, 95% CI) | 0.0 [0.0, 0.0] |