針對懷孕前以罹患糖尿病之婦女在懷孕期間的血糖監測技術
Abstract
Background
Self‐monitoring of blood glucose (SMBG) is recommended as a key component of the management plan for diabetes therapy during pregnancy. No existing systematic reviews consider the benefits/effectiveness of various techniques of blood glucose monitoring on maternal and infant outcomes among pregnant women with pre‐existing diabetes. The effectiveness of the various monitoring techniques is unclear.
Objectives
To compare techniques of blood glucose monitoring and their impact on maternal and infant outcomes among pregnant women with pre‐existing diabetes.
Search methods
We searched the Cochrane Pregnancy and Childbirth Group's Trials Register (30 November 2016), searched reference lists of retrieved studies and contacted trial authors.
Selection criteria
Randomised controlled trials (RCTs) and quasi‐RCTs comparing techniques of blood glucose monitoring including SMBG, continuous glucose monitoring (CGM) or clinic monitoring among pregnant women with pre‐existing diabetes mellitus (type 1 or type 2). Trials investigating timing and frequency of monitoring were also included. RCTs using a cluster‐randomised design were eligible for inclusion but none were identified.
Data collection and analysis
Two review authors independently assessed study eligibility, extracted data and assessed the risk of bias of included studies. Data were checked for accuracy. The quality of the evidence was assessed using the GRADE approach.
Main results
This review update includes at total of 10 trials (538) women (468 women with type 1 diabetes and 70 women with type 2 diabetes). The trials took place in Europe and the USA. Five of the 10 included studies were at moderate risk of bias, four studies were at low to moderate risk of bias, and one study was at high risk of bias. The trials are too small to show differences in important outcomes such as macrosomia, preterm birth, miscarriage or death of baby. Almost all the reported GRADE outcomes were assessed as being very low‐quality evidence. This was due to design limitations in the studies, wide confidence intervals, small sample sizes, and few events. In addition, there was high heterogeneity for some outcomes.
Various methods of glucose monitoring were compared in the trials. Neither pooled analyses nor individual trial analyses showed any clear advantages of one monitoring technique over another for primary and secondary outcomes. Many important outcomes were not reported.
1. Self‐monitoring versus standard care (two studies, 43 women): there was no clear difference for caesarean section (risk ratio (RR) 0.78, 95% confidence interval (CI) 0.40 to 1.49; one study, 28 women) or glycaemic control (both very low‐quality), and not enough evidence to assess perinatal mortality and neonatal mortality and morbidity composite. Hypertensive disorders of pregnancy, large‐for‐gestational age, neurosensory disability, and preterm birth were not reported in either study.
2. Self‐monitoring versus hospitalisation (one study, 100 women): there was no clear difference for hypertensive disorders of pregnancy (pre‐eclampsia and hypertension) (RR 4.26, 95% CI 0.52 to 35.16; very low‐quality: RR 0.43, 95% CI 0.08 to 2.22; very low‐quality). There was no clear difference in caesarean section or preterm birth less than 37 weeks' gestation (both very low quality), and the sample size was too small to assess perinatal mortality (very low‐quality). Large‐for‐gestational age, mortality or morbidity composite, neurosensory disability and preterm birth less than 34 weeks were not reported.
3. Pre‐prandial versus post‐prandial glucose monitoring (one study, 61 women): there was no clear difference between groups for caesarean section (RR 1.45, 95% CI 0.92 to 2.28; very low‐quality), large‐for‐gestational age (RR 1.16, 95% CI 0.73 to 1.85; very low‐quality) or glycaemic control (very low‐quality). The results for hypertensive disorders of pregnancy: pre‐eclampsia and perinatal mortality are not meaningful because these outcomes were too rare to show differences in a small sample (all very low‐quality). The study did not report the outcomes mortality or morbidity composite, neurosensory disability or preterm birth.
4. Automated telemedicine monitoring versus conventional system (three studies, 84 women): there was no clear difference for caesarean section (RR 0.96, 95% CI 0.62 to 1.48; one study, 32 women; very low‐quality), and mortality or morbidity composite in the one study that reported these outcomes. There were no clear differences for glycaemic control (very low‐quality). No studies reported hypertensive disorders of pregnancy, large‐for‐gestational age, perinatal mortality (stillbirth and neonatal mortality), neurosensory disability or preterm birth.
5.CGM versus intermittent monitoring (two studies, 225 women): there was no clear difference for pre‐eclampsia (RR 1.37, 95% CI 0.52 to 3.59; low‐quality), caesarean section (average RR 1.00, 95% CI 0.65 to 1.54; I² = 62%; very low‐quality) and large‐for‐gestational age (average RR 0.89, 95% CI 0.41 to 1.92; I² = 82%; very low‐quality). Glycaemic control indicated by mean maternal HbA1c was lower for women in the continuous monitoring group (mean difference (MD) ‐0.60 %, 95% CI ‐0.91 to ‐0.29; one study, 71 women; moderate‐quality). There was not enough evidence to assess perinatal mortality and there were no clear differences for preterm birth less than 37 weeks' gestation (low‐quality). Mortality or morbidity composite, neurosensory disability and preterm birth less than 34 weeks were not reported.
6. Constant CGM versus intermittent CGM (one study, 25 women): there was no clear difference between groups for caesarean section (RR 0.77, 95% CI 0.33 to 1.79; very low‐quality), glycaemic control (mean blood glucose in the 3rd trimester) (MD ‐0.14 mmol/L, 95% CI ‐2.00 to 1.72; very low‐quality) or preterm birth less than 37 weeks' gestation (RR 1.08, 95% CI 0.08 to 15.46; very low‐quality). Other primary (hypertensive disorders of pregnancy, large‐for‐gestational age, perinatal mortality (stillbirth and neonatal mortality), mortality or morbidity composite, and neurosensory disability) or GRADE outcomes (preterm birth less than 34 weeks' gestation) were not reported.
Authors' conclusions
This review found no evidence that any glucose monitoring technique is superior to any other technique among pregnant women with pre‐existing type 1 or type 2 diabetes. The evidence base for the effectiveness of monitoring techniques is weak and additional evidence from large well‐designed randomised trials is required to inform choices of glucose monitoring techniques.
PICO
Plain language summary
針對糖尿病孕婦可改善其疾病之血糖監測方法
此文獻回顧宗旨為何?
若媽媽在懷孕前已罹患糖尿病, 當她懷孕時母體與胎兒在懷孕、分娩、生產和產後的過程中皆會有較高的問題風險。在懷孕期間, 媽媽需以適當的措施監控血液中葡萄糖濃度(亦稱為血糖), 將血糖控制得宜。此考科藍回顧文獻旨在尋找在懷孕過程中最佳的血糖測量方法, 以利孕婦控制血糖並降低胎兒與母親的問題風險。我們收集並分析所有相關研究來回答這個問題(檢索日期:2016年11月)。
為何此議題很重要?
糖尿病會對孕婦及嬰兒帶來威脅, 包括早產、巨嬰症、分娩困難及增加剖腹產的機率。另外,風險尚包含嬰兒腦出血 (顱內出血)及增加生產時嬰兒肩膀卡住的狀況(肩難產)。出生後,嬰兒有低血糖(低血糖症)、黃疸及呼吸問題的風險增加。這些嬰兒大部分需送往加護病房進行照護。且在未來成長過程中,於孩童時期即罹患糖尿病的風險也會增加。
患有糖尿病的婦女在受孕和懷孕前三個月內若無控制良好,其會增加流產, 胎兒發育問題或死胎的風險。監測血糖的方法眾多,包括定期產前檢查, 自我監測, 或在懷孕期間使用特殊設備持續監測血糖。更精確的血糖測量方法可有效地控制血糖, 減少嬰兒及母親的潛在問題。
我們找到了哪些證據?
我們找到10個相關的臨床試驗研究, 共538名婦女及嬰兒。我們發現比較各種血糖監測方法的研究: 自我監測與標準照護、自我監測與醫院監測、餐前與餐後監測、葡萄糖監測、自動化與傳統監測系統、連續式血糖監測(CGM) 與間歇式監測及持續使用CGM 與間歇使用 CGM。這些試驗的執行國家有歐洲及美國。他們研究不同的監測方法, 並報導不同的結果。每項研究之受試婦女數量較少。研究證據的品質大多為非常低, 所以我們不能確定其結果。
結果並未表示哪種監測技術優於其他方法。這些監測技術對母親血糖或高血壓的控制並無明顯的差異。同樣地, 我們發現這些監測技術對母親剖腹產機率、巨嬰症、死亡或有嚴重健康問題的嬰兒數量及嬰兒出生過早 (早產) 的數量之影響亦無差異。我們不知道是否因為這些技術間並無差異, 或是這些技術之間有差異但研究結果並無呈現。
這些資料代表的意思?
此文獻回顧顯示目前尚無足夠證據可以肯定地說哪項血糖監測方法是最好的。尚需更多研究找出最佳的監測方法並可減低併發症。
Authors' conclusions
Summary of findings
| Self‐monitoring compared to standard care for women with pre‐existing diabetes | ||||||
| Patient or population: women with pre‐existing diabetes | ||||||
| Outcomes | Anticipated absolute effects* (95% CI) | Relative effect | № of participants | Quality of the evidence | Comments | |
| Risk with standard care | Risk with self‐monitoring | |||||
| Hypertensive disorders of pregnancy: pre‐eclampsia | Study population | (0 studies) | The included study did not report this outcome. | |||
| Hypertensive disorders of pregnancy: gestational hypertension | Study population | (0 studies) | The included study did not report this outcome. | |||
| Caesarean section | Study population | RR 0.78 | 28 | ⊕⊝⊝⊝ | ||
| 643 per 1000 | 501 per 1000 | |||||
| Glycaemic control during/end of treatment: Maternal HbA1c (%) | The mean maternal HbA1c was 7.2% | The mean maternal HbA1c with self‐monitoring was 0.10 lower (1.93 lower to 1.73 higher) | 28 | ⊕⊝⊝⊝ | ||
| Glycaemic control during/end of treatment: Maternal post‐prandial blood glucose (mmmol/L) | The mean maternal post‐prandial blood glucose was 5.3 mmol/L | MD 0.70 lower | 13 | ⊕⊝⊝⊝ | ||
| Large‐for‐gestational age | Study population | (0 studies) | The included study did not report this outcome. | |||
| Perinatal mortality | Study population | RR 3.00 | 28 | ⊕⊝⊝⊝ | There were no events in the standard care group and so anticipated absolute effects could not be calculated. | |
| 0 per 1000 | 0 per 1000 | |||||
| Preterm birth less than 37 weeks' gestation | Study population | (0 studies) | The included study did not report this outcome. | |||
| Preterm birth less than 34 weeks' gestation | Study population | (0 studies) | The included study did not report this outcome. | |||
| *The risk in the intervention group (and its 95% confidence interval) is based on the assumed risk in the comparison group and the relative effect of the intervention (and its 95% CI). | ||||||
| GRADE Working Group grades of evidence | ||||||
| 1 One study with design limitations. 2 Wide CI crossing the line of no effect, few events and small sample size. 3 Wide CI crossing the line of no effect, and small sample size. | ||||||
| Self‐monitoring compared to hospitalisation for women with pre‐existing diabetes | ||||||
| Patient or population: women with pre‐existing diabetes | ||||||
| Outcomes | Anticipated absolute effects* (95% CI) | Relative effect | № of participants | Quality of the evidence | Comments | |
| Risk with hospitalisation | Risk with self‐monitoring | |||||
| Hypertensive disorders of pregnancy: pre‐eclampsia | Study population | RR 4.26 | 100 | ⊕⊝⊝⊝ | ||
| 22 per 1000 | 93 per 1000 | |||||
| Hypertensive disorders of pregnancy: hypertension in pregnancy | Study population | RR 0.43 | 100 | ⊕⊝⊝⊝ | ||
| 87 per 1000 | 37 per 1000 | |||||
| Caesarean section | Study population | RR 0.96 | 100 | ⊕⊝⊝⊝ | ||
| 500 per 1000 | 480 per 1000 | |||||
| Glycaemic control during/end of treatment: maternal HbA1c | (0 studies) | The included study did not report this outcome. | ||||
| Glycaemic control during/end of treatment: maternal post‐prandial blood glucose | (0 studies) | The included study did not report this outcome. | ||||
| Large‐for‐gestational age | Study population | (0 studies) | The included study did not report this outcome. | |||
| Perinatal mortality | Study population | RR 0.85 | 100 | ⊕⊝⊝⊝ | ||
| 22 per 1000 | 18 per 1000 | |||||
| Preterm birth less than 37 weeks' gestation | Study population | RR 0.85 | 100 | ⊕⊝⊝⊝ | ||
| 304 per 1000 | 259 per 1000 | |||||
| Preterm birth less than 34 weeks' gestation | Study population | (0 studies) | The included study did not report this outcome. | |||
| *The risk in the intervention group (and its 95% confidence interval) is based on the assumed risk in the comparison group and the relative effect of the intervention (and its 95% CI). | ||||||
| GRADE Working Group grades of evidence | ||||||
| 1 One study with design limitations. 2 Wide CI crossing the line of no effect, few events and small sample size. | ||||||
| Pre‐prandial compared to post‐prandial glucose monitoring for women with pre‐existing diabetes | ||||||
| Patient or population: women with pre‐existing diabetes | ||||||
| Outcomes | Anticipated absolute effects* (95% CI) | Relative effect | № of participants | Quality of the evidence | Comments | |
| Risk with post‐prandial glucose monitoring | Risk with pre‐prandial | |||||
| Hypertensive disorders of pregnancy: pre‐eclampsia | Study population | RR 6.43 | 58 | ⊕⊝⊝⊝ | ||
| 33 per 1000 | 214 per 1000 | |||||
| Hypertensive disorders of pregnancy: gestational hypertension | Study population | (0 studies) | The included study did not report this outcome. | |||
| Caesarean section | Study population | RR 1.45 | 61 | ⊕⊝⊝⊝ | ||
| 467 per 1000 | 677 per 1000 | |||||
| Glycaemic control during/end of treatment: HbA1c (%) | The mean hbA1c was 6% | The mean maternal HbA1c with pre‐prandial monitoring as 0.30 higher (0.08 lower to 0.68 higher) | 61 | ⊕⊝⊝⊝ | ||
| Glycaemic control during/end of treatment: post‐prandial blood glucose | (0 studies) | The included study did not report this outcome. | ||||
| Large‐for‐gestational age | Study population | RR 1.16 | 61 | ⊕⊝⊝⊝ | ||
| 500 per 1000 | 580 per 1000 | |||||
| Perinatal mortality | Study population | RR 2.91 | 61 | ⊕⊝⊝⊝ | There were no events in the standard care group and so anticipated absolute effects could not be calculated. | |
| 0 per 1000 | 0 per 1000 | |||||
| Preterm birth less than 37 weeks | Study population | RR 1.33 | 61 | ⊕⊝⊝⊝ | ||
| 267 per 1000 | 355 per 1000 | |||||
| Preterm birth less than 34 weeks' gestation | Study population | (0 studies) | The included study did not report this outcome. | |||
| *The risk in the intervention group (and its 95% confidence interval) is based on the assumed risk in the comparison group and the relative effect of the intervention (and its 95% CI). | ||||||
| GRADE Working Group grades of evidence | ||||||
| 1 One study with design limitations. 2 Wide CI crossing the line of no effect, few events and small sample size. 3 Wide CI crossing the line of no effect, and small sample size. | ||||||
| Automated telemedicine monitoring compared to conventional for women with pre‐existing diabetes | ||||||
| Patient or population: women with pre‐existing diabetes | ||||||
| Outcomes | Anticipated absolute effects* (95% CI) | Relative effect | № of participants | Quality of the evidence | Comments | |
| Risk with conventional monitoring | Risk with automated telemedicine monitoring | |||||
| Hypertensive disorders of pregnancy: pre‐eclampsia, gestational hypertension | Study population | (0 studies) | The included studies did not report this outcome. | |||
| Hypertensive disorders of pregnancy: gestational hypertension | Study population | (0 studies) | The included studies did not report this outcome. | |||
| Caesarean section | Study population | RR 0.96 | 32 | ⊕⊝⊝⊝ | ||
| 733 per 1000 | 704 per 1000 | |||||
| Glycaemic control during/end of treatment: maternal HbA1c (%) | The mean maternal HbA1c ranged from 5.7 to 6.7% | The mean maternal HbA1c with automated telemedicine monitoring as 0.17 lower (0.82 lower to 0.48 higher) | 82 | ⊕⊝⊝⊝ | ||
| Glycaemic control during/end of treatment: maternal post‐prandial blood glucose (mmol/L) | The mean maternal post‐prandial blood glucose ranged from 6.9 to 7.6% | The mean post‐prandial blood glucose with automated telemedicine monitoring as 0.80 lower (1.67 lower to 0.08 higher) | 50 | ⊕⊝⊝⊝ | ||
| Large‐for‐gestational age | Study population | (0 studies) | The included studies did not report this outcome. | |||
| Perinatal mortality | Study population | (0 studies) | The included studies did not report this outcome. | |||
| Preterm birth less than 37 weeks' gestation | Study population | (0 studies) | The included studies did not report this outcome. | |||
| Preterm birth less than 34 weeks' gestation | Study population | (0 studies) | The included studies did not report this outcome. | |||
| *The risk in the intervention group (and its 95% confidence interval) is based on the assumed risk in the comparison group and the relative effect of the intervention (and its 95% CI). | ||||||
| GRADE Working Group grades of evidence | ||||||
| 1 One study with serious design limitations. 2 Wide CI crossing the line of no effect, few events and small sample size. 3 Studies had design limitations. 4 Statistical heterogeneity (I² = 82%). 5 Wide CI crossing the line of no effect, and small sample size. 6 Statistical heterogeneity (I² = 86%). | ||||||
| Continuous glucose monitoring compared to intermittent glucose monitoring for women with pre‐existing diabetes | ||||||
| Patient or population: women with pre‐existing diabetes | ||||||
| Outcomes | Anticipated absolute effects* (95% CI) | Relative effect | № of participants | Quality of the evidence | Comments | |
| Risk with intermittent glucose monitoring | Risk with continuous glucose monitoring | |||||
| Hypertensive disorders of pregnancy: pre‐eclampsia | Study population | RR 1.37 | 225 | ⊕⊕⊝⊝ | ||
| 56 per 1000 | 76 per 1000 | |||||
| Hypertensive disorders of pregnancy: gestational hypertension | Study population | (0 studies) | The included studies did not report this outcome. | |||
| Caesarean section | Study population | RR 1.00 | 225 | ⊕⊝⊝⊝ | ||
| 481 per 1000 | 481 per 1000 | |||||
| Glycaemic control during/end of treatment: maternal HbA1c (%) | The mean maternal HbA1c was 6.4% | The mean maternal HbA1c with continuous glucose monitoring was 0.60 lower (0.91 lower to 0.29 higher) | 71 | ⊕⊕⊕⊝ | ||
| Glycaemic control during/end of treatment: post‐prandial blood glucose | (0 studies) | The included studies did not report this outcome. | ||||
| Large‐for‐gestational age | Study population | RR 0.89 | 221 | ⊕⊝⊝⊝ | ||
| 410 per 1000 | 364 per 1000 | |||||
| Perinatal mortality | Study population | RR 0.82 | 71 | ⊕⊕⊝⊝ | ||
| 31 per 1000 | 26 per 1000 | |||||
| Preterm birth less than 37 weeks | Study population | RR 1.10 | 228 | ⊕⊕⊝⊝ | ||
| 167 per 1000 | 183 per 1000 | |||||
| Preterm birth less than 34 weeks' gestation | Study population | (0 studies) | The included studies did not report this outcome. | |||
| *The risk in the intervention group (and its 95% confidence interval) is based on the assumed risk in the comparison group and the relative effect of the intervention (and its 95% CI). | ||||||
| GRADE Working Group grades of evidence | ||||||
| 1 Wide CI crossing the line of no effect, few events and small sample size. 2 Statistical heterogeneity (I² = 62%). 3 Wide CI crossing the line of no effect, and small sample size. 4 Small sample size. 5 Statistical heterogeneity (I² = 82%). | ||||||
| Constant CGM compared to Intermittent CGM for women with pre‐existing diabetes | ||||||
| Patient or population: women with pre‐existing diabetes | ||||||
| Outcomes | Anticipated absolute effects* (95% CI) | Relative effect | № of participants | Quality of the evidence | Comments | |
| Risk with Intermittent CGM | Risk with constant CGM | |||||
| Hypertensive disorders of pregnancy: pre‐eclampsia | Study population | (0 studies) | The included study did not report this outcome. | |||
| Hypertensive disorders of pregnancy: gestational hypertension | Study population | (0 studies) | The included study did not report this outcome. | |||
| Caesarean section | Study population | RR 0.77 | 25 | ⊕⊝⊝⊝ | ||
| 538 per 1000 | 415 per 1000 | |||||
| Glycaemic control during/end of treatment: maternal HbA1c (3rd trimester) (%) | The mean maternal HbA1c (3rd trimester) was 6.23% | The mean maternal HbA1c with constant CGM was 0.09 lower (0.69 lower to 0.51 higher) | 25 | ⊕⊝⊝⊝ | ||
| Glycaemic control during/end of treatment: maternal blood glucose (3rd trimester) (mmmol/L) | The mean maternal blood glucose (3rd trimester) was 0 | The mean maternal blood glucose (3rd trimester) with constant CGM was 0.14 lower (2.00 lower to 1.72 higher) | 25 | ⊕⊝⊝⊝ | ||
| Large‐for‐gestational age | Study population | (0 studies) | The included study did not report this outcome. | |||
| Perinatal mortality | Study population | (0 studies) | The included study did not report this outcome. | |||
| Preterm birth less than 37 weeks' gestation | Study population | RR 1.08 | 25 | ⊕⊝⊝⊝ | ||
| 77 per 1000 | 83 per 1000 | |||||
| Preterm birth less than 34 weeks' gestation | Study population | (0 studies) | The included study did not report this outcome. | |||
| *The risk in the intervention group (and its 95% confidence interval) is based on the assumed risk in the comparison group and the relative effect of the intervention (and its 95% CI). | ||||||
| GRADE Working Group grades of evidence | ||||||
| 1 One study with design limitations. 2 Wide CI crossing the line of no effect, few events and small sample size. 3 Wide CI crossing the line of no effect, and small sample size. | ||||||
Background
Description of the condition
Types of diabetes
There are three main types of diabetes mellitus: type 1, type 2 and gestational diabetes mellitus (GDM). Type 1 or insulin‐dependent diabetes results from the body’s failure to produce sufficient insulin and accounts for a minority of the total burden of diabetes in a population. Type 2 diabetes results from a failure of the body to utilise insulin, causing high blood sugar levels. Type 2 diabetes alone constitutes about 85% to 95% of all diabetes globally (IDF 2010). Type 2 diabetes is a serious and growing global health problem that has evolved in association with rapid cultural and social changes, ageing populations, increasing urbanisation, dietary changes, reduced physical activity and other unhealthy lifestyle and behavioural patterns (WHO 1994). In GDM, women who were not previously diabetic develop carbohydrate intolerance resulting in hyperglycaemia (high blood sugar levels) with first onset or detection occurring during pregnancy (HAPO 2002). GDM develops in one in 25 pregnancies worldwide and it is associated with the increasing incidence of type 2 diabetes post‐pregnancy.
Prevalence of diabetes
Diabetes mellitus is found in every population in the world and it is estimated that 6.6% of the global population in the age group of 20 to 79 years old had diabetes in 2010. By 2030, it is estimated that 7.8% of the adult population will have diabetes (IDF 2010).
Diabetes mellitus complicates about 2% to 3% of all pregnancies. Approximately 90% of diabetes in pregnancy is accounted for by GDM. Pre‐existing type 1 and type 2 diabetes account for the remaining 10% of diabetes during pregnancy (Moore 2010). This review considers only the management of pre‐existing diabetes in pregnant women as a separate Cochrane review on GDM is being prepared (Gill 2014).
Complications of diabetes in pregnancy: for mother and baby
Women with diabetes of any kind are at increased risk of morbidity and mortality during pregnancy. Pregnancy outcomes for women with pre‐existing diabetes and their infants are poor compared to those for women who do not have diabetes (NICE 2008). The risks to both women and infants include fetal macrosomia (large baby), preterm birth, birth trauma (to mother and infant), induction of labour or caesarean section, miscarriage, congenital malformation, stillbirth, transient neonatal morbidity, neonatal death, obesity and/or diabetes developing later in the baby’s life (Gonzalez‐Gonzalez 2008; Kitzmiller 2008; NICE 2008).
Women with diabetes have an increased risk of an early miscarriage and are at increased risk of having a baby with malformations. Both of these risks are associated with less than optimal glycaemic control around the time of conception and in the first trimester. The risks appear to be approximately equivalent for women with type 1 and type 2 diabetes. The increased rate of spontaneous miscarriages and fetal malformation appear to be low when glycaemic control is moderately raised, and higher with increasingly poor glycaemic control (IDF 2010; Jensen 2009). Women with diabetes should be encouraged to obtain the best possible glycaemic control before conception (Kitzmiller 2010). Women with uncontrolled glycaemic levels should be discouraged from becoming pregnant until their blood glucose control can be improved.
Macrosomia, defined as infant birthweight greater than 4.5 kg, remains the commonest complication of pregnancy in women with diabetes (IDF 2010; Kitzmiller 2008; NICE 2008). Macrosomia occurs in 27% to 62% of infants of diabetic mothers compared with 10% of non‐diabetic mothers (Gabbe 2003). Nationwide studies from the Netherlands, the UK, and Denmark estimate that the risk of delivering a large‐for‐gestational age, or macrosomic infant in women with type 1 diabetes ranges from 48.8% to 62.5% (Kitzmiller 2008). Recent data confirm that women with type 2 diabetes have an equally high risk of delivering a macrosomic infant (ACOG 2005; ADA 2004; Roland 2005). For mothers with diabetes, macrosomia leads to an increased risk of perineal lacerations, complications in labour, and delivery by caesarean section (Slocum 2004). There are increased risks for the infants of intracranial haemorrhage, shoulder dystocia, neonatal hypoglycaemia, jaundice, and respiratory distress (Thomas 2006), as well as the longer‐term health risks of insulin resistance, obesity and type 2 diabetes (McElduff 2005). Overt diabetes is an undisputed factor for preterm birth (Sibai 2000).
Fetal hyperglycaemia causes fetal hypoxia and acidosis, which may explain the excess stillbirth rates observed in women with poorly controlled diabetes (Kitzmiller 2008). Infants with macrosomia due to poor maternal glycaemic control and fetal hyperinsulinaemia are more likely to develop obesity and glucose intolerance later in life (Fetita 2006; Kitzmiller 2008). Long‐term (five to 15 years) follow‐up studies of infants of mothers with diabetes suggest that poor glycaemic control during pregnancy has a negative influence on intellectual and psychomotor development (Kitzmiller 2008). Both findings highlight the prolonged effects on offspring of intrauterine exposure to diabetes (Fetita 2006; Kitzmiller 2008).
Glycaemic control prior to conception and in early pregnancy
The increased risks in women with diabetes of an early miscarriage and of having a baby with malformations are associated with suboptimal glycaemic control before or around the time of conception, and in the first trimester. Guidelines recommend that women should achieve the best possible glycaemic control before conception: women who improve their glycaemic control before conception have a reduced rate of fetal malformation (Fuhrmann 1983; IDF 2010; NICE 2008).
Maternal hyperglycaemia during the first few weeks of pregnancy is strongly associated with increased spontaneous abortions and major congenital malformations (Kitzmiller 1996; Ray 2001). After 12 weeks’ gestation, hyperglycaemia induces fetal hyperinsulinaemia, accelerated growth, and excess adiposity in animal models and in women with diabetes (Gabbe 2003). These risks appear to be approximately equivalent for women with type 1 and type 2 diabetes. The increased rate of spontaneous miscarriages appears to be low when the HbA1c is modestly raised, and higher with increasingly poor glycaemic control (Mills 1988; Rosenn 1991). The same pattern is also found with respect to the rate of fetal malformations (Greene 1989; Suhonen 2000).
Description of the intervention
Techniques of blood glucose monitoring
Glucose readings supply trend information that helps to identify and prevent unwanted periods of hypo‐ and hyperglycaemia that are associated with adverse outcomes for both mother and baby. Women with type 1 and type 2 diabetes are advised to self‐monitor their blood glucose throughout pregnancy (IDF 2010).
Techniques of blood glucose monitoring to be considered in this review include self‐monitoring of blood glucose (SMBG), continuous glucose monitoring (CGM) and clinic monitoring (for which timing and frequency of monitoring are also considered).
-
Self‐monitoring of blood glucose (SMBG) ‐ a glucose meter (glucometer), with or without memory, can be used to measure capillary glucose. Conventional intensified glucose monitoring is defined as three to four blood glucose measurements per day (ADA 2011). Post‐prandial glucose during pregnancy has been identified as the best predictor of neonatal macrosomia (de Veciana 1995; Moses 1999). Therefore, SMBG protocols for women with type 1 or type 2 diabetes during pregnancy stress the importance of measuring blood glucose after meals (Jovanovič 2009) while for non‐pregnant women with diabetes, pre‐prandial values are recommended (ADA 2011; NICE 2008).
-
Continuous glucose monitoring (CGM) ‐ the continuous glucose monitors currently available measure blood glucose either with minimal invasiveness through continuous measurement of interstitial fluid (ISF) or with the non‐invasive method of applying electromagnetic radiation through the skin to blood vessels in the body. The technologies for bringing a sensor into contact with ISF include inserting an indwelling sensor subcutaneously (into the abdominal wall or arm) to measure ISF in situ or harvesting this fluid by various mechanisms that compromise the skin barrier and delivering the fluid to an external sensor (Choleau 2002). After a warm‐up period of up to two hours and a device‐specific calibration process, each device’s sensor provides a blood glucose reading every one to 10 minutes for up to 72 hours with the minimally invasive technology and up to three months with the non‐invasive technology. CGM can provide up to 288 measurements a day (Murphy 2007).
-
Clinic monitoring refers to routine glucose monitoring during antenatal visits either using capillary or whole blood.
Timing and frequency of glucose monitoring
Post‐prandial glucose monitoring has been shown to be able to improve glycaemic control and thus reduce the risk of neonatal hypoglycaemia, macrosomia and caesarean delivery (de Veciana 1995), as well as to reduce the incidence of pre‐eclampsia and neonatal triceps skinfold thickness (Manderson 2003). Post‐prandial glucose values were most strongly associated with increased birthweight in the studies in which both pre‐ and post‐meal glucose were measured (Mello 2000).
Pregnant women with diabetes mellitus are advised to test fasting and one‐hour post‐prandial blood glucose levels after every meal during pregnancy and those taking insulin are encouraged to test their blood glucose before going to bed at night (NICE 2008). The American Diabetes Association also recommends SMBG before and after meals and occasionally at night time, to provide optimal results in pregnancy (Kitzmiller 2008).
The optimal frequency and timing of home glucose testing during pregnancy is unknown. In reality the frequency of glucose monitoring will depend on women's compliance, with few managing to carry out high numbers of tests daily (Kerssen 2006).
Educational approaches incorporating additional glucose testing after meals to improve glycaemic control in late gestation have shown potential to reduce birthweight (Howorka 2001).
Glycaemic control during pregnancy among women with pre‐existing diabetes
Pregnancy profoundly affects the management of diabetes (Gabbe 2003; Jovanovic 2006). Pregnancy is associated with changes in insulin sensitivity, which may lead to changes in plasma glucose levels. Hormonal changes during pregnancy cause a progressive increase in insulin resistance, necessitating intensive medical nutrition therapy and frequently adjusted insulin administration throughout the pregnancy. The control of hyperglycaemia in pregnant women with pre‐existing diabetes is essential in order to avoid the above mentioned adverse maternal and infant outcomes (Kitzmiller 2008). Macrosomia and other neonatal complications are minimised with intensified glycaemic control (Kerssen 2007; Kitzmiller 2008; Suhonen 2000).
If it is safely achievable, women with diabetes should aim to keep fasting blood glucose between 3.5 mmol/L and 5.9 mmol/L and one‐hour post‐prandial blood glucose below 7.8 mmol/L during pregnancy (NICE 2008); HbA1c should be kept below 6.0% (ADA 2011). Excellent glycaemic control throughout the pregnancy is associated with the lowest risk for both maternal, fetal and neonatal complications (Kitzmiller 2008). On the other hand, the targets of glycaemic control for non‐pregnant women with type 1 or type 2 diabetes are less stringent, i.e. fasting blood glucose to be 3.9 mmol/L to 7.2 mmol/L and HbA1c less than 7.0% (ADA 2011).
How the intervention might work
Maternal glucose levels in women with pre‐existing diabetes directly influence those of the fetus. Fetal metabolic complications may give rise to macrosomia, congenital malformation, stillbirth and increased perinatal mortality (IDF 2010; Kapoor 2007; Kitzmiller 2008; NICE 2008). Blood glucose monitoring allows adjustment of insulin dosage in relation to meal size and type, physical activity, stress and time of the day for women with pre‐existing diabetes during pregnancy (Davidson 2005). This will limit the maternal risk of hypoglycaemic episodes while avoiding prolonged periods of hyperglycaemia. However, the frequency and timing of glucose monitoring will also influence the maternal and fetal outcome.
Why it is important to do this review
Self‐monitoring of blood glucose is recommended as a key component of diabetes therapy during pregnancy and included in the management plan (IDF 2010; Kitzmiller 2008; NICE 2008). No existing systematic reviews consider the benefits of various techniques of blood glucose monitoring on maternal and infant outcomes among pregnant women with pre‐existing diabetes. The effectiveness of the various monitoring techniques is unclear. This systematic review aims to generate information to guide pregnant women with pre‐existing diabetes and their clinicians in their choice of monitoring techniques in order to optimise maternal and infant outcomes. All trials that evaluate any techniques of blood glucose monitoring among pregnant women with pre‐existing diabetes will be considered.
Objectives
To compare the techniques of blood glucose monitoring and their impact on maternal and infant outcomes among pregnant women with pre‐existing diabetes.
Methods
Criteria for considering studies for this review
Types of studies
We included randomised controlled trials, and in this version of the review, one quasi‐experimental trial. Cluster‐randomised trials were eligible for inclusion but none were identified. Trials using a cross‐over design were not eligible for inclusion. Abstracts were eligible for inclusion if sufficient information was provided to judge the quality and potential for bias of these trials.
Types of participants
Pregnant women with pre‐existing diabetes mellitus (type 1 or type 2). Women with gestational diabetes mellitus (GDM) were excluded.
Types of interventions
Techniques of blood glucose monitoring including self‐monitoring of blood glucose (SMBG), continuous glucose monitoring (CGM) or clinic monitoring. We also considered the timing and frequency of monitoring.
Types of outcome measures
For this update, we used the Cochrane Pregnancy and Childbirth core outcome set for reviews of diabetes in pregnancy, developed by the Cochrane Pregnancy and Childbirth Australasian satellite.
Primary outcomes
Mother
-
Hypertensive disorders of pregnancy (including pre‐eclampsia, pregnancy‐induced hypertension, eclampsia)
-
Caesarean section
Neonatal/infant
-
Large‐for‐gestational age
-
Perinatal mortality (stillbirth and neonatal mortality)
-
Mortality or morbidity composite
-
Neurosensory disability
Secondary outcomes
Mother
-
Induction of labour
-
Perineal trauma
-
Placental abruption
-
Postpartum haemorrhage
-
Postpartum infection
-
Weight gain during pregnancy
-
Adherence to the intervention
-
Behaviour changes associated with the intervention
-
Relevant biomarker changes associated with the intervention (e.g. adiponectin, free fatty acids, triglycerides, high‐density lipoproteins, low‐density lipoproteins, insulin)
-
Sense of well‐being and quality of life
-
Views of the intervention
-
Breastfeeding (e.g. at discharge, six weeks postpartum)
-
Use of additional pharmacotherapy
-
Glycaemic control during/end of treatment (as defined by trialists) (e.g. HbA1c, fructosamine, fasting blood glucose, post‐prandial blood glucose)
-
Maternal hypoglycaemia
-
Maternal mortality
-
Miscarriage
Long‐term maternal outcomes
-
Postnatal depression
-
Postnatal weight retention or return to pre‐pregnancy weight
-
Body mass index (BMI)
-
GDM in a subsequent pregnancy
-
Type 1 diabetes
-
Impaired glucose tolerance
-
Cardiovascular health (as defined by trialists, including blood pressure, hypertension, cardiovascular disease, metabolic syndrome)
Neonatal/infant
-
Stillbirth
-
Neonatal mortality
-
Gestational age at birth
-
Preterm birth (less than 37 weeks' gestation and less than 34 weeks' gestation)
-
Apgar score (less than seven at five minutes)
-
Macrosomia
-
Small‐for‐gestational age
-
Birthweight and z‐score
-
Head circumference and z‐score
-
Length and z‐score
-
Ponderal index
-
Adiposity (e.g. BMI, skinfold thickness)
-
Shoulder dystocia
-
Bone fracture
-
Nerve palsy
-
Respiratory distress syndrome
-
Hypoglycaemia (variously defined)
-
Hyperbilirubinaemia
-
Neonatal hypocalcaemia
-
Polycythaemia
-
Relevant biomarker changes associated with the intervention (e.g. cord c peptide, cord insulin)
-
Major and minor anomalies
Later infant and childhood secondary outcomes
-
Weight and z scores
-
Height and z scores
-
Head circumference and z scores
-
Adiposity (e.g. as measured by BMI, skinfold thickness)
-
Blood pressure
-
Type 1 diabetes
-
Type 2 diabetes
-
Impaired glucose tolerance
-
Dyslipidaemia or metabolic syndrome
-
Educational achievement
Child in adulthood
-
Weight
-
Height
-
Adiposity (e.g. as measured by BMI, skinfold thickness)
-
Cardiovascular health (as defined by trialists, including blood pressure, hypertension, cardiovascular disease, metabolic syndrome)
-
Type 1 diabetes
-
Type 2 diabetes
-
Impaired glucose tolerance
-
Dyslipidaemia or metabolic syndrome
-
Employment, education and social status/achievement
Health service use
-
Number of hospital or health professional visits (e.g. midwife, obstetrician, physician, dietician, diabetic nurse)
-
Number of antenatal visits or admissions
-
Length of antenatal stay
-
Neonatal intensive care unit admission
-
Length of postnatal stay (mother)
-
Length of postnatal stay (baby)
-
Costs to families associated with the management provided
-
Costs associated with the intervention
-
Cost of maternal care
-
Cost of offspring care
Not pre‐specified
-
Birth trauma (shoulder dystocia, bone fracture, nerve palsy) (not pre‐specified as a composite)
-
Neonatal glucose at age one hour
-
Transient tachypnoea
-
Diabetic ketoacidosis
-
Feeding difficulties
Search methods for identification of studies
The following methods section of this review is based on a standard template used by Cochrane Pregnancy and Childbirth.
Electronic searches
We searched Cochrane Pregnancy and Childbirth’s Trials Register by contacting their Information Specialist (30 November 2016).
The Register is a database containing over 22,000 reports of controlled trials in the field of pregnancy and childbirth. For full search methods used to populate Pregnancy and Childbirth’s Trials Register including the detailed search strategies for CENTRAL, MEDLINE, Embase and CINAHL; the list of handsearched journals and conference proceedings, and the list of journals reviewed via the current awareness service, please follow this link to the editorial information about the Cochrane Pregnancy and Childbirth in the Cochrane Library and select the ‘Specialized Register ’ section from the options on the left side of the screen.
Briefly, the Cochrane Pregnancy and Childbirth’s Trials Register is maintained by their Information Specialist and contains trials identified from:
-
monthly searches of the Cochrane Central Register of Controlled Trials (CENTRAL);
-
weekly searches of MEDLINE (Ovid);
-
weekly searches of Embase (Ovid);
-
monthly searches of CINAHL (EBSCO);
-
handsearches of 30 journals and the proceedings of major conferences;
-
weekly current awareness alerts for a further 44 journals plus monthly BioMed Central email alerts.
Search results are screened by two people and the full text of all relevant trial reports identified through the searching activities described above is reviewed. Based on the intervention described, each trial report is assigned a number that corresponds to a specific Pregnancy and Childbirth review topic (or topics), and is then added to the Register. The Information Specialist searches the Register for each review using this topic number rather than keywords. This results in a more specific search set which has been fully accounted for in the relevant review sections (Included studies; Excluded studies; Ongoing studies).
Searching other resources
Where studies could be accessed only as abstracts, we contacted the study authors for more details. It was intended that these trials would be included in the review if sufficient information was provided to judge the quality and potential for bias of these trials.
We searched the reference lists of retrieved studies.
We did not apply any language or date restrictions.
Data collection and analysis
For methods used in the previous version of this review, seeMoy 2014.
For this update, the following methods were used for assessing the seven reports that were identified as a result of the updated search.
The following methods section of this review is based on a standard template used by Cochrane Pregnancy and Childbirth.
Selection of studies
Two review authors independently assessed for inclusion all the potential studies identified as a result of the search strategy. We resolved any disagreement through discussion or, if required, we consulted a third review author.
Data extraction and management
We designed a form to extract data. For eligible studies, two review authors extracted the data using the agreed form. We resolved discrepancies through discussion or, if required, we consulted a third review author. Data were entered into Review Manager software (RevMan 2014) and checked for accuracy.
When information regarding any of the above was unclear, we planned to contact authors of the original reports to provide further details.
Assessment of risk of bias in included studies
Two review authors independently assessed risk of bias for each study using the criteria outlined in the Cochrane Handbook for Systematic Reviews of Interventions (Higgins 2011). Any disagreement was resolved by discussion or by involving a third assessor.
(1) Random sequence generation (checking for possible selection bias)
We described for each included study the method used to generate the allocation sequence in sufficient detail to allow an assessment of whether it should produce comparable groups.
We assessed the method as:
-
low risk of bias (any truly random process, e.g. random number table; computer random number generator);
-
high risk of bias (any non‐random process, e.g. odd or even date of birth; hospital or clinic record number);
-
unclear risk of bias.
(2) Allocation concealment (checking for possible selection bias)
We described for each included study the method used to conceal allocation to interventions prior to assignment and assessed whether intervention allocation could have been foreseen in advance of, or during recruitment, or changed after assignment.
We assessed the methods as:
-
low risk of bias (e.g. telephone or central randomisation; consecutively numbered sealed opaque envelopes);
-
high risk of bias (open random allocation; unsealed or non‐opaque envelopes, alternation; date of birth);
-
unclear risk of bias.
(3.1) Blinding of participants and personnel (checking for possible performance bias)
We described for each included study the methods used, if any, to blind study participants and personnel from knowledge of which intervention a participant received. We considered that studies were at low risk of bias if they were blinded, or if we judged that the lack of blinding was unlikely to affect results. We assessed blinding separately for different outcomes or classes of outcomes.
We assessed the methods as:
-
low, high or unclear risk of bias for participants;
-
low, high or unclear risk of bias for personnel.
(3.2) Blinding of outcome assessment (checking for possible detection bias)
We described for each included study the methods used, if any, to blind outcome assessors from knowledge of which intervention a participant received. We assessed blinding separately for different outcomes or classes of outcomes.
We assessed methods used to blind outcome assessment as:
-
low, high or unclear risk of bias.
(4) Incomplete outcome data (checking for possible attrition bias due to the amount, nature and handling of incomplete outcome data)
We described for each included study, and for each outcome or class of outcomes, the completeness of data including attrition and exclusions from the analysis. We stated whether attrition and exclusions were reported and the numbers included in the analysis at each stage (compared with the total randomised participants), reasons for attrition or exclusion where reported, and whether missing data were balanced across groups or were related to outcomes. Where sufficient information was reported, or could be supplied by the trial authors, we planned to re‐include missing data in the analyses which we undertook.
We assessed methods as:
-
low risk of bias (e.g. no missing outcome data; missing outcome data balanced across groups);
-
high risk of bias (e.g. numbers or reasons for missing data imbalanced across groups; ‘as treated’ analysis done with substantial departure of intervention received from that assigned at randomisation);
-
unclear risk of bias.
(5) Selective reporting (checking for reporting bias)
We described for each included study how we investigated the possibility of selective outcome reporting bias and what we found.
We assessed the methods as:
-
low risk of bias (where it is clear that all of the study’s pre‐specified outcomes and all expected outcomes of interest to the review have been reported);
-
high risk of bias (where not all the study’s pre‐specified outcomes have been reported; one or more reported primary outcomes were not pre‐specified; outcomes of interest are reported incompletely and so cannot be used; study fails to include results of a key outcome that would have been expected to have been reported);
-
unclear risk of bias.
(6) Other bias (checking for bias due to problems not covered by (1) to (5) above)
We described for each included study any important concerns we had about other possible sources of bias.
(7) Overall risk of bias
We made explicit judgements about whether studies were at high risk of bias, according to the criteria given in the Handbook (Higgins 2011). With reference to (1) to (6) above, we planned to assess the likely magnitude and direction of the bias and whether we considered it is likely to impact on the findings. In future updates, we will explore the impact of the level of bias through undertaking sensitivity analyses ‐ seeSensitivity analysis.
Assessment of the quality of the evidence using the GRADE approach
For this update the quality of the evidence was assessed using the GRADE approach as outlined in the GRADE handbook in order to assess the quality of the body of evidence relating to the following outcomes for all comparisons.
-
Hypertensive disorders of pregnancy (pre‐eclampsia, gestational hypertension)
-
Caesarean section
-
Glycaemic control during/end of treatment (HbA1c, post‐prandial blood glucose)
-
Large‐for‐gestational age
-
Perinatal mortality
-
Preterm birth (less than 37 weeks' gestation and less than 34 weeks' gestation)
We used the GRADEpro Guideline Development Tool to import data from Review Manager 5.3 (RevMan 2014) in order to create ’Summary of findings’ tables. A summary of the intervention effect and a measure of quality for each of the above outcomes was produced using the GRADE approach. The GRADE approach uses five considerations (study limitations, consistency of effect, imprecision, indirectness and publication bias) to assess the quality of the body of evidence for each outcome. The evidence can be downgraded from 'high quality' by one level for serious (or by two levels for very serious) limitations, depending on assessments for risk of bias, indirectness of evidence, serious inconsistency, imprecision of effect estimates or potential publication bias.
Measures of treatment effect
Dichotomous data
For dichotomous data, we presented results as summary risk ratio with 95% confidence intervals.
Continuous data
We used the mean difference if outcomes were measured in the same way between trials. In future updates, if appropriate, we will use the standardised mean difference to combine trials that measure the same outcome, but use different methods.
Unit of analysis issues
Trials with more than two intervention groups
Had we included trials with more than two techniques of glucose monitoring, we planned to analyse them according to the methods described in the Cochrane Handbook for Systematic Reviews of Interventions (Higgins 2011); the relevant pair of interventions would have been selected and the others excluded.
Cluster‐randomised trials
We did not identify any cluster‐randomised trials for inclusion. However, in future updates, if we identify any cluster‐randomised trials we will include them in the analyses along with individually‐randomised trials. We will adjust their sample sizes using the methods described in the CochraneHandbook using an estimate of the intracluster correlation co‐efficient (ICC) derived from the trial (if possible), from a similar trial or from a study of a similar population. If we use ICCs from other sources, we will report this and conduct sensitivity analyses to investigate the effect of variation in the ICC. If we identify both cluster‐randomised trials and individually‐randomised trials, we plan to synthesise the relevant information. We will consider it reasonable to combine the results from both if there is little heterogeneity between the study designs and the interaction between the effect of intervention and the choice of randomisation unit is considered to be unlikely. We will also acknowledge heterogeneity in the randomisation unit and perform a sensitivity analysis to investigate the effects of the randomisation unit.
Dealing with missing data
For included studies, levels of attrition were noted. In future updates, if more eligible studies are included, the impact of including studies with high levels of missing data in the overall assessment of treatment effect will be explored by using sensitivity analysis.
For all outcomes, analyses were carried out, as far as possible, on an intention‐to‐treat basis, i.e. we attempted to include all participants randomised to each group in the analyses. The denominator for each outcome in each trial was the number randomised minus any participants whose outcomes were known to be missing.
Assessment of heterogeneity
We assessed statistical heterogeneity in each meta‐analysis using the Tau², I² and Chi² statistics. We regarded heterogeneity as substantial if an I² was greater than 30% and either a Tau² was greater than zero, or there was a low P value (less than 0.10) in the Chi² test for heterogeneity. Had we identified substantial heterogeneity (above 30%), we planned to explore it by pre‐specified subgroup analysis.
Assessment of reporting biases
In future updates, if there are 10 or more studies in the meta‐analysis we will investigate reporting biases (such as publication bias) using funnel plots. We will assess funnel plot asymmetry visually. If asymmetry is suggested by a visual assessment, we will perform exploratory analyses to investigate it.
Data synthesis
We carried out statistical analysis using the Review Manager software (RevMan 2014). We used fixed‐effect meta‐analysis for combining data where it was reasonable to assume that studies were estimating the same underlying treatment effect: i.e. where trials were examining the same intervention, and the trials’ populations and methods were judged sufficiently similar.
If there was clinical heterogeneity sufficient to expect that the underlying treatment effects differed between trials, or if substantial statistical heterogeneity was detected, we used random‐effects meta‐analysis to produce an overall summary, if an average treatment effect across trials was considered clinically meaningful. The random‐effects summary was treated as the average range of possible treatment effects and we discuss the clinical implications of treatment effects differing between trials. If the average treatment effect was not clinically meaningful, we did not combine trials. Where we used random‐effects analyses, the results are presented as the average treatment effect with 95% confidence intervals, and the estimates of Tau² and I².
Subgroup analysis and investigation of heterogeneity
Had we identified substantial heterogeneity, we planned to investigate it using subgroup analyses and to consider whether an overall summary was meaningful, and if it was, to use a random‐effects analysis to produce it.
We planned to restrict subgroup analyses to primary outcomes for the following subgroups:
-
types of diabetes mellitus (type 1 versus type 2 diabetes);
-
glycaemic control prior to pregnancy (pre‐pregnancy HbA1c within target range versus pre‐pregnancy HbA1c out of target range).
However, we did not carry out any subgroup analysis as there were too few trials included in any one comparison. Data for outcomes in included trials were also not reported separately by type of diabetes. Pre‐pregnancy glycaemic control for all women was comparable at baseline. These analyses will be conducted in future updates of the review, if more data become available.
Sensitivity analysis
Sensitivity analysis was used to explore differences between fixed‐effect or random‐effects analyses for outcomes with statistical heterogeneity.
Sensitivity analysis was planned to assess the effect on pooled results of studies considered to have a high risk of bias. However, due to the scarcity of data this analysis was not carried out. If more data become available, the planned sensitivity analysis will be carried out in future updates.
Results
Description of studies
See Characteristics of included studies; Characteristics of excluded studies.
Results of the search
The updated search (30 November 2016) identified seven trial reports in addition to the 21 trial reports identified in the original search (6 August 2013). (See Figure 1 and Figure 2 for study flow diagrams for the original search and updated search respectively).

Study flow diagram.

Study flow diagram 2016
Of the seven reports in the updated search, five were additional reports for previously identified studies (Bartholomew 2011; Feig 2012; Secher 2013), one previously ongoing study has been included (Dalfrà 2009), and one study was excluded due to being a cross‐over trial (Bartholomew 2011).
There are now 10 studies (18 reports) included in the review (Dalfrà 2009; Di Biase 1997; Hanson 1984; Manderson 2003; Murphy 2008; Petrovski 2011; Secher 2013; Stubbs 1980; Varner 1983; Wojcicki 2001, see Characteristics of included studies). Four trials have been excluded (Bartholomew 2011; NCT01630759; Temple 2006; Walker 1999, see Characteristics of excluded studies), and two studies are ongoing (Feig 2012; Voormolen 2012, see Characteristics of ongoing studies).
Included studies
Three of the 10 included trials were from the UK (Manderson 2003; Murphy 2008; Stubbs 1980), two were from Italy (Dalfrà 2009; Di Biase 1997), and one each was from Sweden (Hanson 1984), Denmark (Secher 2013), Macedonia (Petrovski 2011), Poland (Wojcicki 2001) and the USA (Varner 1983).
For full details, see Characteristics of included studies.
Participants
The trials included in this review involved a total of 538 women; 468 with type 1 diabetes and 70 with type 2 diabetes. Hanson 1984, Murphy 2008 and Secher 2013 included women with pre‐existing type 1 and type 2 diabetes. Only women with pre‐existing type 1 diabetes were eligible to participate in Di Biase 1997,Manderson 2003,Petrovski 2011,Stubbs 1980,Varner 1983, and Wojcicki 2001. Women with pre‐existing type 1 diabetes and gestational diabetes participated in Dalfrà 2009, however the results are presented separately so only data for women with type 1 diabetes are included in this review. The ethnicity of the participants was not mentioned in all trials. As these trials originated from the European countries and the USA, it is assumed that majority of the participants were white or Caucasians.
Intervention and comparison
Stubbs 1980 and Varner 1983 compared self‐monitoring of blood glucose (SMBG) with standard care, while Hanson 1984 compared self‐monitoring with hospitalisation. Manderson 2003 compared timing of glucose monitoring, i.e. pre‐prandial versus post‐prandial. Pre‐prandial refers to measurement of blood glucose before meals while post‐prandial refers to blood glucose measured two hours after a meal. Automated telemedicine monitoring versus conventional system were compared in studies by Dalfrà 2009, Di Biase 1997 and Wojcicki 2001. Continuous glucose monitoring (CGM) was compared with intermittent glucose monitoring in trials by Murphy 2008 and Secher 2013. Petrovski 2011 compared constant CGM with intermittent CGM. Automated telemedicine monitoring refers to automated transmission of blood glucose values via telephone or internet to the physicians, which allows immediate attention from the physicians. While CGM refers to glucose measured in subcutaneous tissues every 10 seconds and an average value is stored every five minutes, providing up to 288 measurements per day. As different techniques or timing of glucose monitoring were compared, blinding of neither participants nor assessors was feasible. However, since outcome measures were objective it is unlikely that lack of blinding introduced a risk of bias.
Outcomes
Primary outcomes were hypertensive disorders of pregnancy (pre‐eclampsia was reported by Hanson 1984; Manderson 2003; Murphy 2008;Secher 2013, gestational hypertension was reported by Hanson 1984), caesarean section (reported by Dalfrà 2009; Hanson 1984; Manderson 2003; Murphy 2008; Petrovski 2011; Secher 2013; Varner 1983), large‐for‐gestational age (reported by Manderson 2003; Murphy 2008;Secher 2013, defined as birthweight 90th centile or above), perinatal mortality (reported by Hanson 1984; Manderson 2003; Murphy 2008;Varner 1983), neonatal mortality or morbidity composite (reported by Dalfrà 2009; Varner 1983), and neurosensory disability (not reported by any trials).
Secondary maternal outcomes reported by the included studies were placental abruption (reported by Hanson 1984), weight gain during pregnancy (reported by Dalfrà 2009; Manderson 2003;Petrovski 2011), use of additional pharmacotherapy (use of additional insulin therapy reported by Dalfrà 2009; insulin dose reported by Di Biase 1997; Manderson 2003;Petrovski 2011), glycaemic control during/end of treatment (HbA1c reported by Dalfrà 2009; Di Biase 1997; Manderson 2003; Murphy 2008; Petrovski 2011; Varner 1983;Wojcicki 2001; fasting blood glucose reported by; post‐prandial blood glucose reported by), maternal hypoglycaemia (reported by Petrovski 2011) and miscarriage (reported by Murphy 2008; Secher 2013;Varner 1983).
Secondary perinatal/neonatal outcomes reported by the included studies were stillbirth (reported by Manderson 2003), neonatal mortality (reported by Murphy 2008; Varner 1983), gestational age at birth (reported by Dalfrà 2009; Di Biase 1997; Manderson 2003; Murphy 2008; Varner 1983; Wojcicki 2001), preterm birth less than 37 weeks' gestation (reported by Hanson 1984; Manderson 2003; Murphy 2008; Petrovski 2011; Secher 2013), macrosomia (reported by Dalfrà 2009; Manderson 2003; Petrovski 2011, defined as birthweight greater than 4 kg in all three studies), small‐for‐gestational age (reported by Murphy 2008 defined as birthweight 10th centile or below), birthweight (reported by Dalfrà 2009; Manderson 2003; Murphy 2008; Stubbs 1980; Varner 1983), adiposity (triceps skinfold thickness and subscapular skinfold thickness reported by Manderson 2003), respiratory distress syndrome (reported by Hanson 1984; Manderson 2003; Varner 1983), hypoglycaemia (reported by Hanson 1984; Manderson 2003; Murphy 2008; Petrovski 2011; Secher 2013; Varner 1983), hyperbilirubinaemia (reported by Hanson 1984; Manderson 2003; Varner 1983), neonatal hypocalcaemia (reported by Varner 1983), polycythaemia (reported by Varner 1983), relevant biomarker changes associated with the intervention (neonatal cord vein c‐peptide reported by Varner 1983, cord IGF‐1 reported by Manderson 2003), and major anomalies (reported by Hanson 1984; Murphy 2008).
The only secondary health service use outcomes reported were antenatal hospital admission (reported by Hanson 1984) and neonatal intensive care admissions (reported by Manderson 2003; Murphy 2008).
Outcomes that were not pre‐specified, but are reported in this review are maternal diabetic ketoacidosis (reported by Petrovski 2011), birth trauma (shoulder dystocia, bone fracture and nerve palsy, pre‐specified as individual outcomes but reported as a composite by Manderson 2003), neonatal glucose at age one hour (reported by Manderson 2003), transient tachypnoea (reported by Manderson 2003), and feeding difficulties (reported by Hanson 1984).
Secondary maternal outcomes not reported by any of the included studies were: induction of labour, perineal trauma, postpartum haemorrhage, postpartum infection, adherence to the intervention, behaviour changes associated with the intervention, relevant biomarker changes associated with the intervention (e.g. adiponectin, free fatty acids, triglycerides, high‐density lipoproteins, low‐density lipoproteins, insulin), sense of well‐being and quality of life, views of the intervention, maternal mortality.
Secondary perinatal/neonatal outcomes not reported by any of the included studies were: preterm birth less than 34 weeks' gestation, Apgar score (less than seven at five minutes) head circumference and z‐score, length and z‐score, ponderal index, adiposity measured by body mass index, and minor anomalies.
Health service use outcomes not reported by any of the included studies were: health service use: number of hospital or health professional visits (e.g. midwife, obstetrician, physician, dietician, diabetic nurse), number of antenatal visits, length of antenatal stay, length of postnatal stay (mother), length of postnatal stay (baby), costs to families associated with the management provided, costs associated with the intervention, cost of maternal care, and cost of offspring care.
No studies reported long‐term maternal outcomes (postnatal depression, postnatal weight retention or return to pre‐pregnancy weight, body mass index, impaired glucose tolerance, cardiovascular health (as defined by trialists, including blood pressure, hypertension, cardiovascular disease, metabolic syndrome)), later infant or childhood outcomes (weight and z scores, height and z scores, head circumference and z scores, adiposity (e.g. as measured by body mass index, skinfold thickness), blood pressure, type 1 diabetes, type 2 diabetes, impaired glucose tolerance, dyslipidaemia or metabolic syndrome, educational achievement), or child in adulthood outcomes (weight, height, adiposity (e.g. as measured by body mass index, skinfold thickness), cardiovascular health (as defined by trialists, including blood pressure, hypertension, cardiovascular disease, metabolic syndrome), type 1 diabetes, type 2 diabetes, impaired glucose tolerance, dyslipidaemia or metabolic syndrome, employment, education and social status/achievement).
Some outcomes were reported in a form that could not be used in this review. Hanson 1984 reported the median antenatal hospital stay and neonatal hospital stay, did not report the standard deviation of blood glucose values, and only reported HbA1c graphically. Manderson 2003 reported the median and interquartile range for cord insulin and length of stay in neonatal unit, and Secher 2013 reported weight gain in pregnancy, HbA1c, plasma glucose, gestational age at birth, and birthweight as median and range. Where results were reported as medians, we felt it was unlikely that the results were normally distributed, and excluded them from meta‐analyses. Percentage of maternal hypoglycaemic episodes was reported by Wojcicki 2001, however the total of all blood glucose data were not available, therefore the frequency was not estimable.
See the Characteristics of included studies table for more details.
Excluded studies
Bartholomew 2011 was excluded as it is a cross‐over trial. Two trial registrations (NCT01630759; Walker 1999) were excluded; the former was a trial on women with gestational diabetes mellitus (GDM) while the latter was a clinical trial registration containing insufficient evidence to assess. We contacted the author, but there were no available data or published reports. Temple 2006 was excluded as it was an abstract on an observational study of eight type 1 diabetic pregnant women using continuous glucose monitoring system (CGMS).
See the Characteristics of excluded studies table for more details.
Risk of bias in included studies
One of the 10 included studies was at high risk of bias (Dalfrà 2009), five studies were at moderate risk of bias (Hanson 1984; Manderson 2003; Petrovski 2011; Stubbs 1980; Varner 1983) and four studies were at low to moderate risk of bias (Di Biase 1997; Murphy 2008; Secher 2013; Wojcicki 2001). See Figure 3 and Figure 4.

'Risk of bias' summary: review authors' judgements about each risk of bias item for each included study.

'Risk of bias' graph: review authors' judgements about each risk of bias item presented as percentages across all included studies.
Allocation
Random sequence generation
Only three studies (Murphy 2008; Secher 2013; Varner 1983) described the random sequence generation using computer‐generated random numbers or random number sequence (low risk of bias). Six trials (Di Biase 1997; Hanson 1984; Manderson 2003; Petrovski 2011; Stubbs 1980; Wojcicki 2001) did not report how the sequence was generated (unclear risk of bias). One study was quasi‐randomised, allocating women to alternating groups (Dalfrà 2009) (high risk of bias).
Allocation concealment
Adequate and secure concealment of allocation was described in three trials (low risk of bias) (Manderson 2003; Murphy 2008; Secher 2013), where sealed envelopes were used in the first two trials while the third (Secher 2013) used an automated telephone allocation service (Paravox) provided by an independent organisation. There was no concealment of allocation in Wojcicki 2001 and Dalfrà 2009 (high risk of bias). The other trials only mentioned the participants were randomly allocated into intervention or control groups without describing if there was any concealment of allocation (unclear risk of bias).
Blinding
There was no blinding in participants or outcome assessors in any of the trials. As the participants were requested to use certain technique of glucose monitoring by personnel taking care of them, it was not feasible to blind either participants or outcome assessors. However, as all outcome measures were objective, the lack of blinding is unlikely to have effected the outcomes (low risk of bias).
Incomplete outcome data
Four trials had high risk of bias for incomplete outcome data. Reasons given for attrition were women not completing the questionnaire (Dalfrà 2009), severe drug addiction, spontaneous abortions and death of mother (Hanson 1984), no results for analysis participants (Manderson 2003) and spontaneous miscarriage (Varner 1983). In other included studies, all women were accounted for in the analysis, or rates of attrition were described (low risk of bias). Di Biase 1997 and Wojcicki 2001 reported all outcome data. Four trials reported using intention‐to‐treat analysis (Murphy 2008; Petrovski 2011; Secher 2013; Stubbs 1980).
Selective reporting
It was unclear if there was any selective reporting in six trials (Dalfrà 2009; Murphy 2008; Petrovski 2011; Secher 2013; Stubbs 1980; Varner 1983) (unclear risk of bias); the other four reported all outcome data (Di Biase 1997; Hanson 1984; Manderson 2003; Wojcicki 2001) (low risk of bias).
Other potential sources of bias
There were no other obvious potential sources of bias with the exception of Dalfrà 2009, which did not use an intention‐to‐treat analysis, and there was no sample size calculation, or information on whether groups were comparable at baseline.
Effects of interventions
See: Summary of findings for the main comparison Self‐monitoring compared to standard care for women with pre‐existing diabetes; Summary of findings 2 Self‐monitoring compared to hospitalisation for women with pre‐existing diabetes; Summary of findings 3 Pre‐prandial compared to post‐prandial glucose monitoring for women with pre‐existing diabetes; Summary of findings 4 Automated telemedicine monitoring compared to conventional for women with pre‐existing diabetes; Summary of findings 5 Continuous glucose monitoring compared to intermittent glucose monitoring for women with pre‐existing diabetes; Summary of findings 6 Constant CGM compared to Intermittent CGM for women with pre‐existing diabetes
As there were various methods of glucose monitoring being implemented in the included trials, we used the following comparisons.
-
Self‐monitoring versus standard care
-
Self‐monitoring versus hospitalisation
-
Pre‐prandial versus post‐prandial glucose monitoring
-
Automated telemedicine monitoring versus conventional system
-
Continuous glucose monitoring (CGM) versus intermittent monitoring
-
Constant CGM versus intermittent CGM
Comparison 1 ‐ Self‐monitoring versus standard care
See summary of findings Table for the main comparison.
Two trials (Stubbs 1980; Varner 1983) compared self‐monitoring with standard care. In one trial (Stubbs 1980), a total of 13 type 1 diabetic (T1DM) pregnant women were randomly allocated into self‐monitoring of blood glucose (SMBG) at home, seven times a day, twice per week. Another six women were allocated to standard care (urine check four times daily) and random blood glucose testing measured fortnightly during clinic visits.
In the other trial (Varner 1983), 30 T1DM women were assigned to self‐monitoring (n = 15) and standard care (n = 15). One woman in each group had a first trimester spontaneous miscarriage, so results are presented for the remaining 28 women and infants. The self‐monitoring group was required to monitor fasting plus two‐hour post‐prandial morning, afternoon and evening glucose daily, while the standard care group were measured one day per week.
Primary outcomes
There was no clear difference in caesarean section (risk ratio (RR) 0.78, 95% confidence interval (CI) 0.40 to 1.49, one study, 28 women, Analysis 1.1, very low‐quality evidence). One study (Varner 1983) reported perinatal mortality and neonatal mortality and morbidity composite, however it was too small to show any differences between groups (perinatal mortality: RR 3.00, 95% CI 0.13 to 67.91, one study, 28 infants, very low‐quality evidence, Analysis 1.2; RR 3.00, 95% CI 0.13 to 67.91, one study, 28 infants, Analysis 1.3).
Hypertensive disorders of pregnancy, large‐for‐gestational age and neurosensory disability were not reported in either study.
Secondary outcomes
There was no clear difference in maternal glycaemic control between self‐monitoring and standard care for post‐prandial blood glucose (mean difference (MD) ‐0.70 mmol/L, 95% CI ‐2.15 to 0.75; one study, 13 women, Analysis 1.4, very low‐quality evidence), or HbA1c (MD ‐0.10 %, 95% CI ‐1.93 to 1.73, one study, 28 women, Analysis 1.5, very low‐quality evidence). There were too few participants to show any differences in miscarriage (RR 1.00, 95% CI 0.07 to 14.55, 30 women, one studyAnalysis 1.6), neonatal mortality (RR 3.00, 95% CI 0.13 to 67.91, one study, 28 women, Analysis 1.7) or respiratory distress syndrome (RR 3.00, 95% CI 0.13 to 67.91, one study, 28 infants, Analysis 1.10). There was no clear difference in gestational age between self‐monitoring and standard care groups (MD 0.40 weeks, 95% CI ‐1.65 to 2.45, one study, 28 infants, Analysis 1.8), and no clear difference in infant birthweight (MD ‐0.18 kg, 95% CI ‐0.49 to 0.13, two studies, 41 infants, Analysis 1.9).
No clear differences were shown for neonatal hypoglycaemia (RR 0.57, 95% CI 0.21 to 1.52, one study, 28 infants, Analysis 1.11), neonatal jaundice (hyperbilirubinaemia) (RR 0.56, 95% CI 0.25 to 1.24, one study, 28 infants, Analysis 1.12), hypocalcaemia (RR 1.00, 95% CI 0.07 to 14.45, one study, 28 infants, Analysis 1.13), polycythaemia (RR 0.33, 95% CI 0.01 to 7.55, one study, 28 infants, Analysis 1.14) and neonatal cord vein C‐peptide (MD 0.13 ng/nl, 95% CI ‐0.50 to 0.76, one study, 28 infants, Analysis 1.15).
The following secondary outcomes were not reported.
Maternal: induction of labour, perineal trauma, placental abruption, postpartum haemorrhage, postpartum infection, weight gain during pregnancy, adherence to the intervention, behaviour changes associated with the intervention, relevant biomarker changes associated with the intervention (e.g. adiponectin, free fatty acids, triglycerides, high‐density lipoproteins, low‐density lipoproteins, insulin), sense of well‐being and quality of life, views of the intervention, breastfeeding (e.g. at discharge, six weeks postpartum), use of additional pharmacotherapy, maternal hypoglycaemia, maternal mortality.
Long‐term maternal outcomes: postnatal depression, postnatal weight retention or return to pre‐pregnancy weight, body mass index, type 1 diabetes, impaired glucose tolerance, cardiovascular health (as defined by trialists, including blood pressure, hypertension, cardiovascular disease, metabolic syndrome).
Neonatal/infant: stillbirth, preterm birth (less than 37 weeks' gestation and less than 34 weeks' gestation), Apgar score (less than seven at five minutes), macrosomia, small‐for‐gestational age, head circumference and z‐score, length and z‐score, ponderal index, adiposity (e.g. body mass index, skinfold thickness), shoulder dystocia, bone fracture, nerve palsy, major and minor anomalies.
Later infant and childhood secondary outcomes: weight and z scores, height and z scores, head circumference and z scores, adiposity (e.g. as measured by body mass index, skinfold thickness), blood pressure, type 1 diabetes, type 2 diabetes, impaired glucose tolerance, dyslipidaemia or metabolic syndrome, educational achievement.
Child in adulthood: weight, height, adiposity (e.g. as measured by body mass index, skinfold thickness), cardiovascular health (as defined by trialists, including blood pressure, hypertension, cardiovascular disease, metabolic syndrome), type 1 diabetes, type 2 diabetes, impaired glucose tolerance, dyslipidaemia or metabolic syndrome, employment, education and social status/achievement.
Health service use: number of hospital or health professional visits (e.g. midwife, obstetrician, physician, dietician, diabetic nurse), number of antenatal visits or admissions, length of antenatal stay, neonatal intensive care unit admission, length of postnatal stay (mother), length of postnatal stay (baby), costs to families associated with the management provided, costs associated with the intervention (e.g.), cost of maternal care, cost of offspring care.
Comparison 2 ‐ Self‐monitoring versus hospitalisation
See summary of findings Table 2.
Only one study compared home self‐monitoring with hospitalisation (Hanson 1984). In this study, a total of 100 T1DM and T2DM pregnant women were randomised. The home self‐monitoring group had 54 women while the hospital group had 46 women. The women from the home group self‐monitored their blood glucose from the 32nd until 36th week of gestation and then hospitalised during 37th week until delivery; the hospital group women were hospitalised from 32nd week until delivery. Blood glucose was monitored four times daily (7am, 9.30am, 3pm and 7pm) in both groups.
Primary outcomes
This study of 100 women reported hypertensive disorders of pregnancy. There was no clear difference between self‐monitoring versus hospitalisation, however too few women experienced these events to show any meaningful differences (pre‐eclampsia: RR 4.26, 95% CI 0.52 to 35.16, Analysis 2.1, very low‐quality evidence;hypertension in pregnancy: RR 0.43, 95% CI 0.08 to 2.22, Analysis 2.2, very low‐quality evidence).
There was no clear difference in caesarean section (RR 0.96, 95% CI 0.65 to 1.44, Analysis 2.3very low‐quality evidence), and the sample size was too small to assess perinatal mortality (RR 0.85, 95% CI 0.05 to 13.24, Analysis 2.4, very low‐quality evidence).
Large‐for‐gestational age, mortality or morbidity composite, and neurosensory disability were not reported.
Secondary outcomes
No clear differences between self‐monitoring and hospitalisation were shown in the reported secondary outcomes: placental abruption (RR 1.70, 95% CI 0.16 to 18.19, Analysis 2.5);preterm birth < 37 weeks (RR 0.85, 95% CI 0.45 to 1.60, Analysis 2.6, very low‐quality evidence);respiratory distress syndrome (RR 2.56, 95% CI 0.28 to 23.74, Analysis 2.7); neonatal hypoglycaemia (RR 1.01, 95% CI 0.50 to 2.03, Analysis 2.8); neonatal jaundice (hyperbilirubinaemia) (RR 2.27, 95% CI 0.64 to 8.07, Analysis 2.9); major anomalies (RR 0.27, 95% CI 0.03 to 2.54, Analysis 2.10).
As would be expected from the nature of the intervention, a lower proportion of women in the self‐monitoring group had antenatal hospital admission (RR 0.19, 95% CI 0.11 to 0.33, Analysis 2.11).
Maternal glycaemic control was reported (Hanson 1984), however only mean blood glucose was given without standard deviations, and HbA1c was only presented graphically, so we were not able to include these data in the analyses. The mean blood glucose values during the study period were 6.0 mmol/L for the hospital group and 5.9 mmol/L for the home group.
Outcomes that were not pre‐specified
No clear differences between self‐monitoring and hospitalisation were shown in feeding difficulties (RR 0.85, 95% CI 0.41 to 1.78, Analysis 2.12).
The following secondary outcomes were not reported.
Maternal: induction of labour, perineal trauma, postpartum haemorrhage, postpartum infection, weight gain during pregnancy, adherence to the intervention, behaviour changes associated with the intervention, relevant biomarker changes associated with the intervention (e.g. adiponectin, free fatty acids, triglycerides, high‐density lipoproteins, low‐density lipoproteins, insulin), sense of well‐being and quality of life, views of the intervention, breastfeeding (e.g. at discharge, six weeks postpartum), use of additional pharmacotherapy, maternal hypoglycaemia, maternal mortality, miscarriage, long‐term maternal outcomes, postnatal depression, postnatal weight retention or return to pre‐pregnancy weight, body mass index, type 1 diabetes, impaired glucose tolerance, cardiovascular health (as defined by trialists, including blood pressure, hypertension, cardiovascular disease, metabolic syndrome).
Neonatal/infant: stillbirth, neonatal mortality, gestational age at birth, preterm birth less than 34 weeks, Apgar score (less than seven at five minutes), macrosomia, small‐for‐gestational age, birthweight and z‐score, head circumference and z‐score, length and z‐score, ponderal index, adiposity (e.g. body mass index, skinfold thickness), shoulder dystocia, bone fracture, nerve palsy, neonatal hypocalcaemia, polycythaemia, relevant biomarker changes associated with the intervention (e.g. cord c peptide, cord insulin).
Later infant and childhood secondary outcomes: weight and z scores, height and z scores, head circumference and z scores, adiposity (e.g. as measured by body mass index, skinfold thickness), blood pressure, type 1 diabetes, type 2 diabetes, impaired glucose tolerance, dyslipidaemia or metabolic syndrome, educational achievement.
Child in adulthood: weight, height, adiposity (e.g. as measured by body mass index, skinfold thickness), cardiovascular health (as defined by trialists, including blood pressure, hypertension, cardiovascular disease, metabolic syndrome), type 1 diabetes, type 2 diabetes, impaired glucose tolerance, dyslipidaemia or metabolic syndrome, employment, education and social status/achievement.
Health service use: number of hospital or health professional visits (e.g. midwife, obstetrician, physician, dietician, diabetic nurse), number of antenatal visits, length of antenatal stay, neonatal intensive care unit admission, length of postnatal stay (mother), length of postnatal stay (baby), costs to families associated with the management provided, costs associated with the intervention (e.g.), cost of maternal care, cost of offspring care.
Comparison 3 ‐ Pre‐prandial versus post‐prandial glucose monitoring
See summary of findings Table 3.
Only one trial compared pre‐prandial and post‐prandial glucose monitoring (Manderson 2003). Sixty‐one T1DM women were randomly assigned to pre‐prandial (n = 31) or post‐prandial (n = 30) blood glucose monitoring. The pre‐prandial group monitored their blood glucose before breakfast and pre‐prandially for each meal. The post‐prandial group monitored blood glucose before breakfast and one hour after the commencement of each meal.
Primary outcomes
In one study of 61 women (61 infants), there was no clear difference between pre‐prandial and post‐prandial glucose monitoring for caesarean section (RR 1.45, 95% CI 0.92 to 2.28, Analysis 3.2, very low‐quality evidence and large‐for‐gestational age (RR 1.16, 95% CI 0.73 to 1.85; Analysis 3.3, very low‐quality evidence). The results for hypertensive disorders of pregnancy: pre‐eclampsia (RR 6.43, 95% CI 0.82 to 50.11, Analysis 3.1, very low‐quality evidence) and perinatal mortality (RR 2.91, 95% CI 0.12 to 68.66, Analysis 3.4, very low‐quality evidence) are not meaningful because these outcomes were too rare to show differences in a small sample.
The study did not report the outcomes mortality or morbidity composite, or neurosensory disability.
Secondary outcomes
The study did not show a clear difference between pre‐prandial and post‐prandial glucose monitoring for weight gain in pregnancy (MD ‐0.90 kg, 95% CI ‐3.86 to 2.06, Analysis 3.5); use of additional pharmacotherapy shown by insulin dose in units/day and units/kg (MD ‐17.40 units/day, 95% CI ‐43.41 to 8.61, Analysis 3.6; MD ‐0.20 units/kg, 95% CI ‐0.45 to 0.05, Analysis 3.7); glycaemic control shown by mean HbA1c (MD 0.30 %, 95% CI ‐0.08 to 0.68, Analysis 3.8); stillbirth (RR 2.91, 95% CI 0.12 to 68.66, Analysis 3.9); gestational age (MD 0.20 weeks, 95% CI ‐0.84 to 1.24, Analysis 3.10, very low‐quality evidence);preterm birth < 37 weeks (RR 1.33, 95% CI 0.62 to 2.84, Analysis 3.11, very low‐quality evidence);macrosomia (RR 2.18, 95% CI 0.75 to 6.32, Analysis 3.12), birthweight (MD 0.24 kg, 95% CI ‐0.10 to 0.58, Analysis 3.13); subscapular skinfold thickness (adiposity) (MD 0.60 mm, 95% CI ‐0.18 to 1.38, Analysis 3.14); birth trauma (shoulder dystocia, bone fracture, nerve palsy) (RR 0.48, 95% CI 0.05 to 5.06, Analysis 3.16); respiratory distress syndrome (RR 0.97, 95% CI 0.06 to 14.78, Analysis 3.17); neonatal hypoglycaemia (RR 1.09, 95% CI 0.48 to 2.45, Analysis 3.18);neonatal jaundice (hyperbilirubinaemia) (RR 1.16, 95% CI 0.40 to 3.40, Analysis 3.19); Cord IGF‐1 (MD 1.30 μg/L, 95% CI ‐0.70 to 3.30, Analysis 3.20); neonatal glucose at age one hour (not pre‐specified) (MD ‐0.20, 95% CI ‐0.88 to 0.48, Analysis 3.21); transient tachypnoea (not pre‐specified) (RR 2.58, 95% CI 0.76 to 8.81, Analysis 3.22); and neonatal intensive care admissions (RR 1.04, 95% CI 0.62 to 1.74, Analysis 3.23).
Infants in the pre‐prandial monitoring group had higher triceps skinfold thickness (adiposity) (MD 0.60 mm, 95% CI 0.04 to 1.16, Analysis 3.15) although the difference is small and should be considered in the context of no clear difference in large‐for‐gestational age, birthweight, macrosomia, and subscapular skinfold thickness.
The following secondary outcomes were not reported.
Maternal: induction of labour, perineal trauma, placental abruption, postpartum haemorrhage, postpartum infection, adherence to the intervention, behaviour changes associated with the intervention, relevant biomarker changes associated with the intervention (e.g. adiponectin, free fatty acids, triglycerides, high‐density lipoproteins, low‐density lipoproteins, insulin), sense of well‐being and quality of life, views of the intervention, breastfeeding (e.g. at discharge, six weeks postpartum), maternal hypoglycaemia, maternal mortality, miscarriage, long‐term maternal outcomes, postnatal depression, postnatal weight retention or return to pre‐pregnancy weight, body mass index, type 1 diabetes, impaired glucose tolerance, cardiovascular health (as defined by trialists, including blood pressure, hypertension, cardiovascular disease, metabolic syndrome).
Neonatal/infant: neonatal mortality, preterm birth less than 34 weeks, Apgar score (less than seven at five minutes), small‐for‐gestational age, head circumference and z‐score, length and z‐score, ponderal index, neonatal hypocalcaemia, polycythaemia, relevant biomarker changes associated with the intervention (e.g. cord c peptide, cord insulin), major and minor anomalies.
Later infant and childhood secondary outcomes: weight and z scores, height and z scores, head circumference and z scores, adiposity (e.g. as measured by body mass index, skinfold thickness), blood pressure, type 1 diabetes, type 2 diabetes, impaired glucose tolerance, dyslipidaemia or metabolic syndrome, educational achievement.
Child in adulthood: weight, height, adiposity (e.g. as measured by body mass index, skinfold thickness), cardiovascular health (as defined by trialists, including blood pressure, hypertension, cardiovascular disease, metabolic syndrome), type 1 diabetes, type 2 diabetes, impaired glucose tolerance, dyslipidaemia or metabolic syndrome, employment, education and social status/achievement.
Health service use: number of hospital or health professional visits (e.g. midwife, obstetrician, physician, dietician, diabetic nurse), number of antenatal visits or admissions, length of antenatal stay, length of postnatal stay (mother), length of postnatal stay (baby), costs to families associated with the management provided, costs associated with the intervention (e.g.), cost of maternal care, cost of offspring care.
Comparison 4 ‐ Automated telemedicine monitoring versus conventional system
See summary of findings Table 4.
Three studies (Dalfrà 2009; Di Biase 1997; Wojcicki 2001) compared automated telemedicine monitoring versus conventional system. Dalfrà 2009 included both women with type 1 diabetes (n = 32, data included in this review) and women with gestational diabetes (n = 203, data excluded from this review). Women in the telemedicine group were asked to submit their blood glucose data every week, and had a medical examination at the diabetes clinic once a month, while women in the control group had a medical examination every two weeks. Di Biase 1997 (n = 20) and Wojcicki 2001 (n = 32) recruited T1DM women. Di Biase 1997 used a DIANET system, which was an automated monitoring system using a telemedicine system with patient unit, diabetes workstation and the communication link to send all data to the diabetologist. The intermittent monitoring was conventional monitoring where the women were instructed to perform three or more tests of blood glucose per day using BM20‐800 strips with the results checked during routine clinic visits. Wojcicki 2001 used a telematic management system with the a glucometer connected to a modem interface where the blood glucose measurements could be transmitted to the central clinical control unit. The conventional group would only have their measurements examined during the routine clinical examinations every three weeks. All women (in both groups) were encouraged to measure their blood glucose at least six times per day.
Primary outcomes
Dalfrà 2009 reported no clear difference between automated telemedicine monitoring and conventional monitoring forcaesarean section (RR 0.96, 95% CI 0.62 to 1.48, 32 women, one study, Analysis 4.1, very low‐quality evidence) and mortality or morbidity composite (RR 1.18, 95% CI 0.53 to 2.62, 32 infants, one study, Analysis 4.2).
Di Biase 1997 and Wojcicki 2001 did not report these primary outcomes, and none of the studies contributing data to this comparison reported hypertensive disorders of pregnancy, large‐for‐gestational age, perinatal mortality (stillbirth and neonatal mortality), and neurosensory disability.
Secondary outcomes
In one study of 20 women (Di Biase 1997), women in the automated telemedicine group had a higher mean insulin requirement at the end of the study (MD 18.40 units/day, 95% CI 12.88 to 23.92, Analysis 4.5). The women in the automated telemedicine group also had lower mean maternal fasting blood glucose before breakfast and before lunch at the end of the study (before breakfast: MD ‐1.00 mmol/L, 95% CI ‐1.22 to ‐0.78, Analysis 4.6; before lunch: MD ‐1.10 mmol/L, 95% CI ‐1.32 to ‐0.88, Analysis 4.7). There was high heterogeneity between studies for maternal HbA1c (random‐effects MD ‐0.17 %, 95% CI ‐0.82 to 0.48, 82 women, three studies, Tau² = 0.27, I² = 82%, Analysis 4.8, very low‐quality evidence) and maternal post‐prandial blood glucose (random effects MD ‐0.80 mmol/L, 95% CI ‐1.67 to 0.08, 50 women, three studies, Tau² = 0.35, I² = 86%, Analysis 4.9, very low‐quality evidence). Post hoc sensitivity analyses show that this was due to measurements from Di Biase 1997. This study showed differences between groups in HbA1c and post‐prandial blood glucose, however the other two studies did not. It seems likely that the higher insulin doses given to women in the automated telemedicine group resulted in lower blood glucose measures.
There was no clear difference between groups for: weight gain in pregnancy (MD ‐0.70, 95% CI ‐4.95 to 3.55, 32 women, one study, Analysis 4.3); use of additional insulin therapy (RR 1.00, 95% CI 0.89 to 1.12, 32 women, one study, Analysis 4.4); gestational age (MD 0.13 weeks, 95% CI ‐0.14 to 0.39, 84 women, three studies, Analysis 4.10); macrosomia (RR 1.18, 95% CI 0.31 to 4.43, 32 infants, one study, Analysis 4.11); or birthweight (MD ‐0.16 kg, 95% CI ‐0.64 to 0.32, 32 infants, one study, Analysis 4.12).
Percentage of maternal hypoglycaemic episodes was reported by Wojcicki 2001, however, the total of all blood glucose data were not available, therefore the frequency was not estimable.
The following secondary outcomes were not reported.
Maternal: induction of labour, perineal trauma, placental abruption, postpartum haemorrhage, postpartum infection, adherence to the intervention, behaviour changes associated with the intervention, relevant biomarker changes associated with the intervention (e.g. adiponectin, free fatty acids, triglycerides, high‐density lipoproteins, low‐density lipoproteins, insulin), sense of well‐being and quality of life, views of the intervention, breastfeeding (e.g. at discharge, six weeks postpartum), maternal hypoglycaemia, maternal mortality, miscarriage, long‐term maternal outcomes, postnatal depression, postnatal weight retention or return to pre‐pregnancy weight, body mass index, type 1 diabetes, impaired glucose tolerance, cardiovascular health (as defined by trialists, including blood pressure, hypertension, cardiovascular disease, metabolic syndrome).
Neonatal/infant:stillbirth, neonatal mortality, preterm birth (less than 37 weeks' gestation and less than 34 weeks' gestation), Apgar score (less than seven at five minutes), small‐for‐gestational age, head circumference and z‐score, length and z‐score, ponderal index, adiposity (e.g. body mass index, skinfold thickness), shoulder dystocia, bone fracture, nerve palsy, respiratory distress syndrome, hypoglycaemia (variously defined), hyperbilirubinaemia, neonatal hypocalcaemia, polycythaemia, relevant biomarker changes associated with the intervention (e.g. cord c peptide, cord insulin), major and minor anomalies.
Later infant and childhood secondary outcomes: weight and z scores, height and z scores, head circumference and z scores, adiposity (e.g. as measured by body mass index, skinfold thickness), blood pressure, type 1 diabetes, type 2 diabetes, impaired glucose tolerance, dyslipidaemia or metabolic syndrome, educational achievement.
Child in adulthood: weight, height, adiposity (e.g. as measured by body mass index, skinfold thickness), cardiovascular health (as defined by trialists, including blood pressure, hypertension, cardiovascular disease, metabolic syndrome), type 1 diabetes, type 2 diabetes, impaired glucose tolerance, dyslipidaemia or metabolic syndrome, employment, education and social status/achievement.
Health service use: number of hospital or health professional visits (e.g. midwife, obstetrician, physician, dietician, diabetic nurse), number of antenatal visits or admissions, length of antenatal stay, neonatal intensive care unit admission, length of postnatal stay (mother), length of postnatal stay (baby), costs to families associated with the management provided, costs associated with the intervention, cost of maternal care, cost of offspring care.
Comparison 5 ‐ Continuous glucose monitoring (CGM) versus intermittent monitoring
See summary of findings Table 5.
Two studies compared CGM versus intermittent monitoring (Murphy 2008; Secher 2013). The total number of women was 225 (169 T1DM and 56 T2DM). Secher 2013 contributed a large number of participants in this comparison (n = 154).
Murphy 2008 used the CGMS, which measured glucose in subcutaneous tissues every 10 seconds and an average value is stored every five minutes, providing up to 288 measurements per day (n = 38). The participants were required to wear the CGMS for seven days at intervals of four to six weeks. They were also advised to measure blood glucose at least seven times a day. The intermittent monitoring of glucose levels was the standard care in which participants were advised to monitor glucose at least seven times a day (n = 33).
In Secher 2013, real time CGM for six days at pregnancy visits during eight, 12, 21, 27 and 33 weeks, in addition to routine pregnancy care was implemented on 79 women and intermittent monitoring with self‐monitored plasma glucose measurements of seven times daily was implemented on 75 women.
Primary outcomes
These studies showed no clear difference between groups for pre‐eclampsia (RR 1.37, 95% CI 0.52 to 3.59, 225 women, two studies, Analysis 5.1, low‐quality evidence). Due to high heterogeneity, we used random‐effects analysis for caesarean section (average RR 1.00, 95% CI 0.65 to 1.54, 255 women, two studies, Tau² = 0.06, I² = 62%, Analysis 5.2, very low‐quality evidence) and large‐for‐gestational age (average RR 0.89, 95% CI 0.41 to 1.92, 221 infants, two studies, Tau² = 0.26, I² = 82%, Analysis 5.3, very low‐quality evidence). There was no clear difference between groups for these outcomes, and the effects were in different directions in the two studies. There was not enough evidence to assess perinatal mortality (RR 0.82, 95% CI 0.05 to 12.61, 71 infants, one study, Analysis 5.4, low‐quality evidence).
Mortality or morbidity composite and neurosensory disability were not reported.
Secondary outcomes
Mean maternal HbA1c was lower for women in the continuous monitoring group (MD ‐0.60 %, 95% CI ‐0.91 to ‐0.29, 71 women, one study, moderate‐quality evidence,Analysis 5.5).
No clear difference was shown between continuous glucose monitoring and intermittent monitoring for miscarriage (RR 1.21, 95% CI 0.28 to 5.24, 228 women, two studies, Analysis 5.6), neonatal mortality (RR 0.80, 95% CI 0.05 to 12.39, 74 infants, one study, Analysis 5.7), gestational age (MD 0.10 weeks, 95% CI ‐0.57 to 0.77, 68 infants, one study, Analysis 5.8), preterm birth < 37 weeks (RR 1.10, 95% CI 0.63 to 1.94, 228 infants, two studies, low‐quality evidence,Analysis 5.9), small‐for‐gestational age (RR 7.34, 95% CI 0.41 to 131.18, 67 infants, one study, Analysis 5.10), birthweight (MD ‐0.29 kg, 95% CI ‐0.59 to 0.01, 67 infants, one study, Analysis 5.11), neonatal hypoglycaemia (RR 0.77, 95% CI 0.51 to 1.16, 228 infants, two studies, Analysis 5.12), major anomalies (RR 0.80, 95% CI 0.05 to 12.39, 74 infants, one study, Analysis 5.13), and neonatal intensive care admissions (RR 1.21, 95% CI 0.48 to 3.05, 74 infants, one study, Analysis 5.14).
The following secondary outcomes were not reported.
Maternal: induction of labour, perineal trauma, placental abruption, postpartum haemorrhage, postpartum infection, weight gain during pregnancy, adherence to the intervention, behaviour changes associated with the intervention, relevant biomarker changes associated with the intervention (e.g. adiponectin, free fatty acids, triglycerides, high‐density lipoproteins, low‐density lipoproteins, insulin), sense of well‐being and quality of life, views of the intervention, breastfeeding (e.g. at discharge, six weeks postpartum), use of additional pharmacotherapy, maternal hypoglycaemia, maternal mortality, long‐term maternal outcomes, postnatal depression, postnatal weight retention or return to pre‐pregnancy weight, body mass index, type 1 diabetes, impaired glucose tolerance, cardiovascular health (as defined by trialists, including blood pressure, hypertension, cardiovascular disease, metabolic syndrome).
Neonatal/infant:stillbirth, preterm birth less than 34 weeks, Apgar score (less than seven at five minutes), macrosomia, head circumference and z‐score, length and z‐score, ponderal index, adiposity (e.g. body mass index, skinfold thickness), shoulder dystocia, bone fracture, nerve palsy, respiratory distress syndrome, hyperbilirubinaemia, neonatal hypocalcaemia, polycythaemia, relevant biomarker changes associated with the intervention (e.g. cord c peptide, cord insulin).
Later infant and childhood secondary outcomes: weight and z scores, height and z scores, head circumference and z scores, adiposity (e.g. as measured by body mass index, skinfold thickness), blood pressure, type 1 diabetes, type 2 diabetes, impaired glucose tolerance, dyslipidaemia or metabolic syndrome, educational achievement.
Child in adulthood: weight, height, adiposity (e.g. as measured by body mass index, skinfold thickness), cardiovascular health (as defined by trialists, including blood pressure, hypertension, cardiovascular disease, metabolic syndrome), type 1 diabetes, type 2 diabetes, impaired glucose tolerance, dyslipidaemia or metabolic syndrome, employment, education and social status/achievement.
Health service use: number of hospital or health professional visits (e.g. midwife, obstetrician, physician, dietician, diabetic nurse), number of antenatal visits or admissions, length of antenatal stay, length of postnatal stay (mother), length of postnatal stay (baby), costs to families associated with the management provided, costs associated with the intervention (e.g.), cost of maternal care, cost of offspring care.
Comparison 6 ‐ Constant CGM versus intermittent CGM
See summary of findings Table 6.
Only one study compared constant CGM and intermittent CGM (Petrovski 2011). Twenty‐five T1DM women were randomised into constant CGM (n = 12) and intermittent CGM (n = 13) groups. The women in the constant CGM group wore the glucose sensor 24 hours per day while the intermittent CGM group wore the glucose sensor 14 days per month. The women in the intermittent CGM group measured blood glucose at least six times daily when not using the glucose sensor.
Primary outcomes
There was no clear difference between constant CGM and intermittent CGM for caesarean section (RR 0.77, 95% CI 0.33 to 1.79, 25 women, one study, very low‐quality evidence,Analysis 6.1). Other primary outcomes were not reported (hypertensive disorders of pregnancy, large‐for‐gestational age, perinatal mortality (stillbirth and neonatal mortality), mortality or morbidity composite, and neurosensory disability).
Secondary outcomes
No clear difference was shown for weight gain in pregnancy (MD 0.50 kg, 95% CI ‐1.82 to 2.82, 25 women, one study, Analysis 6.2),insulin dosage (third trimester: MD ‐0.03, 95% CI ‐1.30 to 1.24, 25 women, one study, Analysis 6.3); maternal blood glucose (first trimester: MD ‐0.50 mmol/L, 95% CI ‐2.70 to 1.70, 25 women, one study, Analysis 6.4; third trimester: MD ‐0.14 mmol/L, 95% CI ‐2.00 to 1.72, 25 women, one study, very low‐quality evidence,Analysis 6.5); maternal HbA1c (first trimester: MD ‐0.30 %, 95% CI ‐1.13 to 0.53, 25 women, one study, Analysis 6.6; third trimester: MD ‐0.09 %, 95% CI ‐0.69 to 0.51, 25 women, one study, very low‐quality evidenceAnalysis 6.7), maternal hypoglycaemia (RR 0.54, 95% CI 0.06 to 5.24, 25 women, one study, Analysis 6.8), diabetic ketoacidosis (not pre‐specified) (RR 0.36, 95% CI 0.02 to 8.05, 25 women, one study, Analysis 6.9),preterm birth < 37 weeks (RR 1.08, 95% CI 0.08 to 15.46, 25 infants, one study, very low‐quality evidenceAnalysis 6.10), andmacrosomia (RR 1.08, 95% CI 0.08 to 15.46, 25 infants, one study, Analysis 6.11). There were no events for neonatal hypoglycaemia (25 infants, one study, Analysis 6.12).
The following secondary outcomes were not reported.
Maternal: induction of labour, perineal trauma, placental abruption, postpartum haemorrhage, postpartum infection, adherence to the intervention, behaviour changes associated with the intervention, relevant biomarker changes associated with the intervention (e.g. adiponectin, free fatty acids, triglycerides, high‐density lipoproteins, low‐density lipoproteins, insulin), sense of well‐being and quality of life, views of the intervention, breastfeeding (e.g. at discharge, six weeks postpartum), maternal mortality, miscarriage, long‐term maternal outcomes, postnatal depression, postnatal weight retention or return to pre‐pregnancy weight, body mass index, type 1 diabetes, impaired glucose tolerance, cardiovascular health (as defined by trialists, including blood pressure, hypertension, cardiovascular disease, metabolic syndrome).
Neonatal/infant:stillbirth, neonatal mortality, gestational age at birth, preterm birth less than 34 weeks' gestation, Apgar score (less than seven at five minutes), small‐for‐gestational age, birthweight and z‐score, head circumference and z‐score, length and z‐score, ponderal index, adiposity (e.g. body mass index, skinfold thickness), shoulder dystocia, bone fracture, nerve palsy, respiratory distress syndrome, hyperbilirubinaemia, neonatal hypocalcaemia, polycythaemia, relevant biomarker changes associated with the intervention (e.g. cord c peptide, cord insulin), major and minor anomalies.
Later infant and childhood secondary outcomes: weight and z scores, height and z scores, head circumference and z scores, adiposity (e.g. as measured by body mass index, skinfold thickness), blood pressure, type 1 diabetes, type 2 diabetes, impaired glucose tolerance, dyslipidaemia or metabolic syndrome, educational achievement.
Child in adulthood: weight, height, adiposity (e.g. as measured by body mass index, skinfold thickness), cardiovascular health (as defined by trialists, including blood pressure, hypertension, cardiovascular disease, metabolic syndrome), type 1 diabetes, type 2 diabetes, impaired glucose tolerance, dyslipidaemia or metabolic syndrome, employment, education and social status/achievement.
Health service use: number of hospital or health professional visits (e.g. midwife, obstetrician, physician, dietician, diabetic nurse), number of antenatal visits or admissions, length of antenatal stay, neonatal intensive care unit admission, length of postnatal stay (mother), length of postnatal stay (baby), costs to families associated with the management provided, costs associated with the intervention (e.g.), cost of maternal care, cost of offspring care.
Discussion
Summary of main results
The objective of this review was to assess the various techniques of glucose monitoring among pregnant women with pre‐existing type 1 and type 2 diabetes. We included 10 trials comparing six different pairs of glucose monitoring techniques: self‐monitoring versus standard care (Stubbs 1980; Varner 1983), self‐monitoring versus hospitalisation (Hanson 1984), pre‐prandial versus post‐prandial glucose monitoring (Manderson 2003), automated telemedicine monitoring versus conventional (Dalfrà 2009; Di Biase 1997; Wojcicki 2001), continuous glucose monitoring (CGM) versus intermittent glucose monitoring (Secher 2013), and constant CGM versus intermittent CGM (Petrovski 2011). The included trials involved a total of 538 women (468 women with type 1 diabetes and 70 women with type 2 diabetes). All trials originated from European countries and the USA.
Neither pooled analyses nor individual trial analyses showed any clear advantages of one monitoring technique over another for primary outcomes (hypertensive disorders of pregnancy, caesarean section, perinatal mortality, neonatal morbidity and mortality, and large‐for‐gestational age) and secondary outcomes (such as maternal glycaemic control, preterm birth, frequency of neonatal hypoglycaemia, and neonatal intensive care admission). Many important outcomes were not reported, for example, neurosensory disability and shoulder dystocia.
Self‐monitoring versus standard care (two studies, 43 women): there was no clear difference between groups for caesarean section, or glycaemic control, and not enough evidence to assess perinatal mortality and neonatal mortality and morbidity composite. Hypertensive disorders of pregnancy, large‐for‐gestational age, neurosensory disability andpreterm birth were not reported in either study.
Self‐monitoring versus hospitalisation (one study, 100 women): there was no clear difference between groups for hypertensive disorders of pregnancy (pre‐eclampsia and hypertension in pregnancy). There was no clear difference in caesarean section or preterm birth less than 37 weeks, and the sample size was too small to assess perinatal mortality. Large‐for‐gestational age, mortality or morbidity composite, neurosensory disability and preterm birth less than 34 weeks were not reported.
Pre‐prandial versus post‐prandial glucose monitoring (one study, 61 women): there was no clear difference between groups for caesarean section, large‐for‐gestational age andglycaemic control. The results for hypertensive disorders of pregnancy: pre‐eclampsia and perinatal mortality are not meaningful because these outcomes were too rare to show differences in a small sample. The study did not report the outcomes mortality or morbidity composite, neurosensory disability orpreterm birth.
Automated telemedicine monitoring versus conventional system (three studies, 84 women): there was no clear difference between groups forcaesarean section, mortality or morbidity composite and glycaemic control in the one study that reported these outcomes. No studies reported hypertensive disorders of pregnancy, large‐for‐gestational age, perinatal mortality (stillbirth and neonatal mortality), neurosensory disability orpreterm birth.
CGM versus intermittent monitoring (two studies, 225 women): there was no clear difference between groups for pre‐eclampsia, caesarean section, large‐for‐gestational age andpreterm birth less than 37 weeks' gestation.Glycaemic control indicated by mean maternal HbA1c was lower for women in the continuous monitoring group. There was not enough evidence to assess perinatal mortality. Mortality or morbidity composite, neurosensory disability and preterm birth less than 34 weeks were not reported.
Constant CGM versus intermittent CGM (one study, 25 women): there was no clear difference between groups for caesarean section, glycaemic control orpreterm birth less than 37 weeks' gestation. Other primary (hypertensive disorders of pregnancy, large‐for‐gestational age, perinatal mortality (stillbirth and neonatal mortality), mortality or morbidity composite, and neurosensory disability) or GRADE outcomes (preterm birth less than 34 weeks' gestation) were not reported.
Overall completeness and applicability of evidence
There exists a shortage of evidence on the relative effectiveness of techniques of glucose monitoring among pregnant women with pre‐existing diabetes. The number of women allotted to each technique was small and cannot be said to justify overall completeness of evidence. Only 10 small trials were identified for inclusion in the review. All the included trials were conducted in Western countries ‐ European and the USA ‐ and it can be assumed that a majority of the women were Caucasian. There were six pairs of intervention techniques in the included trials. There was difficulty in pooling the results due to this variation. Evidence for three comparisons came from single trial data (Comparisons 2, 3 and 6). The review's primary and secondary outcomes were not reported by all trials. Birthweight was reported by six studies while macrosomia (cut‐off value different from this review) only reported by one (Petrovski 2011). Some secondary outcomes, including induction of labour, shoulder dystocia, major and minor anomalies were not reported by any trials. Due to some older trials that focused on non applicable clinical practice, small number of trials, low to moderate risk of bias of the included trials and small numbers of participants, the applicability of the current available evidence is limited.
Quality of the evidence
Five of the ten included trials were at moderate risk of bias (Hanson 1984; Manderson 2003; Petrovski 2011; Stubbs 1980; Varner 1983). Four trials (Di Biase 1997; Murphy 2008; Secher 2013; Wojcicki 2001) were at low to moderate risk of bias. One trial was at high risk of bias (Dalfrà 2009). Only three trials (Murphy 2008; Secher 2013; Varner 1983) described the random sequence generation while adequate and secure concealment of allocation was described in three trials (Manderson 2003; Murphy 2008; Secher 2013). It was unclear if there was any selective reporting in six trials (Dalfrà 2009; Murphy 2008; Petrovski 2011; Secher 2013; Stubbs 1980; Varner 1983), while the other four reported all outcome data (Di Biase 1997; Hanson 1984; Manderson 2003; Wojcicki 2001). However, most of the trials had small numbers of participants; six trials (Dalfrà 2009; Di Biase 1997; Petrovski 2011; Stubbs 1980; Varner 1983; Wojcicki 2001) only had a range of 13 to 32 participants. Any potential bias is likely to have been overshadowed by the small number and size of trials with their different intervention techniques of monitoring and reported outcomes. The trials are too small to show differences in important outcomes such as macrosomia, preterm birth, miscarriage or death of baby.
All the reported GRADE outcomes for comparisons 1, 2, 3, 4 and 6 were assessed as being very low‐quality evidence (summary of findings Table for the main comparison; summary of findings Table 2; summary of findings Table 3; summary of findings Table 4; summary of findings Table 6). This was due to design limitations in the studies, wide confidence intervals crossing the line of no effect, small sample sizes, and few events. In addition, there was high heterogeneity for glycaemic control (HbA1c and post‐prandial blood glucose measures) in comparison 4. Comparison 5 included more data than the other comparisons (225 women), from studies with lower risk of bias (summary of findings Table 5). Consequently, glycaemic control (HbA1c) was graded moderate‐quality evidence, and pre‐eclampsia, perinatal mortality and preterm birth before 37 weeks were graded low‐quality evidence. Caesarean section and large‐for‐gestational age were graded very low‐quality evidence due to statistical heterogeneity.
GRADE outcomes were often not reported. Caesarean section was the only GRADE outcome reported by studies in every comparison. Pre‐eclampsia was not reported by any studies in comparisons 1, 4 and 6; gestational hypertension was not reported by any studies in comparisons 1, 3, 4, 5 and 6; glycaemic control HbA1c was not reported by any studies in comparison 2; glycaemic control post‐prandial blood glucose was not reported by any studies in comparisons 2, 3 and 5; large‐for‐gestational age was not reported by any studies in comparisons 1, 2, 4 and 6; perinatal mortality was not reported by any studies in comparisons 4 and 6; and preterm birth before 37 weeks was not reported by any studies in comparisons 1 and 4.
Potential biases in the review process
With an extensive search without language restriction, we cannot rule out the possibility that we have missed relevant studies that were not published or are still ongoing. In addition, the proposed subgroup and sensitivity analyses could not be performed.
Agreements and disagreements with other studies or reviews
This review found no evidence that any glucose monitoring techniques were superior over the other techniques among pregnant women with pre‐existing type 1 or type 2 diabetes. There were no available reviews on self‐monitoring of blood glucose (SMBG) among pregnant women with pre‐existing diabetes and so the findings of this review cannot be compared with any other. This review's findings are not altogether consistent with the findings of others that considered methods for blood glucose monitoring techniques amongst other diabetic populations. SMBG has been found to be effective for patients with type 1 diabetes (DCCT 1993) and patients with type 2 diabetes who are using insulin (Karter 2001). One Cochrane review (Malanda 2012), concluded that SMBG in newly diagnosed patients with type 2 diabetes who are not using insulin is beneficial in lowering HbA1c. However, when the duration of diabetes is over one year, the overall glycaemic effects of SMBG are small at short term and subside after one year.
Similar to the findings of this review, there is limited evidence for the effectiveness of real‐time continuous glucose monitoring (CGM) use in children, adults and patients with poorly controlled diabetes in one Cochrane review (Langendam 2012) and other reviews (Ghandi 2011; Pickup 2011). However, these reviews indicated that higher compliance of wearing the CGM device improves glycosylated haemoglobin A1c level (HbA1c) to a larger extent.
Women with type 1 and type 2 diabetes are advised to self‐monitor their blood glucose throughout pregnancy (IDF 2010). The control of hyperglycaemia in pregnant women with pre‐existing diabetes can reduce adverse maternal and infant outcomes (Kitzmiller 2008). A Cochrane review has reported that pregnant women with type 1 or type 2 diabetes with tight to moderate glycaemic control had significantly lower risks for pre‐eclampsia, caesarean section and macrosomia (Middleton 2016). However, the evidence base for the relative effectiveness of monitoring techniques is inconclusive.
Other than the above mentioned studies or reviews, we are not aware of any other published reviews on techniques of glucose monitoring among pregnant women with pre‐existing diabetes. There is a review on different methods and settings for glucose monitoring for gestational diabetes during pregnancy which is currently being undertaken and due for publication in June 2017 (Gill 2014).
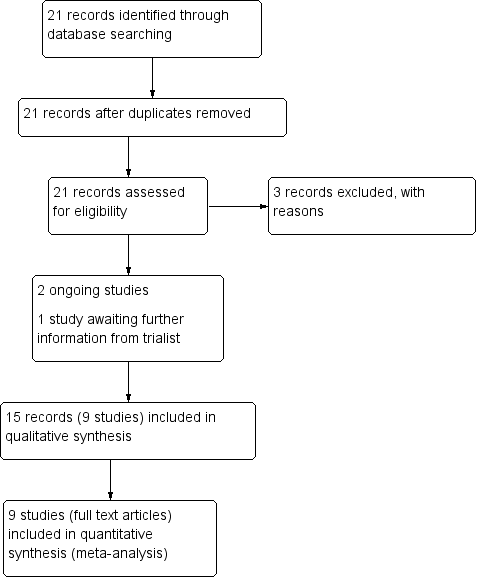
Study flow diagram.

Study flow diagram 2016

'Risk of bias' summary: review authors' judgements about each risk of bias item for each included study.
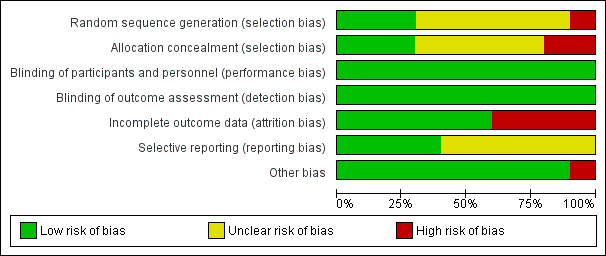
'Risk of bias' graph: review authors' judgements about each risk of bias item presented as percentages across all included studies.
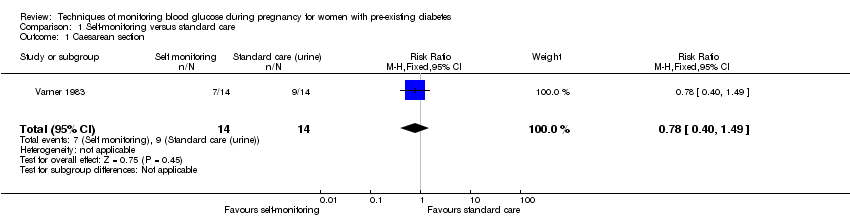
Comparison 1 Self‐monitoring versus standard care, Outcome 1 Caesarean section.

Comparison 1 Self‐monitoring versus standard care, Outcome 2 Perinatal mortality.

Comparison 1 Self‐monitoring versus standard care, Outcome 3 Neonatal mortality and morbidity composite.

Comparison 1 Self‐monitoring versus standard care, Outcome 4 Glycaemic control during/end of treatment (maternal post‐prandial blood glucose).

Comparison 1 Self‐monitoring versus standard care, Outcome 5 Glycaemic control during/end of treatment (maternal HbA1c).
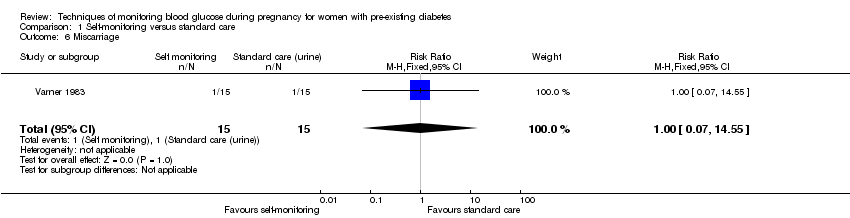
Comparison 1 Self‐monitoring versus standard care, Outcome 6 Miscarriage.
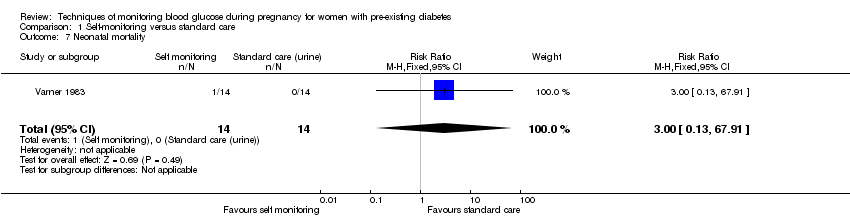
Comparison 1 Self‐monitoring versus standard care, Outcome 7 Neonatal mortality.
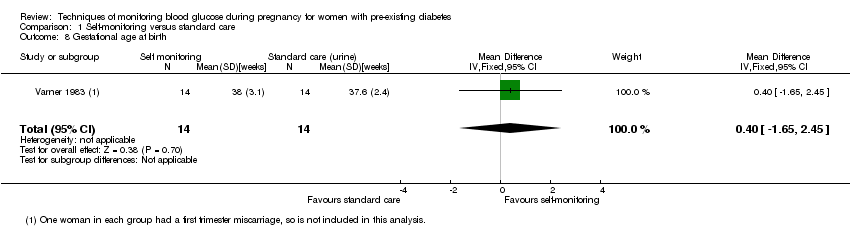
Comparison 1 Self‐monitoring versus standard care, Outcome 8 Gestational age at birth.
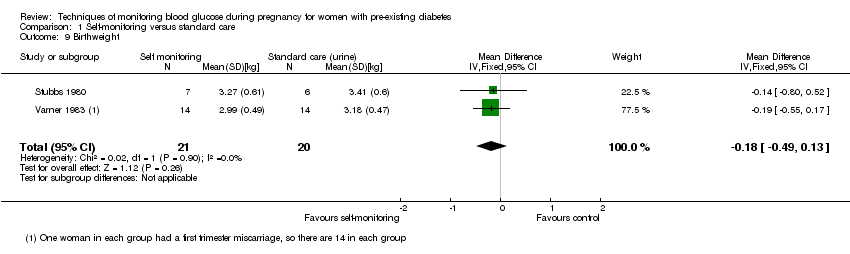
Comparison 1 Self‐monitoring versus standard care, Outcome 9 Birthweight.

Comparison 1 Self‐monitoring versus standard care, Outcome 10 Respiratory distress syndrome.
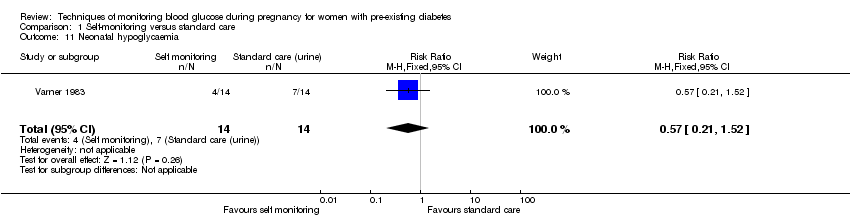
Comparison 1 Self‐monitoring versus standard care, Outcome 11 Neonatal hypoglycaemia.

Comparison 1 Self‐monitoring versus standard care, Outcome 12 Neonatal jaundice (hyperbilirubinaemia).
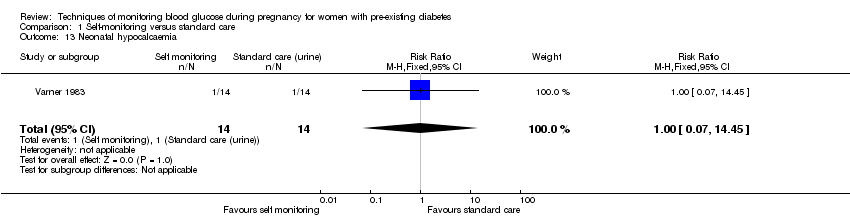
Comparison 1 Self‐monitoring versus standard care, Outcome 13 Neonatal hypocalcaemia.
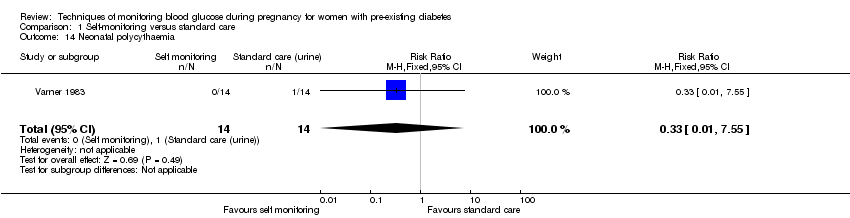
Comparison 1 Self‐monitoring versus standard care, Outcome 14 Neonatal polycythaemia.

Comparison 1 Self‐monitoring versus standard care, Outcome 15 Neonatal cord vein C‐peptide.

Comparison 2 Self‐monitoring versus hospitalisation, Outcome 1 Pre‐eclampsia.
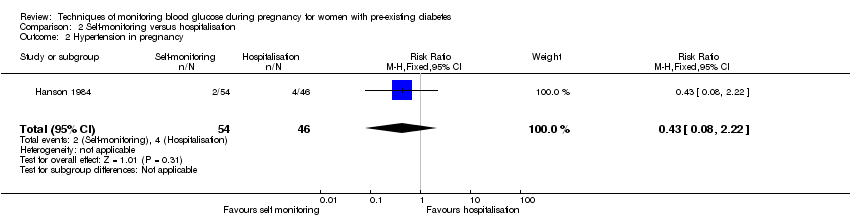
Comparison 2 Self‐monitoring versus hospitalisation, Outcome 2 Hypertension in pregnancy.

Comparison 2 Self‐monitoring versus hospitalisation, Outcome 3 Caesarean section.

Comparison 2 Self‐monitoring versus hospitalisation, Outcome 4 Perinatal mortality.

Comparison 2 Self‐monitoring versus hospitalisation, Outcome 5 Placental abruption.

Comparison 2 Self‐monitoring versus hospitalisation, Outcome 6 Preterm birth < 37 weeks.

Comparison 2 Self‐monitoring versus hospitalisation, Outcome 7 Respiratory distress syndrome.

Comparison 2 Self‐monitoring versus hospitalisation, Outcome 8 Neonatal hypoglycaemia.
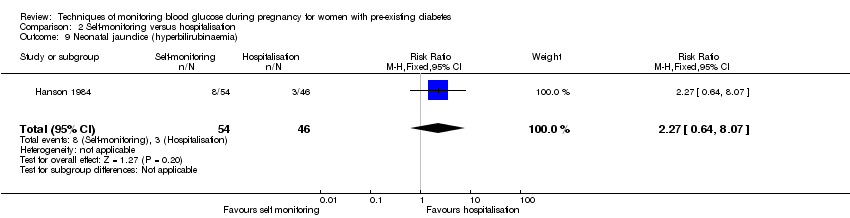
Comparison 2 Self‐monitoring versus hospitalisation, Outcome 9 Neonatal jaundice (hyperbilirubinaemia).
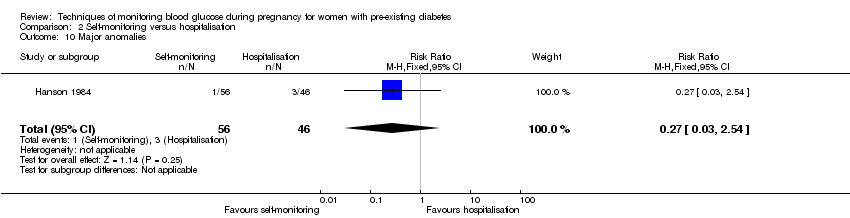
Comparison 2 Self‐monitoring versus hospitalisation, Outcome 10 Major anomalies.
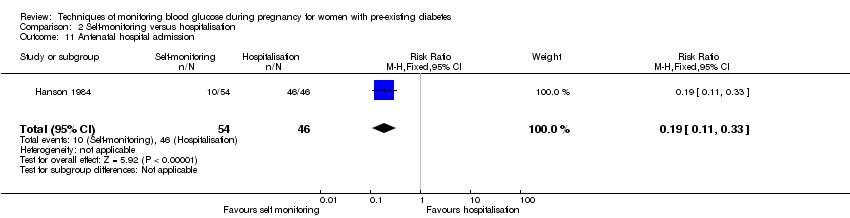
Comparison 2 Self‐monitoring versus hospitalisation, Outcome 11 Antenatal hospital admission.
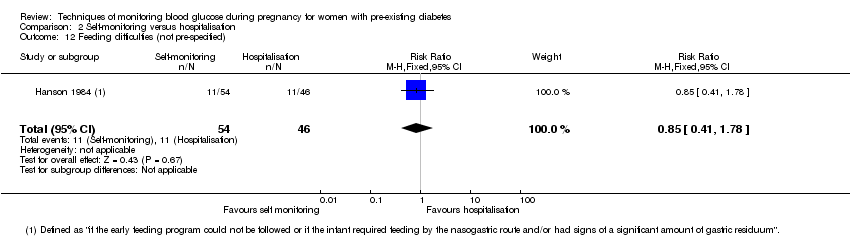
Comparison 2 Self‐monitoring versus hospitalisation, Outcome 12 Feeding difficulties (not pre‐specified).

Comparison 3 Pre‐prandial versus post‐prandial glucose monitoring, Outcome 1 Pre‐eclampsia.
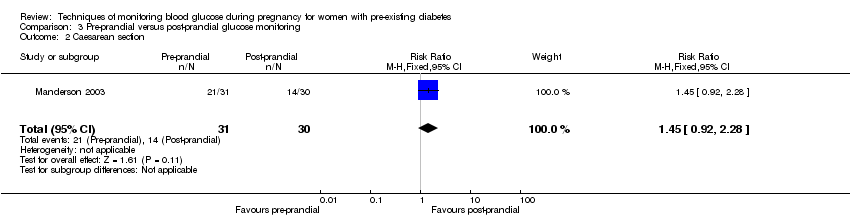
Comparison 3 Pre‐prandial versus post‐prandial glucose monitoring, Outcome 2 Caesarean section.
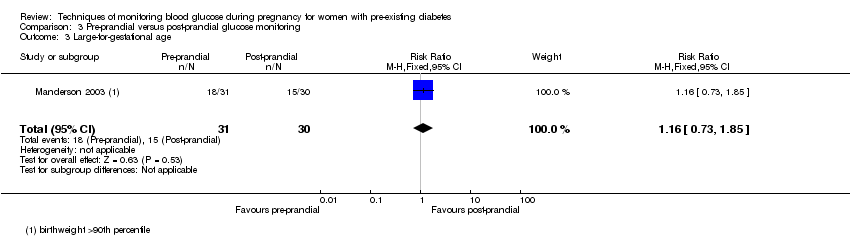
Comparison 3 Pre‐prandial versus post‐prandial glucose monitoring, Outcome 3 Large‐for‐gestational age.

Comparison 3 Pre‐prandial versus post‐prandial glucose monitoring, Outcome 4 Perinatal mortality.

Comparison 3 Pre‐prandial versus post‐prandial glucose monitoring, Outcome 5 Weight gain during pregnancy.
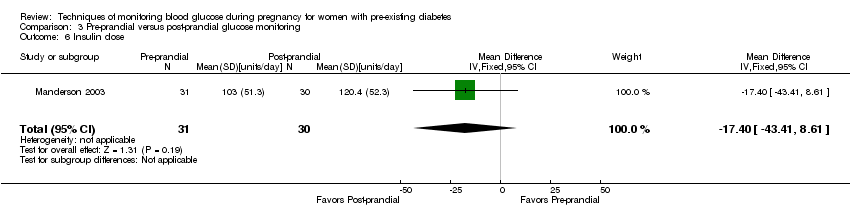
Comparison 3 Pre‐prandial versus post‐prandial glucose monitoring, Outcome 6 Insulin dose.

Comparison 3 Pre‐prandial versus post‐prandial glucose monitoring, Outcome 7 Glycaemic control ‐ Insulin dose.
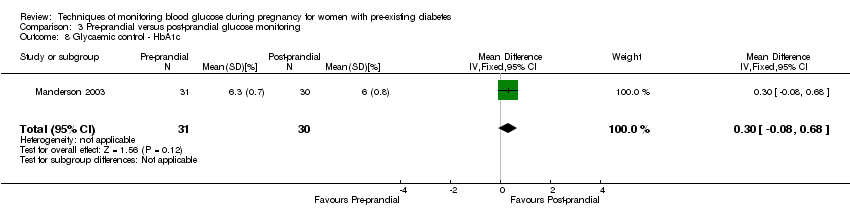
Comparison 3 Pre‐prandial versus post‐prandial glucose monitoring, Outcome 8 Glycaemic control ‐ HbA1c.
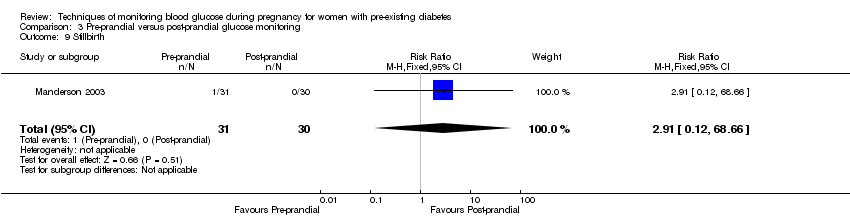
Comparison 3 Pre‐prandial versus post‐prandial glucose monitoring, Outcome 9 Stillbirth.

Comparison 3 Pre‐prandial versus post‐prandial glucose monitoring, Outcome 10 Gestational age at birth.
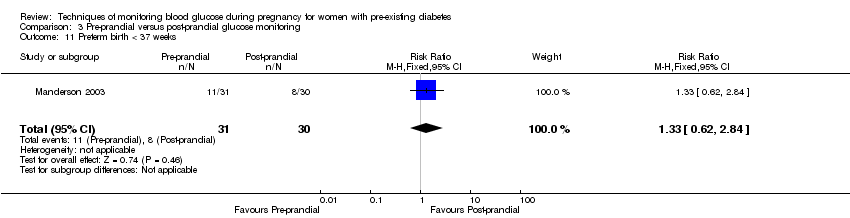
Comparison 3 Pre‐prandial versus post‐prandial glucose monitoring, Outcome 11 Preterm birth < 37 weeks.
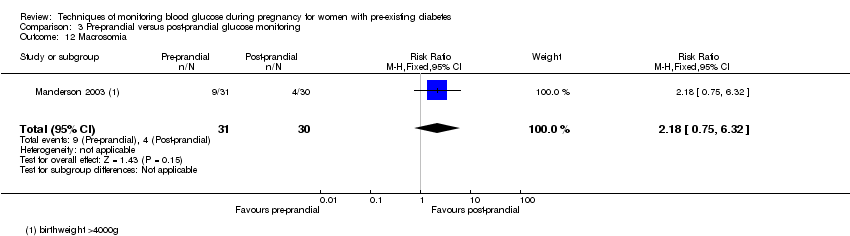
Comparison 3 Pre‐prandial versus post‐prandial glucose monitoring, Outcome 12 Macrosomia.

Comparison 3 Pre‐prandial versus post‐prandial glucose monitoring, Outcome 13 Birthweight.

Comparison 3 Pre‐prandial versus post‐prandial glucose monitoring, Outcome 14 Adiposity ‐ Subscapula skinfold thickness.

Comparison 3 Pre‐prandial versus post‐prandial glucose monitoring, Outcome 15 Adiposity ‐ Triceps skinfold thickness.
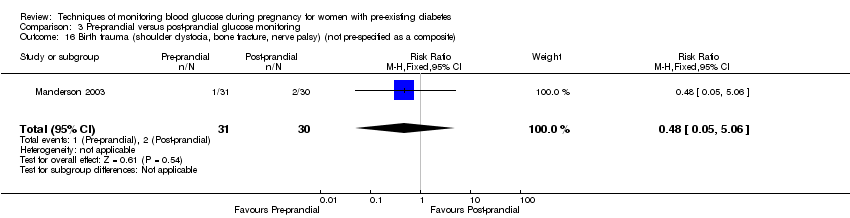
Comparison 3 Pre‐prandial versus post‐prandial glucose monitoring, Outcome 16 Birth trauma (shoulder dystocia, bone fracture, nerve palsy) (not pre‐specified as a composite).
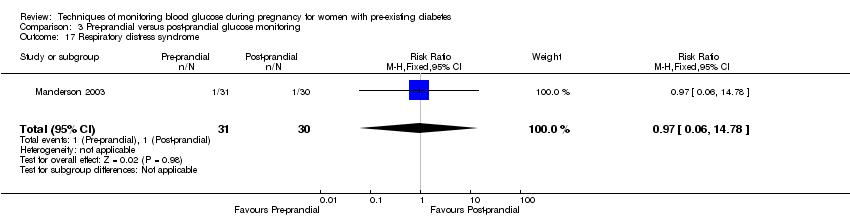
Comparison 3 Pre‐prandial versus post‐prandial glucose monitoring, Outcome 17 Respiratory distress syndrome.

Comparison 3 Pre‐prandial versus post‐prandial glucose monitoring, Outcome 18 Neonatal hypoglycaemia.

Comparison 3 Pre‐prandial versus post‐prandial glucose monitoring, Outcome 19 Neonatal jaundice (hyperbilirubinaemia).
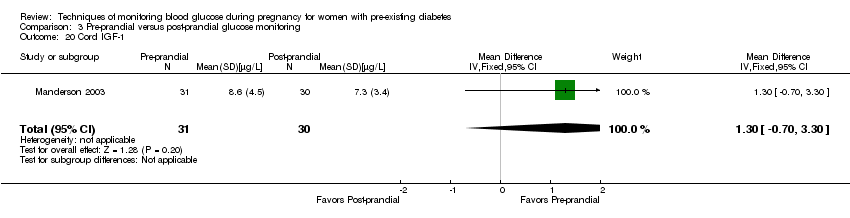
Comparison 3 Pre‐prandial versus post‐prandial glucose monitoring, Outcome 20 Cord IGF‐1.

Comparison 3 Pre‐prandial versus post‐prandial glucose monitoring, Outcome 21 Neonatal glucose at age 1 hour (not pre‐specified).
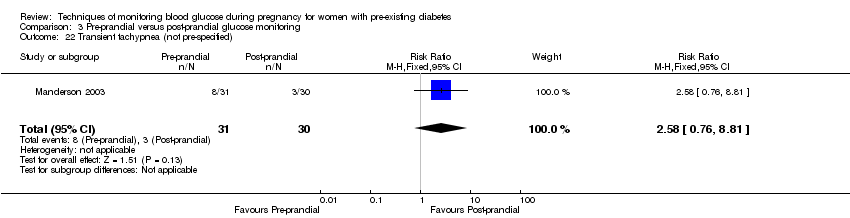
Comparison 3 Pre‐prandial versus post‐prandial glucose monitoring, Outcome 22 Transient tachypnea (not pre‐specified).

Comparison 3 Pre‐prandial versus post‐prandial glucose monitoring, Outcome 23 Neonatal intensive care admissions.

Comparison 4 Automated telemedicine monitoring versus conventional, Outcome 1 Caesarean section.

Comparison 4 Automated telemedicine monitoring versus conventional, Outcome 2 Neonatal morbidity composite.
![Comparison 4 Automated telemedicine monitoring versus conventional, Outcome 3 Weight gain during pregnancy [kg].](/es/cdsr/doi/10.1002/14651858.CD009613.pub3/media/CDSR/CD009613/rel0003/CD009613/image_n/nCD009613-CMP-004-03.png)
Comparison 4 Automated telemedicine monitoring versus conventional, Outcome 3 Weight gain during pregnancy [kg].

Comparison 4 Automated telemedicine monitoring versus conventional, Outcome 4 Use of additional insulin therapy.

Comparison 4 Automated telemedicine monitoring versus conventional, Outcome 5 Insulin requirement at end of study.

Comparison 4 Automated telemedicine monitoring versus conventional, Outcome 6 Glycaemic control ‐ Maternal fasting blood glucose: before breakfast.
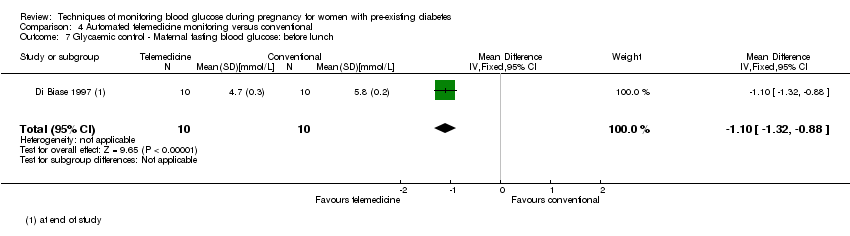
Comparison 4 Automated telemedicine monitoring versus conventional, Outcome 7 Glycaemic control ‐ Maternal fasting blood glucose: before lunch.

Comparison 4 Automated telemedicine monitoring versus conventional, Outcome 8 Glycaemic control ‐ Maternal HbA1c.

Comparison 4 Automated telemedicine monitoring versus conventional, Outcome 9 Glycaemic control ‐ Maternal post‐prandial blood glucose.
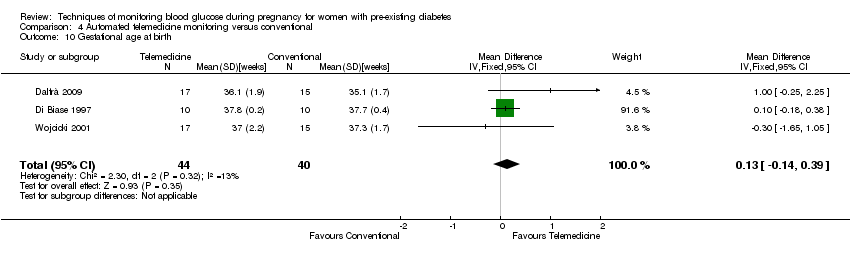
Comparison 4 Automated telemedicine monitoring versus conventional, Outcome 10 Gestational age at birth.

Comparison 4 Automated telemedicine monitoring versus conventional, Outcome 11 Macrosomia.
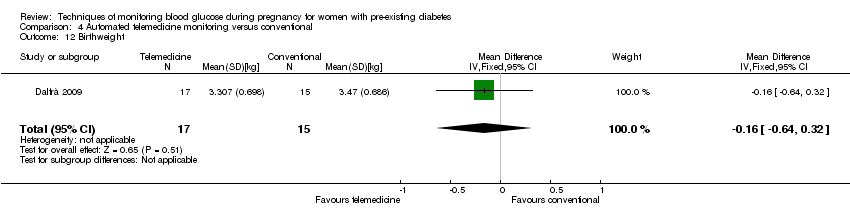
Comparison 4 Automated telemedicine monitoring versus conventional, Outcome 12 Birthweight.

Comparison 5 Continuous glucose monitoring versus intermittent glucose monitoring, Outcome 1 Pre‐eclampsia.

Comparison 5 Continuous glucose monitoring versus intermittent glucose monitoring, Outcome 2 Caesarean section.

Comparison 5 Continuous glucose monitoring versus intermittent glucose monitoring, Outcome 3 Large‐for‐gestational age.
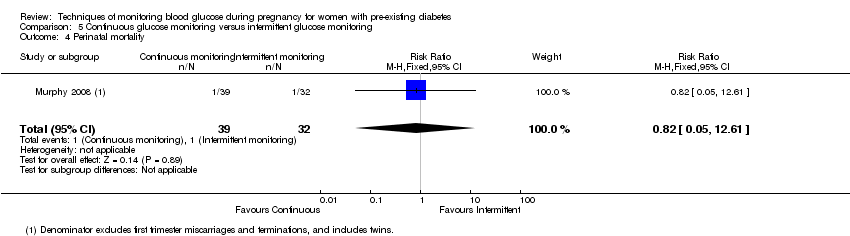
Comparison 5 Continuous glucose monitoring versus intermittent glucose monitoring, Outcome 4 Perinatal mortality.

Comparison 5 Continuous glucose monitoring versus intermittent glucose monitoring, Outcome 5 Glycaemic control ‐ Maternal HbA1c.

Comparison 5 Continuous glucose monitoring versus intermittent glucose monitoring, Outcome 6 Miscarriage.

Comparison 5 Continuous glucose monitoring versus intermittent glucose monitoring, Outcome 7 Neonatal mortality.
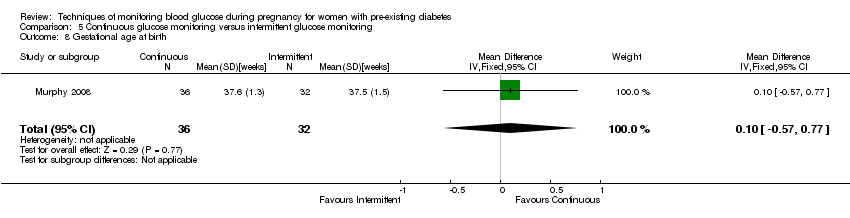
Comparison 5 Continuous glucose monitoring versus intermittent glucose monitoring, Outcome 8 Gestational age at birth.
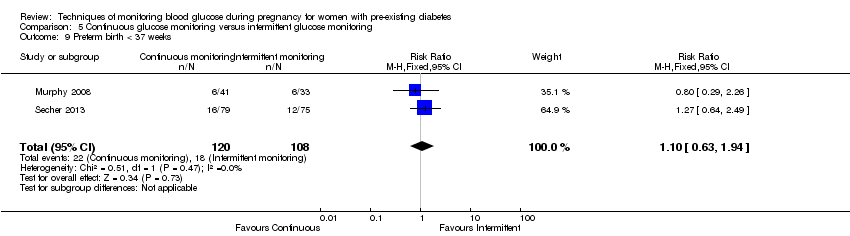
Comparison 5 Continuous glucose monitoring versus intermittent glucose monitoring, Outcome 9 Preterm birth < 37 weeks.
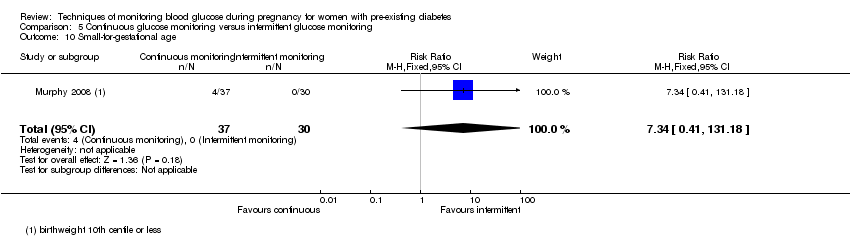
Comparison 5 Continuous glucose monitoring versus intermittent glucose monitoring, Outcome 10 Small‐for‐gestational age.

Comparison 5 Continuous glucose monitoring versus intermittent glucose monitoring, Outcome 11 Birthweight.

Comparison 5 Continuous glucose monitoring versus intermittent glucose monitoring, Outcome 12 Neonatal hypoglycaemia.

Comparison 5 Continuous glucose monitoring versus intermittent glucose monitoring, Outcome 13 Major anomalies.
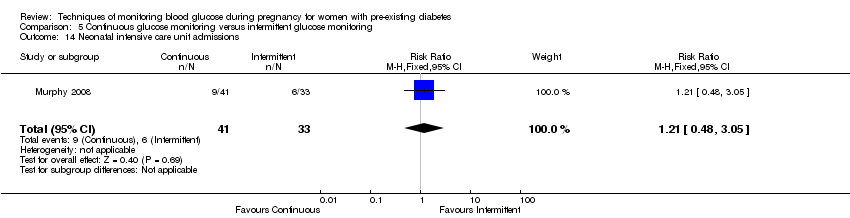
Comparison 5 Continuous glucose monitoring versus intermittent glucose monitoring, Outcome 14 Neonatal intensive care unit admissions.
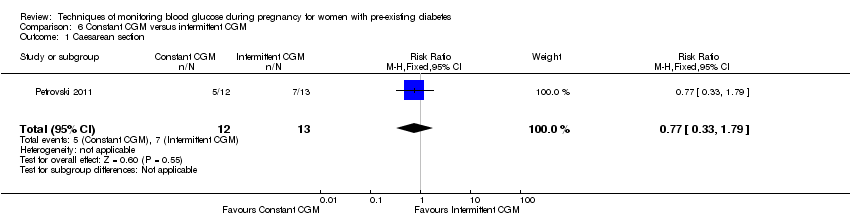
Comparison 6 Constant CGM versus intermittent CGM, Outcome 1 Caesarean section.
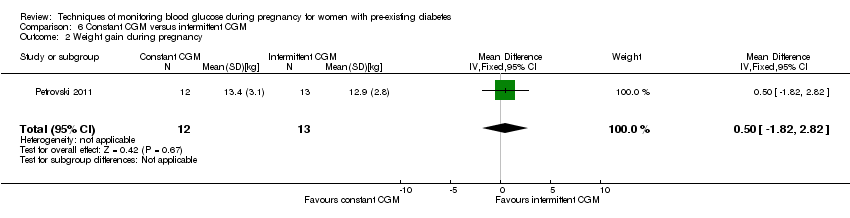
Comparison 6 Constant CGM versus intermittent CGM, Outcome 2 Weight gain during pregnancy.

Comparison 6 Constant CGM versus intermittent CGM, Outcome 3 Insulin dosage, 3rd trimester (IU/kg/day).

Comparison 6 Constant CGM versus intermittent CGM, Outcome 4 Glycaemic control ‐ Maternal blood glucose (1st trimester).
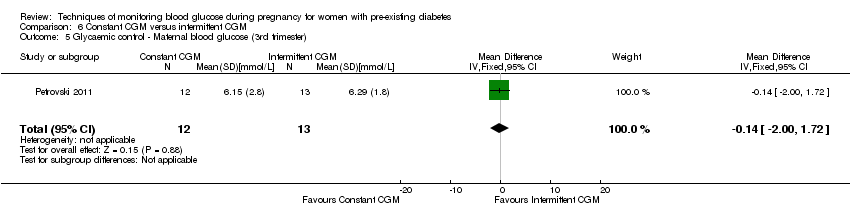
Comparison 6 Constant CGM versus intermittent CGM, Outcome 5 Glycaemic control ‐ Maternal blood glucose (3rd trimester).

Comparison 6 Constant CGM versus intermittent CGM, Outcome 6 Glycaemic control ‐ Maternal HbA1c (1st trimester).
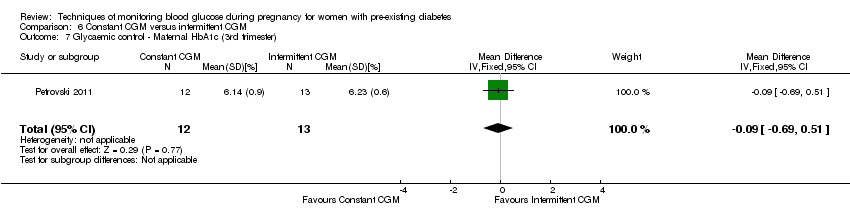
Comparison 6 Constant CGM versus intermittent CGM, Outcome 7 Glycaemic control ‐ Maternal HbA1c (3rd trimester).

Comparison 6 Constant CGM versus intermittent CGM, Outcome 8 Maternal hypoglycemia.
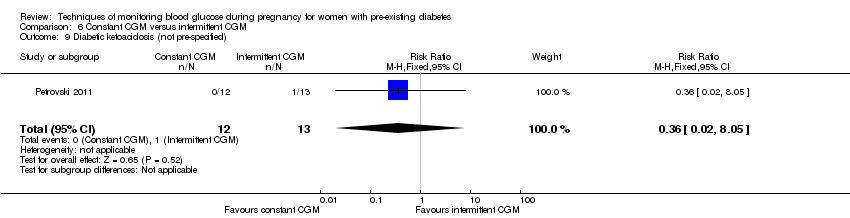
Comparison 6 Constant CGM versus intermittent CGM, Outcome 9 Diabetic ketoacidosis (not pre‐specified).
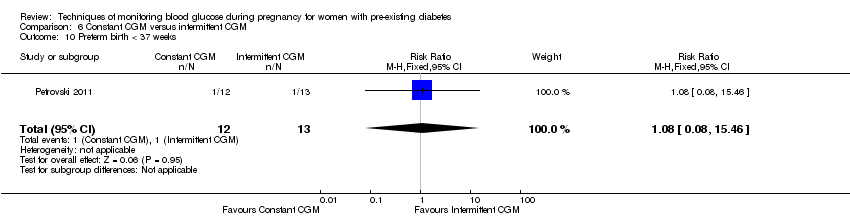
Comparison 6 Constant CGM versus intermittent CGM, Outcome 10 Preterm birth < 37 weeks.

Comparison 6 Constant CGM versus intermittent CGM, Outcome 11 Macrosomia.
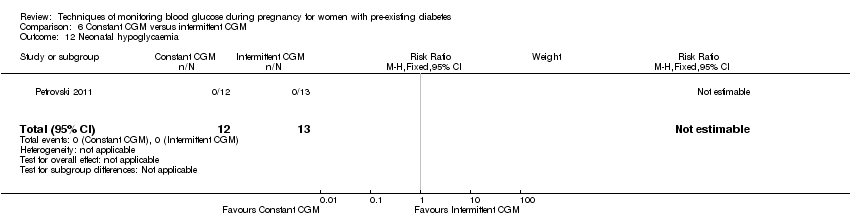
Comparison 6 Constant CGM versus intermittent CGM, Outcome 12 Neonatal hypoglycaemia.
| Self‐monitoring compared to standard care for women with pre‐existing diabetes | ||||||
| Patient or population: women with pre‐existing diabetes | ||||||
| Outcomes | Anticipated absolute effects* (95% CI) | Relative effect | № of participants | Quality of the evidence | Comments | |
| Risk with standard care | Risk with self‐monitoring | |||||
| Hypertensive disorders of pregnancy: pre‐eclampsia | Study population | (0 studies) | The included study did not report this outcome. | |||
| Hypertensive disorders of pregnancy: gestational hypertension | Study population | (0 studies) | The included study did not report this outcome. | |||
| Caesarean section | Study population | RR 0.78 | 28 | ⊕⊝⊝⊝ | ||
| 643 per 1000 | 501 per 1000 | |||||
| Glycaemic control during/end of treatment: Maternal HbA1c (%) | The mean maternal HbA1c was 7.2% | The mean maternal HbA1c with self‐monitoring was 0.10 lower (1.93 lower to 1.73 higher) | 28 | ⊕⊝⊝⊝ | ||
| Glycaemic control during/end of treatment: Maternal post‐prandial blood glucose (mmmol/L) | The mean maternal post‐prandial blood glucose was 5.3 mmol/L | MD 0.70 lower | 13 | ⊕⊝⊝⊝ | ||
| Large‐for‐gestational age | Study population | (0 studies) | The included study did not report this outcome. | |||
| Perinatal mortality | Study population | RR 3.00 | 28 | ⊕⊝⊝⊝ | There were no events in the standard care group and so anticipated absolute effects could not be calculated. | |
| 0 per 1000 | 0 per 1000 | |||||
| Preterm birth less than 37 weeks' gestation | Study population | (0 studies) | The included study did not report this outcome. | |||
| Preterm birth less than 34 weeks' gestation | Study population | (0 studies) | The included study did not report this outcome. | |||
| *The risk in the intervention group (and its 95% confidence interval) is based on the assumed risk in the comparison group and the relative effect of the intervention (and its 95% CI). | ||||||
| GRADE Working Group grades of evidence | ||||||
| 1 One study with design limitations. 2 Wide CI crossing the line of no effect, few events and small sample size. 3 Wide CI crossing the line of no effect, and small sample size. | ||||||
| Self‐monitoring compared to hospitalisation for women with pre‐existing diabetes | ||||||
| Patient or population: women with pre‐existing diabetes | ||||||
| Outcomes | Anticipated absolute effects* (95% CI) | Relative effect | № of participants | Quality of the evidence | Comments | |
| Risk with hospitalisation | Risk with self‐monitoring | |||||
| Hypertensive disorders of pregnancy: pre‐eclampsia | Study population | RR 4.26 | 100 | ⊕⊝⊝⊝ | ||
| 22 per 1000 | 93 per 1000 | |||||
| Hypertensive disorders of pregnancy: hypertension in pregnancy | Study population | RR 0.43 | 100 | ⊕⊝⊝⊝ | ||
| 87 per 1000 | 37 per 1000 | |||||
| Caesarean section | Study population | RR 0.96 | 100 | ⊕⊝⊝⊝ | ||
| 500 per 1000 | 480 per 1000 | |||||
| Glycaemic control during/end of treatment: maternal HbA1c | (0 studies) | The included study did not report this outcome. | ||||
| Glycaemic control during/end of treatment: maternal post‐prandial blood glucose | (0 studies) | The included study did not report this outcome. | ||||
| Large‐for‐gestational age | Study population | (0 studies) | The included study did not report this outcome. | |||
| Perinatal mortality | Study population | RR 0.85 | 100 | ⊕⊝⊝⊝ | ||
| 22 per 1000 | 18 per 1000 | |||||
| Preterm birth less than 37 weeks' gestation | Study population | RR 0.85 | 100 | ⊕⊝⊝⊝ | ||
| 304 per 1000 | 259 per 1000 | |||||
| Preterm birth less than 34 weeks' gestation | Study population | (0 studies) | The included study did not report this outcome. | |||
| *The risk in the intervention group (and its 95% confidence interval) is based on the assumed risk in the comparison group and the relative effect of the intervention (and its 95% CI). | ||||||
| GRADE Working Group grades of evidence | ||||||
| 1 One study with design limitations. 2 Wide CI crossing the line of no effect, few events and small sample size. | ||||||
| Pre‐prandial compared to post‐prandial glucose monitoring for women with pre‐existing diabetes | ||||||
| Patient or population: women with pre‐existing diabetes | ||||||
| Outcomes | Anticipated absolute effects* (95% CI) | Relative effect | № of participants | Quality of the evidence | Comments | |
| Risk with post‐prandial glucose monitoring | Risk with pre‐prandial | |||||
| Hypertensive disorders of pregnancy: pre‐eclampsia | Study population | RR 6.43 | 58 | ⊕⊝⊝⊝ | ||
| 33 per 1000 | 214 per 1000 | |||||
| Hypertensive disorders of pregnancy: gestational hypertension | Study population | (0 studies) | The included study did not report this outcome. | |||
| Caesarean section | Study population | RR 1.45 | 61 | ⊕⊝⊝⊝ | ||
| 467 per 1000 | 677 per 1000 | |||||
| Glycaemic control during/end of treatment: HbA1c (%) | The mean hbA1c was 6% | The mean maternal HbA1c with pre‐prandial monitoring as 0.30 higher (0.08 lower to 0.68 higher) | 61 | ⊕⊝⊝⊝ | ||
| Glycaemic control during/end of treatment: post‐prandial blood glucose | (0 studies) | The included study did not report this outcome. | ||||
| Large‐for‐gestational age | Study population | RR 1.16 | 61 | ⊕⊝⊝⊝ | ||
| 500 per 1000 | 580 per 1000 | |||||
| Perinatal mortality | Study population | RR 2.91 | 61 | ⊕⊝⊝⊝ | There were no events in the standard care group and so anticipated absolute effects could not be calculated. | |
| 0 per 1000 | 0 per 1000 | |||||
| Preterm birth less than 37 weeks | Study population | RR 1.33 | 61 | ⊕⊝⊝⊝ | ||
| 267 per 1000 | 355 per 1000 | |||||
| Preterm birth less than 34 weeks' gestation | Study population | (0 studies) | The included study did not report this outcome. | |||
| *The risk in the intervention group (and its 95% confidence interval) is based on the assumed risk in the comparison group and the relative effect of the intervention (and its 95% CI). | ||||||
| GRADE Working Group grades of evidence | ||||||
| 1 One study with design limitations. 2 Wide CI crossing the line of no effect, few events and small sample size. 3 Wide CI crossing the line of no effect, and small sample size. | ||||||
| Automated telemedicine monitoring compared to conventional for women with pre‐existing diabetes | ||||||
| Patient or population: women with pre‐existing diabetes | ||||||
| Outcomes | Anticipated absolute effects* (95% CI) | Relative effect | № of participants | Quality of the evidence | Comments | |
| Risk with conventional monitoring | Risk with automated telemedicine monitoring | |||||
| Hypertensive disorders of pregnancy: pre‐eclampsia, gestational hypertension | Study population | (0 studies) | The included studies did not report this outcome. | |||
| Hypertensive disorders of pregnancy: gestational hypertension | Study population | (0 studies) | The included studies did not report this outcome. | |||
| Caesarean section | Study population | RR 0.96 | 32 | ⊕⊝⊝⊝ | ||
| 733 per 1000 | 704 per 1000 | |||||
| Glycaemic control during/end of treatment: maternal HbA1c (%) | The mean maternal HbA1c ranged from 5.7 to 6.7% | The mean maternal HbA1c with automated telemedicine monitoring as 0.17 lower (0.82 lower to 0.48 higher) | 82 | ⊕⊝⊝⊝ | ||
| Glycaemic control during/end of treatment: maternal post‐prandial blood glucose (mmol/L) | The mean maternal post‐prandial blood glucose ranged from 6.9 to 7.6% | The mean post‐prandial blood glucose with automated telemedicine monitoring as 0.80 lower (1.67 lower to 0.08 higher) | 50 | ⊕⊝⊝⊝ | ||
| Large‐for‐gestational age | Study population | (0 studies) | The included studies did not report this outcome. | |||
| Perinatal mortality | Study population | (0 studies) | The included studies did not report this outcome. | |||
| Preterm birth less than 37 weeks' gestation | Study population | (0 studies) | The included studies did not report this outcome. | |||
| Preterm birth less than 34 weeks' gestation | Study population | (0 studies) | The included studies did not report this outcome. | |||
| *The risk in the intervention group (and its 95% confidence interval) is based on the assumed risk in the comparison group and the relative effect of the intervention (and its 95% CI). | ||||||
| GRADE Working Group grades of evidence | ||||||
| 1 One study with serious design limitations. 2 Wide CI crossing the line of no effect, few events and small sample size. 3 Studies had design limitations. 4 Statistical heterogeneity (I² = 82%). 5 Wide CI crossing the line of no effect, and small sample size. 6 Statistical heterogeneity (I² = 86%). | ||||||
| Continuous glucose monitoring compared to intermittent glucose monitoring for women with pre‐existing diabetes | ||||||
| Patient or population: women with pre‐existing diabetes | ||||||
| Outcomes | Anticipated absolute effects* (95% CI) | Relative effect | № of participants | Quality of the evidence | Comments | |
| Risk with intermittent glucose monitoring | Risk with continuous glucose monitoring | |||||
| Hypertensive disorders of pregnancy: pre‐eclampsia | Study population | RR 1.37 | 225 | ⊕⊕⊝⊝ | ||
| 56 per 1000 | 76 per 1000 | |||||
| Hypertensive disorders of pregnancy: gestational hypertension | Study population | (0 studies) | The included studies did not report this outcome. | |||
| Caesarean section | Study population | RR 1.00 | 225 | ⊕⊝⊝⊝ | ||
| 481 per 1000 | 481 per 1000 | |||||
| Glycaemic control during/end of treatment: maternal HbA1c (%) | The mean maternal HbA1c was 6.4% | The mean maternal HbA1c with continuous glucose monitoring was 0.60 lower (0.91 lower to 0.29 higher) | 71 | ⊕⊕⊕⊝ | ||
| Glycaemic control during/end of treatment: post‐prandial blood glucose | (0 studies) | The included studies did not report this outcome. | ||||
| Large‐for‐gestational age | Study population | RR 0.89 | 221 | ⊕⊝⊝⊝ | ||
| 410 per 1000 | 364 per 1000 | |||||
| Perinatal mortality | Study population | RR 0.82 | 71 | ⊕⊕⊝⊝ | ||
| 31 per 1000 | 26 per 1000 | |||||
| Preterm birth less than 37 weeks | Study population | RR 1.10 | 228 | ⊕⊕⊝⊝ | ||
| 167 per 1000 | 183 per 1000 | |||||
| Preterm birth less than 34 weeks' gestation | Study population | (0 studies) | The included studies did not report this outcome. | |||
| *The risk in the intervention group (and its 95% confidence interval) is based on the assumed risk in the comparison group and the relative effect of the intervention (and its 95% CI). | ||||||
| GRADE Working Group grades of evidence | ||||||
| 1 Wide CI crossing the line of no effect, few events and small sample size. 2 Statistical heterogeneity (I² = 62%). 3 Wide CI crossing the line of no effect, and small sample size. 4 Small sample size. 5 Statistical heterogeneity (I² = 82%). | ||||||
| Constant CGM compared to Intermittent CGM for women with pre‐existing diabetes | ||||||
| Patient or population: women with pre‐existing diabetes | ||||||
| Outcomes | Anticipated absolute effects* (95% CI) | Relative effect | № of participants | Quality of the evidence | Comments | |
| Risk with Intermittent CGM | Risk with constant CGM | |||||
| Hypertensive disorders of pregnancy: pre‐eclampsia | Study population | (0 studies) | The included study did not report this outcome. | |||
| Hypertensive disorders of pregnancy: gestational hypertension | Study population | (0 studies) | The included study did not report this outcome. | |||
| Caesarean section | Study population | RR 0.77 | 25 | ⊕⊝⊝⊝ | ||
| 538 per 1000 | 415 per 1000 | |||||
| Glycaemic control during/end of treatment: maternal HbA1c (3rd trimester) (%) | The mean maternal HbA1c (3rd trimester) was 6.23% | The mean maternal HbA1c with constant CGM was 0.09 lower (0.69 lower to 0.51 higher) | 25 | ⊕⊝⊝⊝ | ||
| Glycaemic control during/end of treatment: maternal blood glucose (3rd trimester) (mmmol/L) | The mean maternal blood glucose (3rd trimester) was 0 | The mean maternal blood glucose (3rd trimester) with constant CGM was 0.14 lower (2.00 lower to 1.72 higher) | 25 | ⊕⊝⊝⊝ | ||
| Large‐for‐gestational age | Study population | (0 studies) | The included study did not report this outcome. | |||
| Perinatal mortality | Study population | (0 studies) | The included study did not report this outcome. | |||
| Preterm birth less than 37 weeks' gestation | Study population | RR 1.08 | 25 | ⊕⊝⊝⊝ | ||
| 77 per 1000 | 83 per 1000 | |||||
| Preterm birth less than 34 weeks' gestation | Study population | (0 studies) | The included study did not report this outcome. | |||
| *The risk in the intervention group (and its 95% confidence interval) is based on the assumed risk in the comparison group and the relative effect of the intervention (and its 95% CI). | ||||||
| GRADE Working Group grades of evidence | ||||||
| 1 One study with design limitations. 2 Wide CI crossing the line of no effect, few events and small sample size. 3 Wide CI crossing the line of no effect, and small sample size. | ||||||
| Outcome or subgroup title | No. of studies | No. of participants | Statistical method | Effect size |
| 1 Caesarean section Show forest plot | 1 | 28 | Risk Ratio (M‐H, Fixed, 95% CI) | 0.78 [0.40, 1.49] |
| 2 Perinatal mortality Show forest plot | 1 | 28 | Risk Ratio (M‐H, Fixed, 95% CI) | 3.0 [0.13, 67.91] |
| 3 Neonatal mortality and morbidity composite Show forest plot | 1 | 28 | Risk Ratio (M‐H, Fixed, 95% CI) | 3.0 [0.13, 67.91] |
| 4 Glycaemic control during/end of treatment (maternal post‐prandial blood glucose) Show forest plot | 1 | 13 | Mean Difference (IV, Fixed, 95% CI) | ‐0.70 [‐2.15, 0.75] |
| 5 Glycaemic control during/end of treatment (maternal HbA1c) Show forest plot | 1 | 28 | Mean Difference (IV, Fixed, 95% CI) | ‐0.10 [‐1.93, 1.73] |
| 6 Miscarriage Show forest plot | 1 | 30 | Risk Ratio (M‐H, Fixed, 95% CI) | 1.0 [0.07, 14.55] |
| 7 Neonatal mortality Show forest plot | 1 | 28 | Risk Ratio (M‐H, Fixed, 95% CI) | 3.0 [0.13, 67.91] |
| 8 Gestational age at birth Show forest plot | 1 | 28 | Mean Difference (IV, Fixed, 95% CI) | 0.40 [‐1.65, 2.45] |
| 9 Birthweight Show forest plot | 2 | 41 | Mean Difference (IV, Fixed, 95% CI) | ‐0.18 [‐0.49, 0.13] |
| 10 Respiratory distress syndrome Show forest plot | 1 | 28 | Risk Ratio (M‐H, Fixed, 95% CI) | 3.0 [0.13, 67.91] |
| 11 Neonatal hypoglycaemia Show forest plot | 1 | 28 | Risk Ratio (M‐H, Fixed, 95% CI) | 0.57 [0.21, 1.52] |
| 12 Neonatal jaundice (hyperbilirubinaemia) Show forest plot | 1 | 28 | Risk Ratio (M‐H, Fixed, 95% CI) | 0.56 [0.25, 1.24] |
| 13 Neonatal hypocalcaemia Show forest plot | 1 | 28 | Risk Ratio (M‐H, Fixed, 95% CI) | 1.0 [0.07, 14.45] |
| 14 Neonatal polycythaemia Show forest plot | 1 | 28 | Risk Ratio (M‐H, Fixed, 95% CI) | 0.33 [0.01, 7.55] |
| 15 Neonatal cord vein C‐peptide Show forest plot | 1 | 28 | Mean Difference (IV, Fixed, 95% CI) | 0.13 [‐0.50, 0.76] |
| Outcome or subgroup title | No. of studies | No. of participants | Statistical method | Effect size |
| 1 Pre‐eclampsia Show forest plot | 1 | 100 | Risk Ratio (M‐H, Fixed, 95% CI) | 4.26 [0.52, 35.16] |
| 2 Hypertension in pregnancy Show forest plot | 1 | 100 | Risk Ratio (M‐H, Fixed, 95% CI) | 0.43 [0.08, 2.22] |
| 3 Caesarean section Show forest plot | 1 | 100 | Risk Ratio (M‐H, Fixed, 95% CI) | 0.96 [0.65, 1.44] |
| 4 Perinatal mortality Show forest plot | 1 | 100 | Risk Ratio (M‐H, Fixed, 95% CI) | 0.85 [0.05, 13.24] |
| 5 Placental abruption Show forest plot | 1 | 100 | Risk Ratio (M‐H, Fixed, 95% CI) | 1.70 [0.16, 18.19] |
| 6 Preterm birth < 37 weeks Show forest plot | 1 | 100 | Risk Ratio (M‐H, Fixed, 95% CI) | 0.85 [0.45, 1.60] |
| 7 Respiratory distress syndrome Show forest plot | 1 | 100 | Risk Ratio (M‐H, Fixed, 95% CI) | 2.56 [0.28, 23.74] |
| 8 Neonatal hypoglycaemia Show forest plot | 1 | 100 | Risk Ratio (M‐H, Fixed, 95% CI) | 1.01 [0.50, 2.03] |
| 9 Neonatal jaundice (hyperbilirubinaemia) Show forest plot | 1 | 100 | Risk Ratio (M‐H, Fixed, 95% CI) | 2.27 [0.64, 8.07] |
| 10 Major anomalies Show forest plot | 1 | 102 | Risk Ratio (M‐H, Fixed, 95% CI) | 0.27 [0.03, 2.54] |
| 11 Antenatal hospital admission Show forest plot | 1 | 100 | Risk Ratio (M‐H, Fixed, 95% CI) | 0.19 [0.11, 0.33] |
| 12 Feeding difficulties (not pre‐specified) Show forest plot | 1 | 100 | Risk Ratio (M‐H, Fixed, 95% CI) | 0.85 [0.41, 1.78] |
| Outcome or subgroup title | No. of studies | No. of participants | Statistical method | Effect size |
| 1 Pre‐eclampsia Show forest plot | 1 | 58 | Risk Ratio (M‐H, Fixed, 95% CI) | 6.43 [0.82, 50.11] |
| 2 Caesarean section Show forest plot | 1 | 61 | Risk Ratio (M‐H, Fixed, 95% CI) | 1.45 [0.92, 2.28] |
| 3 Large‐for‐gestational age Show forest plot | 1 | 61 | Risk Ratio (M‐H, Fixed, 95% CI) | 1.16 [0.73, 1.85] |
| 4 Perinatal mortality Show forest plot | 1 | 61 | Risk Ratio (M‐H, Fixed, 95% CI) | 2.91 [0.12, 68.66] |
| 5 Weight gain during pregnancy Show forest plot | 1 | 61 | Mean Difference (IV, Fixed, 95% CI) | ‐0.90 [‐3.86, 2.06] |
| 6 Insulin dose Show forest plot | 1 | 61 | Mean Difference (IV, Fixed, 95% CI) | ‐17.40 [‐43.41, 8.61] |
| 7 Glycaemic control ‐ Insulin dose Show forest plot | 1 | 61 | Mean Difference (IV, Fixed, 95% CI) | ‐0.20 [‐0.45, 0.05] |
| 8 Glycaemic control ‐ HbA1c Show forest plot | 1 | 61 | Mean Difference (IV, Fixed, 95% CI) | 0.30 [‐0.08, 0.68] |
| 9 Stillbirth Show forest plot | 1 | 61 | Risk Ratio (M‐H, Fixed, 95% CI) | 2.91 [0.12, 68.66] |
| 10 Gestational age at birth Show forest plot | 1 | 61 | Mean Difference (IV, Fixed, 95% CI) | 0.20 [‐0.84, 1.24] |
| 11 Preterm birth < 37 weeks Show forest plot | 1 | 61 | Risk Ratio (M‐H, Fixed, 95% CI) | 1.33 [0.62, 2.84] |
| 12 Macrosomia Show forest plot | 1 | 61 | Risk Ratio (M‐H, Fixed, 95% CI) | 2.18 [0.75, 6.32] |
| 13 Birthweight Show forest plot | 1 | 61 | Mean Difference (IV, Fixed, 95% CI) | 0.24 [‐0.10, 0.58] |
| 14 Adiposity ‐ Subscapula skinfold thickness Show forest plot | 1 | 61 | Mean Difference (IV, Fixed, 95% CI) | 0.60 [‐0.18, 1.38] |
| 15 Adiposity ‐ Triceps skinfold thickness Show forest plot | 1 | 61 | Mean Difference (IV, Fixed, 95% CI) | 0.60 [0.04, 1.16] |
| 16 Birth trauma (shoulder dystocia, bone fracture, nerve palsy) (not pre‐specified as a composite) Show forest plot | 1 | 61 | Risk Ratio (M‐H, Fixed, 95% CI) | 0.48 [0.05, 5.06] |
| 17 Respiratory distress syndrome Show forest plot | 1 | 61 | Risk Ratio (M‐H, Fixed, 95% CI) | 0.97 [0.06, 14.78] |
| 18 Neonatal hypoglycaemia Show forest plot | 1 | 61 | Risk Ratio (M‐H, Fixed, 95% CI) | 1.09 [0.48, 2.45] |
| 19 Neonatal jaundice (hyperbilirubinaemia) Show forest plot | 1 | 61 | Risk Ratio (M‐H, Fixed, 95% CI) | 1.16 [0.40, 3.40] |
| 20 Cord IGF‐1 Show forest plot | 1 | 61 | Mean Difference (IV, Fixed, 95% CI) | 1.30 [‐0.70, 3.30] |
| 21 Neonatal glucose at age 1 hour (not pre‐specified) Show forest plot | 1 | 61 | Mean Difference (IV, Fixed, 95% CI) | ‐0.20 [‐0.88, 0.48] |
| 22 Transient tachypnea (not pre‐specified) Show forest plot | 1 | 61 | Risk Ratio (M‐H, Fixed, 95% CI) | 2.58 [0.76, 8.81] |
| 23 Neonatal intensive care admissions Show forest plot | 1 | 59 | Risk Ratio (M‐H, Fixed, 95% CI) | 1.04 [0.62, 1.74] |
| Outcome or subgroup title | No. of studies | No. of participants | Statistical method | Effect size |
| 1 Caesarean section Show forest plot | 1 | 32 | Risk Ratio (M‐H, Fixed, 95% CI) | 0.96 [0.62, 1.48] |
| 2 Neonatal morbidity composite Show forest plot | 1 | 32 | Risk Ratio (M‐H, Fixed, 95% CI) | 1.18 [0.53, 2.62] |
| 3 Weight gain during pregnancy [kg] Show forest plot | 1 | 32 | Mean Difference (IV, Fixed, 95% CI) | ‐0.70 [‐4.95, 3.55] |
| 4 Use of additional insulin therapy Show forest plot | 1 | 32 | Risk Ratio (M‐H, Fixed, 95% CI) | 1.0 [0.89, 1.12] |
| 5 Insulin requirement at end of study Show forest plot | 1 | 20 | Mean Difference (IV, Fixed, 95% CI) | 18.4 [12.88, 23.92] |
| 6 Glycaemic control ‐ Maternal fasting blood glucose: before breakfast Show forest plot | 1 | 20 | Mean Difference (IV, Fixed, 95% CI) | ‐1.0 [‐1.22, ‐0.78] |
| 7 Glycaemic control ‐ Maternal fasting blood glucose: before lunch Show forest plot | 1 | 20 | Mean Difference (IV, Fixed, 95% CI) | ‐1.10 [‐1.32, ‐0.88] |
| 8 Glycaemic control ‐ Maternal HbA1c Show forest plot | 3 | 82 | Mean Difference (IV, Random, 95% CI) | ‐0.17 [‐0.82, 0.48] |
| 9 Glycaemic control ‐ Maternal post‐prandial blood glucose Show forest plot | 2 | 50 | Mean Difference (IV, Random, 95% CI) | ‐0.80 [‐1.67, 0.08] |
| 10 Gestational age at birth Show forest plot | 3 | 84 | Mean Difference (IV, Fixed, 95% CI) | 0.13 [‐0.14, 0.39] |
| 11 Macrosomia Show forest plot | 1 | 32 | Risk Ratio (M‐H, Fixed, 95% CI) | 1.18 [0.31, 4.43] |
| 12 Birthweight Show forest plot | 1 | 32 | Mean Difference (IV, Fixed, 95% CI) | ‐0.16 [‐0.64, 0.32] |
| Outcome or subgroup title | No. of studies | No. of participants | Statistical method | Effect size |
| 1 Pre‐eclampsia Show forest plot | 2 | 225 | Risk Ratio (M‐H, Fixed, 95% CI) | 1.37 [0.52, 3.59] |
| 2 Caesarean section Show forest plot | 2 | 225 | Risk Ratio (M‐H, Random, 95% CI) | 1.00 [0.65, 1.54] |
| 3 Large‐for‐gestational age Show forest plot | 2 | 221 | Risk Ratio (M‐H, Random, 95% CI) | 0.89 [0.41, 1.92] |
| 4 Perinatal mortality Show forest plot | 1 | 71 | Risk Ratio (M‐H, Fixed, 95% CI) | 0.82 [0.05, 12.61] |
| 5 Glycaemic control ‐ Maternal HbA1c Show forest plot | 1 | 71 | Mean Difference (IV, Fixed, 95% CI) | ‐0.60 [‐0.91, ‐0.29] |
| 6 Miscarriage Show forest plot | 2 | 228 | Risk Ratio (M‐H, Fixed, 95% CI) | 1.21 [0.28, 5.24] |
| 7 Neonatal mortality Show forest plot | 1 | 74 | Risk Ratio (M‐H, Fixed, 95% CI) | 0.80 [0.05, 12.39] |
| 8 Gestational age at birth Show forest plot | 1 | 68 | Mean Difference (IV, Fixed, 95% CI) | 0.10 [‐0.57, 0.77] |
| 9 Preterm birth < 37 weeks Show forest plot | 2 | 228 | Risk Ratio (M‐H, Fixed, 95% CI) | 1.10 [0.63, 1.94] |
| 10 Small‐for‐gestational age Show forest plot | 1 | 67 | Risk Ratio (M‐H, Fixed, 95% CI) | 7.34 [0.41, 131.18] |
| 11 Birthweight Show forest plot | 1 | 67 | Mean Difference (IV, Fixed, 95% CI) | ‐0.29 [‐0.59, 0.01] |
| 12 Neonatal hypoglycaemia Show forest plot | 2 | 228 | Risk Ratio (M‐H, Fixed, 95% CI) | 0.77 [0.51, 1.16] |
| 13 Major anomalies Show forest plot | 1 | 74 | Risk Ratio (M‐H, Fixed, 95% CI) | 0.80 [0.05, 12.39] |
| 14 Neonatal intensive care unit admissions Show forest plot | 1 | 74 | Risk Ratio (M‐H, Fixed, 95% CI) | 1.21 [0.48, 3.05] |
| Outcome or subgroup title | No. of studies | No. of participants | Statistical method | Effect size |
| 1 Caesarean section Show forest plot | 1 | 25 | Risk Ratio (M‐H, Fixed, 95% CI) | 0.77 [0.33, 1.79] |
| 2 Weight gain during pregnancy Show forest plot | 1 | 25 | Mean Difference (IV, Fixed, 95% CI) | 0.5 [‐1.82, 2.82] |
| 3 Insulin dosage, 3rd trimester (IU/kg/day) Show forest plot | 1 | 25 | Mean Difference (IV, Fixed, 95% CI) | ‐0.03 [‐1.30, 1.24] |
| 4 Glycaemic control ‐ Maternal blood glucose (1st trimester) Show forest plot | 1 | 25 | Mean Difference (IV, Fixed, 95% CI) | ‐0.5 [‐2.70, 1.70] |
| 5 Glycaemic control ‐ Maternal blood glucose (3rd trimester) Show forest plot | 1 | 25 | Mean Difference (IV, Fixed, 95% CI) | ‐0.14 [‐2.00, 1.72] |
| 6 Glycaemic control ‐ Maternal HbA1c (1st trimester) Show forest plot | 1 | 25 | Mean Difference (IV, Fixed, 95% CI) | ‐0.30 [‐1.13, 0.53] |
| 7 Glycaemic control ‐ Maternal HbA1c (3rd trimester) Show forest plot | 1 | 25 | Mean Difference (IV, Fixed, 95% CI) | ‐0.09 [‐0.69, 0.51] |
| 8 Maternal hypoglycemia Show forest plot | 1 | 25 | Risk Ratio (M‐H, Fixed, 95% CI) | 0.54 [0.06, 5.24] |
| 9 Diabetic ketoacidosis (not pre‐specified) Show forest plot | 1 | 25 | Risk Ratio (M‐H, Fixed, 95% CI) | 0.36 [0.02, 8.05] |
| 10 Preterm birth < 37 weeks Show forest plot | 1 | 25 | Risk Ratio (M‐H, Fixed, 95% CI) | 1.08 [0.08, 15.46] |
| 11 Macrosomia Show forest plot | 1 | 25 | Risk Ratio (M‐H, Fixed, 95% CI) | 1.08 [0.08, 15.46] |
| 12 Neonatal hypoglycaemia Show forest plot | 1 | 25 | Risk Ratio (M‐H, Fixed, 95% CI) | 0.0 [0.0, 0.0] |