Tramadol para el tratamiento del dolor postoperatorio en niños
Información
- DOI:
- https://doi.org/10.1002/14651858.CD009574.pub2Copiar DOI

- Base de datos:
-
- Cochrane Database of Systematic Reviews
- Versión publicada:
-
- 18 marzo 2015see what's new
- Tipo:
-
- Intervention
- Etapa:
-
- Review
- Grupo Editorial Cochrane:
-
Grupo Cochrane de Dolor y cuidados paliativos
- Copyright:
-
- Copyright © 2019 The Cochrane Collaboration. Published by John Wiley & Sons, Ltd.
Cifras del artículo
Altmetric:
Citado por:
Autores
Contributions of authors
| Draft the protocol | AS,SR, PZ |
| Develop a search strategy | AS |
| Search for studies (usually 2 authors) | AS, SR, CMF |
| Obtain copies of studies | AS, SR, CMF |
| Select which studies to include (2 + 1 arbiter) | AS, SR, CMF, EPZ |
| Extract data from studies (2 authors) | AS, SR, CMF |
| Enter data into RevMan 5 | AS, SR, CMF |
| Carry out the analysis | AS, SR |
| Interpret the analysis | AS, PZ |
| Draft the final write‐up of the review | AS, PZ, EPZ |
| Update the review | AS, SR, EPZ |
| Content expert name | AS, EPZ |
| Methodologist name | AS |
Declarations of interest
AS has no relevant conflicts of interests.
SR has no relevant conflicts of interests.
CMF has no relevant conflicts of interests.
PZ has no relevant conflicts of interests.
EPZ has no relevant conflicts of interests.
Acknowledgements
We would like to thank the peer reviewers for their valuable comments and the editorial office of the Cochrane Pain, Palliative and Supportive Group for the support. The present review was not sponsored by any drug company or any institutional organisation.
Cochrane Review Group funding acknowledgement: The National Institute for Health Research (NIHR) is the largest single funder of the Cochrane PaPaS Group. Disclaimer: The views and opinions expressed therein are those of the authors and do not necessarily reflect those of the NIHR, National Health Service (NHS) or the Department of Health.
Version history
| Published | Title | Stage | Authors | Version |
| 2015 Mar 18 | Tramadol for postoperative pain treatment in children | Review | Alexander Schnabel, Sylvia U Reichl, Christine Meyer‐Frießem, Peter K Zahn, Esther Pogatzki‐Zahn | |
| 2012 Jan 18 | Tramadol for postoperative pain treatment in children | Protocol | Alexander Schnabel, Esther Pogatzki‐Zahn, Sylvia U Reichl, Peter K Zahn | |
Differences between protocol and review
Postoperative pain scores could not be sufficiently analysed, because there was a large heterogeneity and mainly non validated pain scales were used. Accordingly, other outcomes were included in the summary of findings tables. The definition for moderate to severe pain has been changed from NRS ≥ 3 to > 3. Therefore, the authors decided to assess the outcome 'number of patients with the need for rescue analgesia' as the primary outcome. The systematic search also included the trial database ClinicalTrials.gov, but no other studies were identified. The authors calculated dichotomous data by using the Mantel‐Haenszel method instead of the inverse‐variance method as iniatially proposed. Within the risk of bias section the selective reporting domain has been clarified and we added criteria for the calculation of NNT/NNH (at least four studies). Finally, we reduced the number of planned subgoup analysis (no subgroup analysis focusing on the age of included children, duration of postoperative care (PACU/24h/48h))
Notes
2017
A restricted search in January 2017 did not identify any potentially relevant studies likely to change the conclusions. Therefore, this review has now been stabilised following discussion with the authors and editors. If appropriate, we will update the review if new evidence likely to change the conclusions is published, or if standards change substantially which necessitate major revisions.
2019
A full updated search in March 2019 did not identify any potentially relevant studies likely to change the conclusions. Therefore, this review has now been stabilised following discussion with the authors and editors. The review will be reassessed for updating in five years. If appropriate, we will update the review if new evidence likely to change the conclusions is published, or if standards change substantially which necessitate major revisions.
Readers should be aware that the Food and Drug Administration (FDA) issued an alert on 20 April 2017 restricting the use of codeine and tramadol medicines in children. Codeine is approved to treat pain and cough, and tramadol is approved to treat pain. These medicines carry serious risks, including slowed or difficult breathing and death, which appear to be a greater risk in children younger than 12 years, and should not be used in these children. These medicines should also be limited in some older children. Single‐ingredient codeine and all tramadol‐containing products are FDA‐approved only for use in adults.
Keywords
MeSH
Medical Subject Headings (MeSH) Keywords
Medical Subject Headings Check Words
Adolescent; Child; Child, Preschool; Female; Humans; Infant; Male;
PICO

Study flow diagram.

Risk of bias graph: review authors' judgements about each risk of bias item presented as percentages across all included studies.
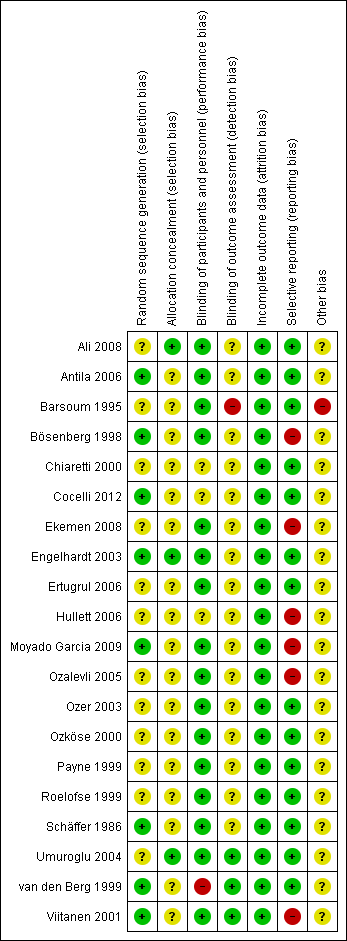
Risk of bias summary: review authors' judgements about each risk of bias item for each included study.
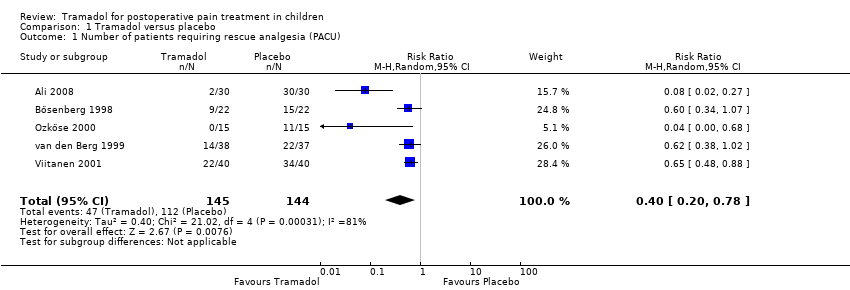
Comparison 1 Tramadol versus placebo, Outcome 1 Number of patients requiring rescue analgesia (PACU).
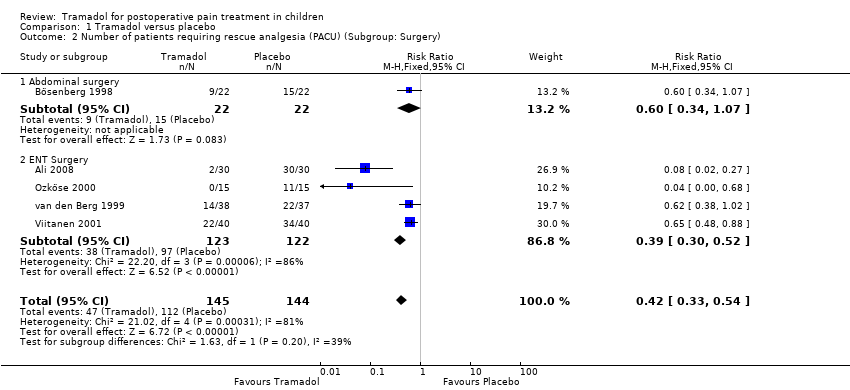
Comparison 1 Tramadol versus placebo, Outcome 2 Number of patients requiring rescue analgesia (PACU) (Subgroup: Surgery).

Comparison 1 Tramadol versus placebo, Outcome 3 Number of patients requiring rescue analgesia (PACU) (Subgroup: Dose).

Comparison 1 Tramadol versus placebo, Outcome 4 Time to first rescue analgesic (min).

Comparison 1 Tramadol versus placebo, Outcome 5 Number of patients with PONV (PACU).
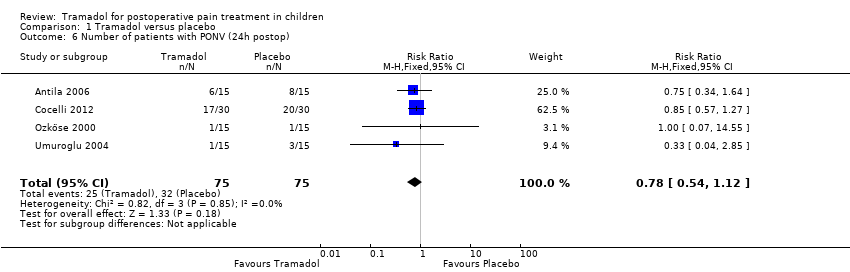
Comparison 1 Tramadol versus placebo, Outcome 6 Number of patients with PONV (24h postop).
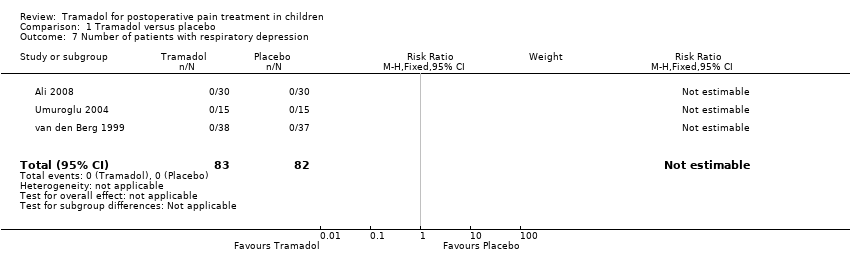
Comparison 1 Tramadol versus placebo, Outcome 7 Number of patients with respiratory depression.

Comparison 2 Tramadol versus morphine, Outcome 1 Number of patients requiring rescue analgesia (PACU).
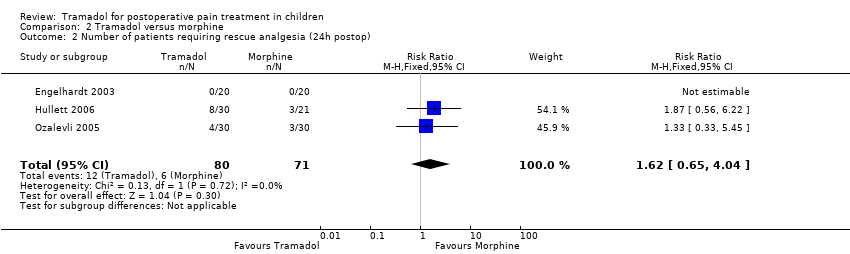
Comparison 2 Tramadol versus morphine, Outcome 2 Number of patients requiring rescue analgesia (24h postop).
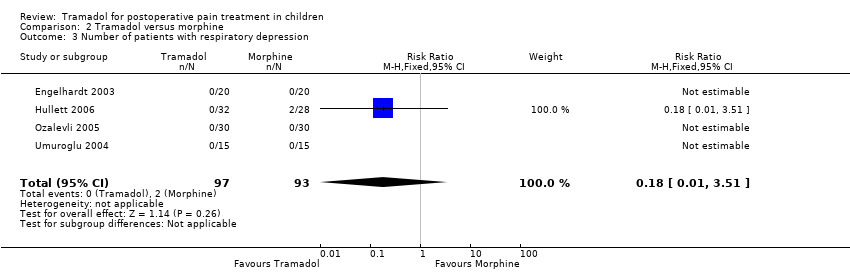
Comparison 2 Tramadol versus morphine, Outcome 3 Number of patients with respiratory depression.
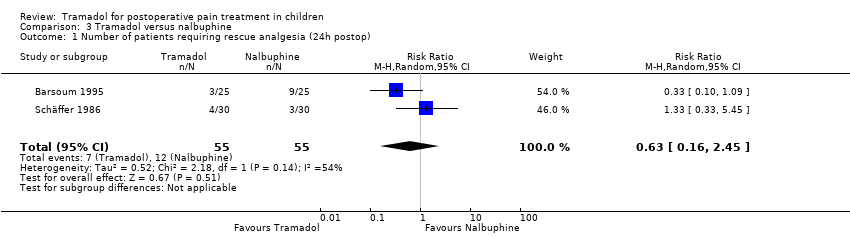
Comparison 3 Tramadol versus nalbuphine, Outcome 1 Number of patients requiring rescue analgesia (24h postop).

Comparison 3 Tramadol versus nalbuphine, Outcome 2 Number of patients with PONV (PACU).

Comparison 3 Tramadol versus nalbuphine, Outcome 3 Number of patients with respiratory depression.

Comparison 3 Tramadol versus nalbuphine, Outcome 4 Number of patients with bradycardia.
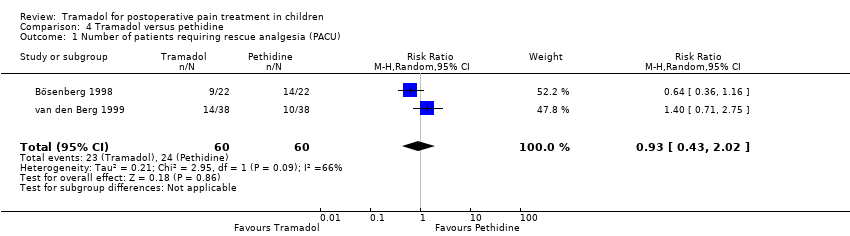
Comparison 4 Tramadol versus pethidine, Outcome 1 Number of patients requiring rescue analgesia (PACU).

Comparison 4 Tramadol versus pethidine, Outcome 2 Number of patients with moderate/severe pain (PACU).
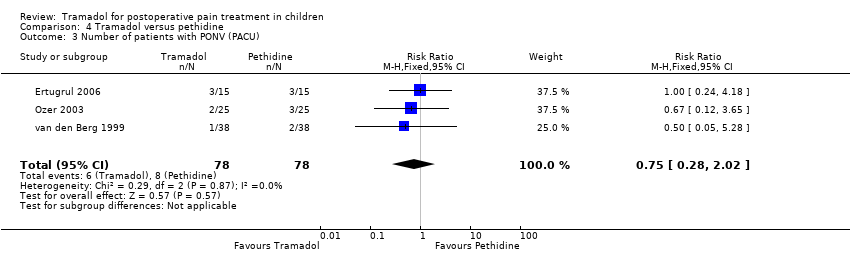
Comparison 4 Tramadol versus pethidine, Outcome 3 Number of patients with PONV (PACU).
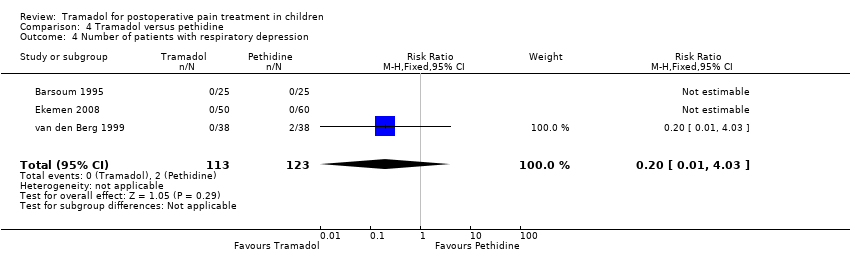
Comparison 4 Tramadol versus pethidine, Outcome 4 Number of patients with respiratory depression.
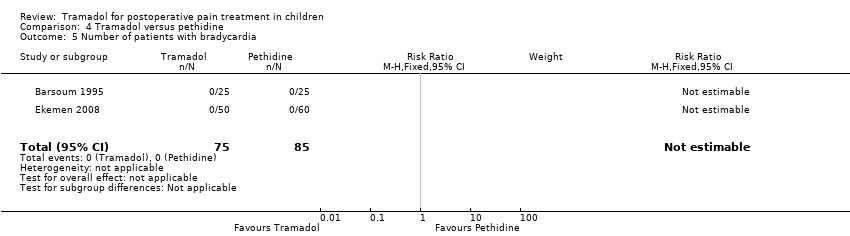
Comparison 4 Tramadol versus pethidine, Outcome 5 Number of patients with bradycardia.
| Tramadol compared with placebo for postoperative pain in children | ||||
| Patient or population: children undergoing surgery Settings: hospital Intervention: 1 to 3 mg/kg tramadol intravenously Comparison: placebo | ||||
| Outcomes | Relative effect | No of participants | Quality of the evidence | Comments |
| Number of patients requiring rescue analgesia (PACU) | RR 0.40 (0.20 to 0.78) | 289 (5) | ⊕⊕⊝⊝ | double‐downgraded due to unexplained heterogeneity and limitations in the study design (use of different pain scales and triggers for rescue analgesia) |
| Number of patients with moderate to severe pain (PACU) | 44 (1) | ⊕⊝⊝⊝ | triple‐downgraded, due to high risk of publication bias, limitations in the study design (use of non‐validated pain scale) and imprecision of results (wide CIs) | |
| Number of patients with PONV (PACU) | RR 0.84 (0.28 to 2.52) | 215 (3) | ⊕⊕⊕⊝ | downgraded due to imprecision of results (wide CIs) |
| Number of patients with PONV (24 hours postoperatively) | RR 0.78 (0.54 to 1.12) | 150 (4) | ⊕⊕⊕⊝ | downgraded due to imprecision of results (wide CIs) |
| GRADE Working Group grades of evidence | ||||
| RR = relative risk CI = confidence interval PONV = postoperative nausea and vomiting PACU = postoperative care unit | ||||
| Tramadol compared with morphine for postoperative pain in children | ||||
| Patient or population: children undergoing surgery Settings: hospital Intervention: 1 to 2 mg/kg tramadol intravenously Comparison: 0.1 mg/kg morphine intravenously | ||||
| Outcomes | Relative effect | No of participants | Quality of the evidence | Comments |
| Number of patients requiring rescue analgesia (PACU) | RR 1.25 (0.83 to 1.89) | 127 (3) | ⊕⊕⊝⊝ | double‐downgraded due to unexplained heterogeneity and limitations in the study design (use of different pain scales and triggers for rescue analgesia) |
| Number of patients with moderate to severe pain (PACU) | no data available | |||
| Number of patients requiring rescue analgesia (24 hours postoperatively) | RR 1.62 (0.65 to 4.04) | 151 (3) | ⊕⊕⊝⊝ | double‐downgraded due to unexplained heterogeneity and limitations in the study design (use of different pain scales and triggers for rescue analgesia) |
| GRADE Working Group grades of evidence | ||||
| RR = relative risk CI = confidence interval PONV = postoperative nausea and vomiting PACU = postoperative care unit | ||||
| Tramadol compared with nalbuphine for postoperative pain in children | ||||
| Patient or population: children undergoing surgery Settings: hospital Intervention: 0.75 to 3 mg/kg tramadol intravenously or intramuscularly Comparison: 0.1 to 0.3 mg/kg nalbuphine intravenously or intramuscularly | ||||
| Outcomes | Relative effect | No of participants | Quality of the evidence | Comments |
| Number of patients requiring rescue analgesia (24 hours postoperatively) | RR 0.63 (0.16 to 2.45) | 110 (2) | ⊕⊝⊝⊝ | triple‐downgraded due to unexplained heterogeneity, limitations in the study design (use of different pain scales and triggers for rescue analgesia) and imprecision of results (wide CIs) |
| Number of patients with moderate to severe pain (PACU) | 50 (1) | ⊕⊝⊝⊝ | triple‐downgraded, due to high risk of publication bias, limitations in the study design (use of non‐validated pain scale) and imprecision of results (wide CIs) | |
| Number of patients with PONV (PACU) | RR 1.00 (0.50 to 2.01) | 137 (2) | ⊕⊕⊝⊝ | double‐downgraded due to unexplained heterogeneity and imprecision of results (wide CIs) |
| GRADE Working Group grades of evidence | ||||
| RR = relative risk CI = confidence interval PONV = postoperative nausea and vomiting PACU = postoperative care unit | ||||
| Tramadol compared with pethidine for postoperative pain in children | ||||
| Patient or population: children undergoing surgery Settings: hospital Intervention: 1 to 3 mg/kg tramadol intravenously, per mouth or intramuscularly Comparison: 1 to 1.5 mg/kg pethidine intravenously, per mouth or intramuscularly | ||||
| Outcomes | Relative effect | No of participants | Quality of the evidence | Comments |
| Number of patients requiring rescue analgesia (PACU) | RR 0.93 (0.43 to 2.02) | 120 (2) | ⊕⊝⊝⊝ | triple‐downgraded due to unexplained heterogeneity, limitations in the study design (use of different pain scales and triggers for rescue analgesia) and imprecision of results (wide CIs) |
| Number of patients with moderate to severe pain (PACU) | RR 0.64 (0.36 to 1.16) | 94 (2) | ⊕⊕⊝⊝ | double‐downgraded due to unexplained heterogeneity and limitations in the study design (use of different pain scales and triggers for rescue analgesia) |
| Number of patients with PONV (PACU) | RR 0.75 (0.28 to 2.02) | 156 (3) | ⊕⊕⊝⊝ | double‐downgraded due to unexplained heterogeneity and imprecision of results (wide CIs) |
| GRADE Working Group grades of evidence | ||||
| RR = relative risk CI = confidence interval PONV = postoperative nausea and vomiting PACU = postoperative care unit | ||||
| Tramadol compared with fentanyl for postoperative pain in children | ||||
| Patient or population: children undergoing surgery Settings: hospital Intervention: 0.5 mg/kg bolus followed by 150 μg/kg/h tramadol intravenously Comparison: 2 µg/kg/h fentanyl intravenously | ||||
| Outcomes | Relative effect | No of participants | Quality of the evidence | Comments |
| Number of patients requiring rescue analgesia (24 hours postoperatively) | 28 (1) | ⊕⊝⊝⊝ | triple‐downgraded, due to high risk of publication bias, limitations in the study design and imprecision of results (wide CIs) | |
| Number of patients with moderate to severe pain (PACU) | no data available | |||
| Number of patients with PONV (24 hours postoperatively) | 28 (1) | ⊕⊝⊝⊝ | triple‐downgraded, due to high risk of publication bias, limitations in the study design and imprecision of results (wide CIs) | |
| GRADE Working Group grades of evidence | ||||
| RR = relative risk CI = confidence interval PONV = postoperative nausea and vomiting PACU = postoperative care unit | ||||
| Outcome or subgroup title | No. of studies | No. of participants | Statistical method | Effect size |
| 1 Number of patients requiring rescue analgesia (PACU) Show forest plot | 5 | 289 | Risk Ratio (M‐H, Random, 95% CI) | 0.40 [0.20, 0.78] |
| 2 Number of patients requiring rescue analgesia (PACU) (Subgroup: Surgery) Show forest plot | 5 | 289 | Risk Ratio (M‐H, Fixed, 95% CI) | 0.42 [0.33, 0.54] |
| 2.1 Abdominal surgery | 1 | 44 | Risk Ratio (M‐H, Fixed, 95% CI) | 0.6 [0.34, 1.07] |
| 2.2 ENT Surgery | 4 | 245 | Risk Ratio (M‐H, Fixed, 95% CI) | 0.39 [0.30, 0.52] |
| 3 Number of patients requiring rescue analgesia (PACU) (Subgroup: Dose) Show forest plot | 5 | 289 | Risk Ratio (M‐H, Fixed, 95% CI) | 0.42 [0.33, 0.54] |
| 3.1 Tramadol 1mg iv. | 2 | 90 | Risk Ratio (M‐H, Fixed, 95% CI) | 0.07 [0.02, 0.21] |
| 3.2 Tramadol 2mg iv. | 2 | 124 | Risk Ratio (M‐H, Fixed, 95% CI) | 0.63 [0.48, 0.83] |
| 3.3 Tramadol 3mg iv. | 1 | 75 | Risk Ratio (M‐H, Fixed, 95% CI) | 0.62 [0.38, 1.02] |
| 4 Time to first rescue analgesic (min) Show forest plot | 3 | 154 | Mean Difference (IV, Random, 95% CI) | 44.66 [‐24.26, 113.58] |
| 5 Number of patients with PONV (PACU) Show forest plot | 3 | 215 | Risk Ratio (M‐H, Fixed, 95% CI) | 0.84 [0.28, 2.52] |
| 6 Number of patients with PONV (24h postop) Show forest plot | 4 | 150 | Risk Ratio (M‐H, Fixed, 95% CI) | 0.78 [0.54, 1.12] |
| 7 Number of patients with respiratory depression Show forest plot | 3 | 165 | Risk Ratio (M‐H, Fixed, 95% CI) | 0.0 [0.0, 0.0] |
| Outcome or subgroup title | No. of studies | No. of participants | Statistical method | Effect size |
| 1 Number of patients requiring rescue analgesia (PACU) Show forest plot | 3 | 127 | Risk Ratio (M‐H, Fixed, 95% CI) | 1.25 [0.83, 1.89] |
| 2 Number of patients requiring rescue analgesia (24h postop) Show forest plot | 3 | 151 | Risk Ratio (M‐H, Fixed, 95% CI) | 1.62 [0.65, 4.04] |
| 3 Number of patients with respiratory depression Show forest plot | 4 | 190 | Risk Ratio (M‐H, Fixed, 95% CI) | 0.18 [0.01, 3.51] |
| Outcome or subgroup title | No. of studies | No. of participants | Statistical method | Effect size |
| 1 Number of patients requiring rescue analgesia (24h postop) Show forest plot | 2 | 110 | Risk Ratio (M‐H, Random, 95% CI) | 0.63 [0.16, 2.45] |
| 2 Number of patients with PONV (PACU) Show forest plot | 2 | 137 | Risk Ratio (M‐H, Fixed, 95% CI) | 1.00 [0.50, 2.01] |
| 3 Number of patients with respiratory depression Show forest plot | 2 | 74 | Risk Ratio (M‐H, Fixed, 95% CI) | 0.0 [0.0, 0.0] |
| 4 Number of patients with bradycardia Show forest plot | 2 | 74 | Risk Ratio (M‐H, Fixed, 95% CI) | 0.0 [0.0, 0.0] |
| Outcome or subgroup title | No. of studies | No. of participants | Statistical method | Effect size |
| 1 Number of patients requiring rescue analgesia (PACU) Show forest plot | 2 | 120 | Risk Ratio (M‐H, Random, 95% CI) | 0.93 [0.43, 2.02] |
| 2 Number of patients with moderate/severe pain (PACU) Show forest plot | 2 | 94 | Risk Ratio (M‐H, Fixed, 95% CI) | 0.64 [0.36, 1.16] |
| 3 Number of patients with PONV (PACU) Show forest plot | 3 | 156 | Risk Ratio (M‐H, Fixed, 95% CI) | 0.75 [0.28, 2.02] |
| 4 Number of patients with respiratory depression Show forest plot | 3 | 236 | Risk Ratio (M‐H, Fixed, 95% CI) | 0.2 [0.01, 4.03] |
| 5 Number of patients with bradycardia Show forest plot | 2 | 160 | Risk Ratio (M‐H, Fixed, 95% CI) | 0.0 [0.0, 0.0] |