Tratamiento combinado y alternado con paracetamol e ibuprofeno para la fiebre en niños
Resumen
Antecedentes
Con frecuencia los profesionales de la salud recomiendan regímenes de tratamiento que combinan o alternan paracetamol e ibuprofeno en los niños con fiebre. Sin embargo, existen dudas acerca de si estos regímenes son mejores que la administración de agentes únicos y acerca del perfil de efectos adversos de los regímenes combinados.
Objetivos
Evaluar los efectos y los efectos secundarios del tratamiento combinado o alternado con paracetamol e ibuprofeno de forma consecutiva, comparado con la monoterapia para el tratamiento de la fiebre en los niños.
Métodos de búsqueda
En septiembre de 2013, se realizaron búsquedas en el registro especializado del Grupo Cochrane de Enfermedades Infecciosas (Cochrane Infectious Diseases Group); Registro Cochrane Central de Ensayos Controlados (Cochrane Central Register of Controlled Trials, CENTRAL); MEDLINE; EMBASE; LILACS; e International Pharmaceutical Abstracts (2009 a 2011).
Criterios de selección
Se incluyeron ensayos controlados aleatorios que compararon regímenes alternados o combinados con paracetamol e ibuprofeno versus monoterapia en niños con fiebre.
Obtención y análisis de los datos
Un revisor y dos asistentes examinaron las búsquedas de forma independiente y aplicaron los criterios de inclusión. Dos revisores de forma independiente evaluaron el riesgo de sesgo y calificaron las pruebas. Se realizaron análisis separados para los diferentes grupos de comparación (tratamiento combinado versus monoterapia, tratamiento alternado versus monoterapia, tratamiento combinado versus tratamiento alternado).
Resultados principales
Se incluyeron seis estudios que reclutaron 915 participantes.
En comparación con la administración de un antipirético único solo, la administración de paracetamol e ibuprofeno combinados para la fiebre en los niños puede dar lugar a una temperatura media inferior a la hora después del tratamiento (DM ‐0,27° Celsius; IC del 95%: ‐0,45 a ‐0,08; dos ensayos, 163 participantes, pruebas de calidad moderada). Cuando no se administran antipiréticos adicionales, el tratamiento combinado probablemente también da lugar a una temperatura media inferior a las cuatro horas (DM ‐0,70° Celsius; IC del 95%: ‐1,05 a ‐0,35; dos ensayos, 196 participantes, pruebas de calidad moderada), y a menos niños que continúan o comienzan a presentar fiebre durante al menos cuatro horas después del tratamiento (CR 0,08; IC del 95%: 0,02 a 0,42, dos ensayos, 196 participantes, pruebas de calidad moderada). Solamente un ensayo evaluó una medida del malestar de los niños (síntomas asociados con la fiebre a las 24 horas y a las 48 horas), aunque no encontró una diferencia significativa en esta medida entre los regímenes de tratamiento (un ensayo, 156 participantes, calidad de las pruebas no calificada).
En la práctica, con frecuencia se aconseja a los cuidadores la administración de un único agente en un principio (paracetamol o ibuprofeno), y luego administrar una dosis adicional del alternativo si la fiebre del niño no logra resolverse o si reaparece. La administración de un tratamiento alternado de esta forma puede dar lugar a una temperatura media inferior una hora después de la segunda dosis (DM ‐0,60° Celsius; IC del 95%: ‐0,94 a ‐0,26; dos ensayos, 78 participantes, pruebas de baja calidad) y también puede dar lugar a menos niños que continúan o comienzan a presentar fiebre hasta tres horas después de su administración (CR 0,25; IC del 95%: 0,11 a 0,55; dos ensayos, 109 participantes, pruebas de baja calidad). Un ensayo evaluó el malestar de los niños (puntuaciones medias de dolor a las 24, 48 y 72 horas) y encontró que estas puntuaciones medias fueron inferiores con el tratamiento alternado, a pesar de la administración de menos dosis del antipirético en general (un ensayo, 480 participantes, pruebas de baja calidad)
Solamente un ensayo pequeño comparó el tratamiento alternado con el tratamiento combinado. No se observaron diferencias estadísticamente significativas en la temperatura media ni en el número de niños con fiebre a la hora, a las cuatro o a las seis horas (un ensayo, 40 participantes, pruebas de muy baja calidad).
En los ensayos no hubo eventos adversos graves que se atribuyeran directamente a los fármacos utilizados.
Conclusiones de los autores
Hay algunas pruebas de que el tratamiento antipirético alternado y el combinado pueden ser más efectivos para reducir la temperatura que la monoterapia sola. Sin embargo, las pruebas de mejorías en las medidas de malestar de los niños no son concluyentes. No hay pruebas suficientes para conocer cuál de los tratamientos combinados o alternados podría tener más efectos beneficiosos. Los estudios de investigación futuros deben medir el malestar de los niños con herramientas estandarizadas y evaluar la seguridad del tratamiento antipirético combinado y alternado.
PICO
Resumen en términos sencillos
Antipiréticos alternados y combinados para el tratamiento de la fiebre en los niños
Los niños con enfermedades infecciosas a menudo presentan fiebre. La fiebre relacionada con enfermedades virales comunes como resfriados, tos, dolor de garganta y enfermedades gastrointestinales, generalmente dura unos pocos días, provoca que los niños se sientan indispuestos y es angustiante para los niños, los padres u otros cuidadores.
El paracetamol (también conocido como acetaminofeno) y el ibuprofeno reducen la temperatura del niño y alivian su malestar. Esta revisión evalúa si la administración de ambos tratamientos combinados, o de los dos tratamientos alternados, es más efectiva que la administración de paracetamol o ibuprofeno solos.
En septiembre de 2013 se encontraron seis estudios con 915 niños que evaluaron el tratamiento combinado o que alterna paracetamol e ibuprofeno para tratar la fiebre en los niños.
En comparación con la administración de ibuprofeno o paracetamol solos, la administración de ambos fármacos juntos probablemente es más efectiva para reducir la temperatura durante las primeras cuatro horas después del tratamiento (pruebas de calidad moderada). Sin embargo, solamente un ensayo evaluó si el tratamiento combinado dio lugar a más malestar o incomodidad en los niños y no encontró diferencias en comparación con ibuprofeno o paracetamol solos.
En la práctica, a menudo se aconseja a los cuidadores la administración de un único agente en un principio (paracetamol o ibuprofeno) y luego administrar una dosis adicional del alternativo si el niño continúa con fiebre. La administración del tratamiento alternado de esta forma puede ser más efectiva para reducir la temperatura durante las primeras tres horas después de la segunda dosis (pruebas de baja calidad) y también puede dar lugar a menos malestar en los niños (pruebas de baja calidad)
Solamente un ensayo pequeño comparó el tratamiento alternado con el tratamiento combinado y no encontró ventajas entre los dos (pruebas de muy baja calidad).
Authors' conclusions
Background
Description of the condition
Fever is a host response to disease caused by the invasion of the body by pathogens (Kluger 1995). Fevers are triggered by the release of endogenous cytokines by white blood cells, which act on the anterior hypothalamus to raise the thermoregulatory set‐point, leading to elevated levels of prostaglandin E2 (PGE2) and a rise in body temperature (Kwiatkowski 1995). This elevation in body temperature is thought to attenuate the viability of some pathogens by recruiting and enhancing components of the immune system, and to help promote healing of damaged cellular components.
Many physicians and caregivers favour treatment of fever with antipyretics to minimize distress, as a child who feels better is more likely to eat and drink, avoiding complications of dehydration and the effects of poor nutrition. Other reasons for treating fever include improving comfort and normalizing body temperature (Crocetti 2001; Schmitt 1980). Rapid increases in fever can result in seizures, which although usually short‐lived and self‐limiting can lead to significant caregiver anxiety. Despite a lack of supporting clinical studies and proven ineffectiveness of prophylaxis in high risk children, some caregivers administer antipyretics to febrile children with a history of febrile seizures to prevent further seizures (Schnaiderman 1993; van Stuijvenberg 1998). The UK National Institute for Health and Care Excellence (NICE) Guidelines note that antipyretics do not prevent febrile convulsions and should not be used for prophylaxis of this condition (NICE Clinical Guidelines). Patients with underlying cardiac and pulmonary disorders may be at risk from fever, as the metabolic demands can be substantial. However, there are no studies that show antipyretics benefit patients with cardiopulmonary disease by reducing metabolic demand (Mackowiak 1998). Paracetamol (also known as acetaminophen) and ibuprofen are two of the most common antipyretic agents used by physicians and caregivers to treat fever.
Description of the intervention
Paracetamol is a para‐aminophenol derivative that is probably a cyclooxygenase‐3 inhibitor, which inhibits the formation and release of PGE2. It appears to act preferentially within the central nervous system to lower levels of fever‐producing cytokines (Feldberg 1973; Mackowiak 1998). It is absorbed via the gastrointestinal tract, with maximal temperature reduction after approximately two hours (Brown 1992; Kelley 1992). The recommended paediatric dose of paracetamol is 12 to 15 mg/kg every four to six hours orally. Paracetamol is also available in an intravenous formulation, with the recommended dose being 15 mg/kg every six hours with a maximum daily dose of 4 g.
Adverse effects include allergic reaction resulting in a pruritic rash, and hepatotoxicity following overdose, which may in turn lead to organ degeneration and death (Kelley 1992). Although paracetamol is used to treat fever in millions of children every day with few or no adverse effects, the risk of overdose with therapeutic intent remains. A study looking at 47 case reports of overdose with therapeutic intent was conducted and found a mortality rate of 55%, with children less than two years old accounting for half the deaths. In 52% of cases, the overdose was the result of children receiving adult preparations of paracetamol (Heubi 1998).
Recently, concerns have been raised regarding the association between paracetamol and the risk of asthma, rhinoconjunctivitis, and eczema in children and adults. The International Study of Asthma and Allergies in Childhood (ISAAC) programme has examined the association between atopy and both the use of paracetamol for fever in the first year of life and the frequency of use in the past 12 months. They concluded that there was an increased risk of asthma symptoms in childhood with paracetamol use for fever in the first year of life, as well as later on in childhood (Beasley 2008; Del‐Rio‐Navarro 2008). A number of other studies have suggested an association between both paracetamol exposure in utero and usage in childhood and wheezing and atopy (Cohet 2004; Newson 2000). A meta‐analysis published in 2009 found an increase in the risk of asthma and wheezing in both children and adults exposed to paracetamol (Etminan 2009). However, a prospective cohort study concluded that no association could be found between early paracetamol use and risk of subsequent allergic disease after adjustment for respiratory infections or when paracetamol use was restricted to non‐respiratory tract infections (Lowe 2010).
Ibuprofen is a nonsteroidal anti‐inflammatory propionic acid derivative that is a non‐selective cyclooxygenase inhibitor, although it has both central and peripheral effects on the nervous system. It is also absorbed via the gastrointestinal tract, with maximal temperature reduction within three hours. The recommended paediatric dose is 5 to 10 mg/kg every six to eight hours.
Adverse effects include gastrointestinal bleeding and renal failure, although ibuprofen has been reported to be as well tolerated as paracetamol (McIntyre 1996). As for paracetamol, risk of overdose with therapeutic intent remains. In children who have taken doses over 400 mg/kg, adverse effects include seizures, apnoea, hypotension, and renal and hepatic dysfunction.
The risk of acetylsalicylic acid‐induced asthma has been well documented for decades; it was first described in 1922, after aspirin first became available (Widal 1922). Due to the high level of cross reactivity with aspirin, caution in the use of other nonsteroidal anti‐inflammatory drugs (NSAIDs), including ibuprofen, has been suggested in asthmatic patients (Kanabar 2007). However, several studies have suggested that the use of ibuprofen does not exacerbate asthma morbidity in children (Lesko 1999; Lesko 2002; McIntyre 1996) and a recent literature review concluded that the risk of asthma morbidity from the use of ibuprofen is low (Kanabar 2007).
Efficacy of paracetamol and ibuprofen
In terms of efficacy, studies show that both paracetamol and ibuprofen are superior to a placebo (Brewer 1968; Walson 1989; Wilson 1991), and that ibuprofen is superior to paracetamol in the treatment of fever (Kauffman 1992; Perrott 2004). Both antipyretics have been found to be equally safe in children. However, literature reviews often conclude that paracetamol should be used preferentially, due to a lower risk of adverse effects (Canadian Pediatric Society 1998; Drwal‐Klein 1992; L’Italien 2001; Renn 2000). To date, there is no Cochrane systematic review summarizing the available literature on the efficacy of paracetamol compared to that of ibuprofen.
How the intervention might work
As paracetamol and ibuprofen have differing mechanisms of action, it is possible that they are more effective when used together than alone. One regimen option is to give both paracetamol and ibuprofen simultaneously (combined therapy), at regular intervals as needed. Another option may be to start with one antipyretic and then only administer the second medication if the fever does not subside within one to four hours (alternating therapy).
Studies have reported that at least 50% of caregivers give their children both antipyretics, but their method of alternating between the two varies (Li 2000). In addition, inaccurate dosing occurs in about half of cases (Mayoral 2000).
Recent guidelines from the UK state no preference for either drug in the treatment of fever, and recommends considering alternating these agents only if the distress persists or recurs before the next dose is due (NICE Clinical Guidelines).
The Canadian Pediatrics Society states no preference for either drug in the treatment of fever, and recommends that alternating therapy should only be used under professional supervision after considering the possible risks and benefits of exposing a child to two drugs (Canadian Pediatric Society 1998).
The American Academy of Pediatrics states that the primary goal of treating febrile children should be to improve overall comfort rather than focus on the normalization of body temperature. Their conclusion is that there is insufficient evidence to support or refute the routine combination of antipyretics (Sullivan 2011).
The Italian Paediatric Society states that antipyretics should only be used when fever is associated with discomfort, and doesn't recommend combining or alternating ibuprofen and paracetamol (Chiappini 2009).
Why it is important to do this review
Although many studies have investigated the efficacy and safety of paracetamol and ibuprofen on their own, fewer studies have explored the efficacy and safety of combined or alternating therapy. In a clinical setting, the use of antipyretics is widely recommended for treating child discomfort rather than absolute temperature. However, the popularity of combined and alternating antipyretics has increased in the literature and it can be extrapolated that these regimens are also increasingly used in clinical settings, particularly primary care. A systematic summary of available evidence would benefit health practitioners and caregivers in making informed decisions regarding the efficacy and safety of alternating and combined paracetamol and ibuprofen therapy.
As treating fever with antipyretics is mainly recommended for alleviating child discomfort, it is important to study qualitative measurements of child discomfort or stress. Although there are no specific standardized rating scales for these measurements in direct relation to fever, other rating scales have been used and are taken into consideration. Objective temperature measurements are generally not recommended as indications for antipyretic therapy. However, body temperature has been well studied in randomized controlled trials and as child discomfort and/or stress may be associated with fever it is still important to analyze objective measures of temperature. Determining specific clinical endpoints to monitor in terms of treatment efficacy (ie time without fever, wellness scores) would be useful for future research and for both caregivers and clinicians in hospital.
Most febrile periods associated with common infectious illnesses in children last one to three days and it is thus important to observe the effect of treatment during the first 24 to 48 hours after fever onset. Our clinical question is: in paediatric patients, is combined or alternating antipyretic treatment more effective than monotherapy for reducing discomfort and temperature in the first 24 to 48 hours of acute febrile illness? In clinical practice, physicians recommend treatment with antipyretics according to child discomfort and not necessarily based on absolute temperature measurements. Thus, one of our primary outcomes focuses on qualitative measures of child comfort.
Objectives
To assess the effects and side effects of combined and/or alternating paracetamol and ibuprofen versus monotherapy for the treatment of fever in children.
Methods
Criteria for considering studies for this review
Types of studies
Randomized controlled trials (RCTs).
Types of participants
Inclusion Criteria
Children up to 18 years of age, with new fever associated with presumed infectious origin. Fever is defined by individual study authors.
Exclusion Criteria
Children with injury or undergoing surgery at the time of fever.
Types of interventions
-
Combined therapy versus ibuprofen alone
-
Combined therapy versus paracetamol alone
-
Alternating therapy versus ibuprofen alone
-
Alternating therapy versus paracetamol alone
-
Combined therapy versus alternating therapy.
Combined therapy is defined as simultaneous administration of paracetamol and ibuprofen at regular intervals. Alternating therapy is defined as one antipyretic (either paracetamol or ibuprofen) administered immediately and the second medication (either paracetamol or ibuprofen) administered only if fever does not subside within one to four hours.
Types of outcome measures
Primary outcomes
-
Measures of child discomfort, including stress scores; number of doses of medications given; and absences from daycare or school.
-
Proportion of febrile children at one, four and six hours after administration of initial antipyretic.
Secondary outcomes
-
Adverse events
-
-
Serious adverse events leading to hospitalization
-
Other adverse events (ie gastrointestinal symptoms, hepatic dysfunction/failure, renal dysfunction/failure).
-
Search methods for identification of studies
We attempted to identify all relevant trials regardless of language or publication status, ie published, unpublished, in press, and ongoing.
Electronic searches
We searched the following databases on 6 September 2013 (all available, no date restrictions) using the search terms detailed in Appendix 1: Cochrane Infectious Diseases Group Specialized Register; Cochrane Central Register of Controlled Trials (CENTRAL), published in The Cochrane Library; MEDLINE; EMBASE; LILACS; and International Pharmaceutical Abstracts. In addition to the terms noted in the table, we employed the highly sensitive search strategy for identifying RCTs in MEDLINE (sensitivity‐maximizing version) described in the current Cochrane Handbook for Systematic Reviews of Interventions (section 6.4.11; Higgins 2011). We also used the recommended terms for identifying RCTs in EMBASE, as outlined in the current Handbook (section 6.3.2.2).
We searched the metaRegister of Controlled Trials (mRCT) for ongoing trials.
Searching other resources
Conference proceedings of the Pediatric Academic Society / American Academy of Pediatrics and the American Society for Toxicology (2009 to 2013) were handsearched but did not reveal any eligible trials that were not already identified in the initial search. ClinicalTrials.gov was searched and one eligible study (Adding a Second Drug for Febrile Children Treated With Acetaminophen) was found. However, when contacted, the main author reported that the study had to be stopped due to difficulties with recruitment.
We contacted pharmaceutical companies, study authors, and researchers working in the field for unpublished or ongoing trials and did not find any eligible trials.
Reference lists of all included and excluded studies were checked and did not reveal any eligible trials that were not already identified in the initial search.
Data collection and analysis
Selection of studies
In the first phase, one author and two assistants (TW, CC, EM) independently examined citations generated from a search based on Title, Abstract and MeSH headings. Trials were designated as RCT, possible RCT, or non‐RCT. All potentially relevant articles (RCTs and possible RCTs) were retrieved. Multiple copies of the same publication were identified and removed.
In the second phase, copies of the full text articles were reviewed independently by the three reviewers. Decisions on inclusion were based on the criteria as described above. Trial authors were contacted if there was need for clarification of study protocols or data. Disagreements were resolved by discussion between the reviewers. If multiple copies of the same publication were identified, all publications were assessed for differences in data sets. Studies reported in non‐English language journals were translated before assessment.
Data extraction and management
Data extraction was carried out independently by two authors (TW, AT) using standard data extraction forms. Data from each study, including study characteristics (location of study, patient demographics, intervention details etc) and details of outcome measures, were entered onto separate forms. For dichotomous outcomes, the number of events, the number of patients analyzed, and the number of patients randomized for each group were extracted. For continuous outcomes, the mean and standard deviation for each group were extracted. Authors were contacted in order to obtain missing or additional data.
Further information required from the original author was requested by written correspondence. Relevant information obtained in this manner was included in the review. Disagreements in data extraction were resolved by discussion amongst the authors.
Assessment of risk of bias in included studies
Two authors (TW, AT) independently assessed risk of bias for the studies using the Cochrane Risk of Bias tool. The tool assessed six domains: sequence generation, allocation concealment, blinding, missing outcome data, selective outcome reporting, and 'other sources of bias' (eg balance across groups of demographic variables at baseline, inappropriate influence of study sponsor). We followed guidelines in the Cochrane Handbook for applying the Risk of Bias tool (Higgins 2011). Results are presented in the risk of bias graph, summary, and tables.
Measures of treatment effect
We assessed the superiority of combined and alternating antipyretics versus monotherapy in terms of effect on child discomfort, temperature reduction and side effects. We analysed continuous outcomes using mean differences (MD) and 95% confidence intervals (CI). Mean differences were used for outcomes measured on the same scale and we planned to use standardized mean differences for outcomes measured on different scales across the trials. We calculated 95% CI and reported risk ratios for dichotomous data.
Dealing with missing data
Quantitative analyses of outcomes were based on intention‐to‐treat results. An available case analysis that included all patients with a measured outcome was conducted.
Assessment of heterogeneity
The I2 statistic with a value of 50% was taken to indicate moderate heterogeneity; 50% to 75% indicated substantial heterogeneity; and 75% to 100% indicated considerable heterogeneity (Higgins 2002). A Chi2 test was also used to assess heterogeneity using a P value < 0.1 to denote significant heterogeneity. The overlap of CI was also compared.
Assessment of reporting biases
We planned to assess reporting biases by constructing funnel plots using risk ratios. However, we did not have sufficient data to accurately assess funnel plots.
Data synthesis
Review Manager 5 was used to combine and analyze the trial data (Review Manager). The analysis was stratified by comparison (alternating therapy versus monotherapy, combined therapy versus monotherapy, combined therapy versus alternating therapy). A fixed‐effect model was used when there was no heterogeneity and a random‐effects model was used when moderate heterogeneity existed.
Grading the body of evidence
We used the Evidence‐based Practice Centers' Grading of Recommendations Assessment, Development and Evaluation (GRADE) approach to assess overall strength of evidence (Guyatt 2008). We evaluated the following outcomes judged to be most relevant: child discomfort; mean temperature for first 24 to 48 hours; proportion of afebrile children at one, four and six hours after administration of initial antipyretic; and other measures of child comfort or parental perception of antipyretic efficacy. We examined four domains: risk of bias, consistency, directness and precision.
The overall strength of evidence was graded as high (further research is very unlikely to change our confidence in the estimate of effect), moderate (further research may change our confidence in the estimate of effect and may change the estimate), low (further research is likely to change our confidence in the estimate of effect and is likely to change the estimate), or insufficient (evidence either is unavailable or does not permit estimation of an effect).
Two review authors (TW, AS) independently graded the body of evidence using GRADE guidance (GRADEpro 2008) and decision rules adapted to the clinical and research context. For the risk of bias domain, we considered all evidence as high or medium, as we only included RCTs. All decisions were made explicitly and we calculated inter‐rater agreement (available from authors). Two review authors (TW, AS) resolved discrepancies through consensus.
Sensitivity analysis
We had planned to assess the robustness of results using sensitivity analyses for risk of bias components, but were unable to do so due to the limited number of studies.
Results
Description of studies
See Characteristics of included studies; Characteristics of excluded studies
Results of the search
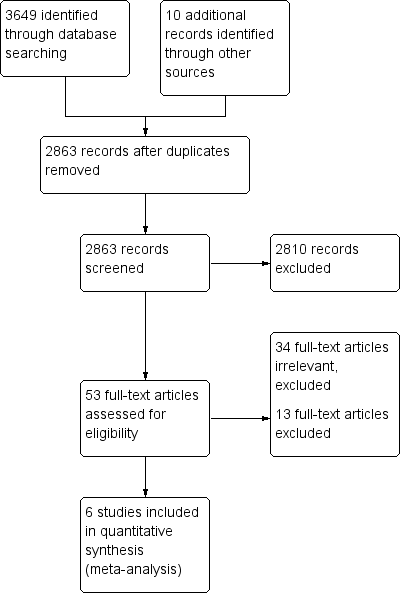
The search strategy identified 3649 citations from electronic databases (Figure 1). After screening titles and abstracts, 53 studies were assessed to be potentially relevant. Ten additional studies were identified for further examination after handsearching abstracts from the Pediatric Academic Society conference proceedings, but none met the inclusion criteria. No additional studies were identified for further examination after contact with experts or handsearching reference lists from previous systematic reviews and included studies.

Study flow diagram.
We reviewed the full text of 53 reports using the pre‐defined inclusion criteria: 34 trials were considered irrelevant to this review and excluded; 13 studies were related to the review topic but did not fulfil the inclusion criteria and are excluded for the reasons stated in the Characteristics of excluded studies table.
Included studies
Six studies, enrolling 915 participants, are included in this review.
For detailed information on each study, refer to Characteristics of included studies tables. No distinction was made between inpatients and outpatients.
Four studies considered children with a temperature of 38 °C or above to be febrile (Erlewyn‐Lajeunesse 2006; Kramer 2008; Nabulsi 2006; Paul 2010). Other studies defined fever as a temperature greater than or equal to 37.8 °C (Hay 2008; Sarrell 2006). For temperature measurement, one study used continuous axillary temperature probes (Hay 2008), one used tympanometric thermometers (Erlewyn‐Lajeunesse 2006), one used temporal artery thermometers (Paul 2010), two studies used rectal thermometers (Nabulsi 2006; Sarrell 2006), and one study used a combination of oral thermometers (> two years old) and rectal thermometers (< two years old) (Kramer 2008).
In all six studies, antipyretic medication was administered orally. Five studies used a paracetamol dose of 15 mg/kg orally (Erlewyn‐Lajeunesse 2006; Hay 2008; Kramer 2008; Nabulsi 2006; Paul 2010) and one study used a loading dose of paracetamol of 25 mg/kg with subsequent doses of 12.5 mg/kg (Sarrell 2006). Four studies used an ibuprofen dose of 10 mg/kg (Hay 2008; Kramer 2008; Nabulsi 2006; Paul 2010), one study used an ibuprofen dose of 5 mg/kg (Erlewyn‐Lajeunesse 2006) and one study used an ibuprofen loading dose of 10mg/kg with subsequent doses of 5 mg/kg (Sarrell 2006).
Three studies compared alternating therapy to ibuprofen alone (Nabulsi 2006; Paul 2010; Sarrell 2006) and two studies compared alternating therapy to paracetamol alone (Kramer 2008; Sarrell 2006). Three studies looked at combined therapy versus ibuprofen alone (Erlewyn‐Lajeunesse 2006; Hay 2008; Paul 2010) and two studies looked at combined therapy versus paracetamol alone (Erlewyn‐Lajeunesse 2006; Hay 2008). Only one study compared alternating therapy to combined therapy (Paul 2010). A summary of the drug dosing and timing is shown in Table 1.
| Study ID | Time after administration (hours) | |||||||||
| 0 | 1 | 2 | 3 | 4 | 5 | 6 | 7 | 8 | ||
| P (15 mg/kg) | Ⓣ | Ⓣ | ||||||||
| I (5 mg/kg) | Ⓣ | Ⓣ | ||||||||
| P (15 mg/kg) + I (5 mg/kg) | Ⓣ | Ⓣ | ||||||||
| P (15 mg/kg) | Ⓣ | Ⓣ P | Ⓣ | Ⓣ | ||||||
| I (10 mg/kg) | Ⓣ | Ⓣ | Ⓣ I | Ⓣ | ||||||
| P (15 mg/kg) + I (10 mg/kg) | Ⓣ | Ⓣ P | Ⓣ I | Ⓣ | ||||||
| P (15 mg/kg) | Ⓣ | Ⓣ P | Ⓣ | Ⓣ | ||||||
| P (15 mg/kg) | Ⓣ I (10 mg/kg) | Ⓣ | Ⓣ | Ⓣ | ||||||
| I (10 mg/kg) | Ⓣ | Ⓣ | Ⓣ | Ⓣ | Ⓣ | |||||
| I (10 mg/kg) | Ⓣ P (15 mg/kg) | Ⓣ | Ⓣ | Ⓣ | Ⓣ | |||||
| I (10 mg/kg) | Ⓣ | Ⓣ | Ⓣ | Ⓣ | Ⓣ | Ⓣ | ||||
| I (10 mg/kg) | Ⓣ | Ⓣ | Ⓣ P | Ⓣ | Ⓣ | Ⓣ | ||||
| I (10 mg/kg) + P (15 mg/kg) | Ⓣ | Ⓣ | Ⓣ | Ⓣ | Ⓣ | Ⓣ | ||||
| P or I | P | |||||||||
| P or I | I | |||||||||
| P or I | P | I | ||||||||
Ⓣ = Temperature reported; P = paracetamol; I = ibuprofen
1Sarrell 2006 asked caretakers to record rectal temperatures three times per day.
The primary outcomes of all studies involved temperature measurements, although these measurements were taken at a wide range of time points after initial medication ingestion (one hour to five days). Three studies also attempted to assess child comfort (Hay 2008; Kramer 2008; Sarrell 2006).
Secondary outcomes included: temperature at two hours, time spent in emergency department (Erlewyn‐Lajeunesse 2006); time to temperature first falling below 37.2 °C in the first 24 hours (fever clearance), time spent without fever over 24 hours, proportion of children without fever‐associated symptoms at 48 hours and day five (Hay 2008); symptom checklist at three and four hours, parental perception of efficacy at three and four hours (Kramer 2008); proportions of afebrile children in each group at seven and eight hours from baseline, maximum decline in temperature during study period, time to recurrence of fever, mean temperature changes from baseline at four and eight hours (Nabulsi 2006); total days that a primary caretaker had to stay home from work because the infant could not attend daycare due to illness, recurrence of fever within five and 10 days after initiation of treatment, and number of emergency department visits within ten days of enrolment (Sarrell 2006).
Adverse effects were listed as a secondary outcome in four studies (Hay 2008; Kramer 2008; Nabulsi 2006; Sarrell 2006) and were not reported in two studies (Erlewyn‐Lajeunesse 2006; Paul 2010).
Excluded studies
One study (Lal 2000) met the search criteria for a RCT in the topic of interest. However, relevant data on mean temperature was not reported. The author of the trial was contacted and did not have available access to the desired data. Thus, the trial was excluded. Another study (Pashapour 2009) met the search criteria for a RCT in the topic of interest. However, the comparison was not relevant to this review as patients received only single doses of medication in the alternating group. For detailed information on reasons for exclusion refer to the Characteristics of excluded studies table.
Risk of bias in included studies
Domain‐specific and overall risk of bias assessments are detailed in the Characteristics of included studies table and summarized by outcome and study in Figure 2 and Figure 3, respectively.

Risk of bias graph: review authors' judgements about each risk of bias item presented as percentages across all included studies.
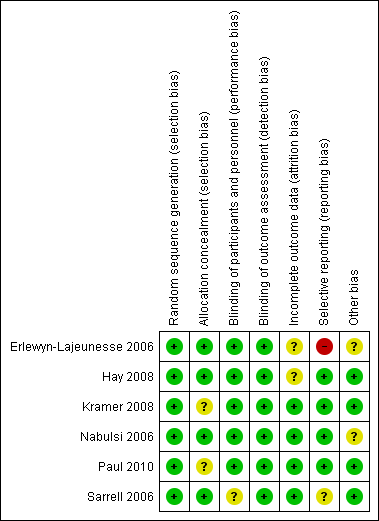
Risk of bias summary: review authors' judgements about each risk of bias item for each included study.
Allocation
All six studies had a low risk of bias when reporting a method for generating the randomization sequence (Erlewyn‐Lajeunesse 2006; Hay 2008; Kramer 2008; Nabulsi 2006; Paul 2010; Sarrell 2006).
Four studies had a low risk of bias when concealing the randomization sequence from the investigators and participants (Erlewyn‐Lajeunesse 2006; Hay 2008; Nabulsi 2006; Sarrell 2006). Two studies had an unclear risk of bias when reporting allocation concealment (Kramer 2008; Paul 2010).
Blinding
Five studies had a low risk of bias when addressing blinding of patients and participating personnel (Erlewyn‐Lajeunesse 2006; Hay 2008; Kramer 2008; Nabulsi 2006; Paul 2010). One study had an unclear risk of bias when addressing blinding of patients and participating personnel (Sarrell 2006).
Six studies had a low risk of bias when addressing blinding of outcome assessors (Erlewyn‐Lajeunesse 2006; Hay 2008; Kramer 2008; Nabulsi 2006; Paul 2010; Sarrell 2006; ).
Incomplete outcome data
There was a low risk of bias for incomplete outcome reporting in four studies (Kramer 2008; Nabulsi 2006; Paul 2010; Sarrell 2006) and an unclear risk of bias in two studies (Erlewyn‐Lajeunesse 2006; Hay 2008).
Selective reporting
Four studies had a low risk of bias when reporting outcomes in methods/protocol and results (Hay 2008; Kramer 2008; Nabulsi 2006; Paul 2010), one study had unclear reporting (Sarrell 2006), and one study had a high risk of bias when reporting all outcomes in the methods/protocol and results (Erlewyn‐Lajeunesse 2006).
Other potential sources of bias
The studies were assessed for bias in terms of potential for inappropriate influence of funding agencies and important imbalances in baseline characteristics. Three studies were at low risk of bias for these other sources of bias (Hay 2008; Kramer 2008; Sarrell 2006). Two studies were unclear (Erlewyn‐Lajeunesse 2006; Nabulsi 2006) and two studies were at least partially funded by pharmaceutical companies (Nabulsi 2006; Paul 2010). One study did not disclose sources of funding (Sarrell 2006).
Effects of interventions
Summaries of findings are provided for the following comparisons: alternating versus single agent (Table 2; Table 3), combined versus single agent (Table 4), and alternating versus combined therapy (Table 5).
| Alternating versus single agent for fever in children | |||||||
| Patient or population: children with fever | |||||||
| Outcomes | Timepoint | Illustrative comparative risks* (95% CI) | Relative effect | No of participants | Quality of the evidence | Comments | |
| Assumed risk | Corresponding risk | ||||||
| Single agent | Alternating regimen | ||||||
| NCCPC score A score of 7 or more indicates pain. | Day 1 | The mean NCCPC score in the control group was | The mean NCCPC score in the intervention groups was | ‐ | 309 | ⊕⊕⊝⊝ | |
| Day 2 | The mean NCCPC score in the control group was | The mean NCCPC score in the intervention groups was | ‐ | 475 | ⊕⊕⊝⊝ | ||
| Day 3 | The mean NCCPC score in the control group was | The mean NCCPC score in the intervention groups was | ‐ | 464 | ⊕⊕⊝⊝ | ||
| *The basis for the assumed risk (eg the median control group risk across studies) is provided in footnotes. The corresponding risk (and its 95% CI) is based on the assumed risk in the comparison group and the relative effect of the intervention (and its 95% CI). | |||||||
| GRADE Working Group grades of evidence | |||||||
1 Downgraded by 2 for risk of bias: in this study mothers collected the data on NCCPC scores and were unblinded to allocation. In addition, in this study the mean number of doses of medication was actually lower in the group allocated to alternating treatment. The reasons for this are unclear as logically they should receive more doses.
| Alternating versus single agent for fever in children | |||||||
| Patient or population: children with fever | |||||||
| Outcomes | Timepoint | Illustrative comparative risks* (95% CI) | Relative effect | No of participants | Quality of the evidence | Comments | |
| Assumed risk | Corresponding risk | ||||||
| Single agent | Alternating regimen | ||||||
| Mean Temperature | 1 hour | The mean temperature in the control group was | The mean temperature in the intervention groups was | ‐ | 40 | ⊕⊝⊝⊝ | Children in the alternating regimen group received a second dose of antipyretic at 3‐4 hours |
| 4 hours | The mean temperature in the control groups ranged from | The mean temperature in the intervention groups was | ‐ | 78 | ⊕⊕⊝⊝ | ||
| 6 hours | The mean temperature in the control group was | The mean temperature in the intervention groups was | ‐ | 40 | ⊕⊝⊝⊝ | ||
| Proportion febrile | 1 hour | 20 per 100 | 20 per 100 | RR 1 | 40 | ⊕⊝⊝⊝ | Children in the alternating regimen group received a second dose of antipyretic at 3‐4 hours |
| 4 hours | 30 per 100 | 2 per 100 | RR 0.08 | 40 | ⊕⊝⊝⊝ | ||
| 6 hours | 45 per 100 | 11 per 100 | RR 0.25 | 109 | ⊕⊕⊝⊝ | ||
| *The basis for the assumed risk (eg the median control group risk across studies) is provided in footnotes. The corresponding risk (and its 95% CI) is based on the assumed risk in the comparison group and the relative effect of the intervention (and its 95% CI). | |||||||
| GRADE Working Group grades of evidence | |||||||
1 This single study compared a single dose of ibuprofen with ibuprofen plus paracetamol 3 hours later.
2 At this time point both treatment arms had received the same medication so differences would not be expected.
3 Downgraded by 1 for risk of bias: this study was at unclear risk of selection bias as allocation concealment was not described.
4 Downgraded by 2 for very serious imprecision due to the very small sample size.
5Paul 2010 compared ibuprofen at baseline plus paracetamol at 3 hours in the intervention group. Kramer 2008 compared paracetamol at baseline plus ibuprofen at 3 hours in the intervention group.
6 Downgraded by 1 for serious risk of bias: both studies are at unclear risk of selection bias as allocation concealment was not described.
7 Downgraded by 1 for imprecision due to the small sample size.
8Paul 2010 compared ibuprofen at baseline plus paracetamol at 3 hours in the intervention group. Nabulsi 2006 compared ibuprofen at baseline plus paracetamol at 4 hours in the intervention group.
| Combined versus single agent for fever in children | |||||||
| Patient or population: children with fever Control: a single agent alone at baseline | |||||||
| Outcomes | Timepoint | Illustrative comparative risks* (95% CI) | Relative effect | No of participants | Quality of the evidence | Comments | |
| Assumed risk | Corresponding risk | ||||||
| Single agent | Combined regimen | ||||||
| Mean Temperature | 1 hour | The mean temperature in the control groups ranged from | The mean temperature in the intervention groups was | ‐ | 163 | ⊕⊝⊝⊝ moderate 1,2,3 | |
| 4 hours | The mean temperature in the control groups ranged from | The mean temperature in the intervention groups was | ‐ | 173 | ⊕⊝⊝⊝ moderate 4,2,3 | ||
| 6 hours | The mean temperature in the control group was | The mean temperature in the intervention groups was | ‐ | 40 | ⊕⊝⊝⊝ | ||
| Proportion Febrile | 1 hour | 20 per 100 | 10 per 100 | RR 0.5 | 40 | ⊕⊝⊝⊝ | |
| 4 hours | 23 per 100 | 2 per 100 | RR 0.08 | 196 | ⊕⊝⊝⊝ moderate 4,2,3 | ||
| 6 hours | 50 per 100 | 5 per 100 | RR 0.10 | 40 participants | ⊕⊝⊝⊝ | ||
| *The basis for the assumed risk (eg the median control group risk across studies) is provided in footnotes. The corresponding risk (and its 95% CI) is based on the assumed risk in the comparison group and the relative effect of the intervention (and its 95% CI). | |||||||
| GRADE Working Group grades of evidence | |||||||
1 These two studies compared ibuprofen plus paracetamol at baseline with ibuprofen alone (Paul 2010) or ibuprofen or paracetamol alone (Erlewyn‐Lajeunesse 2006).
2 No serious indirectness: these studies were conducted in the UK and the USA in children with mild febrile illness. The studies excluded children with signs of severe illness or contra‐indications to the study drugs.
3 Downgraded by 1 for imprecision due to the small sample size of the studies.
4 These two studies compared ibuprofen plus paracetamol at baseline with ibuprofen alone (Paul 2010 and Hay 2008).
5 This single study was conducted in the USA and compared ibuprofen plus paracetamol at baseline with ibuprofen alone (Paul 2010).
6 Downgraded by 1 for risk of selection bias as allocation concealment was not described.
7 Downgraded by 2 for very serious imprecision: only one very small study.
| Combined versus alternating therapy for fever in children | |||||||
| Patient or population: children with fever | |||||||
| Outcomes | Timepoint | Illustrative comparative risks* (95% CI) | Relative effect | No of participants | Quality of the evidence | Comments | |
| Assumed risk | Corresponding risk | ||||||
| Alternating therapy | Combinedtherapy | ||||||
| Mean Temperature | 1 hour | The mean temperature in the control group was | The mean temperature in the intervention groups was | ‐ | 40 | ⊕⊝⊝⊝ | |
| 4 hours | The mean temperature in the control group was | The mean temperature in the intervention groups was | ‐ | 40 | ⊕⊝⊝⊝ | ||
| 6 hours | The mean temperature in the control group was | The mean temperature in the intervention groups was | ‐ | 40 | ⊕⊝⊝⊝ | ||
| Proportion Febrile | 1 hour | 200 per 1000 | 100 per 1000 | RR 0.5 | 40 | ⊕⊝⊝⊝ | |
| 4 hours | ‐ | ‐ | Not estimable | 40 | ⊕⊝⊝⊝ | ||
| 6 hours | 0 per 1000 | 0 per 1000 | RR 3 | 40 | ⊕⊝⊝⊝ | ||
| *The basis for the assumed risk (eg the median control group risk across studies) is provided in footnotes. The corresponding risk (and its 95% CI) is based on the assumed risk in the comparison group and the relative effect of the intervention (and its 95% CI). | |||||||
| GRADE Working Group grades of evidence | |||||||
1 This single study was conducted in the USA.
2 Downgraded by 1 for risk of bias: this study was at unclear risk of selection bias as allocation concealment was not described.
3 Downgraded by 2 for very serious imprecision due to the very small sample size.
Comparison 1. Combined antipyretics versus single agent
Three studies conducted in the UK and the USA compared giving ibuprofen and paracetamol together at baseline with giving a single agent alone. Two studies compared combined therapy with both paracetamol alone and ibuprofen alone (Erlewyn‐Lajeunesse 2006; Hay 2008), and one study compared combined therapy with ibuprofen alone (Paul 2010).
Measures of child discomfort
One study (Hay 2008) assessed fever‐associated symptoms at 24 hours, 48 hours and five days, but found no consistent evidence showing a benefit of combined therapy over a single agent (data was not presented in the article).
Temperature
Mean temperature was lower after combined treatment at one hour (MD ‐0.27, 95% CI ‐0.45 to ‐0.08, 163 participants, two trials), four hours (MD ‐0.70, 95% CI ‐1.05 to ‐0.35, 173 participants, two trials, Analysis 1.1) and six hours (MD ‐1.30, 95% CI ‐2.01 to ‐0.59, 40 participants, one trial, Analysis 1.1). All reported mean temperatures were 38 °C and below between one and six hours.
There was no significant difference in the proportion of patients still febrile at one hour after initial antipyretic administration (RR 0.50, 95% CI 0.10 to 2.43, 40 participants, one trial). However, the proportion remaining febrile was significantly lower following combined treatment at four hours (RR 0.08, 95% CI 0.02 to 0.42, 196 participants, two trials) and six hours (RR 0.10, 95% CI 0.01 to 0.71, 40 participants, one trial, Analysis 1.2).
Comparison 2. Alternating antipyretics versus single agent
Three studies conducted in the USA, Lebanon and Israel evaluated the benefits of administering a second antipyretic three to four hours after the first dose of a single agent. Two studies administered ibuprofen to both groups at baseline followed by paracetamol to the intervention group at three to four hours (Nabulsi 2006; Paul 2010), and one study administered paracetamol to both groups at baseline followed by ibuprofen to the intervention group at three hours (Kramer 2008).
One additional three‐arm study compared alternating paracetamol and ibuprofen every four hours with paracetamol alone (every six hours) and ibuprofen alone (every eight hours) (Sarrell 2006). The children were followed up for three days through telephone conversations with caregivers, who were asked to measure the rectal temperature three times daily, record the number of doses of medications given, and to assess the non‐communicating children's pain checklist (NCPCC) score. The NCCPC scoring system was designed to be used for children (3 to 18 years) who are unable to speak; a total score of seven or more indicates a child is experiencing pain.
Measures of child discomfort
Sarrell 2006 found that NCPCC scores were lower in children receiving alternating therapy than in those receiving either of the single agents (day one versus paracetamol alone: MD ‐2.51, 95% CI ‐3.08 to ‐1.94, 309 participants, one trial; versus ibuprofen alone: MD ‐2.22, 95% CI ‐2.78 to 1.66, 310 participants, one trial, Analysis 2.1). The benefits of alternating therapy were also apparent on days two and three, although mean NCPCC scores decreased in all groups over time (Analysis 2.1). There were no significant differences between ibuprofen alone and paracetamol alone.
The study also looked at days absent from daycare as a secondary outcome, which also favoured the alternating group (versus paracetamol alone: MD ‐0.88, 95% CI ‐1.02 to ‐0.74, 309 participants, one trial; versus ibuprofen alone: ‐0.82, 95% CI ‐0.96 to ‐0.68, 310 participants, one trial, Analysis 2.2).
However, the trial reports that the alternating group actually received a lower mean number of doses of antipyretic per child. This finding suggests that the allocated regimens were not followed by the caretaker even during the first day. In the light of this, it is difficult to understand the improvement in NCPCC scores and reduction in days absent from childcare.
Temperature
At one hour after administration of ibuprofen to both groups, Paul 2010 found no difference in mean temperature (MD 0.00, 95% CI ‐0.28 to 0.28, 40 participants, one trial, Analysis 2.4). At four hours, one hour after administration of the alternative agent to the intervention group, the mean temperature was significantly lower in the intervention group (MD ‐0.60, 95% CI ‐0.94 to ‐0.26, 78 participants, two trials, Analysis 2.4). One study demonstrated that this difference remained statistically significant at six hours (MD ‐1.60, 95% CI ‐2.27 to ‐0.93, 40 participants, one trial, Analysis 2.4).
In studies administering ibuprofen to both groups at baseline, followed by paracetamol at three to four hours for the intervention group, the proportion remaining febrile was significantly lower in the intervention group at six hours (RR 0.25, 95% CI 0.11 to 0.55, 109 participants, two trials, Analysis 2.5).
Comparison 3. Combined versus alternating
One study conducted in the USA compared giving combined ibuprofen and paracetamol at baseline, with giving ibuprofen alone followed by paracetamol three hours later (Paul 2010).
Measures of child discomfort.
The study did not address measures of child discomfort.
Temperature
Mean temperature was lower following combined therapy at one hour, although this did not reach statistical significance (MD ‐0.20, 95% CI ‐0.48 to 0.08, 40 participants, one trial, Analysis 3.1). At four hours, one hour after the alternating group received their second antipyretic, there was no difference between the groups (MD 0.00, 95% CI ‐0.19 to 0.19, 40 participants, one trial, Analysis 3.1). At six hours, mean temperature was lower in the group given alternating therapy (MD 0.30, 95% CI 0.01 to 0.59, 40 participants, one trial, Analysis 3.1)
The proportion remaining febrile at one, four and six hours was very low in both groups with no significant differences between them (40 participants, one study, Analysis 3.2).
Adverse effects
Overall, there were no serious adverse effects thought to be associated with alternating, combined or monotherapy found in any studies. However, no study had sufficient power in terms of number of participants to make a definitive statement about frequency of severe adverse effects. A table summarizing adverse effect evaluation for each study is available in Table 6.
| Comparison | Studies | N
| Duration of follow up | Serious adverse events | Comments |
| Combined versus single agent | 123 | 2 hours | Not reported |
| |
| 156 | 5 days | Five serious AE occurred (Admission to hospital ‐ reasons not reported) with no difference between groups | Non‐severe adverse events (mainly diarrhoea and vomiting) were evenly distributed between groups2 | ||
| 46 | 6 hours | Not reported |
| ||
| Alternating versus single agent
| 46 | 6 hours | Not reported | ||
|
| 40 | 6 hours
| None observed
| Non‐severe adverse effects reported in 8/38 (21%) of patients with no difference between groups1
| |
|
| 70 | 8 hours | None observed | Rectal temperature < 36.5 °C (range 35.0 °C to 36.2 °C) 5 (13.9%) combined group 6 (18.2%) ibuprofen group
| |
| 480 | 14 days | None observed | Mild elevated liver enzymes, n=8, mild abnormal renal function, n=14, all normalized by 14 day follow up | ||
| Alternating versus combined therapy | 46 | 6 hours | Not reported |
|
1 Non‐severe AE stated as: diarrhoea, flatulence, emesis, decreased appetite, epigastric pain, nausea, headache, insomnia. Symptoms did not prevent any patients from taking study medications.
Discussion
Summary of main results
Six trials, enrolling 915 participants, are included.
Compared to giving a single antipyretic alone, giving combined paracetamol and ibuprofen to febrile children can result in a lower mean temperature at one hour after treatment (moderate quality evidence). If no further antipyretics are given, combined treatment probably also results in a lower mean temperature at four hours (moderate quality evidence), and in fewer children remaining or becoming febrile for at least four hours after treatment (moderate quality evidence).
In practice, mothers are often advised to initially give a single agent (paracetamol or ibuprofen), and then give a further dose of the alternative if the child's fever fails to resolve or recurs. Giving alternating treatment in this way may result in a lower mean temperature at one hour after the additional dose (low quality evidence), and may also result in fewer children remaining or becoming febrile for up to three hours after it is given (low quality evidence).
Only one small trial compared alternating therapy with combined therapy. No statistically significant differences were seen in mean temperature or in the number febrile at one, four or six hours (very low quality evidence).
There were no serious adverse events in the trials that were directly attributed to the medications used.
Overall completeness and applicability of evidence
This review was intended to focus on patient comfort/distress as the primary outcome of, and the primary reason for, administering antipyretics, but information on patient comfort/distress was rarely reported, and reliable conclusions could not be made. 'Discomfort' is not an easily definable outcome and this review was only able to consider a few measurable, albeit potentially indirect, manifestations (ie pain score, amount of medication given, days away from daycare). In fact, comfort is a complex construct, which likely varies across different age groups and may even extend to caregivers of febrile children. The amount of medication given to children by caregivers may be a reflection of their distress over child discomfort. This review does not address the role of caregiver distress in the management of febrile children.
For the effects of antipyretics on temperature, the included studies enrolled children aged six months to 14 years with fever presumed to be viral or bacterial in origin. The trials were from moderate to high income settings in Europe, the USA, and the Middle East, and therefore the findings should not be extrapolated to tropical settings where the common causes of fever may be substantially different.
There was a large amount of variation between the trials in medication dosage, regimens of administration, and frequency and type of assessment. Due to the small number of studies in each comparison, we were unable to assess the impact of these variations.
Similarly, there was large variation in patient factors such as age, aetiology (viral or bacteria), severity of illness, and co‐morbidities that may affect the effectiveness of interventions. Two studies only included children less than five years old. Only one study attempted to distinguish between viral and bacterial infections. Two studies involved patients from emergency departments, three involved patients from outpatient clinics and two involved patients from inpatient wards. Thus, there was insufficient data from the few included trials to allow for subgroup comparisons. Higher temperatures may be related to increasing severity of illness, however this data could not be obtained from the studies. Most trials excluded children with co‐morbidities.
For the analyses looking at mean temperature, some of the mean differences were statistically significant but probably not clinically meaningful in those cases where both treatment groups had mean temperatures within the range of being afebrile
Safety concerns have been raised about caregivers giving inappropriate doses and getting confused over when the next dose is due in alternating and combined therapy. In addition, the effectiveness of administering combined or alternating antipyretics may be very different when administered by parents and caregivers than when administered in a controlled setting with health care professionals supervising.
Current guidelines recommend only monotherapy for febrile children, in order to avoid potential side effects from multiple medication administration. The results from this study do not suggest any serious short term adverse effects from either alternating or combined antipyretic therapy compared with monotherapy. However, none of the included trials was large enough to have the power to detect important differences between treatment arms, nor were they long enough to detect potential adverse events from regular use. From the vast amount of literature on paracetamol and ibuprofen both drugs are regarded as safe with serious side effects being few and infrequent.
Quality of the evidence
The quality of the evidence summarized in this review is presented in Table 2; Table 3; Table 4; Table 5.
For combined therapy versus a single agent, the evidence for a reduction in mean temperature at one and four hours was judged to be of moderate quality, meaning we can have reasonable confidence in this result. Although the studies are generally at low risk of bias, the sample size is small (less than 200 patients overall) and the possibility of chance findings and publication bias is high. The evidence of an effect on patient discomfort could not be graded as the data were not adequately presented. However, the data would likely be of low or very low quality as they come from a single trial.
For alternating therapy versus single agent, the overall sample size is larger, however the largest study with 480 subjects (Sarrell 2006) provided information only on the Non‐communicating Children's Checklist, days absent from daycare and doses of medication per child. When looking at reduction in mean temperature and proportion remaining febrile, the sample size is very small (less than 200 patients overall). The quality of evidence for reductions in mean temperature and the proportions remaining febrile is of low quality at best, meaning we can have little confidence in the results. The evidence for a reduction in mean NCPCC score is also judged to be of low quality.
For combined versus alternating therapy, the evidence was downgraded to 'very low' due to the extremely small study size (40 participants) and the lack of allocation concealment in the single trial. For these reasons, we can have no real confidence in the results of this trial.
Potential biases in the review process
None identified.
Agreements and disagreements with other studies or reviews
Three systematic reviews looking at combined or alternating ibuprofen and paracetamol therapy exist in the literature (Nabulsi 2009; Pereira 2012; Purssell 2011). All three reviews raised similar concerns to those highlighted in this review regarding lack of blinding and reasons for withdrawal from studies, low sample size, and variable drug doses and administration regimens.
Nabulsi 2010 examined five studies that were included in this review (Erlewyn‐Lajeunesse 2006; Hay 2008; Kramer 2008; Nabulsi 2006; Sarrell 2006). The review differs from ours in that the primary outcome measure was temperature reduction and it did not include measures of patient discomfort. Our review also includes one additional study. Nabulsi et al. concluded that, given ongoing uncertainty, either drug alone should be used instead of combined or alternating regimens.
Purssell 2011 examined seven studies (Erlewyn‐Lajeunesse 2006; Hay 2008; Kramer 2008; Lal 2000; Nabulsi 2006; Paul 2010; Sarrell 2006), one of which (Lal 2000) is excluded from this review as no extractable numerical data was published. Purssell concluded that the practice of combining paracetamol and ibuprofen has limited benefit and unclear safety data, and thus should not be encouraged.
Pereira 2012 examined four studies looking at alternating antipyretic therapy only (Hay 2008; Kramer 2008; Paul 2010; Sarrell 2006). It also excluded studies involving hospitalized children, whereas we included studies with hospitalized children. The main measure of the effect of treatment was the mean difference in body temperature among the compared groups and the study did not include measures of child discomfort. Pereira concluded there was not enough evidence to show that alternating antipyretic therapy is more effective than monotherapy and had concerns regarding the safety of using this regimen to treat febrile children.
Other systematic reviews or meta‐analyses in the literature assess studies comparing paracetamol directly with ibuprofen, which was not the focus of this review.
Study flow diagram.
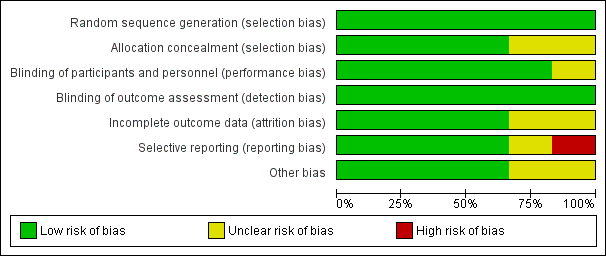
Risk of bias graph: review authors' judgements about each risk of bias item presented as percentages across all included studies.

Risk of bias summary: review authors' judgements about each risk of bias item for each included study.

Comparison 1 Combined versus single agent, Outcome 1 Mean temperature (°C).

Comparison 1 Combined versus single agent, Outcome 2 Proportion remaining febrile.
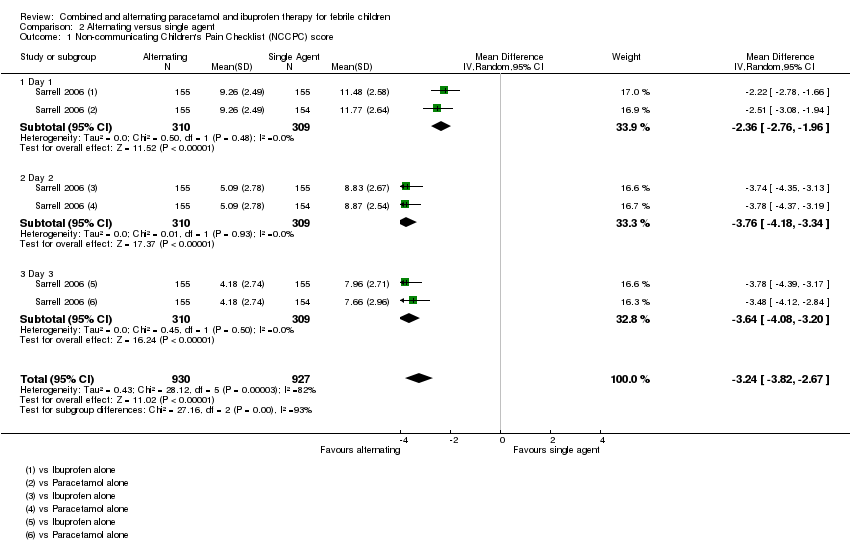
Comparison 2 Alternating versus single agent, Outcome 1 Non‐communicating Children's Pain Checklist (NCCPC) score.

Comparison 2 Alternating versus single agent, Outcome 2 Absent from daycare, days.

Comparison 2 Alternating versus single agent, Outcome 3 Doses of medication per child.

Comparison 2 Alternating versus single agent, Outcome 4 Mean temperature (°C).

Comparison 2 Alternating versus single agent, Outcome 5 Proportion remaining febrile.
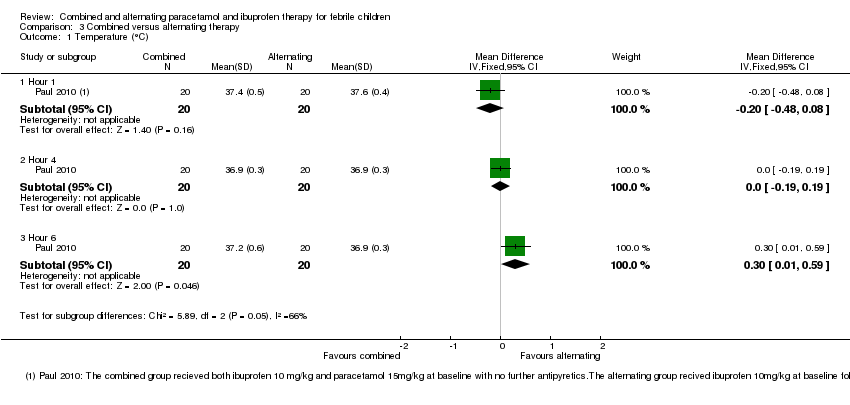
Comparison 3 Combined versus alternating therapy, Outcome 1 Temperature (°C).

Comparison 3 Combined versus alternating therapy, Outcome 2 Proportion Febrile.
| Study ID | Time after administration (hours) | |||||||||
| 0 | 1 | 2 | 3 | 4 | 5 | 6 | 7 | 8 | ||
| P (15 mg/kg) | Ⓣ | Ⓣ | ||||||||
| I (5 mg/kg) | Ⓣ | Ⓣ | ||||||||
| P (15 mg/kg) + I (5 mg/kg) | Ⓣ | Ⓣ | ||||||||
| P (15 mg/kg) | Ⓣ | Ⓣ P | Ⓣ | Ⓣ | ||||||
| I (10 mg/kg) | Ⓣ | Ⓣ | Ⓣ I | Ⓣ | ||||||
| P (15 mg/kg) + I (10 mg/kg) | Ⓣ | Ⓣ P | Ⓣ I | Ⓣ | ||||||
| P (15 mg/kg) | Ⓣ | Ⓣ P | Ⓣ | Ⓣ | ||||||
| P (15 mg/kg) | Ⓣ I (10 mg/kg) | Ⓣ | Ⓣ | Ⓣ | ||||||
| I (10 mg/kg) | Ⓣ | Ⓣ | Ⓣ | Ⓣ | Ⓣ | |||||
| I (10 mg/kg) | Ⓣ P (15 mg/kg) | Ⓣ | Ⓣ | Ⓣ | Ⓣ | |||||
| I (10 mg/kg) | Ⓣ | Ⓣ | Ⓣ | Ⓣ | Ⓣ | Ⓣ | ||||
| I (10 mg/kg) | Ⓣ | Ⓣ | Ⓣ P | Ⓣ | Ⓣ | Ⓣ | ||||
| I (10 mg/kg) + P (15 mg/kg) | Ⓣ | Ⓣ | Ⓣ | Ⓣ | Ⓣ | Ⓣ | ||||
| P or I | P | |||||||||
| P or I | I | |||||||||
| P or I | P | I | ||||||||
| Ⓣ = Temperature reported; P = paracetamol; I = ibuprofen 1Sarrell 2006 asked caretakers to record rectal temperatures three times per day. | ||||||||||
| Alternating versus single agent for fever in children | |||||||
| Patient or population: children with fever | |||||||
| Outcomes | Timepoint | Illustrative comparative risks* (95% CI) | Relative effect | No of participants | Quality of the evidence | Comments | |
| Assumed risk | Corresponding risk | ||||||
| Single agent | Alternating regimen | ||||||
| NCCPC score A score of 7 or more indicates pain. | Day 1 | The mean NCCPC score in the control group was | The mean NCCPC score in the intervention groups was | ‐ | 309 | ⊕⊕⊝⊝ | |
| Day 2 | The mean NCCPC score in the control group was | The mean NCCPC score in the intervention groups was | ‐ | 475 | ⊕⊕⊝⊝ | ||
| Day 3 | The mean NCCPC score in the control group was | The mean NCCPC score in the intervention groups was | ‐ | 464 | ⊕⊕⊝⊝ | ||
| *The basis for the assumed risk (eg the median control group risk across studies) is provided in footnotes. The corresponding risk (and its 95% CI) is based on the assumed risk in the comparison group and the relative effect of the intervention (and its 95% CI). | |||||||
| GRADE Working Group grades of evidence | |||||||
| 1 Downgraded by 2 for risk of bias: in this study mothers collected the data on NCCPC scores and were unblinded to allocation. In addition, in this study the mean number of doses of medication was actually lower in the group allocated to alternating treatment. The reasons for this are unclear as logically they should receive more doses. | |||||||
| Alternating versus single agent for fever in children | |||||||
| Patient or population: children with fever | |||||||
| Outcomes | Timepoint | Illustrative comparative risks* (95% CI) | Relative effect | No of participants | Quality of the evidence | Comments | |
| Assumed risk | Corresponding risk | ||||||
| Single agent | Alternating regimen | ||||||
| Mean Temperature | 1 hour | The mean temperature in the control group was | The mean temperature in the intervention groups was | ‐ | 40 | ⊕⊝⊝⊝ | Children in the alternating regimen group received a second dose of antipyretic at 3‐4 hours |
| 4 hours | The mean temperature in the control groups ranged from | The mean temperature in the intervention groups was | ‐ | 78 | ⊕⊕⊝⊝ | ||
| 6 hours | The mean temperature in the control group was | The mean temperature in the intervention groups was | ‐ | 40 | ⊕⊝⊝⊝ | ||
| Proportion febrile | 1 hour | 20 per 100 | 20 per 100 | RR 1 | 40 | ⊕⊝⊝⊝ | Children in the alternating regimen group received a second dose of antipyretic at 3‐4 hours |
| 4 hours | 30 per 100 | 2 per 100 | RR 0.08 | 40 | ⊕⊝⊝⊝ | ||
| 6 hours | 45 per 100 | 11 per 100 | RR 0.25 | 109 | ⊕⊕⊝⊝ | ||
| *The basis for the assumed risk (eg the median control group risk across studies) is provided in footnotes. The corresponding risk (and its 95% CI) is based on the assumed risk in the comparison group and the relative effect of the intervention (and its 95% CI). | |||||||
| GRADE Working Group grades of evidence | |||||||
| 1 This single study compared a single dose of ibuprofen with ibuprofen plus paracetamol 3 hours later. | |||||||
| Combined versus single agent for fever in children | |||||||
| Patient or population: children with fever Control: a single agent alone at baseline | |||||||
| Outcomes | Timepoint | Illustrative comparative risks* (95% CI) | Relative effect | No of participants | Quality of the evidence | Comments | |
| Assumed risk | Corresponding risk | ||||||
| Single agent | Combined regimen | ||||||
| Mean Temperature | 1 hour | The mean temperature in the control groups ranged from | The mean temperature in the intervention groups was | ‐ | 163 | ⊕⊝⊝⊝ moderate 1,2,3 | |
| 4 hours | The mean temperature in the control groups ranged from | The mean temperature in the intervention groups was | ‐ | 173 | ⊕⊝⊝⊝ moderate 4,2,3 | ||
| 6 hours | The mean temperature in the control group was | The mean temperature in the intervention groups was | ‐ | 40 | ⊕⊝⊝⊝ | ||
| Proportion Febrile | 1 hour | 20 per 100 | 10 per 100 | RR 0.5 | 40 | ⊕⊝⊝⊝ | |
| 4 hours | 23 per 100 | 2 per 100 | RR 0.08 | 196 | ⊕⊝⊝⊝ moderate 4,2,3 | ||
| 6 hours | 50 per 100 | 5 per 100 | RR 0.10 | 40 participants | ⊕⊝⊝⊝ | ||
| *The basis for the assumed risk (eg the median control group risk across studies) is provided in footnotes. The corresponding risk (and its 95% CI) is based on the assumed risk in the comparison group and the relative effect of the intervention (and its 95% CI). | |||||||
| GRADE Working Group grades of evidence | |||||||
| 1 These two studies compared ibuprofen plus paracetamol at baseline with ibuprofen alone (Paul 2010) or ibuprofen or paracetamol alone (Erlewyn‐Lajeunesse 2006). | |||||||
| Combined versus alternating therapy for fever in children | |||||||
| Patient or population: children with fever | |||||||
| Outcomes | Timepoint | Illustrative comparative risks* (95% CI) | Relative effect | No of participants | Quality of the evidence | Comments | |
| Assumed risk | Corresponding risk | ||||||
| Alternating therapy | Combinedtherapy | ||||||
| Mean Temperature | 1 hour | The mean temperature in the control group was | The mean temperature in the intervention groups was | ‐ | 40 | ⊕⊝⊝⊝ | |
| 4 hours | The mean temperature in the control group was | The mean temperature in the intervention groups was | ‐ | 40 | ⊕⊝⊝⊝ | ||
| 6 hours | The mean temperature in the control group was | The mean temperature in the intervention groups was | ‐ | 40 | ⊕⊝⊝⊝ | ||
| Proportion Febrile | 1 hour | 200 per 1000 | 100 per 1000 | RR 0.5 | 40 | ⊕⊝⊝⊝ | |
| 4 hours | ‐ | ‐ | Not estimable | 40 | ⊕⊝⊝⊝ | ||
| 6 hours | 0 per 1000 | 0 per 1000 | RR 3 | 40 | ⊕⊝⊝⊝ | ||
| *The basis for the assumed risk (eg the median control group risk across studies) is provided in footnotes. The corresponding risk (and its 95% CI) is based on the assumed risk in the comparison group and the relative effect of the intervention (and its 95% CI). | |||||||
| GRADE Working Group grades of evidence | |||||||
| 1 This single study was conducted in the USA. | |||||||
| Comparison | Studies | N
| Duration of follow up | Serious adverse events | Comments |
| Combined versus single agent | 123 | 2 hours | Not reported |
| |
| 156 | 5 days | Five serious AE occurred (Admission to hospital ‐ reasons not reported) with no difference between groups | Non‐severe adverse events (mainly diarrhoea and vomiting) were evenly distributed between groups2 | ||
| 46 | 6 hours | Not reported |
| ||
| Alternating versus single agent
| 46 | 6 hours | Not reported | ||
|
| 40 | 6 hours
| None observed
| Non‐severe adverse effects reported in 8/38 (21%) of patients with no difference between groups1
| |
|
| 70 | 8 hours | None observed | Rectal temperature < 36.5 °C (range 35.0 °C to 36.2 °C) 5 (13.9%) combined group 6 (18.2%) ibuprofen group
| |
| 480 | 14 days | None observed | Mild elevated liver enzymes, n=8, mild abnormal renal function, n=14, all normalized by 14 day follow up | ||
| Alternating versus combined therapy | 46 | 6 hours | Not reported |
| |
| 1 Non‐severe AE stated as: diarrhoea, flatulence, emesis, decreased appetite, epigastric pain, nausea, headache, insomnia. Symptoms did not prevent any patients from taking study medications. | |||||
| Outcome or subgroup title | No. of studies | No. of participants | Statistical method | Effect size |
| 1 Mean temperature (°C) Show forest plot | 3 | Mean Difference (IV, Fixed, 95% CI) | Subtotals only | |
| 1.1 Hour 1 | 2 | 163 | Mean Difference (IV, Fixed, 95% CI) | ‐0.27 [‐0.45, ‐0.08] |
| 1.2 Hour 4 | 2 | 173 | Mean Difference (IV, Fixed, 95% CI) | ‐0.70 [‐1.05, ‐0.35] |
| 1.3 Hour 6 | 1 | 40 | Mean Difference (IV, Fixed, 95% CI) | ‐1.30 [‐2.01, ‐0.59] |
| 2 Proportion remaining febrile Show forest plot | 2 | Risk Ratio (M‐H, Random, 95% CI) | Subtotals only | |
| 2.1 Hour 1 | 1 | 40 | Risk Ratio (M‐H, Random, 95% CI) | 0.5 [0.10, 2.43] |
| 2.2 Hour 4 | 2 | 196 | Risk Ratio (M‐H, Random, 95% CI) | 0.08 [0.02, 0.42] |
| 2.3 Hour 6 | 1 | 40 | Risk Ratio (M‐H, Random, 95% CI) | 0.10 [0.01, 0.71] |
| Outcome or subgroup title | No. of studies | No. of participants | Statistical method | Effect size |
| 1 Non‐communicating Children's Pain Checklist (NCCPC) score Show forest plot | 1 | 1857 | Mean Difference (IV, Random, 95% CI) | ‐3.24 [‐3.82, ‐2.67] |
| 1.1 Day 1 | 1 | 619 | Mean Difference (IV, Random, 95% CI) | ‐2.36 [‐2.76, ‐1.96] |
| 1.2 Day 2 | 1 | 619 | Mean Difference (IV, Random, 95% CI) | ‐3.76 [‐4.18, ‐3.34] |
| 1.3 Day 3 | 1 | 619 | Mean Difference (IV, Random, 95% CI) | ‐3.64 [‐4.08, ‐3.20] |
| 2 Absent from daycare, days Show forest plot | 1 | 619 | Mean Difference (IV, Fixed, 95% CI) | ‐0.85 [‐0.95, ‐0.75] |
| 3 Doses of medication per child Show forest plot | 1 | 2166 | Mean Difference (IV, Random, 95% CI) | ‐1.29 [‐1.69, ‐0.88] |
| 3.1 Day 1 | 1 | 619 | Mean Difference (IV, Random, 95% CI) | ‐1.09 [‐2.40, 0.22] |
| 3.2 Day 2 | 1 | 619 | Mean Difference (IV, Random, 95% CI) | ‐1.39 [‐2.29, ‐0.49] |
| 3.3 Day 3 | 1 | 928 | Mean Difference (IV, Random, 95% CI) | ‐1.39 [‐1.48, ‐1.30] |
| 4 Mean temperature (°C) Show forest plot | 2 | Mean Difference (IV, Random, 95% CI) | Subtotals only | |
| 4.1 Hour 1 | 1 | 40 | Mean Difference (IV, Random, 95% CI) | 0.0 [‐0.28, 0.28] |
| 4.2 Hour 4 | 2 | 78 | Mean Difference (IV, Random, 95% CI) | ‐0.60 [‐0.94, ‐0.26] |
| 4.3 Hour 6 | 1 | 40 | Mean Difference (IV, Random, 95% CI) | ‐1.60 [‐2.27, ‐0.93] |
| 5 Proportion remaining febrile Show forest plot | 2 | Risk Ratio (M‐H, Fixed, 95% CI) | Subtotals only | |
| 5.1 Hour 1 | 1 | 40 | Risk Ratio (M‐H, Fixed, 95% CI) | 1.0 [0.29, 3.45] |
| 5.2 Hour 4 | 1 | 40 | Risk Ratio (M‐H, Fixed, 95% CI) | 0.08 [0.00, 1.28] |
| 5.3 Hour 6 | 2 | 109 | Risk Ratio (M‐H, Fixed, 95% CI) | 0.25 [0.11, 0.55] |
| Outcome or subgroup title | No. of studies | No. of participants | Statistical method | Effect size |
| 1 Temperature (°C) Show forest plot | 1 | Mean Difference (IV, Fixed, 95% CI) | Subtotals only | |
| 1.1 Hour 1 | 1 | 40 | Mean Difference (IV, Fixed, 95% CI) | ‐0.20 [‐0.48, 0.08] |
| 1.2 Hour 4 | 1 | 40 | Mean Difference (IV, Fixed, 95% CI) | 0.0 [‐0.19, 0.19] |
| 1.3 Hour 6 | 1 | 40 | Mean Difference (IV, Fixed, 95% CI) | 0.30 [0.01, 0.59] |
| 2 Proportion Febrile Show forest plot | 1 | 120 | Risk Ratio (M‐H, Fixed, 95% CI) | 0.78 [0.21, 2.91] |
| 2.1 Hour 1 | 1 | 40 | Risk Ratio (M‐H, Fixed, 95% CI) | 0.5 [0.10, 2.43] |
| 2.2 Hour 4 | 1 | 40 | Risk Ratio (M‐H, Fixed, 95% CI) | 0.0 [0.0, 0.0] |
| 2.3 Hour 6 | 1 | 40 | Risk Ratio (M‐H, Fixed, 95% CI) | 3.0 [0.13, 69.52] |