Tratamiento combinado y alternado con paracetamol e ibuprofeno para la fiebre en niños
Información
- DOI:
- https://doi.org/10.1002/14651858.CD009572.pub2Copiar DOI

- Base de datos:
-
- Cochrane Database of Systematic Reviews
- Versión publicada:
-
- 30 octubre 2013see what's new
- Tipo:
-
- Intervention
- Etapa:
-
- Review
- Grupo Editorial Cochrane:
-
Grupo Cochrane de Enfermedades infecciosas
- Clasificada:
-
- Pendiente de actualización
Studies awaiting assessment
The CIDG is currently examining a new search conducted in April 2019 for potentially relevant studies. These studies have not yet been incorporated into this Cochrane Review.Evaluada: 15 April 2019
- Pendiente de actualización
- Copyright:
-
- Copyright © 2013 The Cochrane Collaboration. Published by John Wiley & Sons, Ltd.
Cifras del artículo
Altmetric:
Citado por:
Autores
Contributions of authors
TW contributed to protocol development, relevance and inclusion screening, quality assessment, data extraction, analysis and writing the review.
AS contributed to protocol development, relevance and inclusion screening, quality assessment, analysis and editing the review.
DWJ contributed to protocol development and editing the review.
HG contributed to the development and execution of the search strategy and editing the review.
AT contributed to data extraction.
LH contributed to protocol development and editing the review.
IM contributed to protocol development and editing the review.
Sources of support
Internal sources
-
Alberta Children's Hospital Foundation, Canada.
Initial grant money was recieved for statistical analysis support. Later, permission was granted for funds to be used for travel to Liverpool where statistical support is available for the study.
External sources
-
Cochrane Infectious Diseases Group Fellowship Program, UK.
Funds from the fellowship program were used to assist with travel to Liverpool, UK where editorial advisor and statistical support were available.
Declarations of interest
None declared.
Acknowledgements
The academic editor for this protocol was Professor Paul Garner.
This review is partially funded by the Alberta Children’s Hospital (ACH) Foundation; the views expressed are not necessarily those of the ACH Foundation. We thank Calli Carrington and Emily Macphail for their assistance in article review and inclusion. We would like to thank Dr David Sinclair for his significant contribution to the structure of the review, data analysis, summary of findings tables and general editorial advice. We thank Christianne Esparza for assistance with translation and data extraction. The editorial base for the Cochrane Infectious Diseases Group is funded by the Department for International Development, UK, for the benefit of low‐ and middle‐income countries.
Version history
| Published | Title | Stage | Authors | Version |
| 2013 Oct 30 | Combined and alternating paracetamol and ibuprofen therapy for febrile children | Review | Tiffany Wong, Antonia S Stang, Heather Ganshorn, Lisa Hartling, Ian K Maconochie, Anna M Thomsen, David W Johnson | |
| 2012 Jan 18 | Combined and alternating paracetamol and ibuprofen therapy for fever in children | Protocol | Tiffany Wong, David W Johnson, Heather Ganshorn, Ian K Maconochie, Lisa Hartling, Antonia S. Stang | |
Differences between protocol and review
The initial protocol focused on decline in temperature measurements over time as a primary outcome. Common clinical practice is to recommend antipyretic therapy for children with fever who are distressed, and not necessarily for lowering absolute temperature. This review has altered the primary outcome by including patient discomfort in addition to temperature measurements. Anna Thomsen was added as an author for her contributions as data extractor.
Keywords
MeSH
Medical Subject Headings (MeSH) Keywords
Medical Subject Headings Check Words
Child; Humans;
PICO
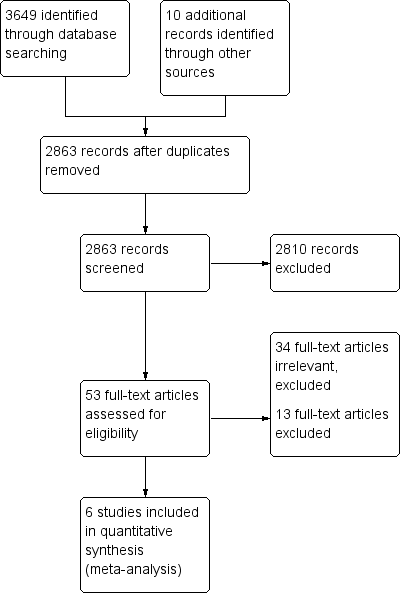
Study flow diagram.
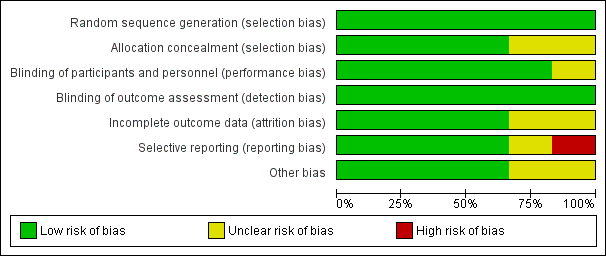
Risk of bias graph: review authors' judgements about each risk of bias item presented as percentages across all included studies.

Risk of bias summary: review authors' judgements about each risk of bias item for each included study.

Comparison 1 Combined versus single agent, Outcome 1 Mean temperature (°C).

Comparison 1 Combined versus single agent, Outcome 2 Proportion remaining febrile.
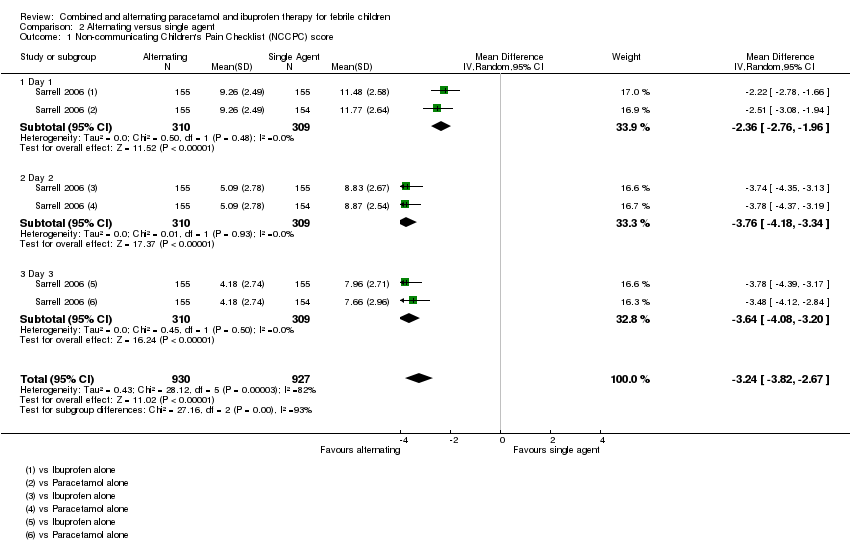
Comparison 2 Alternating versus single agent, Outcome 1 Non‐communicating Children's Pain Checklist (NCCPC) score.

Comparison 2 Alternating versus single agent, Outcome 2 Absent from daycare, days.

Comparison 2 Alternating versus single agent, Outcome 3 Doses of medication per child.

Comparison 2 Alternating versus single agent, Outcome 4 Mean temperature (°C).

Comparison 2 Alternating versus single agent, Outcome 5 Proportion remaining febrile.
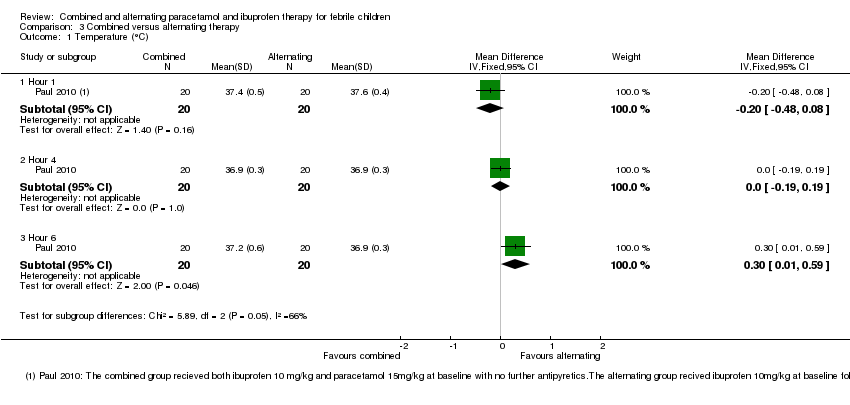
Comparison 3 Combined versus alternating therapy, Outcome 1 Temperature (°C).

Comparison 3 Combined versus alternating therapy, Outcome 2 Proportion Febrile.
| Study ID | Time after administration (hours) | |||||||||
| 0 | 1 | 2 | 3 | 4 | 5 | 6 | 7 | 8 | ||
| P (15 mg/kg) | Ⓣ | Ⓣ | ||||||||
| I (5 mg/kg) | Ⓣ | Ⓣ | ||||||||
| P (15 mg/kg) + I (5 mg/kg) | Ⓣ | Ⓣ | ||||||||
| P (15 mg/kg) | Ⓣ | Ⓣ P | Ⓣ | Ⓣ | ||||||
| I (10 mg/kg) | Ⓣ | Ⓣ | Ⓣ I | Ⓣ | ||||||
| P (15 mg/kg) + I (10 mg/kg) | Ⓣ | Ⓣ P | Ⓣ I | Ⓣ | ||||||
| P (15 mg/kg) | Ⓣ | Ⓣ P | Ⓣ | Ⓣ | ||||||
| P (15 mg/kg) | Ⓣ I (10 mg/kg) | Ⓣ | Ⓣ | Ⓣ | ||||||
| I (10 mg/kg) | Ⓣ | Ⓣ | Ⓣ | Ⓣ | Ⓣ | |||||
| I (10 mg/kg) | Ⓣ P (15 mg/kg) | Ⓣ | Ⓣ | Ⓣ | Ⓣ | |||||
| I (10 mg/kg) | Ⓣ | Ⓣ | Ⓣ | Ⓣ | Ⓣ | Ⓣ | ||||
| I (10 mg/kg) | Ⓣ | Ⓣ | Ⓣ P | Ⓣ | Ⓣ | Ⓣ | ||||
| I (10 mg/kg) + P (15 mg/kg) | Ⓣ | Ⓣ | Ⓣ | Ⓣ | Ⓣ | Ⓣ | ||||
| P or I | P | |||||||||
| P or I | I | |||||||||
| P or I | P | I | ||||||||
| Ⓣ = Temperature reported; P = paracetamol; I = ibuprofen 1Sarrell 2006 asked caretakers to record rectal temperatures three times per day. | ||||||||||
| Alternating versus single agent for fever in children | |||||||
| Patient or population: children with fever | |||||||
| Outcomes | Timepoint | Illustrative comparative risks* (95% CI) | Relative effect | No of participants | Quality of the evidence | Comments | |
| Assumed risk | Corresponding risk | ||||||
| Single agent | Alternating regimen | ||||||
| NCCPC score A score of 7 or more indicates pain. | Day 1 | The mean NCCPC score in the control group was | The mean NCCPC score in the intervention groups was | ‐ | 309 | ⊕⊕⊝⊝ | |
| Day 2 | The mean NCCPC score in the control group was | The mean NCCPC score in the intervention groups was | ‐ | 475 | ⊕⊕⊝⊝ | ||
| Day 3 | The mean NCCPC score in the control group was | The mean NCCPC score in the intervention groups was | ‐ | 464 | ⊕⊕⊝⊝ | ||
| *The basis for the assumed risk (eg the median control group risk across studies) is provided in footnotes. The corresponding risk (and its 95% CI) is based on the assumed risk in the comparison group and the relative effect of the intervention (and its 95% CI). | |||||||
| GRADE Working Group grades of evidence | |||||||
| 1 Downgraded by 2 for risk of bias: in this study mothers collected the data on NCCPC scores and were unblinded to allocation. In addition, in this study the mean number of doses of medication was actually lower in the group allocated to alternating treatment. The reasons for this are unclear as logically they should receive more doses. | |||||||
| Alternating versus single agent for fever in children | |||||||
| Patient or population: children with fever | |||||||
| Outcomes | Timepoint | Illustrative comparative risks* (95% CI) | Relative effect | No of participants | Quality of the evidence | Comments | |
| Assumed risk | Corresponding risk | ||||||
| Single agent | Alternating regimen | ||||||
| Mean Temperature | 1 hour | The mean temperature in the control group was | The mean temperature in the intervention groups was | ‐ | 40 | ⊕⊝⊝⊝ | Children in the alternating regimen group received a second dose of antipyretic at 3‐4 hours |
| 4 hours | The mean temperature in the control groups ranged from | The mean temperature in the intervention groups was | ‐ | 78 | ⊕⊕⊝⊝ | ||
| 6 hours | The mean temperature in the control group was | The mean temperature in the intervention groups was | ‐ | 40 | ⊕⊝⊝⊝ | ||
| Proportion febrile | 1 hour | 20 per 100 | 20 per 100 | RR 1 | 40 | ⊕⊝⊝⊝ | Children in the alternating regimen group received a second dose of antipyretic at 3‐4 hours |
| 4 hours | 30 per 100 | 2 per 100 | RR 0.08 | 40 | ⊕⊝⊝⊝ | ||
| 6 hours | 45 per 100 | 11 per 100 | RR 0.25 | 109 | ⊕⊕⊝⊝ | ||
| *The basis for the assumed risk (eg the median control group risk across studies) is provided in footnotes. The corresponding risk (and its 95% CI) is based on the assumed risk in the comparison group and the relative effect of the intervention (and its 95% CI). | |||||||
| GRADE Working Group grades of evidence | |||||||
| 1 This single study compared a single dose of ibuprofen with ibuprofen plus paracetamol 3 hours later. | |||||||
| Combined versus single agent for fever in children | |||||||
| Patient or population: children with fever Control: a single agent alone at baseline | |||||||
| Outcomes | Timepoint | Illustrative comparative risks* (95% CI) | Relative effect | No of participants | Quality of the evidence | Comments | |
| Assumed risk | Corresponding risk | ||||||
| Single agent | Combined regimen | ||||||
| Mean Temperature | 1 hour | The mean temperature in the control groups ranged from | The mean temperature in the intervention groups was | ‐ | 163 | ⊕⊝⊝⊝ moderate 1,2,3 | |
| 4 hours | The mean temperature in the control groups ranged from | The mean temperature in the intervention groups was | ‐ | 173 | ⊕⊝⊝⊝ moderate 4,2,3 | ||
| 6 hours | The mean temperature in the control group was | The mean temperature in the intervention groups was | ‐ | 40 | ⊕⊝⊝⊝ | ||
| Proportion Febrile | 1 hour | 20 per 100 | 10 per 100 | RR 0.5 | 40 | ⊕⊝⊝⊝ | |
| 4 hours | 23 per 100 | 2 per 100 | RR 0.08 | 196 | ⊕⊝⊝⊝ moderate 4,2,3 | ||
| 6 hours | 50 per 100 | 5 per 100 | RR 0.10 | 40 participants | ⊕⊝⊝⊝ | ||
| *The basis for the assumed risk (eg the median control group risk across studies) is provided in footnotes. The corresponding risk (and its 95% CI) is based on the assumed risk in the comparison group and the relative effect of the intervention (and its 95% CI). | |||||||
| GRADE Working Group grades of evidence | |||||||
| 1 These two studies compared ibuprofen plus paracetamol at baseline with ibuprofen alone (Paul 2010) or ibuprofen or paracetamol alone (Erlewyn‐Lajeunesse 2006). | |||||||
| Combined versus alternating therapy for fever in children | |||||||
| Patient or population: children with fever | |||||||
| Outcomes | Timepoint | Illustrative comparative risks* (95% CI) | Relative effect | No of participants | Quality of the evidence | Comments | |
| Assumed risk | Corresponding risk | ||||||
| Alternating therapy | Combinedtherapy | ||||||
| Mean Temperature | 1 hour | The mean temperature in the control group was | The mean temperature in the intervention groups was | ‐ | 40 | ⊕⊝⊝⊝ | |
| 4 hours | The mean temperature in the control group was | The mean temperature in the intervention groups was | ‐ | 40 | ⊕⊝⊝⊝ | ||
| 6 hours | The mean temperature in the control group was | The mean temperature in the intervention groups was | ‐ | 40 | ⊕⊝⊝⊝ | ||
| Proportion Febrile | 1 hour | 200 per 1000 | 100 per 1000 | RR 0.5 | 40 | ⊕⊝⊝⊝ | |
| 4 hours | ‐ | ‐ | Not estimable | 40 | ⊕⊝⊝⊝ | ||
| 6 hours | 0 per 1000 | 0 per 1000 | RR 3 | 40 | ⊕⊝⊝⊝ | ||
| *The basis for the assumed risk (eg the median control group risk across studies) is provided in footnotes. The corresponding risk (and its 95% CI) is based on the assumed risk in the comparison group and the relative effect of the intervention (and its 95% CI). | |||||||
| GRADE Working Group grades of evidence | |||||||
| 1 This single study was conducted in the USA. | |||||||
| Comparison | Studies | N
| Duration of follow up | Serious adverse events | Comments |
| Combined versus single agent | 123 | 2 hours | Not reported |
| |
| 156 | 5 days | Five serious AE occurred (Admission to hospital ‐ reasons not reported) with no difference between groups | Non‐severe adverse events (mainly diarrhoea and vomiting) were evenly distributed between groups2 | ||
| 46 | 6 hours | Not reported |
| ||
| Alternating versus single agent
| 46 | 6 hours | Not reported | ||
|
| 40 | 6 hours
| None observed
| Non‐severe adverse effects reported in 8/38 (21%) of patients with no difference between groups1
| |
|
| 70 | 8 hours | None observed | Rectal temperature < 36.5 °C (range 35.0 °C to 36.2 °C) 5 (13.9%) combined group 6 (18.2%) ibuprofen group
| |
| 480 | 14 days | None observed | Mild elevated liver enzymes, n=8, mild abnormal renal function, n=14, all normalized by 14 day follow up | ||
| Alternating versus combined therapy | 46 | 6 hours | Not reported |
| |
| 1 Non‐severe AE stated as: diarrhoea, flatulence, emesis, decreased appetite, epigastric pain, nausea, headache, insomnia. Symptoms did not prevent any patients from taking study medications. | |||||
| Outcome or subgroup title | No. of studies | No. of participants | Statistical method | Effect size |
| 1 Mean temperature (°C) Show forest plot | 3 | Mean Difference (IV, Fixed, 95% CI) | Subtotals only | |
| 1.1 Hour 1 | 2 | 163 | Mean Difference (IV, Fixed, 95% CI) | ‐0.27 [‐0.45, ‐0.08] |
| 1.2 Hour 4 | 2 | 173 | Mean Difference (IV, Fixed, 95% CI) | ‐0.70 [‐1.05, ‐0.35] |
| 1.3 Hour 6 | 1 | 40 | Mean Difference (IV, Fixed, 95% CI) | ‐1.30 [‐2.01, ‐0.59] |
| 2 Proportion remaining febrile Show forest plot | 2 | Risk Ratio (M‐H, Random, 95% CI) | Subtotals only | |
| 2.1 Hour 1 | 1 | 40 | Risk Ratio (M‐H, Random, 95% CI) | 0.5 [0.10, 2.43] |
| 2.2 Hour 4 | 2 | 196 | Risk Ratio (M‐H, Random, 95% CI) | 0.08 [0.02, 0.42] |
| 2.3 Hour 6 | 1 | 40 | Risk Ratio (M‐H, Random, 95% CI) | 0.10 [0.01, 0.71] |
| Outcome or subgroup title | No. of studies | No. of participants | Statistical method | Effect size |
| 1 Non‐communicating Children's Pain Checklist (NCCPC) score Show forest plot | 1 | 1857 | Mean Difference (IV, Random, 95% CI) | ‐3.24 [‐3.82, ‐2.67] |
| 1.1 Day 1 | 1 | 619 | Mean Difference (IV, Random, 95% CI) | ‐2.36 [‐2.76, ‐1.96] |
| 1.2 Day 2 | 1 | 619 | Mean Difference (IV, Random, 95% CI) | ‐3.76 [‐4.18, ‐3.34] |
| 1.3 Day 3 | 1 | 619 | Mean Difference (IV, Random, 95% CI) | ‐3.64 [‐4.08, ‐3.20] |
| 2 Absent from daycare, days Show forest plot | 1 | 619 | Mean Difference (IV, Fixed, 95% CI) | ‐0.85 [‐0.95, ‐0.75] |
| 3 Doses of medication per child Show forest plot | 1 | 2166 | Mean Difference (IV, Random, 95% CI) | ‐1.29 [‐1.69, ‐0.88] |
| 3.1 Day 1 | 1 | 619 | Mean Difference (IV, Random, 95% CI) | ‐1.09 [‐2.40, 0.22] |
| 3.2 Day 2 | 1 | 619 | Mean Difference (IV, Random, 95% CI) | ‐1.39 [‐2.29, ‐0.49] |
| 3.3 Day 3 | 1 | 928 | Mean Difference (IV, Random, 95% CI) | ‐1.39 [‐1.48, ‐1.30] |
| 4 Mean temperature (°C) Show forest plot | 2 | Mean Difference (IV, Random, 95% CI) | Subtotals only | |
| 4.1 Hour 1 | 1 | 40 | Mean Difference (IV, Random, 95% CI) | 0.0 [‐0.28, 0.28] |
| 4.2 Hour 4 | 2 | 78 | Mean Difference (IV, Random, 95% CI) | ‐0.60 [‐0.94, ‐0.26] |
| 4.3 Hour 6 | 1 | 40 | Mean Difference (IV, Random, 95% CI) | ‐1.60 [‐2.27, ‐0.93] |
| 5 Proportion remaining febrile Show forest plot | 2 | Risk Ratio (M‐H, Fixed, 95% CI) | Subtotals only | |
| 5.1 Hour 1 | 1 | 40 | Risk Ratio (M‐H, Fixed, 95% CI) | 1.0 [0.29, 3.45] |
| 5.2 Hour 4 | 1 | 40 | Risk Ratio (M‐H, Fixed, 95% CI) | 0.08 [0.00, 1.28] |
| 5.3 Hour 6 | 2 | 109 | Risk Ratio (M‐H, Fixed, 95% CI) | 0.25 [0.11, 0.55] |
| Outcome or subgroup title | No. of studies | No. of participants | Statistical method | Effect size |
| 1 Temperature (°C) Show forest plot | 1 | Mean Difference (IV, Fixed, 95% CI) | Subtotals only | |
| 1.1 Hour 1 | 1 | 40 | Mean Difference (IV, Fixed, 95% CI) | ‐0.20 [‐0.48, 0.08] |
| 1.2 Hour 4 | 1 | 40 | Mean Difference (IV, Fixed, 95% CI) | 0.0 [‐0.19, 0.19] |
| 1.3 Hour 6 | 1 | 40 | Mean Difference (IV, Fixed, 95% CI) | 0.30 [0.01, 0.59] |
| 2 Proportion Febrile Show forest plot | 1 | 120 | Risk Ratio (M‐H, Fixed, 95% CI) | 0.78 [0.21, 2.91] |
| 2.1 Hour 1 | 1 | 40 | Risk Ratio (M‐H, Fixed, 95% CI) | 0.5 [0.10, 2.43] |
| 2.2 Hour 4 | 1 | 40 | Risk Ratio (M‐H, Fixed, 95% CI) | 0.0 [0.0, 0.0] |
| 2.3 Hour 6 | 1 | 40 | Risk Ratio (M‐H, Fixed, 95% CI) | 3.0 [0.13, 69.52] |