نقش گازهای مورد استفاده برای ایجاد پنوموپریتونئوم در طول جراحی لاپاروسکوپی شکمی
چکیده
پیشینه
این مرور یک نسخه بهروز از مروری است که در 2013 منتشر شد.
جراحی لاپاروسکوپی (laparoscopic surgery) در حال حاضر به طور گستردهای برای درمان بیماریهای متنوع شکمی استفاده میشود. در حال حاضر، دیاکسید کربن (carbon dioxide) متداولترین گاز مورد استفاده برای دمیدن (insufflation) به داخل حفره شکمی (پنوموپریتونئوم (pneumoperitoneum)) است. اگرچه دیاکسید کربن اکثر الزامات مربوط به پنوموپریتونئوم را فراهم میکند، جذب این گاز ممکن است با بروز حوادث جانبی رابطه داشته باشد. احتمال تجربه عوارض و حوادث جانبی قلبیعروقی (cardiopulmonary)، برای مثال هیپرکاپنی (hypercapnia) و اسیدوز (acidosis)، در افراد با خطر بیحسی بالا بیشتر است، که در این صورت باید از طریق هیپرونتیلاسیون (hyperventilation) از بروز چنین حالتی جلوگیری شود. بنابراین سایر گازها به عنوان جایگزینهایی برای دیاکسید کربن برای ایجاد پنوموپریتونئوم مطرح شدهاند.
اهداف
ارزیابی ایمنی، مزایا و مضرات گازهای مختلف (یعنی دیاکسید کربن، هلیوم (helium)، آرگون (argon)، نیتروژن (nitrogen)، نیتروزاکسید (nitrous oxide) و هوای اتاق) که برای ایجاد پنوموپریتونئوم در شرکتکنندگانی که تحت جراحی عمومی لاپاروسکوپی شکمی یا جراحی ژنیکولوژیک لگنی (gynaecological pelvic) قرار گرفتند، استفاده میشود.
روشهای جستوجو
ما پایگاه ثبت مرکزی کارآزماییهای کنترل شده در کاکرین (CENTRAL) (کتابخانه کاکرین، 2016، شماره 9)، Ovid MEDLINE (از 1950 تا سپتامبر 2016)، Ovid Embase (از 1974 تا سپتامبر 2016)، Science Citation Index Expanded (از 1970 تا سپتامبر 2016)، پایگاه اطلاعاتی منابع علمی بیومدیکال چین (CBM) (1978 تا سپتامبر 2016)، ClinicalTrials.gov (سپتامبر 2016)، و پلتفرم بینالمللی پایگاه ثبت کارآزماییهای بالینی سازمان جهانی بهداشت (سپتامبر 2016) را جستوجو کردیم.
معیارهای انتخاب
کارآزماییهای تصادفیسازی و کنترل شده (randomised controlled trials; RCTs) را وارد مرور کردیم که به مقایسه گازهای مختلف برای ایجاد پنوموپریتونئوم در شرکتکنندگان (بدون توجه به سن، جنسیت یا نژاد) با جراحی لاپاروسکوپی شکمی یا جراحی ژنیکولوژیک لگنی با بیحسی عمومی پرداخته بودند.
گردآوری و تجزیهوتحلیل دادهها
دو نویسنده مرور بهطور مستقل ازهم به انتخاب کارآزماییها برای ورود به مرور، گردآوری دادهها، و ارزیابی خطر سوگیری (bias) پرداختند. با استفاده از نرمافزار Review Manager 5 متاآنالیز را انجام دادیم. برای پیامدهای دو‐حالتی، خطر نسبی (RR) (یا نسبت شانس پتو برای پیامدهای بسیار نادر)، و برای پیامدهای پیوسته، تفاوت میانگین (MD) یا تفاوت میانگین استاندارد شده (SMD) با 95% فواصل اطمینان (CI) را محاسبه کردیم. از رویکرد درجهبندی توصیه، ارزیابی، توسعه و ارزشیابی (GRADE) برای ارزیابی کیفیت شواهد استفاده کردیم.
نتایج اصلی
نه RCT، را شامل 519 شرکتکننده تصادفیسازی شده که به مقایسه گازهای مختلف برای ایجاد پنوموپریتونئوم پرداخته بودند وارد مرور کردیم: نیتروزاکسید (سه کارآزمایی)، هلیوم (پنج کارآزمایی)، یا هوای اتاق (یک کارآزمایی) با دیاکسید کربن مقایسه شده بودند.
سه کارآزمایی شرکتکنندگان را برای پنوموپریتونئوم به صورت تصادفی برای دریافت نیتروزاکسید (100 شرکتکننده) یا دیاکسید کربن (96 شرکتکننده) تقسیم کرده بودند. هیچ یک از کارآزماییها دارای خطر پائین سوگیری نبودند. شواهد برای تعیین تاثیرات نیتروزاکسید و دیاکسید کربن بر عوارض قلبیعروقی (RR: 2.00؛ 95% CI؛ 0.38 تا 10.43؛ دو مطالعه؛ 140 شرکتکننده؛ شواهد با کیفیت بسیار پائین)، یا موربیدیتی ناشی از جراحی (RR: 1.01؛ 95% CI؛ 0.18 تا 5.71؛ دو مطالعه؛ 143 شرکتکننده؛ شواهد با کیفیت بسیار پائین) کافی نبودند. هیچ گونه حوادث جانبی جدی مربوط به هریک از گازهای نیتروزاکسید یا دیاکسید کربن در ایجاد پنوموپریتونئوم وجود نداشت (سه مطالعه؛ 196 شرکتکننده؛ شواهد با کیفیت بسیار پائین). ما نتوانستیم دادههای به دست آمده از دو کارآزمایی (140 شرکتکننده) را که هریک به طور جداگانه نشان دهنده نمرات درد پائینتری (تفاوتی در حدود یک نمره آنالوگ بصری در مقیاس 1 تا 10 با اعداد کمتر مبنی بر درد کمتر) برای نیتروزاکسید در ایجاد پنوموپریتونئوم در مقاطع زمانی متنوعی در اولین روز پس از جراحی بودند، تجمیع کنیم و از این رو شواهد را در سطح بسیار پائین ارزیابی کردیم.
چهار کارآزمایی شرکتکنندگان را برای ایجاد پنوموپریتونئوم برای دریافت هلیوم (69 شرکتکننده) یا دیاکسید کربن (75 شرکتکننده) تصادفیسازی کرده بودند و یک کارآزمایی شامل 33 شرکتکننده تعداد شرکتکنندگان را در هر گروه بیان نکرده بود. هیچ یک از کارآزماییها دارای خطر پائین سوگیری نبودند. شواهد برای تعیین تاثیرات هلیوم یا دیاکسید کربن بر عوارض قلبیعروقی (RR: 1.46؛ 95% CI؛ 0.35 تا 6.12؛ سه مطالعه؛ 128 شرکتکننده؛ شواهد با کیفیت بسیار پائین) یا نمرات درد (نمره آنالوگ بصری در مقیاس 1 تا 10 با اعداد کمتر مبنی بر درد کمتر؛ MD: 0.49 سانتیمتر؛ 95% CI؛ 0.28 ‐ تا 1.26؛ دو مطالعه؛ 108 شرکتکننده؛ شواهد با کیفیت بسیار پائین) کافی نبود. برای ایجاد پنوموپریتونئوم با گاز هلیوم سه حادثه جانبی جدی (آمفیزم زیر‐جلدی (subcutaneous emphysema)) وجود داشت (سه مطالعه؛ 128 شرکتکننده؛ شواهد با کیفیت بسیار پائین).
یک کارآزمایی شرکتکنندگان را برای ایجاد پنوموپریتونئوم برای دریافت هوای اتاق (70 شرکتکننده) یا دیاکسید کربن (76 شرکتکننده) تصادفیسازی کرده بود. این کارآزمایی دارای خطر سوگیری نامشخص بود. در ایجاد پنوموپریتونئوم هیچ گونه حوادث قلبیعروقی یا حادثه جانبی جدی که منتسب به هریک از هوای اتاق یا دیاکسید کربن باشد، وجود نداشت (شواهد مربوط به هر دو پیامد دارای کیفیت بسیار پائینی بودند). در ایجاد پنوموپریتونئوم، شواهد حاکی از پائینتر بودن هزینههای بیمارستانی و درد کاهش یافته در طول روز اول پس از جراحی به نفع هوای اتاق در مقایسه با دیاکسید کربن بود (تفاوتی در حدود یک نمره آنالوگ بصری در مقیاس 1 تا 10 با اعداد کمتر مبنی بر درد کمتر، که به صورت شواهد با کیفیت بسیار پائین ارزیابی شد).
نتیجهگیریهای نویسندگان
کیفیت شواهد حاضر بسیار پائین است. تاثیرات نیتروزاکسید و هلیوم در ایجاد پنوموپریتونئوم در مقایسه با دیاکسید کربن نامطمئن است. شواهد به دست آمده از یک کارآزمایی با حجم نمونه کوچک حاکی از آن است که هوای اتاق در ایجاد پنوموپریتونئوم ممکن است هزینههای بیمارستانی را در افرادی که جراحی لاپاروسکوپی شکمی انجام میدهند، کاهش دهد. ایمنی نیتروزاکسید، هلیوم و هوای اتاق در ایجاد پنوموپریتونئوم هنوز به اثبات نرسیده است.
برای بررسی این موضوع انجام کارآزماییهای بیشتری مورد نیاز است، و بهتر است در این کارآزماییها به مقایسه گازهای متنوع (یعنی نیتروزاکسید، هلیوم، آرگون، نیتروژن، و هوای اتاق) با دیاکسید کربن تحت فشار استاندارد برای ایجاد پنوموپریتونئوم با دمیدن گاز سرد به داخل بدن برای افراد با خطر بیحسی بالا پرداخته شود. کارآزماییهای آتی بهتر است پیامدهایی را چون عوارض، حوادث جانبی جدی، کیفیت زندگی و درد دربرگیرند.
PICO
خلاصه به زبان ساده
گازهای مختلف برای دمیدن به داخل حفره شکمی در طول جراحی سوراخ کلید شکمی
سوال مطالعه مروری
مزایا و آسیبهای گازهای مختلف برای باد کردن با گاز (insufflation) حفره شکمی (abdominal) (tummy) به منظور ایجاد دسترسی آسانتر به ارگانها در طول جراحی لاپاروسکوپی (سوراخ کلید (key‐hole)) شکمی چه هستند؟
پیشینه
جراحی لاپاروسکوپی (حفره اصلی) در حال حاضر به طور گستردهای برای درمان انواع بیماریهای شکمی استفاده میشود. یک گاز ایدهآل برای باد کردن حفره شکمی، افزایش فضای کار و فضای دید برای شرکتکننده، بهتر است ارزان (cheap)، بیرنگ (colourless)، غیر‐قابل اشتعال (not flammable)، غیر‐قابل احتراق (inexplosive)، قابل دفع توسط بدن، و کاملا غیر‐سمی (non‐toxic) باشد. در حال حاضر، دیاکسید کربن (carbon dioxide) متداولترین گاز مورد استفاده برای این منظور است. با وجود این، استفاده از دیاکسید کربن ممکن است منجر به بروز عوارض قلبی یا ریوی شود. بنابراین، سایر گازها به عنوان جایگزینهایی برای دیاکسید کربن پیشنهاد شدهاند.
ویژگیهای مطالعه
تا سپتامبر 2016 برای دستیابی به تمامی مطالعات مرتبط جستوجو کردیم. نه کارآزمایی بالینی را شامل 519 شرکتکننده شناسایی کردیم، از این میان سه کارآزمایی (196 شرکتکننده) به مقایسه نیتروزاکسید (nitrous oxide) (گاز خندهآور (laughing gas)) با دیاکسید کربن؛ پنج کارآزمایی (177 شرکتکننده) به مقایسه هلیوم (helium) با دیاکسید کربن؛ و یک کارآزمایی (146 شرکتکننده) به مقایسه هوای اتاق (room air) با دیاکسید کربن پرداخته بودند. مطالعات در آمریکا، استرالیا، چین، فنلاند و هلند اجرا شده بودند. سن شرکتکنندگان در این کارآزماییها از 19 تا 62 سال متغیر بود.
نتایج کلیدی
درباره تفاوت در تعداد افرادی که در اثر استفاده از نیتروزاکسید و دیاکسید کربن دچار عوارض قلبی یا ریوی یا عوارض ناشی از جراحی شدند، نامطمئن هستیم. درباره وجود تفاوت در بروز عوارض قلبی یا ریوی، عوارض ناشی از جراحی یا نمرات درد میان هلیوم و دیاکسید کربن نیز نامطمئن هستیم.
هیچ گونه عوارض جانبی جدی، ناشی از استفاده از دیاکسید کربن، نیتروزاکسید، یا هوای اتاق وجود نداشتند، اما در مجموع عوارض جانبی جدی، حوادث نادری هستند و برای بررسی آنها به مطالعات بزرگتر با تعداد شرکتکنندگان بسیار بیشتری نیاز است تا بتوان نسبت به یکسان بودن ایمنی تمامی این گازها اطمینان حاصل کرد. در استفاده از هلیوم، سه عارضه جانبی جدی وجود داشت. به نظر میرسد بین استفاده از هوای اتاق و مجموع هزینههای بیمارستانی پائینتر در مقایسه با دیاکسید کربن در باد کردن حفره شکمی رابطه وجود داشته باشد.
به دلیل کم بودن تعداد شرکتکنندگان وارد شده در این مرور، ایمنی استفاده از نیتروزاکسید، هلیوم یا هوای اتاق ناشناخته است. هیچ شواهدی برای هیچ نوع بهبودی بالینی به واسطه استفاده از نیتروزاکسید، هلیوم، یا هوای اتاق به جای دیاکسید کربن وجود ندارد.
کیفیت شواهد
در مجموع، کیفیت شواهد برای این نتایج بسیار پائین است. بنابراین، در آینده اجرای کارآزماییهایی با طرح خوب برای بررسی عوارض، مضرات، کیفیت زندگی و درد در اسرع وقت مورد نیاز هستند.
Authors' conclusions
Summary of findings
| Nitrous oxide versus carbon dioxide for establishing pneumoperitoneum during laparoscopic abdominal surgery | ||||||
| Patient or population: people undergoing laparoscopic general abdominal or gynaecological pelvic surgery under general anaesthesia Setting: secondary and tertiary care Intervention: nitrous oxide pneumoperitoneum Comparison: carbon dioxide pneumoperitoneum | ||||||
| Outcomes | Anticipated absolute effects* (95% CI) | Relative effect | No of participants | Quality of the evidence | Comments | |
| Risk with carbon dioxide pneumoperitoneum | Risk with nitrous oxide pneumoperitoneum | |||||
| Cardiopulmonary complications Follow‐up: 0 to 1 month | 29 per 1000 | 57 per 1000 | RR 2.00 | 140 | ⊕⊝⊝⊝ | Trial sequential analysis showed a diversity‐adjusted required information size of 3781 participants to support or refute nitrous oxide pneumoperitoneum. |
| Procedure‐related general complications Follow‐up: 0 to 1 month | 28 per 1000 | 28 per 1000 | RR 1.01 | 143 | ⊕⊝⊝⊝ | Trial sequential analysis showed a diversity‐adjusted required information size of 3919 participants to support or refute nitrous oxide pneumoperitoneum. |
| Pneumoperitoneum‐related serious adverse events Follow‐up: 0 to 1 month | See comment | See comment | Not estimable | 196 | ⊕⊕⊝⊝ | None of the studies reported any pneumoperitoneum‐related serious adverse events. |
| Mortality Follow‐up: 0 to 1 month | See comment | See comment | Not estimable | 196 | ⊕⊕⊝⊝ | None of the studies reported any deaths. |
| Quality of life | None of the studies reported quality of life. | |||||
| Pain scores (first postoperative day) VAS, lower score indicates less pain. Follow‐up: 1 day | See comment | See comment | Not estimable | 140 | ⊕⊝⊝⊝ | Neither trials reported the standard deviation for pain scores on the VAS scale. Substantial clinical heterogeneity in between the 2 studies. |
| Analgesia requirements Follow‐up: 1 week | The mean analgesia requirement in the carbon dioxide pneumoperitoneum was 54.4 mg of oxycodone and 2.0 tablets/24 hours of ibuprofen | The mean analgesia requirement in the nitrous oxide pneumoperitoneum was 0.69 standard deviations lower | SMD ‐0.69 | 193 | ⊕⊝⊝⊝ | ‐ |
| Hospital costs | None of the studies reported costs. | |||||
| *The basis for the assumed risk is the mean comparison group proportion in the studies. The risk in the intervention group (and its 95% confidence interval) is based on the assumed risk in the comparison group and the relative effect of the intervention (and its 95% CI). CI: confidence interval; RR: risk ratio; SMD: standardised mean difference; VAS: visual analogue scale. | ||||||
| GRADE Working Group grades of evidence | ||||||
| 1 Downgraded two levels for very serious risk of bias. 2 Downgraded one level for serious imprecision (the confidence interval of risk ratio overlapped 0.75 and 1.25, and small sample size). 3 Downgraded one level for serious imprecision (small sample size). 4 Downgraded one level for serious risk of bias. 5 Downgraded one level for indirectness. 6 Downgraded one level for severe inconsistency (substantial heterogeneity as indicated by the I2 statistic). | ||||||
| Helium versus carbon dioxide for establishing pneumoperitoneum during laparoscopic abdominal surgery | ||||||
| Patient or population: people undergoing laparoscopic general abdominal or gynaecological pelvic surgery under general anaesthesia Setting: secondary and tertiary care Intervention: helium pneumoperitoneum Comparison: carbon dioxide pneumoperitoneum | ||||||
| Outcomes | Anticipated absolute effects* (95% CI) | Relative effect | No of participants | Quality of the evidence | Comments | |
| Risk with carbon dioxide pneumoperitoneum | Risk with helium pneumoperitoneum | |||||
| Cardiopulmonary complications Follow‐up: 0 to 1 month | 30 per 1000 | 44 per 1000 | RR 1.46 | 128 | ⊕⊝⊝⊝ | Trial sequential analysis showed a diversity‐adjusted required information size of 3651 participants to support or refute helium pneumoperitoneum. |
| Procedure‐related general complications Follow‐up: 0 to 1 month | See comment | See comment | Not estimable | 144 | ⊕⊝⊝⊝ Very low3,4 | None of the studies reported any significant procedure‐related general complications in either group. |
| Pneumoperitoneum‐related serious adverse events Follow‐up: 0 to 1 month | 0 per 1000 | 44 per 1000 | Peto OR 8.28 | 128 | ⊕⊝⊝⊝ | Trial sequential analysis showed a diversity‐adjusted required information size of 4793 participants to support or refute helium pneumoperitoneum. |
| Mortality Follow‐up: 0 to 1 month | See comment | See comment | Not estimable | 144 | ⊕⊕⊝⊝ | None of the studies reported any deaths. |
| Quality of life | None of the studies reported quality of life. | |||||
| Pain scores (first postoperative day) Visual analogue scale, lower score indicates less pain. Follow‐up: 1 day | The mean pain scores (first postoperative day) in the carbon dioxide pneumoperitoneum was 3.01 cm | The mean pain scores (first postoperative day) in the helium pneumoperitoneum was | MD 0.49 (‐0.28 to 1.26) | 108 | ⊕⊝⊝⊝ | ‐ |
| Analgesia requirements (morphine mg) Follow‐up: 2 days | The mean analgesia requirements (morphine) in the carbon dioxide pneumoperitoneum was 36.6 mg | The mean analgesia requirements (morphine) in the helium pneumoperitoneum was 12 mg higher | MD 12.00 (4.44 to 19.56) | 90 | ⊕⊝⊝⊝ | ‐ |
| Hospital costs | None of the studies reported costs. | |||||
| *The basis for the assumed risk is the mean comparison group proportion in the studies. The risk in the intervention group (and its 95% confidence interval) is based on the assumed risk in the comparison group and the relative effect of the intervention (and its 95% CI). CI: confidence interval; MD: mean difference; OR: odds ratio; RR: risk ratio. | ||||||
| GRADE Working Group grades of evidence | ||||||
| 1 Downgraded one level for serious risk of bias. 2 Downgraded two levels for very serious imprecision (the confidence interval of risk ratio overlapped 0.75 and 1.25, and small sample size). 3 Downgraded one level for serious imprecision (small sample size). 4 Downgraded two levels for very serious risk of bias. 5 Downgraded one level for indirectness. | ||||||
| Room air versus carbon dioxide for establishing pneumoperitoneum during laparoscopic abdominal surgery | ||||||
| Patient or population: people undergoing laparoscopic general abdominal or gynaecological pelvic surgery under general anaesthesia Setting: secondary and tertiary care Intervention: room air pneumoperitoneum Comparison: carbon dioxide pneumoperitoneum | ||||||
| Outcomes | Anticipated absolute effects* (95% CI) | Relative effect | No of participants | Quality of the evidence | Comments | |
| Risk with carbon dioxide pneumoperitoneum | Risk with room air pneumoperitoneum | |||||
| Cardiopulmonary complications Follow‐up: 1 month | See comment | See comment | Not estimable | 146 | ⊕⊝⊝⊝ | Trial did not report any cardiopulmonary complications. |
| Procedure‐related general complications | The study did not report procedure‐related general complications. | |||||
| Pneumoperitoneum‐related serious adverse events Follow‐up: 1 month | See comment | See comment | Not estimable | 146 | ⊕⊝⊝⊝ | Trial did not report any pneumoperitoneum‐related serious adverse events. |
| Mortality Follow‐up: 1 month | See comment | See comment | Not estimable | 146 | ⊕⊕⊝⊝ | The study did not report any deaths. |
| Quality of life | The study did not report quality of life. | |||||
| Pain scores (first postoperative day) Visual analogue scale, lower score indicates less pain. Follow‐up: 1 day | The mean pain scores (first postoperative day) in the carbon dioxide pneumoperitoneum was 2.60 cm | The mean pain scores (first postoperative day) in the room air pneumoperitoneum was | MD ‐0.80 (‐1.15 to ‐0.45) | 146 | ⊕⊝⊝⊝ | ‐ |
| Analgesia requirements | The study did not report analgesia requirements. | |||||
| Hospital costs (CNY) Follow‐up: 1 month | The mean hospital costs in the carbon dioxide pneumoperitoneum was CNY12,012.00 | The mean hospital costs in the room air pneumoperitoneum was CNY2667.00 lower | MD ‐2667.00 (‐3275.68 to ‐2058.32) | 146 | ⊕⊝⊝⊝ | ‐ |
| *The basis for the assumed risk is the mean comparison group proportion in the studies. The risk in the intervention group (and its 95% confidence interval) is based on the assumed risk in the comparison group and the relative effect of the intervention (and its 95% CI). CI: confidence interval; MD: mean difference. | ||||||
| GRADE Working Group grades of evidence | ||||||
| 1 Downgraded two levels for very serious risk of bias. 2 Downgraded one level for serious imprecision (small sample size). 3 Downgraded one level for serious risk of bias. | ||||||
Background
Description of the condition
Laparoscopic surgery, which was originally developed in the 1910s, is now widely performed by general surgeons to treat various abdominal diseases (Ahmad 2015; Antoniou 2015; Birch 2016; Cheng 2013; Spaner 1997), including diseases of the stomach, gallbladder, liver, pancreas, spleen, intestine, and kidney (Best 2016; Cai 2014; Cheng 2012a; Cheng 2015; Cheng 2016; Dasari 2011; Keus 2006; Kuhry 2008; Nabi 2016; Rao 2013; Riviere 2016; Sanabria 2013; Sauerland 2010).
The exact number of people undergoing laparoscopic surgery each year worldwide is unknown. Laparoscopic surgery offers various advantages over conventional open surgery, including less postoperative pain, smaller scars, shorter hospital stay, and a quicker recovery (Ahmad 2015; Antoniou 2015; Birch 2016). This method has become the gold standard for some abdominal procedures (e.g. laparoscopic cholecystectomy) (Gurusamy 2014; Keus 2006).
Description of the intervention
The first step in laparoscopic surgery is the establishment of pneumoperitoneum, including entry into the abdominal cavity and then insufflation of air or gas (Ahmad 2015; Birch 2016; Cheng 2013; Gurusamy 2014; Neudecker 2002), for facilitating adequate working and viewing space. Two common entry techniques are used: an open method (all layers of the abdominal wall are incised, and a trocar is inserted under direct vision), and a closed method (only the skin is incised, and a Veress needle is then inserted blindly into the abdominal cavity) (Ahmad 2015; Cheng 2013; Neudecker 2002). After entry into the abdominal cavity, gas is insufflated through the trocar (open method) or the Veress needle (closed method) to separate the abdominal wall from the internal organs (Ahmad 2015; Cheng 2013; Gurusamy 2014; Neudecker 2002). The established pneumoperitoneum provides sufficient operating space to ensure adequate visualisation of camera and manipulation of instruments in the abdominal cavity (Cheng 2013; Gurusamy 2014; Neudecker 2002).
How the intervention might work
A pneumoperitoneum of 8 mmHg to 20 mmHg is created and pressure is maintained during laparoscopic surgery (Gurusamy 2014; Karapolat 2011; Neudecker 2002). The ideal gas for establishing pneumoperitoneum should be cheap, colourless, non‐flammable, non‐explosive, easily excreted, and completely non‐toxic to participants (Menes 2000; Neuhaus 2001; Sammour 2009). Carbon dioxide, which was introduced to create pneumoperitoneum in 1920s, is the most common gas used for insufflation currently (Cheng 2012b; Karapolat 2011; Neudecker 2002; Spaner 1997). Carbon dioxide is absorbed by the peritoneum, delivered directly to the lungs by the circulation (Eaton 2009; Grabowski 2009), and is excreted by the lungs during respiratory exchange (Eaton 2009; Neuhaus 2001). Although carbon dioxide meets most of the requirements (e.g. low cost, non‐flammable, chemically stabile, and with high diffusion capacity with subsequent rapid absorption and excretion), it is not a perfect gas. The absorption of carbon dioxide causes hypercapnia and acidosis, which has to be avoided by hyperventilation (Grabowski 2009; Gurusamy 2014; Neudecker 2002). It is associated with various cardiopulmonary (heart and lung) complications, such as tachycardia, cardiac arrhythmias, and pulmonary oedema (Gurusamy 2014; Gutt 2004; Kwak 2010; Neudecker 2002). In addition, it may cause postoperative pain due to peritoneal irritation, and its use is associated with immunological impairment (Grabowski 2009; Neuhaus 2001). Elderly people with cardiopulmonary diseases are more likely to experience these adverse events (Grabowski 2009; Karapolat 2011).
Identifying an ideal insufflation gas to replace carbon dioxide attracts the attention of some researchers in the era of laparoscopic surgery (Menes 2000; Neuhaus 2001). Various gases, such as helium, argon, nitrogen, nitrous oxide, and room air, have been introduced as alternatives to carbon dioxide to establish pneumoperitoneum (Gardner 1995; Karapolat 2011;Menes 2000; Neuhaus 2001; Rammohan 2011). However, their uses are controversial. Helium and argon are inert gases that may offer some advantages over carbon dioxide (Gutt 2004; Menes 2000; Neuhaus 2001). Nevertheless, they are less soluble than carbon dioxide, which might increase the risk of venous gas embolism (Gutt 2004; Menes 2000; Neuhaus 2001). Nitrous oxide, also known as laughing gas, is a mild anaesthetic (Aboumarzouk 2011). It may reduce postoperative pain theoretically because of its anaesthetic and analgesic properties (Rammohan 2011; Tsereteli 2002). However, there have been two cases of explosion using electrocautery during laparoscopy (El‐Kady 1976; Gunatilake 1978), and the risk of explosion when using nitrous oxide insufflation remains controversial (Hunter 1995; Neuman 1993; Rammohan 2011).
Why it is important to do this review
The first version of this review was published in 2013 (Cheng 2013). Further randomised controlled trials (RCTs) evaluating different gases for establishing pneumoperitoneum during laparoscopic abdominal surgery have been published since the review, and these studies have now been assessed for inclusion and presented in this update.
Objectives
To assess the safety, benefits, and harms of different gases (e.g. carbon dioxide, helium, argon, nitrogen, nitrous oxide, room air) used for establishing pneumoperitoneum in participants undergoing laparoscopic general abdominal or gynaecological pelvic surgery.
Methods
Criteria for considering studies for this review
Types of studies
We included all RCTs (irrespective of sample size, language, or publication status) comparing different gases used for establishing pneumoperitoneum in participants undergoing laparoscopic abdominal surgery under general anaesthesia. We excluded studies on participants undergoing laparoscopic abdominal surgery under local/regional anaesthesia. We excluded quasi‐randomised trials (in which the allocation was performed on the basis of a pseudo‐random sequence, e.g. odd/even hospital number or date of birth, alternation), cluster randomised trials, and non‐randomised studies.
Types of participants
Participants (irrespective of age, sex, or race) who had undergone laparoscopic abdominal or gynaecological pelvic surgery (irrespective of elective or emergency procedure) under general anaesthesia.
Types of interventions
We included laparoscopic abdominal surgeries performed under standard pressure (12 mmHg to 16 mmHg) pneumoperitoneum with cold gas insufflation (Gurusamy 2014). We planned to assess the following gases for establishing pneumoperitoneum.
-
Nitrous oxide versus carbon dioxide.
-
Helium versus carbon dioxide.
-
Room (ambient) air versus carbon dioxide.
-
Argon versus carbon dioxide.
-
Nitrogen versus carbon dioxide.
-
Any other gas versus carbon dioxide.
-
Any other gas (except carbon dioxide) versus any other gas (except carbon dioxide).
Types of outcome measures
Primary outcomes
-
Complications (time point closest to 30 days; defined and graded by the Clavien‐Dindo complications classification system) (Clavien 2009).
-
Cardiopulmonary complications (defined by authors, e.g. arrhythmia, ischaemias, atelectasis, hypoxaemia, pneumothorax, pulmonary oedema).
-
Procedure‐related general complications (surgical morbidity).
-
-
Pneumoperitoneum‐related serious adverse events (time point closest to 30 days; defined by authors, e.g. gas embolism, subcutaneous emphysema, abdominal explosion).
Secondary outcomes
-
Mortality (up to 30 days postoperatively).
-
Quality of life (30 days, any validated score).
-
Pain scores (time point closest to seven days postoperatively; graded by visual analogue score (VAS) scale (e.g. 0 cm to 10 cm)).
-
Analgesia requirements (time point closest to seven days).
-
Costs (time point closest to 30 days; e.g. costs of gases, hospital costs).
-
Cardiopulmonary changes (time point closest to seven days; defined by authors, e.g. heart rate, blood pressure, blood pH, cardiac output, pulmonary compliance, peak airway pressure).
Search methods for identification of studies
We designed the search strategy with the help of Sys Johnsen (Cochrane Information Specialist of the Cochrane Colorectal Cancer Group). Searches were conducted in September 2016 irrespective of language, year, or publication status.
Electronic searches
We searched the following electronic databases with no language or date of publication restrictions:
-
Cochrane Central Register of Controlled Trials (CENTRAL) (the Cochrane Library) (2016, Issue 9) (Appendix 1);
-
MEDLINE (Ovid) (1950 to September 2016) (Appendix 2);
-
Embase (Ovid) (1974 to September 2016) (Appendix 3);
-
Science Citation Index Expanded (Web of Science) (1970 to September 2016) (Appendix 4);
-
World Health Organization International Trials Registry Platform search portal (apps.who.int/trialsearch/) (September 2016);
-
ClinicalTrials.gov (www.clinicaltrials.gov/) (September 2016);
-
Chinese Biomedical Literature Database (CBM) (1978 to September 2016).
Searching other resources
Furthermore, we also searched the following databases in September 2016:
-
Current Controlled Trials (www.controlled‐trials.com/);
-
Chinese Clinical Trial Register (www.chictr.org/);
-
EU Clinical Trials Register (www.clinicaltrialsregister.eu/).
We also searched the reference lists of identified studies and meeting abstracts via the Society of American Gastrointestinal and Endoscopic Surgeons (SAGES) (www.sages.org/), European Association for Endoscopic Surgery (EAES) (www.eaes‐eur.org/), and Conference Proceedings Citation Index to explore further relevant clinical trials. We planned to communicate with the authors of RCTs that were included for further information in the review.
Data collection and analysis
We conducted the systematic review according to guidelines of the Cochrane Handbook for Systematic Reviews of Intervention (Higgins 2011a) and Cochrane Colorectal Cancer Group Module (Andersen 2015).
Selection of studies
After completing the searches, we merged the search results using the software package Endnote X5 (reference management software) and removed duplicate records. Two review authors (WX, TB) independently scanned the title and abstract of every record identified by the search for inclusion. We retrieved the full text for further assessment if the inclusion criteria were unclear from the abstract. We included eligible studies irrespective of whether they reported the measured outcome data. We detected duplicate publications by identifying common authors, centres, details of the interventions, numbers of participants, and baseline data (Higgins 2011b). We excluded papers that did not meet the inclusion criteria and listed the reasons for their exclusion. A third review author (YT) resolved any discrepancy between the two authors by discussion.
Data extraction and management
We used a standard data collection form for study characteristics and outcome data, which had been piloted on at least one study in the review. Two review authors (CN, GJ) extracted the following study characteristics from included studies:
-
methods: study design, total duration study and run in, number of study centres and location, study setting, withdrawals, date of study;
-
participants: number of participants, mean age, age range, gender, severity of condition, diagnostic criteria, inclusion criteria, exclusion criteria;
-
interventions: intervention, comparison;
-
outcomes: primary and secondary outcomes specified and collected, time points reported;
-
notes: funding for trial, notable conflicts of interest of trial authors.
Two review authors (CN, GJ) independently extracted outcome data from included studies. We resolved disagreements by consensus or by involving a third review author (YT). One review author (CN) copied across the data from the data collection form into Review Manager 5 (RevMan 2014). We double‐checked that the data were entered correctly by comparing the study reports with how the data were presented in the systematic review. A second review author (BL) cross‐checked study characteristics for accuracy against the trial reports.
Assessment of risk of bias in included studies
Two review authors (WX, TB) independently assessed the risk of bias in the included trials, using the Cochrane 'Risk of bias' tool (Chapter 8, Higgins 2011c). We assessed risk of bias for the following domains:
-
random sequence generation;
-
allocation concealment;
-
blinding of participants and personnel;
-
blinding of outcome assessment;
-
incomplete outcome data;
-
selective reporting bias;
-
other sources of bias (baseline imbalances).
We judged each domain as low risk, high risk, or unclear risk of bias according to the criteria used in the Cochrane 'Risk of bias' tool (see Appendix 5) (Chapter 8.5.d, Higgins 2011c). We considered a trial to be at low risk of bias if we assessed the trial as at low risk of bias across all domains. Otherwise, we considered trials at unclear risk of bias or at high risk of bias regarding one or more domains as at high risk of bias. We resolved any difference in opinion by discussion. In case of disagreements, consensus was reached by discussion with a third review author (CY).
We presented the results of the risk of bias in two figures (a 'Risk of bias' graph and a 'Risk of bias' summary) generated by Review Manager 5 (RevMan 2014).
Measures of treatment effect
We performed the meta‐analysis using Review Manager 5 (RevMan 2014). For dichotomous outcomes, we calculated risk ratio (RR) with 95% confidence interval (CI) (Deeks 2011). In case of rare events (e.g. mortality, serious adverse events), we calculated the Peto odds ratio (Peto OR) (Deeks 2011). For continuous outcomes, we calculated the mean difference (MD) with 95% CI (Deeks 2011). For continuous outcomes with different measurement scales in different RCTs, we calculated the standardised mean difference (SMD) with 95% CI (Deeks 2011).
Unit of analysis issues
The unit of analysis was the individual participant.
Dealing with missing data
We contacted the original investigators to request further information in case of missing data. If there was no reply, we used only the available data in the analyses. We also performed 'best‐case'/'worst‐case' scenario analyses to take into account missing data. We did this by changing missing data to having an event ('worst/best‐case' scenario) and then to not having an event ('best/worst‐case' scenario) in a sensitivity analysis to investigate the impact of missing data on meta‐analysis results.
Assessment of heterogeneity
We described heterogeneity in the data using the Chi2 test (Deeks 2011). We considered a P value less than 0.05 to be statistically significant heterogeneity (Deeks 2011). We also used the I2 statistic to measure the quantity of heterogeneity. In case of statistical heterogeneity or clinical heterogeneity (or both), we performed the meta‐analysis but interpreted the result cautiously and planned to investigate potential sources to the heterogeneity.
Assessment of reporting biases
We planned to perform and examine a funnel plot to explore possible publication biases. However, as the number of trials included was less than 10, we did not produce any funnel plots (Sterne 2011).
Data synthesis
We performed the meta‐analysis using Review Manager 5 (RevMan 2014). For all analyses, we examined both fixed‐effect and random‐effects models. We reported only the fixed‐effect model results when there was no discrepancy between the two models. In case of discrepancy between the two models, we reported both results. We considered a P value less than 0.05 to be statistically significant.
Subgroup analysis and investigation of heterogeneity
We planned to perform the following subgroup analysis; however, due to too few included trials for each outcome analysis, these were not carried out:
-
abdominal surgery versus pelvic surgery;
-
elective procedure versus emergency procedure;
-
people with high anaesthetic risk (e.g. people with cardiopulmonary disease; American Society of Anesthesiologists (ASA) status III or IV) versus people with low anaesthetic risk (e.g. people without cardiopulmonary disease; ASA status I or II).
Sensitivity analysis
We performed the following sensitivity analyses:
-
changing between worst/best‐case scenario analysis and best/worst‐case scenario analysis for missing data.
If the results did not change, they were considered to be robust.
We also planned to perform the following two sensitivity analyses; however, as all included trials had a high or unclear risk of bias and low numbers of participants, these could not be carried out:
-
excluding trials with a high or unclear risk of bias.
-
excluding RCTs with small sample sizes.
Trial sequential analysis
We performed trial sequential analysis (TSA) for the primary outcomes if possible. TSA aims to reduce the risk of random error in the setting of repetitive testing of accumulating data, thereby improving the reliability of conclusions (Brok 2008; Wetterslev 2008; Wetterslev 2009). The required information size was calculated on the basis of a risk ratio reduction (RRR) of 20% (Brok 2008; Wetterslev 2008; Wetterslev 2009). The results of the trials were presented as a cumulative Z‐curve. The trial sequential monitoring boundaries were constructed and the diversity‐adjusted required information size calculated with a type 1 error of 5% and a type 2 error of 20% (Brok 2008; Wetterslev 2008; Wetterslev 2009). TSA was not adjusted for heterogeneity because the estimate of the heterogeneity parameter may be unreliable. The results were presented as a graph with the cumulative meta‐analysis results entered. The TSA shows firm evidence of intervention effects (or no intervention effects) if the cumulative Z‐curve crosses the monitoring boundaries; it also shows that additional trials may be needed if the boundaries are not crossed (Brok 2008; Wetterslev 2008; Wetterslev 2009). TSA was performed using Trial Sequential Analysis software (TSA 2011).
'Summary of findings' tables
We evaluated the quality of evidence using the GRADE (Schünemann 2009) approach for each outcome, including any subgroup analysis or sensitivity analysis.
We presented the quality of evidence in 'Summary of Finding' tables for the following comparisons:
-
nitrous oxide pneumoperitoneum versus carbon dioxide pneumoperitoneum;
-
helium pneumoperitoneum versus carbon dioxide pneumoperitoneum;
-
room air pneumoperitoneum versus carbon dioxide pneumoperitoneum.
Judgements about the quality of the evidence (high, moderate, low, or very low) were justified, documented, and incorporated into the reporting of results for each outcome. The quality of evidence could be downgraded by one level (serious concern) or two levels (very serious concerns) applying to each of the following five reasons listed: risk of bias; inconsistency (unexplained heterogeneity, inconsistency of results); indirectness (indirect population, intervention, control, outcomes); imprecision (wide CIs, single trials); and publication bias.
Results
Description of studies
See: Characteristics of included studies and Characteristics of excluded studies tables.
Results of the search
In this updated review, we identified 2269 records through the electronic searches of the Cochrane Library (336 records), MEDLINE (Ovid) (332 records), Embase (Ovid) (425 records), Science Citation Index Expanded (Web of Science) (1156 records), and Chinese Biomedical Literature Database (CBM) (20 records). Of the 2269 records, 1861 records had already been assessed for the first version of this updated review (1648 records prior to 2012 and 213 duplicates). Of the remaining 408 records, we excluded 406 clearly irrelevant records through reading titles and abstracts. The remaining two records were retrieved for further assessment (Bergstrom 2015; Gu 2015). The trial by Bergstrom 2015 was a conference abstract. We contacted the original investigators for further information necessary for assessment, but did not receive any feedback. Therefore, this study is awaiting classification. The trial by Sietses 2002, originally excluded in the first published version of this review (Cheng 2013), was re‐evaluated and included in this update.
In total, this updated review included nine RCTs. The study flow diagram is shown in Figure 1.

Study flow diagram.
Included studies
In the first published version of this review from 2013, we included seven trials, published between 1993 and 2002 (Aitola 1998; Bongard 1993; Lipscomb 1993; Naude 1996; Neuhaus 2001; O'Boyle 2002; Tsereteli 2002). In this update, we re‐evaluated and included the trial by Sietses 2002 and identified one recent trial (Gu 2015), to a total of nine included trials (including 519 participants). Details of the trials are shown in the Characteristics of included studies table. Three trials compared carbon dioxide pneumoperitoneum with nitrous oxide pneumoperitoneum (Aitola 1998; Lipscomb 1993; Tsereteli 2002). Five trials compared carbon dioxide pneumoperitoneum with helium pneumoperitoneum (Bongard 1993; Naude 1996; Neuhaus 2001; O'Boyle 2002; Sietses 2002). One trial compared room (ambient) air pneumoperitoneum with carbon dioxide pneumoperitoneum (Gu 2015). Studies were conducted in the USA (Bongard 1993; Lipscomb 1993; Naude 1996; Tsereteli 2002), Australia (Neuhaus 2001; O'Boyle 2002), China (Gu 2015), Finland (Aitola 1998), and Netherlands (Sietses 2002). The age of the participants varied between 19 and 62 years. The proportion of women varied between 45.5% and 100%. Participants underwent various elective laparoscopic general abdominal or gynaecological pelvic procedures (e.g. cholecystectomy, fundoplication (anti‐reflux surgery), hernia repair, tubal ligation). The outcomes measured were complications, pneumoperitoneum‐related serious adverse events, cardiopulmonary changes, pain scores, hospital costs, and mortality.
Excluded studies
We excluded seven studies. One RCT included participants who underwent laparoscopic pelvic surgery performed by gynaecological surgeons under local anaesthesia (Lipscomb 1994). Another RCT focused on diagnostic laparoscopy performed under local anaesthesia (Sharp 1982). None of the other excluded studies were RCTs (Fernández‐Cruz 1998; McMahon 1994; Neuberger 1996; Ooka 1993; Rammohan 2011).
Ongoing studies
We identified one ongoing study. Sixty‐four participants (all with low anaesthetic risk) undergoing laparoscopic cholecystectomy will be randomised to nitrous oxide pneumoperitoneum or carbon dioxide pneumoperitoneum (Asgari 2012). This trial is currently recruiting participants, being performed in Iran, and was initiated November 2010. The primary outcome is heart rate. The secondary outcome is mean arterial pressure (see Characteristics of ongoing studies table).
Risk of bias in included studies
The risk of bias of the included studies is shown in Figure 2 and Figure 3. None of the included trials was at low risk of bias.

Risk of bias graph: review authors' judgements about each risk of bias item presented as percentages across all included studies.

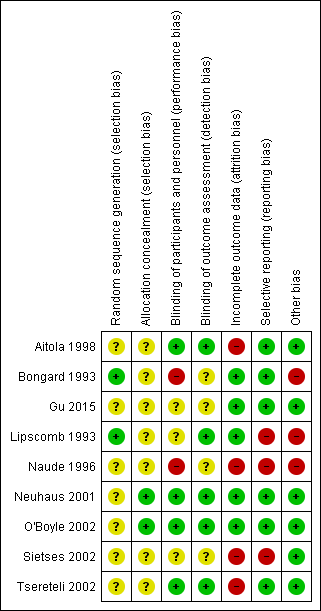
Risk of bias summary: review authors' judgements about each risk of bias item for each included study.
Allocation
Random sequence generation was at low risk of bias in two trials where participants were randomised using computer‐generated numbers (Bongard 1993; Lipscomb 1993), and unclear risk of bias in seven trials (Aitola 1998; Gu 2015; Naude 1996; Neuhaus 2001; O'Boyle 2002; Sietses 2002; Tsereteli 2002). Allocation concealment was at low risk of bias in two trials that used sealed opaque envelopes to conceal the allocations (Neuhaus 2001; O'Boyle 2002), and unclear risk of bias in the remaining seven studies (Aitola 1998; Bongard 1993; Gu 2015; Lipscomb 1993; Naude 1996; Sietses 2002; Tsereteli 2002).
Blinding
Blinding of participants and personnel was at low risk of bias in four trials (Aitola 1998; Neuhaus 2001; O'Boyle 2002; Tsereteli 2002), unclear risk of bias in three trials (Gu 2015; Lipscomb 1993; Sietses 2002), and high risk of bias in two trials (Bongard 1993; Naude 1996). Blinding of outcome assessment was at low risk of bias in five trials (Aitola 1998; Lipscomb 1993; Neuhaus 2001; O'Boyle 2002; Tsereteli 2002), and unclear risk of bias in four trials (Bongard 1993; Gu 2015; Naude 1996; Sietses 2002).
Incomplete outcome data
There were no postrandomisation dropouts in three trials (Gu 2015; Lipscomb 1993; Neuhaus 2001). Although there were seven dropouts (6.4%) in two trials, the data were analysed on an intention‐to‐treat basis (Bongard 1993; O'Boyle 2002). These five trials were considered at low risk of attrition bias. There were 12 dropouts (6.2%) in the other four trials (Aitola 1998; Naude 1996; Sietses 2002; Tsereteli 2002), but the data were not analysed on an intention‐to‐treat basis. Thus, these four trials were at high risk of attrition bias. The reasons for the dropouts were reported in the Characteristics of included studies table.
Selective reporting
The trial protocols were not available for any of the trials. Six trials reported all of the important pneumoperitoneum‐related outcomes (primary outcomes of this review) (Aitola 1998; Bongard 1993; Gu 2015; Neuhaus 2001; O'Boyle 2002; Tsereteli 2002). There may have been selective outcome reporting in the secondary outcomes, but the review authors considered these six trials to be free of selective reporting for the primary outcomes of the review. Three trials were at high risk of selective reporting bias as none of the primary outcomes of the review were reported (Lipscomb 1993; Naude 1996; Sietses 2002).
Other potential sources of bias
Three trials presented considerable baseline imbalance, thus we considered these at high risk of bias (Bongard 1993; Lipscomb 1993; Naude 1996).
Effects of interventions
See: Summary of findings for the main comparison Nitrous oxide versus carbon dioxide for establishing pneumoperitoneum during laparoscopic abdominal surgery; Summary of findings 2 Helium versus carbon dioxide for establishing pneumoperitoneum during laparoscopic abdominal surgery; Summary of findings 3 Room air versus carbon dioxide for establishing pneumoperitoneum during laparoscopic abdominal surgery
1. Nitrous oxide pneumoperitoneum versus carbon dioxide pneumoperitoneum
Three trials with 196 participants compared nitrous oxide pneumoperitoneum versus carbon dioxide pneumoperitoneum (Aitola 1998; Lipscomb 1993; Tsereteli 2002). See summary of findings Table for the main comparison.
1.1. Primary outcomes
1.1.1. Cardiopulmonary complications (Analysis 1.1)
Two trials (140 participants) reported cardiopulmonary complications (Aitola 1998; Tsereteli 2002). The cardiopulmonary complication rate was 5.7% in the nitrous oxide group and 2.9% in the carbon dioxide group. There was no evidence of a difference in cardiopulmonary complications between the groups (RR 2.00, 95% CI 0.38 to 10.43; low‐quality evidence; Analysis 1.1). There was clinical heterogeneity because the two trials performed quite different laparoscopic operations (cholecystectomy versus foregut surgery). This finding was downgraded to very low quality due to very serious study limitations (incomplete outcome data and selective reporting) and serious imprecision (wide CIs and small sample size).
The TSA graph showed that the cumulative Z‐curve did not cross the naive 5% statistical boundaries (Figure 4). The analysis showed a diversity‐adjusted required information size of 3781 participants (the number of participants needed to reach firm evidence of an intervention effect of 20% RRR). The number of participants included corresponded to only a small fraction (3.7%) of the diversity‐adjusted required information size; therefore, the trial sequential boundaries could not be drawn. Accordingly, we lack evidence to conclude equivalence of nitrous oxide and carbon dioxide pneumoperitoneum.
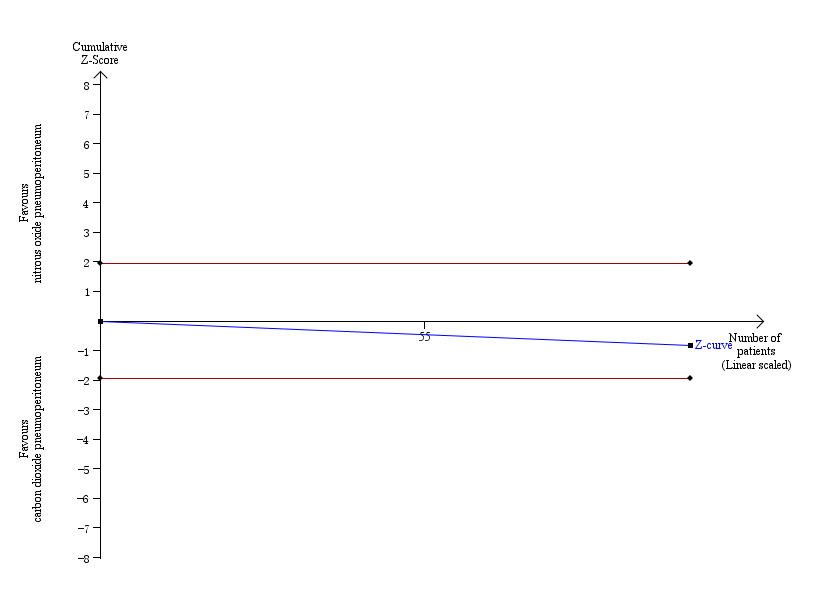
Trial sequential analysis of nitrous oxide pneumoperitoneum versus carbon dioxide pneumoperitoneum for cardiopulmonary complications. Analysis was performed with an event rate of 2.9% (Pc) in the control group, a risk ratio reduction of 20%, alpha 5%, beta 20%, and observed diversity 0%. The accrued sample size was so small that the trial sequential boundaries could not be drawn. The cumulative Z‐curve did not cross the naive 5% statistical boundaries (red horizontal lines). The results showed that the observed diversity‐adjusted required information size was 3781 participants, corresponding to 3.7% of the total sample size in the included trials. Accordingly, the meta‐analysis did not support or refute an intervention effect as data were too few.
1.1.2. Procedure‐related general complications (surgical morbidity) (Analysis 1.2)
Two trials (143 participants) reported surgical morbidity (Aitola 1998; Tsereteli 2002). The surgical morbidity was 2.8% in the nitrous oxide group versus 2.8% in the carbon dioxide group. There was no evidence of a difference in the surgical morbidity (procedure‐related general complications) between the groups (RR 1.01, 95% 0.18 to 5.71; very‐low‐quality evidence; Analysis 1.2). There was clinical heterogeneity because the two trials performed quite different laparoscopic operations (cholecystectomy versus foregut surgery). This finding was downgraded to very low quality due to very serious study limitations (incomplete outcome data and selective reporting) and serious imprecision (wide CIs and small sample size).
The TSA graph showed that the cumulative Z‐curve did not cross the naive 5% statistical boundaries (Figure 5). The analysis showed a required information size of 3919 participants (the number of participants needed to reach firm evidence of an intervention effect of 20% RRR). The number of participants included corresponded to only a small fraction (3.6%) of the diversity‐adjusted required information size; therefore, the trial sequential boundaries could not be drawn. Accordingly, we lack evidence to conclude equivalence of nitrous oxide and carbon dioxide pneumoperitoneum.

Trial sequential analysis of nitrous oxide pneumoperitoneum versus carbon dioxide pneumoperitoneum for surgical morbidity. Analysis was performed with an event rate of 2.8% (Pc) in the control group, a risk ratio reduction of 20%, alpha 5%, beta 20%, and observed diversity 0%. The cumulative Z‐curve did not cross the naive 5% statistical boundaries (red horizontal lines). The results showed that the observed diversity adjusted required information size was 3919 participants, corresponding to 3.6% of the total sample size in the included trials. Accordingly, the meta‐analysis did not support or refute an intervention effect as data were too few.
1.1.3. Pneumoperitoneum‐related serious adverse events
None of the trials reported any pneumoperitoneum‐related serious adverse events. This finding was downgraded to low quality of evidence due to serious study limitations (incomplete outcome data) and serious imprecision (small sample size for such a rare outcome).
1.2. Secondary outcomes
1.2.1. Mortality
None of the trials reported any deaths. This finding was downgraded to low quality of evidence due to serious study limitations (incomplete outcome data) and serious imprecision (small sample size for such a rare outcome).
1.2.2. Quality of life
None of the trials reported quality of life.
1.2.3. Pain scores
Two trials (140 participants) reported pain scores (Aitola 1998; Tsereteli 2002). Both reported lower pain scores (about 1 cm on a VAS scale of 1 cm to 10 cm with lower numbers indicating less pain) in the nitrous oxide group compared with the carbon dioxide group at various time points on the first postoperative day. However, as neither trial reported the standard deviation (SD) for pain scores, we did not perform a meta‐analysis. There was clinical heterogeneity because the trials performed quite different laparoscopic operations (cholecystectomy versus foregut surgery). This finding was downgraded to very low quality of evidence due to study limitations (incomplete outcome data), indirectness and serious imprecision (small sample size).
Another trial reported pain scores using McGill pain questionnaire, but was not considered for this outcome, because it did not use the VAS scale (Lipscomb 1993, 53 participants undergoing laparoscopic tubal ligation).
1.2.4. Analgesia requirements (Analysis 1.3)
Three trials (193 participants) reported analgesia requirements. The trials used different measurement scales (milligrams versus tablets per 24 hours), therefore we calculated a SMD. The fixed‐effect model showed less analgesic consumption (oxycodone or ibuprofen) in the nitrous oxide group compared with the carbon dioxide group (SMD ‐0.79, 95% CI ‐1.09 to ‐0.49; very low quality evidence). The statistical heterogeneity was substantial (I2 = 82%) and applying the random‐effects model did not show any evidence of difference in analgesic consumption between the groups (SMD ‐0.69, 95% CI ‐1.42 to 0.04; very‐low‐quality evidence; Analysis 1.3). In addition, there was clinical heterogeneity because the three trials performed quite different laparoscopic operations (cholecystectomy, foregut surgery, tubal ligation). Consequently, this finding was downgraded to very low quality of evidence due to study limitations (incomplete outcome data), serious imprecision (small sample size), and serious inconsistency.
1.2.5. Costs
None of the trials reported costs.
1.2.6. Cardiopulmonary changes (Analysis 1.4)
One trial (100 participants) reported cardiopulmonary changes (Tsereteli 2002). There was no evidence of a difference in the following cardiopulmonary parameter changes between the groups: heart rate (MD ‐0.60 beats/minute, 95% CI ‐4.13 to 2.93; very‐low‐quality evidence), mean arterial pressure (MD ‐3.80 mmHg, 95% CI ‐7.90 to 0.30; very‐low‐quality evidence), oxygen saturation (MD 0%, 95% CI ‐0.39 to 0.39; very low quality of evidence), and peak airway pressure (MD ‐0.30 cmH2O, 95% CI ‐2.17 to 1.57; very low quality of evidence) (Analysis 1.4). None of the other cardiopulmonary changes were reported. These findings were downgraded to very low quality of evidence due to study limitations (incomplete outcome data), serious imprecision (small sample size), and indirectness of the outcome (surrogate outcome).
2. Helium pneumoperitoneum versus carbon dioxide pneumoperitoneum
Five trials (177 participants) reported helium pneumoperitoneum versus carbon dioxide pneumoperitoneum (Bongard 1993; Naude 1996; Neuhaus 2001; O'Boyle 2002; Sietses 2002). See summary of findings Table 2.
2.1. Primary outcomes
2.1.1. Cardiopulmonary complications (Analysis 2.1)
Three trials (128 participants) reported cardiopulmonary complications (Bongard 1993; Neuhaus 2001; O'Boyle 2002). The cardiopulmonary complication rate was 4.4% in the helium group and 3.0% in the carbon dioxide group. There was no evidence of a difference in cardiopulmonary complications between the groups (RR 1.46, 95% CI 0.35 to 6.12; very‐low‐quality evidence; Analysis 2.1). There was clinical heterogeneity because the three trials performed quite different laparoscopic operations (e.g. cholecystectomy, fundoplication, and gastrointestinal surgery). This finding was downgraded to very low quality of evidence due to serious study limitations (lack of blinding and selective reporting) and very serious imprecision (wide CIs and small sample size).
The TSA graph showed that the cumulative Z‐curve did not cross the naive 5% statistical boundaries (Figure 6). The analysis showed a diversity‐adjusted required information size of 3651 participants (the number of participants needed to reach firm evidence of an intervention effect of 20% RRR). The number of participants included corresponded to only a small fraction (3.5%) of the diversity‐adjusted required information size; therefore, the trial sequential boundaries could not be drawn. Accordingly, we lack evidence to conclude equivalence of helium and carbon dioxide pneumoperitoneum.
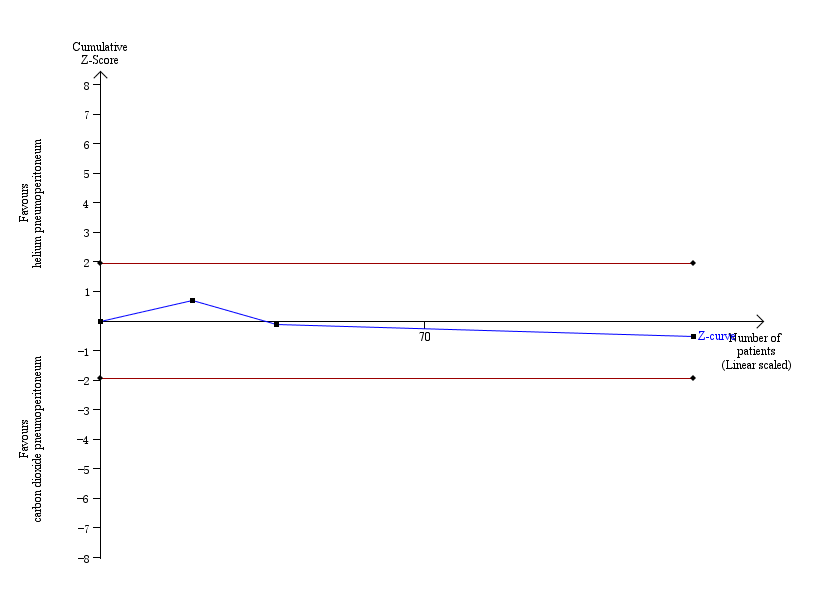
Trial sequential analysis of helium pneumoperitoneum versus carbon dioxide pneumoperitoneum for cardiopulmonary complications. Analysis was performed with an event rate of 3.0% (Pc) in the control group, a risk ratio reduction of 20%, alpha 5%, beta 20%, and observed diversity 0%. The cumulative Z‐curve did not cross the naive 5% statistical boundaries (red horizontal lines). The results showed that the observed diversity adjusted required information size was 3651 participants, corresponding to 3.5% of the total sample size in the included trials. Accordingly, the meta‐analysis did not support or refute an intervention effect as data were too few.
2.1.2. Procedure‐related general complications (surgical morbidity)
None of the trials reported any significant procedure‐related general complications. This finding was downgraded to very low quality of evidence due to very serious study limitations (lack of blinding, incomplete outcome data, and other bias) and serious imprecision (small sample size).
2.1.3. Pneumoperitoneum‐related serious adverse events (Analysis 2.2)
Three trials (128 participants) reported serious adverse events (Bongard 1993; Neuhaus 2001; O'Boyle 2002). There were three serious adverse events (subcutaneous emphysema) related to helium pneumoperitoneum; the serious adverse event rate was 4.9% in the helium pneumoperitoneum group and 0% in the carbon dioxide pneumoperitoneum group. There was no evidence of a difference in the Peto OR for pneumoperitoneum‐related serious adverse events between groups (Peto OR 8.28, 95% CI 0.86 to 80.03; very low quality of evidence; Analysis 2.2). There was clinical heterogeneity because the three trials performed quite different laparoscopic operations. This finding was downgraded to very low quality evidence due to study limitations (lack of blinding and selective reporting), indirectness and serious imprecision (small sample size for such a rare outcome).
The TSA graph showed that the cumulative Z‐curve did not cross the naive 5% statistical boundaries (Figure 7). The analysis showed a diversity‐adjusted required information size of 4793 participants (the number of participants needed to reach firm evidence of an intervention effect of 20% RRR). The number of participants included corresponded to only 2.7% of the diversity‐adjusted required information size; therefore, the trial sequential boundaries could not be drawn. Accordingly, we lack evidence to conclude equivalence of helium and carbon dioxide pneumoperitoneum.
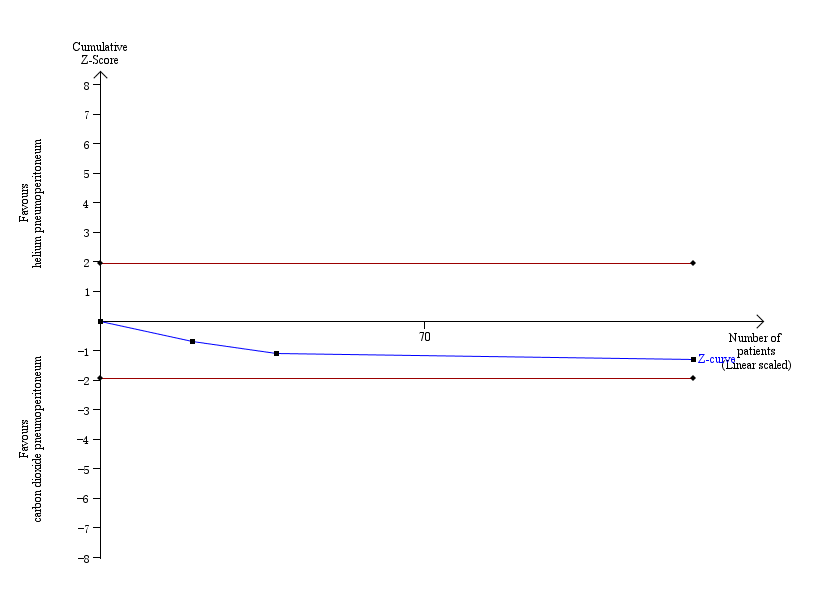
Trial sequential analysis of helium pneumoperitoneum versus carbon dioxide pneumoperitoneum for serious adverse events. Analysis was performed with an event rate of 2.3% (Pc) in the control group, a risk ratio reduction of 20%, alpha 5%, beta 20%, and observed diversity 0%. The cumulative Z‐curve did not cross the naive 5% statistical boundaries (red horizontal lines). The results showed that the observed diversity adjusted required information size was 4793 participants, corresponding to 2.7% of the total sample size in the included trials. Accordingly, the meta‐analysis did not support or refute an intervention effect as data were too few.
2.2. Secondary outcomes
2.2.1. Mortality
None of the trials reported any deaths. This finding was downgraded to low quality of evidence due to serious risk of bias and imprecision (small sample size for such a rare outcome).
2.2.2. Quality of life
None of the trials reported quality of life.
2.2.3. Pain scores (shoulder or abdominal pain) (Analysis 2.3)
Two trials (108 participants) reported pain scores (Neuhaus 2001; O'Boyle 2002). There was no evidence of a difference in the first postoperative day pain scores (graded by VAS on a scale of 1 cm to 10 cm, with lower numbers indicating less pain) between the groups (MD 0.49 cm, 95% CI ‐0.28 to 1.26; very low quality evidence; Analysis 2.3). There was clinical heterogeneity because the two trials performed quite different laparoscopic operations. This finding was downgraded to very low quality of evidence due to study limitations (random sequence generation was at unclear risk), indirectness and serious imprecision (small sample size).
2.2.4. Analgesia requirements (Analysis 2.4; Analysis 2.5)
Two trials (108 participants) reported analgesia requirements (Neuhaus 2001; O'Boyle 2002). One trial reported the amount of analgesia consumed (O'Boyle 2002). The overall analgesic (morphine) consumption was higher in the helium group than the carbon dioxide group (MD 12.00 mg, 95% CI 4.44 to 19.56; very‐low‐quality evidence; Analysis 2.4). One trial reported the number of participants requiring analgesia (Neuhaus 2001). There was no evidence of a difference in analgesia (morphine) requirements between the helium group (3/8; 37.5%) and carbon dioxide group (9/10; 90%) (Analysis 2.5). However, the trial was underpowered with only 18 participants (very low quality of evidence). There was clinical heterogeneity because the two trials performed quite different laparoscopic operations. This finding was downgraded to very low quality of evidence due to study limitations (random sequence generation was at unclear risk), indirectness and serious imprecision (small sample size).
2.2.5. Costs
None of the trials reported costs.
2.2.6. Cardiopulmonary changes (Analysis 2.6)
Two trials (34 participants) reported blood pH (Bongard 1993; Naude 1996). There was no evidence of a differences between the groups in blood pH at the start of pneumoperitoneum (MD 0.01, 95% CI ‐0.01 to 0.04; very‐low‐quality evidence) or the middle of pneumoperitoneum (MD ‐0, 95% CI ‐0.03 to 0.02; very‐low‐quality evidence). However, the blood pH was higher in the helium group compared with the carbon dioxide group at the end of pneumoperitoneum (MD 0.10, 95% CI ‐0.06 to ‐0.14; very‐low‐quality evidence). Three trials (52 participants) reported partial pressure of carbon dioxide (Bongard 1993; Naude 1996; Neuhaus 2001). There was no evidence of differences between the groups in partial pressure of carbon dioxide at the start of pneumoperitoneum (MD 0.31 mmHg, 95% CI ‐1.79 to 2.40; very‐low‐quality evidence) or the middle of pneumoperitoneum (MD 0.84 mmHg, 95% CI ‐2.02 to 3.70; very‐low‐quality evidence). However, the partial pressure of carbon dioxide was lower in the helium group than the carbon dioxide group at the end of pneumoperitoneum (MD ‐12.78 mmHg, 95% CI ‐16.78 to ‐8.77; very‐low‐quality evidence). There was clinical heterogeneity because the included trials performed quite different laparoscopic operations. These findings were downgraded to very low quality of evidence due to study limitations (lack of blinding, incomplete outcome data, and other bias), serious imprecision (small sample size), and indirectness of the outcome (surrogate outcome).
3. Room (ambient) air pneumoperitoneum versus carbon dioxide pneumoperitoneum
Only one trial (146 participants) reported room (ambient) air pneumoperitoneum versus carbon dioxide pneumoperitoneum (Gu 2015). See summary of findings Table 3.
3.1. Primary outcomes
3.1.1. Cardiopulmonary complications
The trial did not report any cardiopulmonary complications. This finding was downgraded to very low quality of evidence due to very serious study limitations (allocation and blinding were unclear) and serious imprecision (small sample size).
3.1.2. Procedure‐related general complications (surgical morbidity)
The trial did not report surgical morbidity.
3.1.3. Pneumoperitoneum‐related serious adverse events
The trial did not report any pneumoperitoneum‐related serious adverse events. This finding was downgraded to very low quality of evidence due to very serious study limitations (allocation and blinding were unclear) and serious imprecision (small sample size for such a rare outcome).
3.2. Secondary outcomes
3.2.1. Mortality
The trial did not report any deaths. This finding was downgraded to low quality of evidence due to study limitations (allocation and blinding were unclear) and serious imprecision (small sample size for such a rare outcome).
3.2.2. Quality of life
The trial did not report quality of life.
3.2.3. Pain scores (Analysis 3.3)
The first postoperative day pain scores (graded by VAS on a scale of 1 cm to 10 cm with lower numbers indicating less pain) were lower in the room air group than in the carbon dioxide group (MD ‐0.80 cm, 95% CI ‐1.15 to ‐0.45; very low quality evidence). This finding was downgraded to very low quality of evidence due to very serious study limitations (allocation and blinding were unclear) and serious imprecision (small sample size).
3.2.4. Analgesia requirements
The trial did not report analgesia requirements.
3.2.5. Costs (Analysis 3.4)
The total hospital costs were lower in the room air group than in the carbon dioxide group (MD ‐CNY2667.00, 95% CI ‐3275.68 to ‐2058.32; very‐low‐quality evidence; equivalent to approximately USD300 to USD475 in November 2016). This finding was downgraded to very low quality of evidence due to very serious study limitations (allocation and blinding were unclear) and serious imprecision (small sample size).
3.2.6. Cardiopulmonary changes (Analysis 3.5)
There was no evidence of a difference between groups in heart rate at the start of pneumoperitoneum (MD ‐0.10 beats/minute, 95% CI ‐3.11 to 2.91; very‐low‐quality evidence). However, heart rate was lower in the room air group compared with the carbon dioxide group in the middle of pneumoperitoneum (MD ‐7.30 beats/minute, 95% CI ‐9.78 to ‐4.82; very low quality evidence) and the end of pneumoperitoneum (MD ‐8.70 beats/minutes, 95% CI ‐11.72 to ‐5.68; very low quality evidence) of pneumoperitoneum (Analysis 3.5).
There was no evidence of differences between groups in blood systolic pressure or partial pressure of carbon dioxide at the start, middle, or end of pneumoperitoneum (all very low quality evidence).
All these findings were downgraded to very low quality of evidence due to study limitations (allocation and blinding were unclear), serious imprecision (small sample size), and indirectness of the outcome (surrogate outcome).
4. Reporting bias
We did not perform funnel plots to assess reporting biases because the number of included trials was less than 10. We did not identify any study protocols or trials registration records. Three trials were regarded as high risk of reporting bias as none of the trials did not investigate the primary outcomes (Lipscomb 1993; Naude 1996; Sietses 2002).
5. Subgroup analysis
None of the planned subgroup analyses was performed due to the limited number of included trials for each outcome.
6. Sensitivity analysis
We performed worst/best‐case scenario and best/worst‐case scenario analyses for the outcomes cardiopulmonary complications, procedure‐related general complications (surgical morbidity), pneumoperitoneum‐related serious adverse events, and mortality to assess the impact of missing data for 13 postrandomisation dropouts across five trials (Analysis 4.1; Analysis 4.2; Analysis 4.3; Analysis 4.4; Analysis 5.1; Analysis 5.2; Analysis 5.3; Analysis 5.4; Analysis 6.1; Analysis 6.2; Analysis 6.3; Analysis 6.4; Analysis 7.1; Analysis 7.2; Analysis 7.3; Analysis 7.4). Results are presented in Table 1. Assigning death or no death to all missing participants in the helium versus carbon dioxide pneumoperitoneum comparison altered the conclusion drawn, confirming that the low mortality rate and small numbers of participants were insufficient to reliably assess this outcome. The other three outcomes (cardiopulmonary complications, procedure‐related general complications, and pneumoperitoneum‐related serious adverse events) also changed by assigning event or no event to all missing participants in the helium versus carbon dioxide pneumoperitoneum comparison.
| Changing between worst‐case scenario analysis and best‐case scenario analysis for missing data | |||
| Outcomes | Risk ratio (95% CI) | ||
| Main analysis | Worst/best‐case | Best/worst‐case | |
| Cardiopulmonary complications (nitrous oxide vs carbon dioxide) | 2.00 (0.38, 10.43) | 2.64 (0.64, 10.93) | 1.02 (0.27, 3.86) |
| Procedure‐related general complications/surgical morbidity (nitrous oxide vs carbon dioxide) | 1.01 (0.18, 5.71) | 1.82 (0.40, 8.31) | 0.56 (0.12, 2.58) |
| Pneumoperitoneum‐related serious adverse events (nitrous oxide vs carbon dioxide) | No events | Peto OR 7.46 (0.47, 119.30) | Peto OR 0.14 (0.01, 2.19) |
| Mortality (nitrous oxide vs carbon dioxide) | No events | Peto OR 7.46 (0.47, 119.30) | Peto OR 0.14 (0.01, 2.19) |
| Cardiopulmonary complications (helium vs carbon dioxide) | 1.46 (0.35, 6.12) | 4.58 (1.21, 17.36) | 1.46 (0.35, 6.12) |
| Procedure‐related general complications/surgical morbidity (helium vs carbon dioxide) | No events | 8.47 (1.11, 64.60) | 0.20 (0.01, 3.61) |
| Pneumoperitoneum‐related serious adverse events (helium vs carbon dioxide) | Peto OR 8.28 (0.86, 80.03) | Peto OR 9.19 (2.56, 33.01) | Peto OR 8.28 (0.86, 80.03) |
| Mortality (helium vs carbon dioxide) | No events | Peto OR 8.89 (1.94, 40.64) | Peto OR 0.12 (0.01, 2.07) |
Peto OR: Peto odds ratio, which was calculated for rare events (mortality, serious adverse events).
Discussion
Summary of main results
Nitrous oxide pneumoperitoneum versus carbon dioxide pneumoperitoneum
Three studies with 196 people contributed data to the primary outcomes of this review, and showed no evidence of differences between nitrous oxide pneumoperitoneum and carbon dioxide pneumoperitoneum in any of the primary outcomes, such as cardiopulmonary complications or surgical morbidity. There were no serious adverse events related to the use of nitrous oxide or carbon dioxide pneumoperitoneum. Two trials showed lower pain scores (a difference of about 1 cm on a VAS scale of 1 cm to 10 cm with lower numbers indicating less pain) in nitrous oxide pneumoperitoneum at various time points on the first postoperative day. However, we do not consider 1 cm on a VAS scale to be clinically significant ‐ as this difference is less than the minimum important clinical difference (Katz 2015; Parker 2013; Todd 1996).
The safety of nitrous oxide pneumoperitoneum is another major concern for patients, laparoscopic surgeons, and healthcare funders. Exposure to nitrous oxide may be harmful to laparoscopic surgeons because nitrous oxide has an anaesthetic effect. This review included three trials with 100 participants undergoing nitrous oxide pneumoperitoneum. Although none of the trials reported any serious adverse events in the nitrous oxide group, they did not have the statistical power to establish the safety of nitrous oxide pneumoperitoneum. The TSA showed an information size of more than 3700 participants is needed to reach firm evidence for primary outcomes. As this review included only three trials with 196 participants for this comparison, there is lack of evidence to support or refute the effectiveness or safety of nitrous oxide pneumoperitoneum compared with carbon dioxide pneumoperitoneum.
Helium pneumoperitoneum versus carbon dioxide pneumoperitoneum
Four studies with 144 people contributed data to the primary outcomes of this review, and showed no evidence of differences between helium pneumoperitoneum and carbon dioxide pneumoperitoneum in any of the primary outcomes, such as cardiopulmonary complications or surgical morbidity. There were three serious adverse events related to helium pneumoperitoneum. Although there were fewer cardiopulmonary changes in the helium pneumoperitoneum group, this did not translate into any clinical benefit.
In contrast to other gases used for creating a pneumoperitoneum, helium is an inert gas that has extremely low reactivity with other substances. The safety of helium pneumoperitoneum is also an important outcome for patients, laparoscopic surgeons, and healthcare funders. This review included four trials with 69 participants undergoing helium pneumoperitoneum. Three of the four trials reported a total of three serious adverse events related to pneumoperitoneum in the helium group. The adverse events were various subcutaneous emphysemas (e.g. scrotal, facial, and cervical emphysema). Although the meta‐analysis did not demonstrate any evidence of differences in pneumoperitoneum‐related serious adverse events between helium and carbon dioxide pneumoperitoneum, it also did not have the statistical power to establish the safety of helium pneumoperitoneum. The TSA showed an information size of more than 3600 participants needed to reach firm evidence for primary outcomes. As this review included only four trials with 144 participants in this comparison, there is lack of evidence to support or refute the effectiveness or safety of helium pneumoperitoneum compared with carbon dioxide pneumoperitoneum.
Room air pneumoperitoneum versus carbon dioxide pneumoperitoneum
One study with 146 people contributed data to the primary outcomes of this review, and showed no evidence of differences between room air pneumoperitoneum and carbon dioxide pneumoperitoneum in cardiopulmonary complications. There were no serious adverse events related to either room air or carbon dioxide pneumoperitoneum. The benefits for room air pneumoperitoneum were fewer total hospital costs (about USD380).
Hospital cost is an important outcome for healthcare funders. The trial showed decreased total hospital costs in the room air group; this could be due to a shorter duration of hospitalisation in the room air group (2.5 days) than in the carbon dioxide group (3.2 days), less analgesic consumption in the room air group, or both. In addition, the cost of carbon dioxide cylinders and carbon dioxide insufflators may be higher than the cost of room air insufflators.
The safety of room air pneumoperitoneum is another major concern for patients, laparoscopic surgeons, and healthcare funders because of the risk of air embolism (Ikechebelu 2005). This review included one trial with 70 participants undergoing room air pneumoperitoneum. Although the trial did not report any serious adverse events in the room air group, it did not have the statistical power to establish the safety of room air pneumoperitoneum. Accordingly, there is lack evidence to support or refute the effectiveness or safety of room air pneumoperitoneum compared with carbon dioxide pneumoperitoneum.
Overall completeness and applicability of evidence
Only 24 participants in two trials (12.6%) had high anaesthetic risk (ASA III or IV) (O'Boyle 2002; Tsereteli 2002). Of the remaining trials, three trials excluded participants with ASA III or IV (Aitola 1998; Bongard 1993; Sietses 2002); and four trials did not report ASA status (Gu 2015; Lipscomb 1993; Naude 1996; Neuhaus 2001). Thus, the results of this review are primarily applicable in ASA I or ASA II patients undergoing various laparoscopic abdominal surgeries under general anaesthesia. However, this review involved only 519 participants and lacked sufficient power to support or refute any gas for establishing pneumoperitoneum. Thus, further trials on this topic are urgently needed.
Quality of the evidence
Overall, the quality of the evidence was very low for the outcomes for which we could assess the quality of evidence (summary of findings Table for the main comparison; summary of findings Table 2; summary of findings Table 3).The major reason for downgrading the quality of evidence was serious or very serious risk of bias in the trials. One of the major sources of bias was lack of blinding. Lack of blinding might introduce detection bias and performance bias. Blinding of healthcare providers, participants, and outcome assessors can be achieved with appropriate study design. Another major source of bias was incomplete outcome data. A total of 13/269 (4.8%) participants were excluded from the analysis for various reasons in five trials (Aitola 1998; Bongard 1993; Naude 1996; O'Boyle 2002; Tsereteli 2002). Only two trials analysed the data on an intention‐to‐treat basis (Bongard 1993; O'Boyle 2002). In addition, sensitivity analysis by changing between worst‐case scenario analysis and best‐case scenario analysis for missing data revealed that some results changed in the helium pneumoperitoneum versus carbon dioxide pneumoperitoneum comparison. The third major source of bias was selective reporting (reporting bias) as not all trials reported the primary outcomes.
We further downgraded the quality of evidence due to indirectness of the outcomes in trials (e.g. surrogate outcomes such as cardiopulmonary changes). We also downgraded the quality of evidence due to imprecision; the review included only 519 participants in total, with the actual number included in specific outcomes being less than this since not all studies reported all the outcomes in each comparison. There was also clinical heterogeneity among the included trials. As a result of these factors, the confidence intervals for the majority of outcomes were wide, indicating that the estimates of effects obtained were based on an insufficient amount of information, reducing the quality of the evidence. The trials included under each comparison were too few to assess publication bias.
Potential biases in the review process
There were several unavoidable potential biases of note in the review process.
First, this review involved only 519 participants and therefore, was too underpowered to detect differences reliably for the rarer outcomes, such as serious adverse events (e.g. gas embolism, abdominal explosion).
Second, when we contacted the original investigators to request further information, there was no reply. Additionally, we were unable to explore publication bias because of the few trials included in each comparison.
Agreements and disagreements with other studies or reviews
The systematic review (a clinical practice guideline) by Neudecker and colleagues (Neudecker 2002) included two trials (Aitola 1998; Bongard 1993), which were included in this review. Neudecker and colleagues concluded that using insufflation gases such as nitrous oxide, helium, or argon appears to reduce pain, but they did not feel that this justified a general recommendation for the use of these gases. Our review agrees with their conclusion on nitrous oxide pneumoperitoneum, that the effectiveness or safety (or both) of nitrous oxide pneumoperitoneum have not been established. However, our review did not observe a reduction in pain with helium pneumoperitoneum. Furthermore, the authors of two trials comparing nitrous oxide pneumoperitoneum with carbon dioxide pneumoperitoneum (Aitola 1998; Tsereteli 2002) recommended nitrous oxide pneumoperitoneum for prolonged laparoscopic surgery in people with chronic cardiopulmonary diseases; our review did not agree with the conclusions of the trial authors. Due to the lack of evidence, we conclude that further assessment for ASA III or ASA IV patients is required.

Study flow diagram.

Risk of bias graph: review authors' judgements about each risk of bias item presented as percentages across all included studies.
Risk of bias summary: review authors' judgements about each risk of bias item for each included study.

Trial sequential analysis of nitrous oxide pneumoperitoneum versus carbon dioxide pneumoperitoneum for cardiopulmonary complications. Analysis was performed with an event rate of 2.9% (Pc) in the control group, a risk ratio reduction of 20%, alpha 5%, beta 20%, and observed diversity 0%. The accrued sample size was so small that the trial sequential boundaries could not be drawn. The cumulative Z‐curve did not cross the naive 5% statistical boundaries (red horizontal lines). The results showed that the observed diversity‐adjusted required information size was 3781 participants, corresponding to 3.7% of the total sample size in the included trials. Accordingly, the meta‐analysis did not support or refute an intervention effect as data were too few.

Trial sequential analysis of nitrous oxide pneumoperitoneum versus carbon dioxide pneumoperitoneum for surgical morbidity. Analysis was performed with an event rate of 2.8% (Pc) in the control group, a risk ratio reduction of 20%, alpha 5%, beta 20%, and observed diversity 0%. The cumulative Z‐curve did not cross the naive 5% statistical boundaries (red horizontal lines). The results showed that the observed diversity adjusted required information size was 3919 participants, corresponding to 3.6% of the total sample size in the included trials. Accordingly, the meta‐analysis did not support or refute an intervention effect as data were too few.

Trial sequential analysis of helium pneumoperitoneum versus carbon dioxide pneumoperitoneum for cardiopulmonary complications. Analysis was performed with an event rate of 3.0% (Pc) in the control group, a risk ratio reduction of 20%, alpha 5%, beta 20%, and observed diversity 0%. The cumulative Z‐curve did not cross the naive 5% statistical boundaries (red horizontal lines). The results showed that the observed diversity adjusted required information size was 3651 participants, corresponding to 3.5% of the total sample size in the included trials. Accordingly, the meta‐analysis did not support or refute an intervention effect as data were too few.

Trial sequential analysis of helium pneumoperitoneum versus carbon dioxide pneumoperitoneum for serious adverse events. Analysis was performed with an event rate of 2.3% (Pc) in the control group, a risk ratio reduction of 20%, alpha 5%, beta 20%, and observed diversity 0%. The cumulative Z‐curve did not cross the naive 5% statistical boundaries (red horizontal lines). The results showed that the observed diversity adjusted required information size was 4793 participants, corresponding to 2.7% of the total sample size in the included trials. Accordingly, the meta‐analysis did not support or refute an intervention effect as data were too few.

Comparison 1 Nitrous oxide pneumoperitoneum versus carbon dioxide pneumoperitoneum, Outcome 1 Cardiopulmonary complications.

Comparison 1 Nitrous oxide pneumoperitoneum versus carbon dioxide pneumoperitoneum, Outcome 2 Procedure‐related general complications.
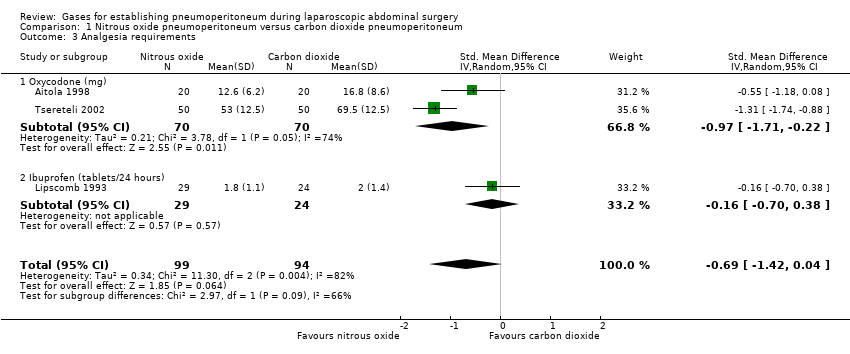
Comparison 1 Nitrous oxide pneumoperitoneum versus carbon dioxide pneumoperitoneum, Outcome 3 Analgesia requirements.

Comparison 1 Nitrous oxide pneumoperitoneum versus carbon dioxide pneumoperitoneum, Outcome 4 Cardiopulmonary changes.

Comparison 2 Helium pneumoperitoneum versus carbon dioxide pneumoperitoneum, Outcome 1 Cardiopulmonary complications.

Comparison 2 Helium pneumoperitoneum versus carbon dioxide pneumoperitoneum, Outcome 2 Pneumoperitoneum‐related serious adverse events.

Comparison 2 Helium pneumoperitoneum versus carbon dioxide pneumoperitoneum, Outcome 3 Pain scores (cm) (first postoperative day).

Comparison 2 Helium pneumoperitoneum versus carbon dioxide pneumoperitoneum, Outcome 4 Analgesia requirements (morphine mg).

Comparison 2 Helium pneumoperitoneum versus carbon dioxide pneumoperitoneum, Outcome 5 Number of participants requiring analgesia.

Comparison 2 Helium pneumoperitoneum versus carbon dioxide pneumoperitoneum, Outcome 6 Cardiopulmonary parameters.

Comparison 3 Room air pneumoperitoneum versus carbon dioxide pneumoperitoneum, Outcome 1 Cardiopulmonary complications.

Comparison 3 Room air pneumoperitoneum versus carbon dioxide pneumoperitoneum, Outcome 2 Pneumoperitoneum‐related serious adverse events.

Comparison 3 Room air pneumoperitoneum versus carbon dioxide pneumoperitoneum, Outcome 3 Pain scores (cm) (first postoperative day).

Comparison 3 Room air pneumoperitoneum versus carbon dioxide pneumoperitoneum, Outcome 4 Hospital costs (CNY).

Comparison 3 Room air pneumoperitoneum versus carbon dioxide pneumoperitoneum, Outcome 5 Cardiopulmonary parameters.
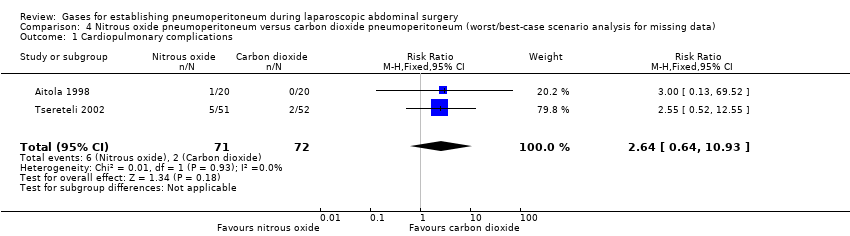
Comparison 4 Nitrous oxide pneumoperitoneum versus carbon dioxide pneumoperitoneum (worst/best‐case scenario analysis for missing data), Outcome 1 Cardiopulmonary complications.
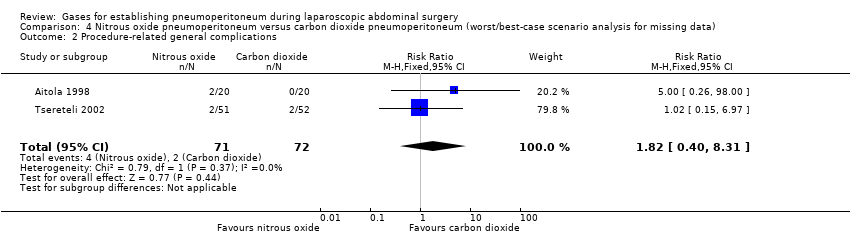
Comparison 4 Nitrous oxide pneumoperitoneum versus carbon dioxide pneumoperitoneum (worst/best‐case scenario analysis for missing data), Outcome 2 Procedure‐related general complications.
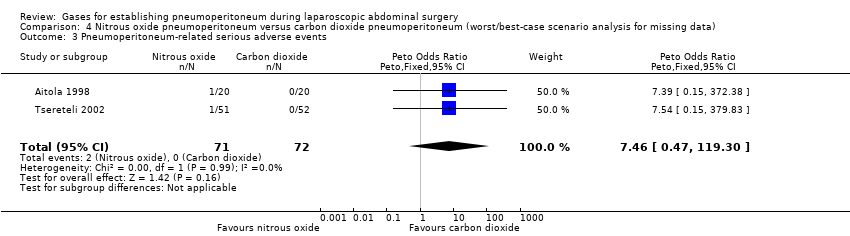
Comparison 4 Nitrous oxide pneumoperitoneum versus carbon dioxide pneumoperitoneum (worst/best‐case scenario analysis for missing data), Outcome 3 Pneumoperitoneum‐related serious adverse events.
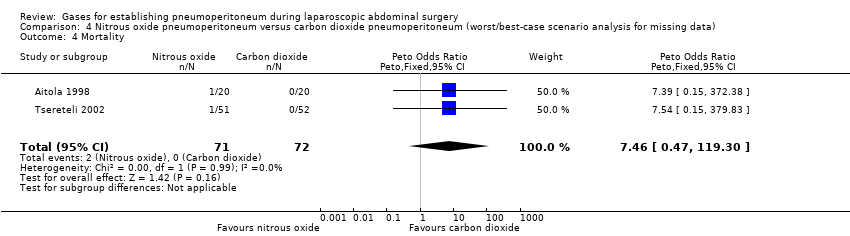
Comparison 4 Nitrous oxide pneumoperitoneum versus carbon dioxide pneumoperitoneum (worst/best‐case scenario analysis for missing data), Outcome 4 Mortality.
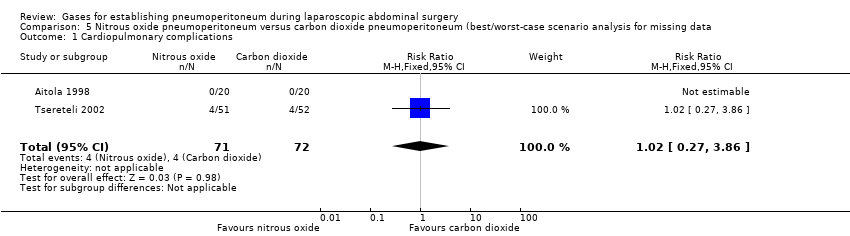
Comparison 5 Nitrous oxide pneumoperitoneum versus carbon dioxide pneumoperitoneum (best/worst‐case scenario analysis for missing data, Outcome 1 Cardiopulmonary complications.
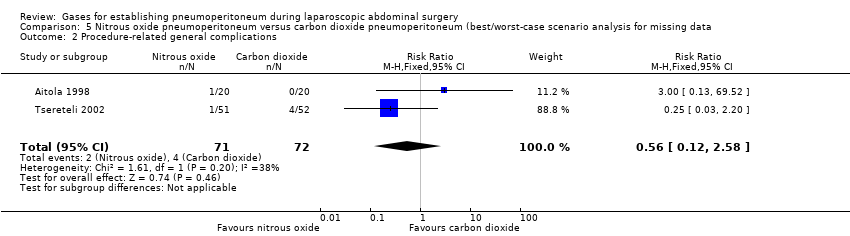
Comparison 5 Nitrous oxide pneumoperitoneum versus carbon dioxide pneumoperitoneum (best/worst‐case scenario analysis for missing data, Outcome 2 Procedure‐related general complications.

Comparison 5 Nitrous oxide pneumoperitoneum versus carbon dioxide pneumoperitoneum (best/worst‐case scenario analysis for missing data, Outcome 3 Pneumoperitoneum‐related serious adverse events.

Comparison 5 Nitrous oxide pneumoperitoneum versus carbon dioxide pneumoperitoneum (best/worst‐case scenario analysis for missing data, Outcome 4 Mortality.

Comparison 6 Helium pneumoperitoneum versus carbon dioxide pneumoperitoneum (worst/best‐case scenario analysis for missing data), Outcome 1 Cardiopulmonary complications.

Comparison 6 Helium pneumoperitoneum versus carbon dioxide pneumoperitoneum (worst/best‐case scenario analysis for missing data), Outcome 2 Procedure‐related general complications.

Comparison 6 Helium pneumoperitoneum versus carbon dioxide pneumoperitoneum (worst/best‐case scenario analysis for missing data), Outcome 3 Pneumoperitoneum‐related serious adverse events.

Comparison 6 Helium pneumoperitoneum versus carbon dioxide pneumoperitoneum (worst/best‐case scenario analysis for missing data), Outcome 4 Mortality.

Comparison 7 Helium pneumoperitoneum versus carbon dioxide pneumoperitoneum (best/worst‐case scenario analysis for missing data, Outcome 1 Cardiopulmonary complications.
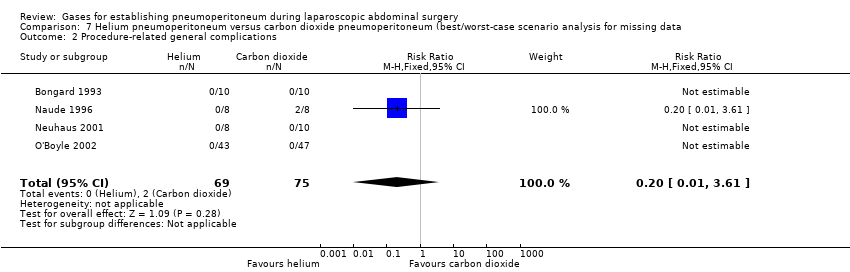
Comparison 7 Helium pneumoperitoneum versus carbon dioxide pneumoperitoneum (best/worst‐case scenario analysis for missing data, Outcome 2 Procedure‐related general complications.

Comparison 7 Helium pneumoperitoneum versus carbon dioxide pneumoperitoneum (best/worst‐case scenario analysis for missing data, Outcome 3 Pneumoperitoneum‐related serious adverse events.

Comparison 7 Helium pneumoperitoneum versus carbon dioxide pneumoperitoneum (best/worst‐case scenario analysis for missing data, Outcome 4 Mortality.
| Nitrous oxide versus carbon dioxide for establishing pneumoperitoneum during laparoscopic abdominal surgery | ||||||
| Patient or population: people undergoing laparoscopic general abdominal or gynaecological pelvic surgery under general anaesthesia Setting: secondary and tertiary care Intervention: nitrous oxide pneumoperitoneum Comparison: carbon dioxide pneumoperitoneum | ||||||
| Outcomes | Anticipated absolute effects* (95% CI) | Relative effect | No of participants | Quality of the evidence | Comments | |
| Risk with carbon dioxide pneumoperitoneum | Risk with nitrous oxide pneumoperitoneum | |||||
| Cardiopulmonary complications Follow‐up: 0 to 1 month | 29 per 1000 | 57 per 1000 | RR 2.00 | 140 | ⊕⊝⊝⊝ | Trial sequential analysis showed a diversity‐adjusted required information size of 3781 participants to support or refute nitrous oxide pneumoperitoneum. |
| Procedure‐related general complications Follow‐up: 0 to 1 month | 28 per 1000 | 28 per 1000 | RR 1.01 | 143 | ⊕⊝⊝⊝ | Trial sequential analysis showed a diversity‐adjusted required information size of 3919 participants to support or refute nitrous oxide pneumoperitoneum. |
| Pneumoperitoneum‐related serious adverse events Follow‐up: 0 to 1 month | See comment | See comment | Not estimable | 196 | ⊕⊕⊝⊝ | None of the studies reported any pneumoperitoneum‐related serious adverse events. |
| Mortality Follow‐up: 0 to 1 month | See comment | See comment | Not estimable | 196 | ⊕⊕⊝⊝ | None of the studies reported any deaths. |
| Quality of life | None of the studies reported quality of life. | |||||
| Pain scores (first postoperative day) VAS, lower score indicates less pain. Follow‐up: 1 day | See comment | See comment | Not estimable | 140 | ⊕⊝⊝⊝ | Neither trials reported the standard deviation for pain scores on the VAS scale. Substantial clinical heterogeneity in between the 2 studies. |
| Analgesia requirements Follow‐up: 1 week | The mean analgesia requirement in the carbon dioxide pneumoperitoneum was 54.4 mg of oxycodone and 2.0 tablets/24 hours of ibuprofen | The mean analgesia requirement in the nitrous oxide pneumoperitoneum was 0.69 standard deviations lower | SMD ‐0.69 | 193 | ⊕⊝⊝⊝ | ‐ |
| Hospital costs | None of the studies reported costs. | |||||
| *The basis for the assumed risk is the mean comparison group proportion in the studies. The risk in the intervention group (and its 95% confidence interval) is based on the assumed risk in the comparison group and the relative effect of the intervention (and its 95% CI). CI: confidence interval; RR: risk ratio; SMD: standardised mean difference; VAS: visual analogue scale. | ||||||
| GRADE Working Group grades of evidence | ||||||
| 1 Downgraded two levels for very serious risk of bias. 2 Downgraded one level for serious imprecision (the confidence interval of risk ratio overlapped 0.75 and 1.25, and small sample size). 3 Downgraded one level for serious imprecision (small sample size). 4 Downgraded one level for serious risk of bias. 5 Downgraded one level for indirectness. 6 Downgraded one level for severe inconsistency (substantial heterogeneity as indicated by the I2 statistic). | ||||||
| Helium versus carbon dioxide for establishing pneumoperitoneum during laparoscopic abdominal surgery | ||||||
| Patient or population: people undergoing laparoscopic general abdominal or gynaecological pelvic surgery under general anaesthesia Setting: secondary and tertiary care Intervention: helium pneumoperitoneum Comparison: carbon dioxide pneumoperitoneum | ||||||
| Outcomes | Anticipated absolute effects* (95% CI) | Relative effect | No of participants | Quality of the evidence | Comments | |
| Risk with carbon dioxide pneumoperitoneum | Risk with helium pneumoperitoneum | |||||
| Cardiopulmonary complications Follow‐up: 0 to 1 month | 30 per 1000 | 44 per 1000 | RR 1.46 | 128 | ⊕⊝⊝⊝ | Trial sequential analysis showed a diversity‐adjusted required information size of 3651 participants to support or refute helium pneumoperitoneum. |
| Procedure‐related general complications Follow‐up: 0 to 1 month | See comment | See comment | Not estimable | 144 | ⊕⊝⊝⊝ Very low3,4 | None of the studies reported any significant procedure‐related general complications in either group. |
| Pneumoperitoneum‐related serious adverse events Follow‐up: 0 to 1 month | 0 per 1000 | 44 per 1000 | Peto OR 8.28 | 128 | ⊕⊝⊝⊝ | Trial sequential analysis showed a diversity‐adjusted required information size of 4793 participants to support or refute helium pneumoperitoneum. |
| Mortality Follow‐up: 0 to 1 month | See comment | See comment | Not estimable | 144 | ⊕⊕⊝⊝ | None of the studies reported any deaths. |
| Quality of life | None of the studies reported quality of life. | |||||
| Pain scores (first postoperative day) Visual analogue scale, lower score indicates less pain. Follow‐up: 1 day | The mean pain scores (first postoperative day) in the carbon dioxide pneumoperitoneum was 3.01 cm | The mean pain scores (first postoperative day) in the helium pneumoperitoneum was | MD 0.49 (‐0.28 to 1.26) | 108 | ⊕⊝⊝⊝ | ‐ |
| Analgesia requirements (morphine mg) Follow‐up: 2 days | The mean analgesia requirements (morphine) in the carbon dioxide pneumoperitoneum was 36.6 mg | The mean analgesia requirements (morphine) in the helium pneumoperitoneum was 12 mg higher | MD 12.00 (4.44 to 19.56) | 90 | ⊕⊝⊝⊝ | ‐ |
| Hospital costs | None of the studies reported costs. | |||||
| *The basis for the assumed risk is the mean comparison group proportion in the studies. The risk in the intervention group (and its 95% confidence interval) is based on the assumed risk in the comparison group and the relative effect of the intervention (and its 95% CI). CI: confidence interval; MD: mean difference; OR: odds ratio; RR: risk ratio. | ||||||
| GRADE Working Group grades of evidence | ||||||
| 1 Downgraded one level for serious risk of bias. 2 Downgraded two levels for very serious imprecision (the confidence interval of risk ratio overlapped 0.75 and 1.25, and small sample size). 3 Downgraded one level for serious imprecision (small sample size). 4 Downgraded two levels for very serious risk of bias. 5 Downgraded one level for indirectness. | ||||||
| Room air versus carbon dioxide for establishing pneumoperitoneum during laparoscopic abdominal surgery | ||||||
| Patient or population: people undergoing laparoscopic general abdominal or gynaecological pelvic surgery under general anaesthesia Setting: secondary and tertiary care Intervention: room air pneumoperitoneum Comparison: carbon dioxide pneumoperitoneum | ||||||
| Outcomes | Anticipated absolute effects* (95% CI) | Relative effect | No of participants | Quality of the evidence | Comments | |
| Risk with carbon dioxide pneumoperitoneum | Risk with room air pneumoperitoneum | |||||
| Cardiopulmonary complications Follow‐up: 1 month | See comment | See comment | Not estimable | 146 | ⊕⊝⊝⊝ | Trial did not report any cardiopulmonary complications. |
| Procedure‐related general complications | The study did not report procedure‐related general complications. | |||||
| Pneumoperitoneum‐related serious adverse events Follow‐up: 1 month | See comment | See comment | Not estimable | 146 | ⊕⊝⊝⊝ | Trial did not report any pneumoperitoneum‐related serious adverse events. |
| Mortality Follow‐up: 1 month | See comment | See comment | Not estimable | 146 | ⊕⊕⊝⊝ | The study did not report any deaths. |
| Quality of life | The study did not report quality of life. | |||||
| Pain scores (first postoperative day) Visual analogue scale, lower score indicates less pain. Follow‐up: 1 day | The mean pain scores (first postoperative day) in the carbon dioxide pneumoperitoneum was 2.60 cm | The mean pain scores (first postoperative day) in the room air pneumoperitoneum was | MD ‐0.80 (‐1.15 to ‐0.45) | 146 | ⊕⊝⊝⊝ | ‐ |
| Analgesia requirements | The study did not report analgesia requirements. | |||||
| Hospital costs (CNY) Follow‐up: 1 month | The mean hospital costs in the carbon dioxide pneumoperitoneum was CNY12,012.00 | The mean hospital costs in the room air pneumoperitoneum was CNY2667.00 lower | MD ‐2667.00 (‐3275.68 to ‐2058.32) | 146 | ⊕⊝⊝⊝ | ‐ |
| *The basis for the assumed risk is the mean comparison group proportion in the studies. The risk in the intervention group (and its 95% confidence interval) is based on the assumed risk in the comparison group and the relative effect of the intervention (and its 95% CI). CI: confidence interval; MD: mean difference. | ||||||
| GRADE Working Group grades of evidence | ||||||
| 1 Downgraded two levels for very serious risk of bias. 2 Downgraded one level for serious imprecision (small sample size). 3 Downgraded one level for serious risk of bias. | ||||||
| Changing between worst‐case scenario analysis and best‐case scenario analysis for missing data | |||
| Outcomes | Risk ratio (95% CI) | ||
| Main analysis | Worst/best‐case | Best/worst‐case | |
| Cardiopulmonary complications (nitrous oxide vs carbon dioxide) | 2.00 (0.38, 10.43) | 2.64 (0.64, 10.93) | 1.02 (0.27, 3.86) |
| Procedure‐related general complications/surgical morbidity (nitrous oxide vs carbon dioxide) | 1.01 (0.18, 5.71) | 1.82 (0.40, 8.31) | 0.56 (0.12, 2.58) |
| Pneumoperitoneum‐related serious adverse events (nitrous oxide vs carbon dioxide) | No events | Peto OR 7.46 (0.47, 119.30) | Peto OR 0.14 (0.01, 2.19) |
| Mortality (nitrous oxide vs carbon dioxide) | No events | Peto OR 7.46 (0.47, 119.30) | Peto OR 0.14 (0.01, 2.19) |
| Cardiopulmonary complications (helium vs carbon dioxide) | 1.46 (0.35, 6.12) | 4.58 (1.21, 17.36) | 1.46 (0.35, 6.12) |
| Procedure‐related general complications/surgical morbidity (helium vs carbon dioxide) | No events | 8.47 (1.11, 64.60) | 0.20 (0.01, 3.61) |
| Pneumoperitoneum‐related serious adverse events (helium vs carbon dioxide) | Peto OR 8.28 (0.86, 80.03) | Peto OR 9.19 (2.56, 33.01) | Peto OR 8.28 (0.86, 80.03) |
| Mortality (helium vs carbon dioxide) | No events | Peto OR 8.89 (1.94, 40.64) | Peto OR 0.12 (0.01, 2.07) |
| Peto OR: Peto odds ratio, which was calculated for rare events (mortality, serious adverse events). | |||
| Outcome or subgroup title | No. of studies | No. of participants | Statistical method | Effect size |
| 1 Cardiopulmonary complications Show forest plot | 2 | 140 | Risk Ratio (M‐H, Fixed, 95% CI) | 2.0 [0.38, 10.43] |
| 2 Procedure‐related general complications Show forest plot | 2 | 143 | Risk Ratio (M‐H, Fixed, 95% CI) | 1.01 [0.18, 5.71] |
| 3 Analgesia requirements Show forest plot | 3 | 193 | Std. Mean Difference (IV, Random, 95% CI) | ‐0.69 [‐1.42, 0.04] |
| 3.1 Oxycodone (mg) | 2 | 140 | Std. Mean Difference (IV, Random, 95% CI) | ‐0.97 [‐1.71, ‐0.22] |
| 3.2 Ibuprofen (tablets/24 hours) | 1 | 53 | Std. Mean Difference (IV, Random, 95% CI) | ‐0.16 [‐0.70, 0.38] |
| 4 Cardiopulmonary changes Show forest plot | 1 | Mean Difference (IV, Fixed, 95% CI) | Subtotals only | |
| 4.1 Heart rate (beats/minute) | 1 | 100 | Mean Difference (IV, Fixed, 95% CI) | ‐0.60 [‐4.13, 2.93] |
| 4.2 Mean arterial pressure (mmHg) | 1 | 100 | Mean Difference (IV, Fixed, 95% CI) | ‐3.80 [‐7.90, 0.30] |
| 4.3 Oxygen saturation (%) | 1 | 100 | Mean Difference (IV, Fixed, 95% CI) | 0.0 [‐0.39, 0.39] |
| 4.4 Peak airway pressure (cm H2O) | 1 | 100 | Mean Difference (IV, Fixed, 95% CI) | ‐0.30 [‐2.17, 1.57] |
| Outcome or subgroup title | No. of studies | No. of participants | Statistical method | Effect size |
| 1 Cardiopulmonary complications Show forest plot | 3 | 128 | Risk Ratio (M‐H, Fixed, 95% CI) | 1.46 [0.35, 6.12] |
| 2 Pneumoperitoneum‐related serious adverse events Show forest plot | 3 | 128 | Peto Odds Ratio (Peto, Fixed, 95% CI) | 8.28 [0.86, 80.03] |
| 3 Pain scores (cm) (first postoperative day) Show forest plot | 2 | 108 | Mean Difference (IV, Fixed, 95% CI) | 0.49 [‐0.28, 1.26] |
| 4 Analgesia requirements (morphine mg) Show forest plot | 1 | 90 | Mean Difference (IV, Fixed, 95% CI) | 12.0 [4.44, 19.56] |
| 5 Number of participants requiring analgesia Show forest plot | 1 | 18 | Risk Ratio (M‐H, Fixed, 95% CI) | 0.42 [0.17, 1.04] |
| 6 Cardiopulmonary parameters Show forest plot | 3 | Mean Difference (IV, Fixed, 95% CI) | Subtotals only | |
| 6.1 Blood pH (start) | 2 | 34 | Mean Difference (IV, Fixed, 95% CI) | 0.01 [‐0.01, 0.04] |
| 6.2 Blood pH (middle) | 3 | 52 | Mean Difference (IV, Fixed, 95% CI) | ‐0.00 [‐0.03, 0.02] |
| 6.3 Blood pH (end) | 2 | 34 | Mean Difference (IV, Fixed, 95% CI) | 0.10 [0.06, 0.14] |
| 6.4 Partial pressure of carbon dioxide (mmHg) (start) | 2 | 34 | Mean Difference (IV, Fixed, 95% CI) | 0.31 [‐1.79, 2.40] |
| 6.5 Partial pressure of carbon dioxide (mmHg) (middle) | 3 | 52 | Mean Difference (IV, Fixed, 95% CI) | ‐0.84 [‐3.70, 2.02] |
| 6.6 Partial pressure of carbon dioxide (mmHg) (end) | 2 | 34 | Mean Difference (IV, Fixed, 95% CI) | ‐12.78 [‐16.78, ‐8.77] |
| Outcome or subgroup title | No. of studies | No. of participants | Statistical method | Effect size |
| 1 Cardiopulmonary complications Show forest plot | 1 | 146 | Risk Ratio (M‐H, Fixed, 95% CI) | 0.0 [0.0, 0.0] |
| 2 Pneumoperitoneum‐related serious adverse events Show forest plot | 1 | 146 | Peto Odds Ratio (Peto, Fixed, 95% CI) | 0.0 [0.0, 0.0] |
| 3 Pain scores (cm) (first postoperative day) Show forest plot | 1 | 146 | Mean Difference (IV, Fixed, 95% CI) | ‐0.8 [‐1.15, ‐0.45] |
| 4 Hospital costs (CNY) Show forest plot | 1 | 146 | Mean Difference (IV, Fixed, 95% CI) | ‐2667.0 [‐3275.68, ‐2058.32] |
| 5 Cardiopulmonary parameters Show forest plot | 1 | Mean Difference (IV, Fixed, 95% CI) | Subtotals only | |
| 5.1 Heart rate (beats/minute) (start) | 1 | 146 | Mean Difference (IV, Fixed, 95% CI) | ‐0.10 [‐3.11, 2.91] |
| 5.2 Heart rate (beats/minute) (middle) | 1 | 146 | Mean Difference (IV, Fixed, 95% CI) | ‐7.30 [‐9.78, ‐4.82] |
| 5.3 Heart rate (beats/minute) (end) | 1 | 146 | Mean Difference (IV, Fixed, 95% CI) | ‐8.70 [‐11.72, ‐5.68] |
| 5.4 Blood systolic pressure (mmHg) (start) | 1 | 146 | Mean Difference (IV, Fixed, 95% CI) | ‐1.0 [‐5.12, 3.12] |
| 5.5 Blood systolic pressure (mmHg) (middle) | 1 | 146 | Mean Difference (IV, Fixed, 95% CI) | 2.80 [‐0.44, 6.04] |
| 5.6 Blood systolic pressure (mmHg) (end) | 1 | 146 | Mean Difference (IV, Fixed, 95% CI) | ‐2.0 [‐5.42, 1.42] |
| 5.7 Partial pressure of carbon dioxide (mmHg) (start) | 1 | 146 | Mean Difference (IV, Fixed, 95% CI) | ‐0.20 [‐1.39, 0.99] |
| 5.8 Partial pressure of carbon dioxide (mmHg) (middle) | 1 | 146 | Mean Difference (IV, Fixed, 95% CI) | ‐0.30 [‐1.37, 0.77] |
| 5.9 Partial pressure of carbon dioxide (mmHg) (end) | 1 | 146 | Mean Difference (IV, Fixed, 95% CI) | 0.10 [‐1.43, 1.63] |
| Outcome or subgroup title | No. of studies | No. of participants | Statistical method | Effect size |
| 1 Cardiopulmonary complications Show forest plot | 2 | 143 | Risk Ratio (M‐H, Fixed, 95% CI) | 2.64 [0.64, 10.93] |
| 2 Procedure‐related general complications Show forest plot | 2 | 143 | Risk Ratio (M‐H, Fixed, 95% CI) | 1.82 [0.40, 8.31] |
| 3 Pneumoperitoneum‐related serious adverse events Show forest plot | 2 | 143 | Peto Odds Ratio (Peto, Fixed, 95% CI) | 7.46 [0.47, 119.30] |
| 4 Mortality Show forest plot | 2 | 143 | Peto Odds Ratio (Peto, Fixed, 95% CI) | 7.46 [0.47, 119.30] |
| Outcome or subgroup title | No. of studies | No. of participants | Statistical method | Effect size |
| 1 Cardiopulmonary complications Show forest plot | 2 | 143 | Risk Ratio (M‐H, Fixed, 95% CI) | 1.02 [0.27, 3.86] |
| 2 Procedure‐related general complications Show forest plot | 2 | 143 | Risk Ratio (M‐H, Fixed, 95% CI) | 0.56 [0.12, 2.58] |
| 3 Pneumoperitoneum‐related serious adverse events Show forest plot | 2 | 143 | Peto Odds Ratio (Peto, Fixed, 95% CI) | 0.14 [0.01, 2.19] |
| 4 Mortality Show forest plot | 2 | 143 | Peto Odds Ratio (Peto, Fixed, 95% CI) | 0.14 [0.01, 2.19] |
| Outcome or subgroup title | No. of studies | No. of participants | Statistical method | Effect size |
| 1 Cardiopulmonary complications Show forest plot | 3 | 128 | Risk Ratio (M‐H, Fixed, 95% CI) | 4.58 [1.21, 17.36] |
| 2 Procedure‐related general complications Show forest plot | 4 | 144 | Risk Ratio (M‐H, Fixed, 95% CI) | 8.47 [1.11, 64.60] |
| 3 Pneumoperitoneum‐related serious adverse events Show forest plot | 3 | 128 | Peto Odds Ratio (Peto, Fixed, 95% CI) | 9.19 [2.56, 33.01] |
| 4 Mortality Show forest plot | 4 | 144 | Peto Odds Ratio (Peto, Fixed, 95% CI) | 8.89 [1.94, 40.64] |
| Outcome or subgroup title | No. of studies | No. of participants | Statistical method | Effect size |
| 1 Cardiopulmonary complications Show forest plot | 3 | 128 | Risk Ratio (M‐H, Fixed, 95% CI) | 1.46 [0.35, 6.12] |
| 2 Procedure‐related general complications Show forest plot | 4 | 144 | Risk Ratio (M‐H, Fixed, 95% CI) | 0.2 [0.01, 3.61] |
| 3 Pneumoperitoneum‐related serious adverse events Show forest plot | 3 | 128 | Peto Odds Ratio (Peto, Fixed, 95% CI) | 8.28 [0.86, 80.03] |
| 4 Mortality Show forest plot | 4 | 144 | Peto Odds Ratio (Peto, Fixed, 95% CI) | 0.12 [0.01, 2.07] |