Bronchoscopy‐guided antimicrobial therapy for cystic fibrosis
Información
- DOI:
- https://doi.org/10.1002/14651858.CD009530.pub3Copiar DOI

- Base de datos:
-
- Cochrane Database of Systematic Reviews
- Versión publicada:
-
- 21 enero 2016see what's new
- Tipo:
-
- Intervention
- Etapa:
-
- Review
- Grupo Editorial Cochrane:
-
Grupo Cochrane de Fibrosis quística y enfermedades genéticas
- Copyright:
-
- Copyright © 2016 The Cochrane Collaboration. Published by John Wiley & Sons, Ltd.
Cifras del artículo
Altmetric:
Citado por:
Autores
Contributions of authors
| Roles and responsibilities | |
| TASK | WHO WILL UNDERTAKE THE TASK? |
| Protocol stage: draft the protocol | KJ, CW, AS |
| Review stage: select which studies to include (2 + 1 arbiter) | KJ, CW, AS |
| Review stage: extract data from studies (2 people) | KJ, CW |
| Review stage: enter data into RevMan | KJ |
| Review stage: carry out the analysis | KJ |
| Review stage: interpret the analysis | KJ, CW, AS |
| Review stage: draft the final review | KJ, CW, AS |
| Update stage: update the review | KJ, CW, AS |
Sources of support
Internal sources
-
No sources of support supplied
External sources
-
National Institute for Health Research, UK.
This systematic review was supported by the National Institute for Health Research, via Cochrane Infrastructure funding to the Cochrane Cystic Fibrosis and Genetic Disorders Group.
Declarations of interest
Kamini Jain declares no known potential conflict of interest.
Claire Wainwright is the lead investigator of the Australian Cystic Fibrosis Bronchoalveolar Lavage (ACFBAL) study, which is included in this review. Novartis Pharmaceuticals supplied TOBI© for the study. Dr Wainwright has received research grants from the NHMRC, GlaxoSmithKline and Novo Nordisk Pharmaceuticals P/L. Her institution has received income on a per patient basis from pharmaceutical studies (Vertex Pharmaceuticals Inc., Boehringer‐Ingelheim & Ablynx NV). Dr Wainwright is a consultant on the Vertex Physician Pediatric CF Advisory Board and the Vertex Innovation Awards (VIA) Grants Committee and is currently on the board of the Thoracic Society Australia and New Zealand and the International Advisory Board Vertex Pharmaceuticals P/L. She has received travel and accomodation expenses from Vertex Pharmaceuticals Inc and Novartis Pharmaceuticals. Payments for all items listed above have been made into an institutional consultancy fund account.
Alan R Smyth declares relevant activities of membership of a REMPEX steering committee, consultancies for Novartis and Forest, and lectures paid for by Chiesi, Gilead and Forest.
Acknowledgements
We would like to thank Mrs Nikki Jahnke, the Assistant Managing Editor of Cochrane Cystic Fibrosis and Genetic Disorders Group for her assistance in the development of this review.
Version history
| Published | Title | Stage | Authors | Version |
| 2024 May 03 | Bronchoscopy‐guided antimicrobial therapy for cystic fibrosis | Review | Kamini Jain, Claire E Wainwright, Alan R Smyth | |
| 2018 Sep 17 | Bronchoscopy‐guided antimicrobial therapy for cystic fibrosis | Review | Kamini Jain, Claire Wainwright, Alan R Smyth | |
| 2016 Jan 21 | Bronchoscopy‐guided antimicrobial therapy for cystic fibrosis | Review | Kamini Jain, Claire Wainwright, Alan R Smyth | |
| 2013 Dec 23 | Bronchoscopy‐guided antimicrobial therapy for cystic fibrosis | Review | Kamini Jain, Claire Wainwright, Alan R Smyth | |
| 2011 Dec 07 | Bronchoscopy‐guided antimicrobial therapy for cystic fibrosis | Protocol | Kamini Jain, Claire Wainwright, Alan R Smyth | |
Differences between protocol and review
In line with latest Cochrane guidance, we have added a summary of findings table to the 2015 update.
Keywords
MeSH
Medical Subject Headings (MeSH) Keywords
Medical Subject Headings Check Words
Child, Preschool; Humans; Infant;
PICO

Study flow diagram.

Risk of bias graph: review authors' judgements about each risk of bias item presented as percentages across all included studies.

Comparison 1 BAL‐directed therapy versus standard therapy, Outcome 1 Z score FEV1.

Comparison 1 BAL‐directed therapy versus standard therapy, Outcome 2 Z score FVC.
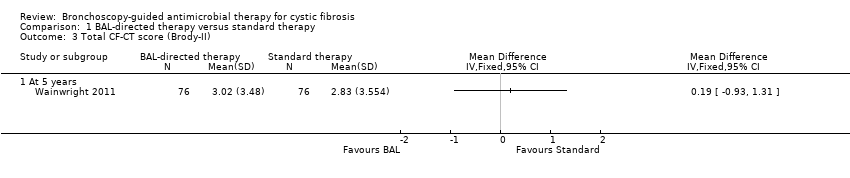
Comparison 1 BAL‐directed therapy versus standard therapy, Outcome 3 Total CF‐CT score (Brody‐II).

Comparison 1 BAL‐directed therapy versus standard therapy, Outcome 4 Individual CF‐CT scores (at 5 years).

Comparison 1 BAL‐directed therapy versus standard therapy, Outcome 5 Z score for weight.
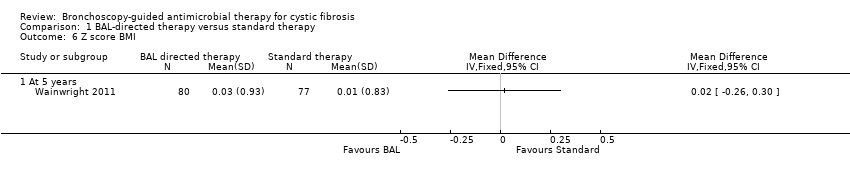
Comparison 1 BAL‐directed therapy versus standard therapy, Outcome 6 Z score BMI.

Comparison 1 BAL‐directed therapy versus standard therapy, Outcome 7 Positive P.aeruginosa isolates per patient per year.

Comparison 1 BAL‐directed therapy versus standard therapy, Outcome 8 Prevalence of P. aeruginosa in BAL at 5 years age.

Comparison 1 BAL‐directed therapy versus standard therapy, Outcome 9 Sensitivity analysis ‐ Prevalence of P. aeruginosa in BAL at 5 years age (40% vs 5%).

Comparison 1 BAL‐directed therapy versus standard therapy, Outcome 10 Sensitivity analysis ‐ Prevalence of P. aeruginosa in BAL at 5 years age (5% vs 40%).

Comparison 1 BAL‐directed therapy versus standard therapy, Outcome 11 Clearance of P.aeruginosa after 1 or 2 eradication treatments.

Comparison 1 BAL‐directed therapy versus standard therapy, Outcome 12 Age at first acquisition of P. aeruginosa infection.

Comparison 1 BAL‐directed therapy versus standard therapy, Outcome 13 Number of hospital admissions per patient per year.

Comparison 1 BAL‐directed therapy versus standard therapy, Outcome 14 Number of hospitalizations per person per year due to non‐P. aeruginosa exacerbations.

Comparison 1 BAL‐directed therapy versus standard therapy, Outcome 15 Duration of hospital admissions due to non‐P.aeruginosa exacerbations.

Comparison 1 BAL‐directed therapy versus standard therapy, Outcome 16 Days as hospital inpatient per patient per year.

Comparison 1 BAL‐directed therapy versus standard therapy, Outcome 17 Total cost of care per participant (Australian Dollars).

Comparison 1 BAL‐directed therapy versus standard therapy, Outcome 18 Mean hospital admissions cost per patient.

Comparison 1 BAL‐directed therapy versus standard therapy, Outcome 19 Number of pulmonary exacerbations (requiring oral or intravenous antibiotics) per patient per year.
| BAL‐directed therapy versus standard therapy for cystic fibrosis | ||||||
| Patient or population: people with pulmonary exacerbations in cystic fibrosis | ||||||
| Outcomes | Illustrative comparative risks* (95% CI) | Relative effect | No of Participants | Quality of the evidence | Comments | |
| Assumed risk | Corresponding risk | |||||
| Standard therapy | BAL‐directed therapy | |||||
| Z score FEV1 | The mean z score for FEV1 in the standard therapy group was ‐0.41 (SD 1.23). | The mean z score FEV1 in the intervention group ‐0.56 (SD 1.25) that was 0.15 lower (0.54 lower to 0.24 higher) than the standard therapy group. | 157 | ⊕⊕⊕⊝ | FEV1 and FVC were measured using standard spirometer after bronchodilatation. The mean difference between the two groups represents the difference in the mean z scores for each parameter. Z scores for FEV1, FVC were calculated from British reference values (www.lungfunction.org/growinglungs). | |
| Z score FVC | The mean z score for FVC in the standard therapy group was 0.01 (SD 1.2). | The mean z score FVC in the intervention groups was ‐0.04 (SD 1.31) that was 0.05 higher (0.44 lower to 0.34 higher) than the standard therapy group. | 157 | ⊕⊕⊕⊝ | FEV1 and FVC were measured using standard spirometer after bronchodilatation. The mean difference between the two groups represents the difference in the mean z scores for each parameter. Z scores for FEV1, FVC were calculated from British reference values (www.lungfunction.org/growinglungs). | |
| HRCT score (Brody‐II) | The mean HRCT score in the standard therapy group was 2.83 (SD 3.5). | The mean HRCT score (Brody‐II) in the intervention group was 3.02 (SD 3.48) 0.19 higher (0.93 lower to 1.31 higher) than the standard therapy group. | 152 | ⊕⊕⊕⊕ | The study had adequate power to detect a difference in HRCT score. HRCT scans were assesses by an independent assessor who was blinded to subject allocation using an updated version of Brody‐II score. | |
| Z score for weight | The mean z score for weight was ‐0.21 (SD 0.82) in the standard therapy group. | The mean z score for weight in the intervention group was ‐0.15 that was 0.06 higher (0.21 lower to 0.33 higher) than the standard therapy group. | 157 | ⊕⊕⊕⊝ | The z scores for weight and BMI were calculated from the 2000 CDC Growth Reference Charts (http://cdc.gov/growthcharts). The mean difference between the two groups represents the difference in their z scores for each parameter. | |
| Z score BMI | The mean z score for BMI was 0.01 (SD 0.83) in the standard therapy group. | The mean z score BMI in the intervention group was 0.03 (SD0.93) that was 0.02 higher (0.26 lower to 0.30 higher) than the standard therapy group. | 157 | ⊕⊕⊕⊝ | The z scores for weight and BMI were calculated from the 2000 CDC Growth Reference Charts (http://cdc.gov/growthcharts). The mean difference between the two groups represents the difference in their z scores for each parameter. | |
| Number of hospitalizations per participant per year | The number of hospitalizations per participant per year was 1.08 in the standard therapy group. | The number of hospitalizations per participant per year in the intervention group was 1.52 that was 1.4 times higher (1.08 lower to 1.82 higher) than the standard therapy group. | 157 | ⊕⊕⊕⊝ | ||
| Overall cost of care per participant (AUD) Follow up: 5 years | The total cost of care for each participant was 90,958 AUD (SD 110,255) in the standard therapy group. | The total cost of care in the intervention group was 92,860 AUD (SD 73,378) that was 1902 AUD higher (27,508.98 lower to 31,312.98 higher) than the standard therapy group. | 157 (1 study) | ⊕⊕⊕⊕ | The cost of hospital admissions per participant over the total study duration in the intervention group was 9288 AUD lower in the intervention group (34,996.37 lower to 16,420.37 higher). | |
| *The basis for the assumed risk (e.g. the median control group risk across studies) is provided in footnotes. The corresponding risk (and its 95% confidence interval) is based on the assumed risk in the comparison group and the relative effect of the intervention (and its 95% CI). | ||||||
| GRADE Working Group grades of evidence | ||||||
| 1 The study had low statistical power and research is needed to provide definitive answers. | ||||||
| Outcome or subgroup title | No. of studies | No. of participants | Statistical method | Effect size |
| 1 Z score FEV1 Show forest plot | 1 | Mean Difference (IV, Fixed, 95% CI) | Totals not selected | |
| 1.1 At 5 years | 1 | Mean Difference (IV, Fixed, 95% CI) | 0.0 [0.0, 0.0] | |
| 2 Z score FVC Show forest plot | 1 | Mean Difference (IV, Fixed, 95% CI) | Totals not selected | |
| 2.1 At 5 years | 1 | Mean Difference (IV, Fixed, 95% CI) | 0.0 [0.0, 0.0] | |
| 3 Total CF‐CT score (Brody‐II) Show forest plot | 1 | Mean Difference (IV, Fixed, 95% CI) | Totals not selected | |
| 3.1 At 5 years | 1 | Mean Difference (IV, Fixed, 95% CI) | 0.0 [0.0, 0.0] | |
| 4 Individual CF‐CT scores (at 5 years) Show forest plot | 1 | Mean Difference (IV, Fixed, 95% CI) | Totals not selected | |
| 4.1 Bronchiectstasis | 1 | Mean Difference (IV, Fixed, 95% CI) | 0.0 [0.0, 0.0] | |
| 4.2 Parencymal disease | 1 | Mean Difference (IV, Fixed, 95% CI) | 0.0 [0.0, 0.0] | |
| 4.3 Mucus plugging | 1 | Mean Difference (IV, Fixed, 95% CI) | 0.0 [0.0, 0.0] | |
| 4.4 Airway wall thickening | 1 | Mean Difference (IV, Fixed, 95% CI) | 0.0 [0.0, 0.0] | |
| 4.5 Air trapping | 1 | Mean Difference (IV, Fixed, 95% CI) | 0.0 [0.0, 0.0] | |
| 5 Z score for weight Show forest plot | 1 | Mean Difference (IV, Fixed, 95% CI) | Totals not selected | |
| 5.1 At 5 years | 1 | Mean Difference (IV, Fixed, 95% CI) | 0.0 [0.0, 0.0] | |
| 6 Z score BMI Show forest plot | 1 | Mean Difference (IV, Fixed, 95% CI) | Totals not selected | |
| 6.1 At 5 years | 1 | Mean Difference (IV, Fixed, 95% CI) | 0.0 [0.0, 0.0] | |
| 7 Positive P.aeruginosa isolates per patient per year Show forest plot | 1 | Rate Ratio (Fixed, 95% CI) | Totals not selected | |
| 7.1 At 5 years | 1 | Rate Ratio (Fixed, 95% CI) | 0.0 [0.0, 0.0] | |
| 8 Prevalence of P. aeruginosa in BAL at 5 years age Show forest plot | 1 | Risk Ratio (M‐H, Fixed, 95% CI) | Totals not selected | |
| 9 Sensitivity analysis ‐ Prevalence of P. aeruginosa in BAL at 5 years age (40% vs 5%) Show forest plot | 1 | Risk Ratio (M‐H, Fixed, 95% CI) | Totals not selected | |
| 10 Sensitivity analysis ‐ Prevalence of P. aeruginosa in BAL at 5 years age (5% vs 40%) Show forest plot | 1 | Risk Ratio (M‐H, Fixed, 95% CI) | Totals not selected | |
| 11 Clearance of P.aeruginosa after 1 or 2 eradication treatments Show forest plot | 1 | Risk Ratio (M‐H, Fixed, 95% CI) | Totals not selected | |
| 11.1 At 5 years | 1 | Risk Ratio (M‐H, Fixed, 95% CI) | 0.0 [0.0, 0.0] | |
| 12 Age at first acquisition of P. aeruginosa infection Show forest plot | 1 | Rate Ratio (Fixed, 95% CI) | Totals not selected | |
| 12.1 At 5 years | 1 | Rate Ratio (Fixed, 95% CI) | 0.0 [0.0, 0.0] | |
| 13 Number of hospital admissions per patient per year Show forest plot | 1 | Rate Ratio (Fixed, 95% CI) | Totals not selected | |
| 13.1 At 5 years | 1 | Rate Ratio (Fixed, 95% CI) | 0.0 [0.0, 0.0] | |
| 14 Number of hospitalizations per person per year due to non‐P. aeruginosa exacerbations Show forest plot | 1 | Rate Ratio (Fixed, 95% CI) | Totals not selected | |
| 14.1 At 5 years | 1 | Rate Ratio (Fixed, 95% CI) | 0.0 [0.0, 0.0] | |
| 15 Duration of hospital admissions due to non‐P.aeruginosa exacerbations Show forest plot | 1 | Mean Difference (IV, Fixed, 95% CI) | Totals not selected | |
| 15.1 New Subgroup | 1 | Mean Difference (IV, Fixed, 95% CI) | 0.0 [0.0, 0.0] | |
| 16 Days as hospital inpatient per patient per year Show forest plot | 1 | Risk Difference (Fixed, 95% CI) | Totals not selected | |
| 16.1 New Subgroup | 1 | Risk Difference (Fixed, 95% CI) | 0.0 [0.0, 0.0] | |
| 17 Total cost of care per participant (Australian Dollars) Show forest plot | 1 | Mean Difference (IV, Fixed, 95% CI) | Totals not selected | |
| 18 Mean hospital admissions cost per patient Show forest plot | 1 | Mean Difference (IV, Fixed, 95% CI) | Totals not selected | |
| 19 Number of pulmonary exacerbations (requiring oral or intravenous antibiotics) per patient per year Show forest plot | 1 | Rate Ratio (Fixed, 95% CI) | Totals not selected | |
| 19.1 At 5 years | 1 | Rate Ratio (Fixed, 95% CI) | 0.0 [0.0, 0.0] | |