| 1 Z score FEV1 Show forest plot | 1 | | Mean Difference (IV, Fixed, 95% CI) | Totals not selected |
|
| 1.1 At 5 years | 1 | | Mean Difference (IV, Fixed, 95% CI) | 0.0 [0.0, 0.0] |
| 2 Z score FVC Show forest plot | 1 | | Mean Difference (IV, Fixed, 95% CI) | Totals not selected |
|
| 2.1 At 5 years | 1 | | Mean Difference (IV, Fixed, 95% CI) | 0.0 [0.0, 0.0] |
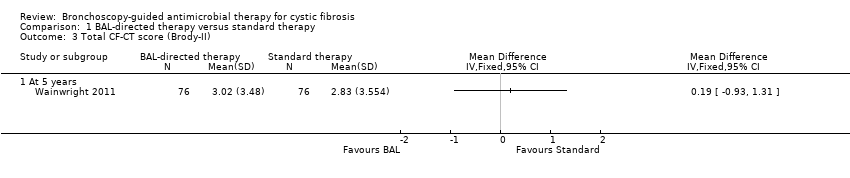
| 3 Total CF‐CT score (Brody‐II) Show forest plot | 1 | | Mean Difference (IV, Fixed, 95% CI) | Totals not selected |
|
| 3.1 At 5 years | 1 | | Mean Difference (IV, Fixed, 95% CI) | 0.0 [0.0, 0.0] |
| 4 Individual CF‐CT scores (at 5 years) Show forest plot | 1 | | Mean Difference (IV, Fixed, 95% CI) | Totals not selected |
|
| 4.1 Bronchiectstasis | 1 | | Mean Difference (IV, Fixed, 95% CI) | 0.0 [0.0, 0.0] |
| 4.2 Parencymal disease | 1 | | Mean Difference (IV, Fixed, 95% CI) | 0.0 [0.0, 0.0] |
| 4.3 Mucus plugging | 1 | | Mean Difference (IV, Fixed, 95% CI) | 0.0 [0.0, 0.0] |
| 4.4 Airway wall thickening | 1 | | Mean Difference (IV, Fixed, 95% CI) | 0.0 [0.0, 0.0] |
| 4.5 Air trapping | 1 | | Mean Difference (IV, Fixed, 95% CI) | 0.0 [0.0, 0.0] |
| 5 Z score for weight Show forest plot | 1 | | Mean Difference (IV, Fixed, 95% CI) | Totals not selected |
|
| 5.1 At 5 years | 1 | | Mean Difference (IV, Fixed, 95% CI) | 0.0 [0.0, 0.0] |
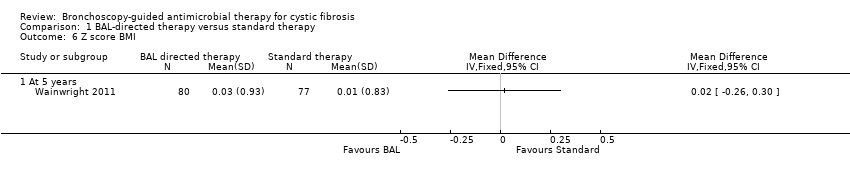
| 6 Z score BMI Show forest plot | 1 | | Mean Difference (IV, Fixed, 95% CI) | Totals not selected |
|
| 6.1 At 5 years | 1 | | Mean Difference (IV, Fixed, 95% CI) | 0.0 [0.0, 0.0] |
| 7 Positive P.aeruginosa isolates per patient per year Show forest plot | 1 | | Rate Ratio (Fixed, 95% CI) | Totals not selected |
|
| 7.1 At 5 years | 1 | | Rate Ratio (Fixed, 95% CI) | 0.0 [0.0, 0.0] |
| 8 Prevalence of P. aeruginosa in BAL at 5 years age Show forest plot | 1 | | Risk Ratio (M‐H, Fixed, 95% CI) | Totals not selected |
|
| 9 Sensitivity analysis ‐ Prevalence of P. aeruginosa in BAL at 5 years age (40% vs 5%) Show forest plot | 1 | | Risk Ratio (M‐H, Fixed, 95% CI) | Totals not selected |
|
| 10 Sensitivity analysis ‐ Prevalence of P. aeruginosa in BAL at 5 years age (5% vs 40%) Show forest plot | 1 | | Risk Ratio (M‐H, Fixed, 95% CI) | Totals not selected |
|
| 11 Clearance of P.aeruginosa after 1 or 2 eradication treatments Show forest plot | 1 | | Risk Ratio (M‐H, Fixed, 95% CI) | Totals not selected |
|
| 11.1 At 5 years | 1 | | Risk Ratio (M‐H, Fixed, 95% CI) | 0.0 [0.0, 0.0] |
| 12 Age at first acquisition of P. aeruginosa infection Show forest plot | 1 | | Rate Ratio (Fixed, 95% CI) | Totals not selected |
|
| 12.1 At 5 years | 1 | | Rate Ratio (Fixed, 95% CI) | 0.0 [0.0, 0.0] |
| 13 Number of hospital admissions per patient per year Show forest plot | 1 | | Rate Ratio (Fixed, 95% CI) | Totals not selected |
|
| 13.1 At 5 years | 1 | | Rate Ratio (Fixed, 95% CI) | 0.0 [0.0, 0.0] |
| 14 Number of hospitalizations per person per year due to non‐P. aeruginosa exacerbations Show forest plot | 1 | | Rate Ratio (Fixed, 95% CI) | Totals not selected |
|
| 14.1 At 5 years | 1 | | Rate Ratio (Fixed, 95% CI) | 0.0 [0.0, 0.0] |
| 15 Duration of hospital admissions due to non‐P.aeruginosa exacerbations Show forest plot | 1 | | Mean Difference (IV, Fixed, 95% CI) | Totals not selected |
|
| 15.1 New Subgroup | 1 | | Mean Difference (IV, Fixed, 95% CI) | 0.0 [0.0, 0.0] |
| 16 Days as hospital inpatient per patient per year Show forest plot | 1 | | Risk Difference (Fixed, 95% CI) | Totals not selected |
|
| 16.1 New Subgroup | 1 | | Risk Difference (Fixed, 95% CI) | 0.0 [0.0, 0.0] |
| 17 Total cost of care per participant (Australian Dollars) Show forest plot | 1 | | Mean Difference (IV, Fixed, 95% CI) | Totals not selected |
|
| 18 Mean hospital admissions cost per patient Show forest plot | 1 | | Mean Difference (IV, Fixed, 95% CI) | Totals not selected |
|
| 19 Number of pulmonary exacerbations (requiring oral or intravenous antibiotics) per patient per year Show forest plot | 1 | | Rate Ratio (Fixed, 95% CI) | Totals not selected |
|
| 19.1 At 5 years | 1 | | Rate Ratio (Fixed, 95% CI) | 0.0 [0.0, 0.0] |