Psychological interventions for co‐occurring depression and substance use disorders
Abstract
Background
Comorbid depression and substance use disorders are common and have poorer outcomes than either disorder alone. While effective psychological treatments for depression or substance use disorders are available, relatively few randomised controlled trials (RCTs) have examined the efficacy of these treatments in people with these comorbid disorders.
Objectives
To assess the efficacy of psychological interventions delivered alone or in combination with pharmacotherapy for people diagnosed with comorbid depression and substance use disorders.
Search methods
We searched the following databases up to February 2019: Cochrane Central Register of Controlled Trials, PubMed, Embase, CINAHL, Google Scholar and clinical trials registers. All systematic reviews identified, were handsearched for relevant articles.
Selection criteria
The review includes data from RCTs of psychological treatments for people diagnosed with comorbid depression and substance use disorders, using structured clinical interviews. Studies were included if some of the sample were experiencing another mental health disorder (e.g. anxiety); however, studies which required a third disorder as part of their inclusion criteria were not included. Studies were included if psychological interventions (with or without pharmacotherapy) were compared with no treatment, delayed treatment, treatment as usual or other psychological treatments.
Data collection and analysis
We used standard methodological procedures expected by Cochrane.
Main results
Seven RCTs of psychological treatments with a total of 608 participants met inclusion criteria. All studies were published in the USA and predominately consisted of Caucasian samples. All studies compared different types of psychological treatments. Two studies compared Integrated Cognitive Behavioural Therapy (ICBT) with Twelve Step Facilitation (TSF), another two studies compared Interpersonal Psychotherapy for Depression (IPT‐D) with other treatment (Brief Supportive Therapy (BST) or Psychoeducation). The other three studies compared different types or combinations of psychological treatments. No studies compared psychological interventions with no treatment or treatment as usual control conditions. The studies included a diverse range of participants (e.g. veterans, prisoners, community adults and adolescents).
All studies were at high risk of performance bias, other main sources were selection, outcome detection and attrition bias. Due to heterogeneity between studies only two meta‐analyses were conducted. The first meta‐analysis focused on two studies (296 participants) comparing ICBT to TSF. Very low‐quality evidence revealed that while the TSF group had lower depression scores than the ICBT group at post‐treatment (mean difference (MD) 4.05, 95% confidence interval (CI) 1.43 to 6.66; 212 participants), there was no difference between groups in depression symptoms (MD 1.53, 95% CI ‐1.73 to 4.79; 181 participants) at six‐ to 12‐month follow‐up. At post‐treatment there was no difference between groups in proportion of days abstinent (MD ‐2.84, 95% CI ‐8.04 to 2.35; 220 participants), however, the ICBT group had a greater proportion of days abstinent than the TSF group at the six‐ to 12‐month follow‐up (MD 10.76, 95% CI 3.10 to 18.42; 189 participants). There were no differences between the groups in treatment attendance (MD ‐1.27, 95% CI ‐6.10 to 3.56; 270 participants) or treatment retention (RR 0.95, 95% CI 0.72 to 1.25; 296 participants).
The second meta‐analysis was conducted with two studies (64 participants) comparing IPT‐D with other treatment (Brief Supportive Psychotherapy/Psychoeducation). Very low‐quality evidence indicated IPT‐D resulted in significantly lower depressive symptoms at post‐treatment (MD ‐0.54, 95% CI ‐1.04 to ‐0.04; 64 participants), but this effect was not maintained at three‐month follow‐up (MD 3.80, 95% CI ‐3.83 to 11.43) in the one study reporting follow‐up outcomes (38 participants; IPT‐D versus Psychoeducation). Substance use was examined separately in each study, due to heterogeneity in outcomes. Both studies found very low‐quality evidence of no significant differences in substance use outcomes at post‐treatment (percentage of days abstinent, IPD versus Brief Supportive Psychotherapy; MD ‐2.70, 95% CI ‐28.74 to 23.34; 26 participants) or at three‐month follow‐up (relative risk of relapse, IPT‐D versus Psychoeducation; RR 0.67, 95% CI 0.30 to 1.50; 38 participants). There was also very low‐quality evidence for no significant differences between groups in treatment retention (RR 1.00, 95% CI 0.81 to 1.23; 64 participants). No adverse events were reported in any study.
Authors' conclusions
The conclusions of this review are limited due to the low number and very poor quality of included studies. No conclusions can be made about the efficacy of psychological interventions (delivered alone or in combination with pharmacotherapy) for the treatment of comorbid depression and substance use disorders, as they are yet to be compared with no treatment or treatment as usual in this population. In terms of differences between psychotherapies, although some significant effects were found, the effects were too inconsistent and small, and the evidence of too poor quality, to be of relevance to practice.
PICO
Plain language summary
Do psychological interventions work for people with both depression and substance use disorders?
What is the aim of this review?
The aim of this Cochrane Review was to find out if psychological interventions (delivered with or without pharmacotherapy) are effective for the treatment of comorbid depression and substance use disorders. Cochrane researchers collected and analysed all relevant studies to answer this question.
Key messages
No conclusions about the effectiveness of psychological interventions for the treatment of comorbid depression and substance use disorders can be made, due to the low number of studies found and very low quality of the evidence. More high‐quality studies comparing psychological interventions versus no treatment, delayed treatment, treatment as usual and other psychological interventions are needed.
What was studied in the review?
Comorbidity occurs for people experiencing mental disorders when the same person has two or more mental disorders. People diagnosed with depression are more likely to have substance use disorders, and vice versa. Comorbid disorders are associated with poorer clinical, social and vocational outcomes than either disorder alone. Psychological treatments for comorbid depression and substance use disorders are available, but relatively few have been tested. These treatments target psychological (thoughts, feelings, behaviours), social (family and personal relationships), and environmental risk factors (access to drugs) for depression and substance use.
What are the main results of the review?
The review authors searched for studies and found seven randomised controlled trials involving 608 people with comorbid depression and substance use disorders published between 2003 and 2014. All seven studies were published in the USA and predominately consisted of individuals from Caucasian backgrounds. No conclusions about the effectiveness of psychological interventions delivered with or without pharmacotherapy could be made, as no studies comparing these interventions with no treatment, delayed treatment or treatment as usual were found. All seven studies compared different types or combinations of psychological treatments. Few consistent differences in depression or substance use treatment outcomes were found. No conclusions about which type of psychological intervention was most effective could be made, due to the low number of studies found and very low quality of the evidence . None of the studies reported any harms related to receiving psychological treatment for depression and substance use disorders. All studies were funded by university and government research grants in the USA.
How up‐to‐date is this review?
The review authors searched for studies that had been published up to February 2019.
Authors' conclusions
Summary of findings
| Integrated CBT compared with Twelve Step Facilitation for co‐occurring depression and substance use disorders | |||||||
| Patient or population: co‐occurring depression and substance use disorders | |||||||
| Outcomes | Anticipated absolute effects* (95% CI) | Relative effect | № of participants | Certainty of the evidence | Comments | ||
| Risk with Twelve Step Facilitation | Risk with Integrated CBT | ||||||
| Depression score | The mean depression score ranged from 21.0 to 23.2 | MD 4.05 higher | ‐ | 212 | ⊕⊝⊝⊝ | ||
| Depression score | The mean depression score ranged from 21.0 to 27.9 | MD 1.53 higher | ‐ | 181 | ⊕⊝⊝⊝ | ||
| Percent of days abstinent | The mean proportion of days abstinent ranged from 93 to 90 | MD 2.84 lower | ‐ | 220 | ⊕⊝⊝⊝ | ||
| Percent of days abstinent | The mean proportion of days abstinent ranged from 72 to 75 | MD 10.76 higher | ‐ | 189 | ⊕⊝⊝⊝ | ||
| Treatment retention | Moderate | RR 0.95 | 296 | ⊕⊝⊝⊝ | |||
| 785 per 1,000 | 745 per 1,000 | ||||||
| Number of treatment sessions attended | The mean number of Treatment Sessions Attended ranged from 19.4‐22.1 | MD 1.27 lower | ‐ | 270 | ⊕⊝⊝⊝ | ||
| *The risk in the intervention group (and its 95% confidence interval) is based on the assumed risk in the comparison group and the relative effect of the intervention (and its 95% CI). | |||||||
| GRADE Working Group grades of evidence | |||||||
| 1 Downgraded two levels due to very serious risk of bias: high levels of performance bias, attrition bias and uneven medication use between groups. One study also had high risk of selection bias and unclear risk for selective reporting. 2 Downgraded one level due to Imprecision: small number of trials/participants 3 Downgraded one level due to indirectness: population of predominately Caucasian male veterans 4 Downgraded two levels due to very serious risk of bias: high levels of selection bias, performance bias, attrition bias, unclear risk for selective reporting and uneven attendance between groups at 12‐step Community Meetings 5 Downgraded two levels due to very serious risk of bias: mean attendance was based on a reduced sample, not those originally randomised into the study. Also high risk of selection bias, performance bias and attrition bias | |||||||
| Interpersonal Psychotherapy for Depression (IPT‐D) compared with Other Psychological Interventions for co‐occurring depression and substance use disorders | ||||||
| Patient or population: Individuals experiencing co‐occurring depression and substance use disorders | ||||||
| Outcomes | Anticipated absolute effects* (95% CI) | Relative effect | № of participants | Certainty of the evidence | Comments | |
| Risk with Other Theraputic Interventions | Risk with Interpersonal Psychotherapy for Depression (IPT‐D) | |||||
| Depression score | SMD 0.54 SD lower | ‐ | 64 | ⊕⊝⊝⊝ | ||
| Depression score | The mean depression score was 15.8 | MD 3.80 higher | ‐ | 38 | ⊕⊝⊝⊝ | |
| Percentage of days abstinent | The mean percentage of days abstinent was 49.7 | MD 2.70 lower | ‐ | 26 | ⊕⊝⊝⊝ | |
| Substance use ‐ relapse | Study population | RR 0.67 | 38 | ⊕⊝⊝⊝ | ||
| 316 per 1,000 | 212 per 1,000 | |||||
| Treatment retention | Study population | RR 1.00 | 64 | ⊕⊝⊝⊝ | ||
| 774 per 1,000 | 744 per 1,000 | |||||
| *The risk in the intervention group (and its 95% confidence interval) is based on the assumed risk in the comparison group and the relative effect of the intervention (and its 95% CI). | ||||||
| GRADE Working Group grades of evidence | ||||||
| 1 Downgraded two levels due to serious risk of bias: high levels of performance bias due to difficulties with blinding participants and personnel, one of the studies also had high attrition bias and reported group differences in use of antidepressants and adjunctive mental health counselling 2 Downgraded one level due to indirectness: one of the study was based on a female prison population, the other were recruited through a medical college, neither sample is likely to be representative of broader population of individuals experience comorbid substance use and depressive disorders 3 Downgraded two levels due to very small sample size 4 Downgraded two levels due to serious risk of bias: high levels of performance bias due to difficulties with blinding participants and personnel and reported group differences in use of antidepressants and adjunctive mental health counselling 5 Downgraded one level due to indirectness: Female prison population unlikely to be representative of broader population of individuals experience comorbid substance use and depressive disorders 6 Downgraded two levels due to serious risk of bias: high levels of performance bias due to difficulties with blinding participants and personnel 7 Downgraded one level due to indirectness: sample recruited through a medical college, predominately White male, unlikely to be representative of broader population of individuals experience comorbid substance use and depressive disorders | ||||||
Background
Description of the condition
Comorbidity occurs for people experiencing mental disorders when the same person is diagnosed with two or more mental disorders using Diagnostic and Statistical Manual (DSM)/International Statistical Classification of Diseases and Related Health Problems (ICD) criteria (American Psychiatric Association 2000; World Health Organization 1992). People diagnosed with substance use disorders are more likely to have a depression disorder, and vice versa. High rates of comorbid substance use and depression disorders have consistently been reported in epidemiological surveys (Australian Bureau of Statistics 2007; Degenhardt 2001; EMCDDA 2013; Farrell 2001; Grant 2004; Jane‐Llopis 2006; Kessler 2003). The United States National Epidemiologic Survey on Alcohol and Related Conditions (NESARC) found that individuals with alcohol or drug dependence were four and nine times more likely to experience major depression, respectively than individuals with no substance dependence (Grant 2004). Similarly in Australia, the National Survey of Mental Health and Wellbeing found that individuals with an alcohol or drug use disorder were 3 to 4 times more likely to have experienced depression, or another affective disorder, in the past 12 months compared with the general population (Teesson 2009; Teesson 2010). Within treatment settings, rates of comorbid substance use and affective disorders are even higher, with 30% to 50% of patients meeting criteria for concurrent major depression (Baker 2007a; Bulkstein 1992; Grella 2001; Hall 2009; Lejoyeux 2011; Lubman 2007; Teesson 2005). Such high rates of comorbid disorders are problematic, as they have been linked to treatment non‐compliance, a more severe and chronic illness course, and an increased risk of relapse in both substance use and co‐occurring mental disorders, as well as greater social and vocational impairment, poor physical health, higher risk of suicidal behaviour and greater use of health services (Australian Bureau of Statistics 2007; Davis 2008; Hasin 2002; Sullivan 2005; Šprah 2017).
Description of the intervention
Psychological interventions are theory‐based, manualised approaches to the treatment of depression, substance use and other mental disorders. Common approaches include the following.
-
Cognitive behavior therapy (CBT), a family of interventions targeting cognitions, behaviours, emotions and environmental factors ,which may predispose, precipitate or perpetuate comorbid depression and substance use disorders (Beck 2011). CBT approaches include cognitive therapy (CT), behaviour therapy (BT), traditional CBT approaches and ‘third wave’ approaches including acceptance and commitment therapy, dialectical behaviour therapy and mindfulness‐based interventions (Hofmann 2012b; Wells 2016).
-
Motivational interviewing is a psychotherapeutic approach that aims to elicit behaviour change by first exploring and resolving ambivalence about making a change (Miller 2013). A number of strategies are then utilised to enhance commitment to making the change. Motivational interviewing is commonly delivered in combination with other psychotherapies including CBT. Only studies combining motivational interviewing with CBT were included in this review.
-
Interpersonal psychotherapy (IPT) is most commonly used to treat depression (Frank 2011). It focuses on the role of difficulties in everyday interactions with others on depressive symptoms by targeting the individual's emotional responses to life stressors, role disputes and role transitions (Frank 2011; Stuart 2012).
-
Contingency management is most‐widely used in the treatment of substance use disorders. Based on the principles of operant conditioning, it provides incentives or rewards to encourage behaviour change (Petry 2012). Typical reward systems include the use of abstinence‐based voucher programs, which increase in value with each consecutive negative drug test (Petry 2012).
How the intervention might work
Psychological interventions aim to modify individual, family, social and environmental factors that may increase risk of depression and substance use disorders (Baker 2007b). Psychological approaches vary depending on the theoretical models underpinning them, but typically target thoughts, feelings, behaviours, interpersonal relationships, social and environmental variables that may predispose, precipitate or perpetuate depression and substance use (Baker 2007b; NCCMH 2009). They can be delivered face‐to‐face, online, via telephone or bibliotherapy (e.g. self‐help books; NCCMH 2009).
Why it is important to do this review
There have been numerous studies investigating the efficacy of psychological interventions for people experiencing depression or substance use disorders. Manualised psychological interventions, including CBT (Cuijpers 2013; Hofmann 2012a), motivational interviewing (Smedslund 2011), IPT (Cuijpers 2011) and contingency management (Benishek 2014; Prendergast 2006), have shown some promise in individually reducing symptoms related to each of these disorders. However, many of the trials excluded comorbid disorders making it difficult to ascertain the efficacy of these interventions for those experiencing both disorders. While there have been some trials examining the efficacy of these treatments within comorbid populations, the few existing meta‐analyses or systematic reviews on comorbid substance use and depression have either mainly focused on pharmacological interventions (e.g. Agabio 2018; Foulds 2015; Pani 2010; Zhou 2015), have included subclinical populations for either depression and/or substance use (Babowitch 2016; Baker 2012; Hesse 2009), or did not exclusively examine randomised controlled trials (Riper 2014). There have been no systematic reviews conducted to determine which psychological intervention is most efficacious among individuals with comorbid depression and substance use disorders.
Objectives
To assess the efficacy of psychological interventions delivered alone or in combination with pharmacotherapy for people diagnosed with comorbid depression and any substance use disorder (excluding nicotine).
Methods
Criteria for considering studies for this review
Types of studies
Randomised controlled trials (RCTs)
Types of participants
Individuals (adults and adolescents) with co‐occurring Diagnostic and Statistical Manual (DSM) or International Classification of Diseases (ICD) depression and substance use disorder (excluding nicotine) derived using a structured clinical interview were included. Where possible, those with psychosis, bipolar disorder and intellectual disability were excluded as these individuals form distinct clinical groups with specific needs. Studies were included if some of the sample were experiencing another mental health disorder (e.g. anxiety); however, studies which required a third disorder as part of their inclusion criteria were not included in the review.
Types of interventions
Experimental conditions (+/‐ pharmacotherapy)
-
CBT with and without motivational interviewing
-
Cognitive therapy
-
Behaviour therapy
-
Contingency management
-
Acceptance and commitment therapy
-
Dialectical behaviour therapy
-
Interpersonal psychotherapy (IPT)
Control conditions (+/‐ pharmacotherapy)
-
No, minimal or delayed treatment
-
Other psychological interventions (including studies comparing those listed above)
-
Treatment as usual (defined according to study setting but typically consists of case management)
Types of outcome measures
Primary outcomes
-
Depression: changes in symptom severity on a standardised questionnaire (e.g. Beck Depression Inventory (BDI) or Hamilton Depression Rating Scale (HDRS)) or presence of DSM/ICD disorder on a structured clinical interview (e.g. the Structured Clinical Interview for DSM‐IV (SCID‐IV)).
-
Substance use: changes in the frequency (including abstinence), quantity, severity of use measured by calendar‐based methods such as Timeline Follow Back (TLFB) and self‐report instruments such as the Alcohol Use Disorders Identification Test (AUDIT) or presence of DSM/ICD substance use disorders.
-
Treatment retention as measured by the number of participants still in treatment at the end of the study, and treatment attendance as assessed by the average number of sessions attended.
Secondary outcomes
-
Functioning: changes in social, occupational/educational functioning as measured by changes on standardised measures of quality of life (e.g., World Health Organization‐Quality of Life Scale) or daily functioning (e.g. Global Assessment of Functioning (GAF) scale.
-
Anxiety: changes in symptom severity on a standardised questionnaire (e.g. Beck Anxiety Inventory (BAI)) or presence of DSM/ICD disorder on a structured clinical interviews (e.g. SCID‐IV).
-
Global clinical severity of mental health disorders: as measured by changes on standardised instruments such as the Clinical Global Impression Scale (CGI) scale.
-
Adverse effects linked to treatments delivered.
Search methods for identification of studies
Electronic searches
We aimed to identify all relevant RCTs regardless of language or publication status (published, unpublished, in press, or in progress).
We searched the following databases up to 04 February 2019:
-
the Cochrane Central Register of Controlled Trials (CENTRAL; (2019, Issue 1), in the Cochrane Library using the strategy in Appendix 1;
-
PubMed (from 1966 to 04 February 2019) using the strategy in Appendix 2;
-
Embase (from 1980 to 04 February 2019) using the strategy in Appendix 3;
-
CINAHL (from 1982 to 04 February 2019) using the strategy in Appendix 4;
-
Google Scholar, scholar.google.com (searched on 04 February 2019).
We searched the following trials registries on 25 February 2019:
-
the ISRCTN registry (www.isrctn.com);
-
ClinicalTrials.gov (clinicaltrials.gov).
Searching other resources
We handsearched relevant articles, systematic or meta‐analytic reviews. We also searched grey literature including internal reports and conference proceedings to identify unpublished studies and we contacted the authors of these studies to obtain relevant information.
Data collection and analysis
Selection of studies
-
We merged all search results (including records identified from electronic searches and other resources) into Endnote and deleted duplicate records.
-
Two review authors independently examined titles and abstracts and deleted obviously irrelevant records
-
Two review authors independently assessed full‐text articles of the potentially relevant records identified for inclusion in the review and linked multiple reports of the same study.
In the event of a disagreement by the independent review authors, resolution followed a step‐wise process. Initially the review authors discussed the disagreement to establish whether there had been an error by one of the extractors that could easily be resolved. If the disagreement remained unresolved, the next step was to contact the study authors directly and any issues that persisted would be reported explicitly in the review. At all stages of this process the presence and resolution of disagreements were recorded and coding techniques were used to differentiate consensus data from extracted data across both review authors.
Data extraction and management
Two review authors independently extracted data using a standardised data collection checklist. We resolved any disagreements via consultation with a third review author.
The following data were extracted.
Address for correspondence.
Methods: study design, study length/number of follow‐up points, setting, country of origin.
Participants: major depressive disorder/substance use disorder inclusion criteria/measure, other defining characteristics (sample size, age mean (standard deviation (SD)), sex (% male), ethnicity, other inclusion and exclusion criteria), study dates/duration (months).
Interventions: number of treatment groups, intervention type and details (content, duration in sessions/weeks), format, intervention target (depression, substance use, both), allocation (number randomised/group), number of sessions attended, fidelity, adjunctive therapy or pharmacotherapy.
Methods for: sequence generation, allocation sequence concealment and blinding.
Outcomes: depression and substance use primary outcomes (definition/measure/unit of measurement, scale (range, interpretation); treatment retention (number of participants still in treatment at the end of the study), treatment attendance (average number of sessions attended).
Assessment of risk of bias in included studies
Two review authors independently assessed risk of bias using the criteria recommended by the Cochrane Handbook for Systematic Reviews of Interventions (Higgins 2011). We resolved any disagreement by discussion. The recommended approach for assessing risk of bias in studies included in Cochrane Reviews is a two‐part tool, addressing seven specific domains, including sequence generation and allocation concealment (selection bias), blinding of participants and providers (performance bias), blinding of outcome assessor (detection bias), incomplete outcome data (attrition bias), selective outcome reporting (reporting bias), and other source of bias. The first part of the tool involves describing what was reported to have happened in the study. The second part of the tool involves assigning a judgement relating to the risk of bias for that entry, in terms of low, high or unclear risk. To make these judgments, we used the criteria indicated by the Cochrane Handbook for Systematic Reviews of Interventions adapted to the addiction field.
The domains of sequence generation and allocation concealment (avoidance of selection bias) was addressed in the tool by a single entry for each study.
We considered blinding of participants, personnel and outcome assessor (avoidance of performance bias and detection bias) separately for objective outcomes (e.g. treatment retention, attrition, participants engaged in further treatments) and self‐report and interviewer‐rated subjective outcomes (e.g. depression, substance use) separately. Given that participants and personnel cannot be blinded to the type of psychological intervention being delivered, subjective outcomes were always judged at high risk of performance bias.
We assessed treatment fidelity and contamination under the 'Other bias' category, given their importance in ensuring the delivery of high‐quality psychological interventions in RCT's, as well as the potential influence of concurrent out‐of‐study psychotherapy and pharmacotherapy treatment on study outcomes (de Bruin 2015).
See Appendix 5 for details.
Measures of treatment effect
We analysed dichotomous outcomes by calculating the risk ratio (RR) for each trial with the uncertainty in each result being expressed with 95% confidence interval (CI). We analysed continuous outcomes by calculating the mean difference (MD) with 95% CI and standard deviation (SD) when the studies used the same instrument for assessing the outcome. We used the standardised mean difference (SMD) and SD when the studies used different instruments. If the number and range of studies allowed it, we planned to calculate the numbers needed to treat for an additional beneficial outcome (NNTH) or number needed to treat for an additional harmful outcome (NNTH), where data were homogeneous.
Unit of analysis issues
For multi‐arm studies included in the meta‐analyses, when one arm was considered more than once in same comparisons (e.g. two different experimental treatments compared with the same control group), we planned to combine all the relevant experimental groups into a single group and compare it with the control to avoid double‐counting participants in the control groups.
If any cluster‐RCTs were identified, we intended to include them in the analyses along with individual RCTs, planning to synthesise the results unless there was non‐negligible heterogeneity between the trial designs. For cluster‐RCTs that did not adjust for clustering, we intended to adjust the sample sizes using reported or estimated intraclass correlations (ICCs) in line with the recommendations by Higgins 2011.
Dealing with missing data
Whenever possible, we contacted the original investigators to request missing data. We made the assumptions of any methods used to cope with missing data explicit when possible, including whether the data were assumed to be missing at random, or missing values were assumed to have a particular value. The potential impact of missing data on the findings of the review are addressed in the Discussion section.
Assessment of heterogeneity
The presence of clinical, methodological and statistical heterogeneity between the included studies was assessed including: the country of origin, sample characteristics (inclusion and exclusion criteria), settings, types of treatment comparisons (including sample size, content, length of treatment), outcomes reported, measures used and length of follow‐up. We analysed heterogeneity by means of the I2 statistic and the Chi2 test. We regarded heterogeneity as substantial if the I² was greater than 50% or a P value was lower than < 0.10 for the Chi² test for heterogeneity. Following the guidance in the Cochrane Handbook for Systematic Reviews of Intervention (Higgins 2011), we distinguished the following values to denote no important, moderate, substantial, and considerable heterogeneity, respectively: 0% to 40%, 30% to 60%, 50% to 90%, and 75% to 100%.
Assessment of reporting biases
If meta‐analyses were conducted and number of studies allowed, we planned to use funnel plots (plots of the effect estimate from each study against the standard error (SE)) to assess the potential for bias related to the size of the trials, which could indicate possible publication bias.
Data synthesis
We combined the outcomes from the individual trials through meta‐analysis where possible (comparability of intervention and outcomes between trials), using a random‐effects model, because we expected a certain degree of heterogeneity between trials. If the clinical or statistical heterogeneity between trials was too high (i.e. 75% to 100%), we considered not pooling the data
Subgroup analysis and investigation of heterogeneity
If the number and range of studies allowed it, we planned to conduct subgroup analyses for type of CBT, adults, young people, sex and type of substance used.
Sensitivity analysis
We planned to perform sensitivity analyses to assess how sensitive results were to reasonable changes in the assumptions about missing data (Higgins 2011).
'Summary of findings' tables
We assessed the overall quality of the evidence for the primary outcome variables using the Grading of Recommendation, Assessment, Development and Evaluation (GRADE) system. The GRADE Working Group developed a system for grading the quality of evidence (Guyatt 2008; Guyatt 2011; Oxman 2004), which takes into account issues not only related to internal validity, but also to external validity, such as directness of results. The summary of findings Table for the main comparison presents the main findings of the review in a transparent and simple tabular format. In particular, it provides key information concerning the quality of evidence, the magnitude of effect of the interventions examined and the sum of available data on the main outcomes.
The GRADE system uses the following criteria for assigning grades of evidence.
-
High: we are very confident that the true effect lies close to that of the estimate of the effect.
-
Moderate: we are moderately confident in the effect estimate. The true effect is likely to be close to the estimate of the effect, but there is a possibility that it is substantially different.
-
Low: our confidence in the effect estimate is limited. The true effect may be substantially different from the estimate of the effect.
-
Very low: we have very little confidence in the effect estimate. The true effect is likely to be substantially different from the estimate of effect.
Grading is decreased for the following reasons.
-
Serious (−1) or very serious (−2) study limitation for risk of bias.
-
Serious (−1) or very serious (−2) inconsistency between study results.
-
Some (−1) or major (−2) uncertainty about directness (the correspondence between the population, the intervention, or the outcomes measured in the studies actually found and those under consideration in our systematic review).
-
Serious (−1) or very serious (−2) Imprecision of the pooled estimate.
-
Strong suspicion of publication bias (−1).
We used GRADEpro GDT 2015 to import data from Review Manager 2014 for the main outcomes of depression score, substance use (percentage of days abstinent, proportion of days abstinent, relapse, percentage of daily use) and treatment retention. Due to the wide variation of treatments compared, we produced one summary table per treatment comparison (summary of findings Table for the main comparison; summary of findings Table 2).
Results
Description of studies
Results of the search
We identified 23,901 records through database searching and 36 from other sources. After removing duplicates, we were left with 19,087 unique references for analysis. We excluded 18,951 on the basis of title and abstract. We retrieved 136 articles in full text for more detailed evaluation, 127 of which were excluded for not meeting the inclusion criteria.
We included seven studies (from nine articles) that satisfied all criteria required for inclusion in the review. See Figure 1.

Study flow diagram.
For substantive descriptions of studies see the Characteristics of included studies and Characteristics of excluded studies tables
Included studies
Seven studies enrolling a total of 608 participants were included (Beutler 2003; Brown 2006; Carpenter 2008; Johnson 2012; Lydecker 2010; Markowitz 2008; Rohde 2014).
Country: all included studies were conducted in the USA.
Participant characteristics: the studies were conducted with a variety of patient groups including veterans (Brown 2006; Lydecker 2010); adults (Beutler 2003; Carpenter 2008;Markowitz 2008); adolescents (Rohde 2014); and incarcerated females (Johnson 2012). The average age ranged from 16.4 to 48.8 years. All studies had samples with a majority of Caucasians (61% to 81%). The proportion of males ranged from 57% to 92%. One study enrolled females only (Johnson 2012).
While all study participants had comorbid DSM‐IV depression and substance use disorders there was considerable variability in the disorder types included. Several studies included participants with major depression disorders only (Brown 2006; Johnson 2012), two included participants with major depressive disorder/dysthymia only (Carpenter 2008; Lydecker 2010), one included dysthymia only (Markowitz 2008), and the others included any depression disorder (Beutler 2003; Rohde 2014).
Two studies included participants with any substance abuse or dependence (Johnson 2012; Rohde 2014), the two veterans studies included individuals with alcohol, cannabis and/or stimulant dependence (Brown 2006; Lydecker 2010), and the three remaining studies included alcohol abuse or dependence only (Markowitz 2008), stimulant (cocaine or methamphetamine) dependence only (Beutler 2003), or opiate dependence only (Carpenter 2008).
Settings: six studies were conducted in outpatient settings, including two in dual diagnosis treatment services for veterans (Brown 2006; Lydecker 2010). One study was conducted among incarcerated females (Johnson 2012).
Types of comparisons: no studies that compared psychological interventions (alone or combined with pharmacotherapy) with delayed treatment, treatment as usual or no treatment control conditions met inclusion criteria; nor did any studies comparing combined psychological and pharmacological interventions with other psychological interventions. All seven studies included for review compared different types of psychological treatments.
Four studies provided group therapy (Brown 2006; Carpenter 2008; Lydecker 2010;Rohde 2014), two individual therapy (Beutler 2003; Markowitz 2008), and one study provided group therapy followed by individual therapy (Johnson 2012).
Five studies compared CBT with other psychological interventions for comorbid depression and substance use disorders.
-
Two studies compared 24 weeks (36 sessions) of group‐based integrated CBT (ICBT) versus Twelve Step Facilitation (TSF) in veterans accessing a dual diagnosis outpatient clinic with a DSM‐IV major depressive disorder and co‐occurring alcohol, cannabis and/or stimulant dependence (n = 90 Brown 2006; n = 206 Lydecker 2010).
-
One study compared 24 weeks (24 sessions) of group‐based Behavioral Therapy for Depression in Drug Dependence (BTDD) versus 24 weeks of a group‐based structured Relaxation Intervention (REL) among 38 treatment‐seeking outpatients with DSM‐IV opiate dependence and major depressive disorder/dysthymia (Carpenter 2008).
-
One study compared 1418 weeks (16‐20 sessions) of Cognitive Therapy (CT) with Narrative Therapy (NT) and Prescriptive Therapy (PT) among 40 patients seeking outpatient care with a DSM‐IV depression disorder and stimulant dependence (Beutler 2003).
-
One study compared three methods for integrating CBT and Functional Family Therapy (FFT) in 170 adolescents with a comorbid DSM‐IV depression and substance use disorder seeking substance use treatment (Rohde 2014). Participants received 24 weeks (24 sessions) of either the adolescent Coping With Depression (CWD) followed by FFT (CWD/FFT), FFT followed by CWD (FFT/WD) or integrated CWD and FFT care (CWD+FFT).
Two studies compared IPT for depression (IPT‐D) with other psychological interventions.
-
A pilot study compared 16 weeks (16‐18 sessions) of individual IPT‐D versus Brief Supportive Therapy (BST) in 26 adults seeking outpatient care with DSM‐IV dysthymia and secondary alcohol use disorder (Markowitz 2008).
-
A second study compared eight weeks (24 sessions) of group IPT‐D with a psychoeducation group for co‐occurring mental health and substance use disorders (PSYCHOED) among 40 incarcerated females with DSM major depressive disorder and substance abuse or dependence. Both treatment groups also received three individual sessions at pre, mid and post the group intervention, as well as treatment as usual for substance use and mental health problems (Johnson 2012).
Outcomes
The depression and substance use outcomes reported differed across studies, as detailed in the Characteristics of included studies table. All but one study used a version of the Hamilton Depression Rating Scale (HDRS, Hamilton 1960), a clinician‐rated measure of the frequency of depression symptoms in the past week. The original version (Hamilton 1960) contained 17 items, but current versions range from 17 to 29 items (Hamilton 1980; Williams 1988). Items are scored on a 3‐or 5‐point scale. Total scores for depression are usually derived from the original 17 items on a 3‐point scale and range from zero to 51 points, with scores from 7 to 17 indicating mild depression, from 18 to 24 indicating moderate depression, and above 24 indicating severe depression.
Three studies also included the Beck Depression Inventory (BDI) (Beck 1961; Beck 1978; Beck 1996), a self‐report measure of the frequency of depression symptoms in the previous two weeks. Rohde 2014 used the Child Depression Rating Scale‐Revised (CDRS‐R, Poznanski 1995), a 17‐item clinician‐rated measure of depressive symptomatology in six‐ to 12‐year olds, which is also widely used in adolescents.
All studies used the Timeline Followback method (TLFB; Miller 1994; Sobell 1980; Sobell 1992) to assess substance use outcomes. This calendar‐based method assesses the frequency and quantity of substance use, including the number of days abstinent over a specified timeframe. Both the timeframe (30 to 90 days) and definition of substance use outcome measures (mean percentage days abstinent, proportion of days abstinent, square root of percentage of daily substance use) varied across studies. One study used the alcohol and drug index score of the Addiction Severity Index (ASI; Beutler 2003).
Definitions of treatment retention varied across studies. Four studies reported the mean number of treatment sessions attended (Brown 2006; Carpenter 2008; Lydecker 2010; Rohde 2014). Three studies reported the percentage of participants who dropped out of treatment but the definitions of dropout varied. Beutler 2003 defined treatment as missing three or more consecutive sessions out of the 20 sessions. Markowitz 2008 reported the percentage of participants who failed to complete treatment, but it is unclear how this was defined. Johnson 2012 defined treatment dropout as missing more than two out of 24 sessions by choice.
No studies reported information on any of the secondary outcome variables specified in the original Cochrane Review research protocol, including functioning, quality of life, anxiety symptoms or disorders or the global clinical severity of mental health disorders. No adverse effects linked to treatments delivered were reported.
Follow‐up
All studies reported post‐treatment outcomes. Three studies conducted three‐month follow‐ups (Brown 2006; Johnson 2012; Lydecker 2010), three conducted six‐month follow‐ups (Beutler 2003; Brown 2006; Lydecker 2010; Rohde 2014), and two conducted 12‐month follow‐ups (Lydecker 2010, Rohde 2014).
Excluded studies
We excluded 127 articles from 124 studies for not meeting the inclusion criteria. Overall 76 articles (from 75 studies) were excluded because they did not meet the depression criteria, 20 articles (from 19 studies) were excluded because they did not meet the substance use criteria, 23 articles (from 22 studies) were excluded because they did not meet both the depression and substance use criteria, two studies were excluded because they were not RCTs, one study was excluded because it focused depression and substance use in the context of Posttraumatic Stress Disorder and Trauma, and five studies were excluded because they did not meet psychotherapy criteria (three of these studies focused on the use of technology as an adjunct to therapy, not actual differences between therapies; and the remaining two studies randomised pharmacological treatments, without randomising psychological therapies) See Figure 1 for further details.
Risk of bias in included studies
The seven included studies were evaluated by the review author's using Cochrane's 'Risk of bias' tool (see Appendix 5). The results are summarised in Figure 2 and Figure 3.
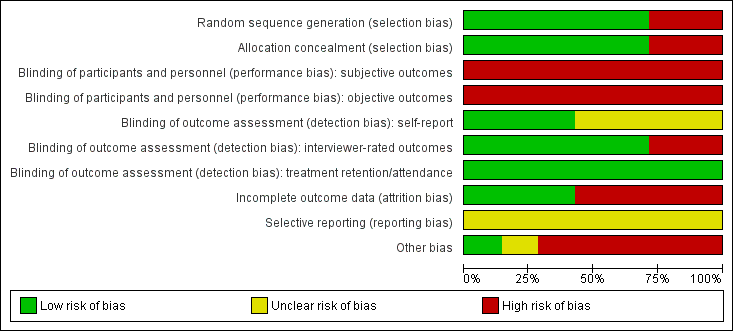
'Risk of bias' graph: review authors' judgements about each risk of bias item presented as percentages across all included studies.
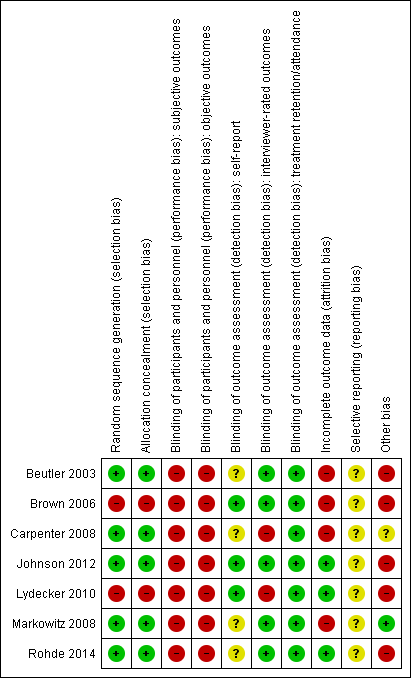
'Risk of bias' summary: review authors' judgements about each risk of bias item for each included study.
Allocation
Random sequence generation: all of the included studies were described as RCTs. Five studies were judged at low risk of selection bias: one study used concealed random draws (Beutler 2003) and four used independent computer‐based randomisation to generate the sequence allocation (Carpenter 2008; Johnson 2012; Markowitz 2008; Rohde 2014). Two studies used sequential allocation of consecutively‐admitted patients (Brown 2006; Lydecker 2010) and were judged to be at high risk of selection bias due to the use of a non‐random sequence generation process. All but one study (Beutler 2003), checked the success of randomisation by comparing the group allocations on baseline variables.
Allocation concealment: five studies were judged at low risk of bias ( Beutler 2003;Carpenter 2008; ,Johnson 2012; Markowitz 2008; Rohde 2014). Two studies were judged at high risk of bias (Brown 2006, Lydecker 2010) because a consecutive allocation was used.
Blinding
Performance bias: no study blinded therapists to the treatment allocation, as this is not possible in psychological trials. Only one study attempted to blind participants to their group allocation, and checked but did not report the success of this blinding process (Beutler 2003). Thus, all studies were rated at high risk of performance bias, due to the subjective nature of the depression and substance use outcomes. These studies were also rated at high risk for performance bias for the treatment retention/attendance variable, as despite the objective nature of this outcome, knowledge of the treatment allocation may influence participant's treatment engagement, participation and attendance.
Detection bias: five of the seven studies were at low risk of detection bias for interviewer‐rated outcomes, due to the use of outcome assessors blind to treatment allocation. Two studies which did not blind the outcome assessors were judged to be at high risk of detection bias (Carpenter 2008; Lydecker 2010). All four studies that reported self‐report outcomes were rated at unclear risk of detection bias (Beutler 2003; Carpenter 2008; Markowitz 2008; Rohde 2014). While participants were not blind to treatment allocation and self‐report measures may be impacted by self‐presentation bias or client insight, it is unlikely that any such risk of bias will vary by treatment condition. There was insufficient information to determine whether the individuals who collected information on treatment attendance/completion were blind to treatment allocation in all studies. However, this objective outcome measure is unlikely to be influenced by lack of blinding, and all seven studies were judged to be at low risk of detection bias on this outcome variable.
Incomplete outcome data
Treatment retention/attendance: less than 50% of participants completed treatment or attended half of the allocated treatment sessions (in at least one group) in four studies (Beutler 2003; Brown 2006; Carpenter 2008; Lydecker 2010). Between‐group differences in the number of sessions participants completed were reported in two studies (Beutler 2003; Rohde 2014).
Outcome assessments: high risk of attrition bias (defined as ≥50% in at least one group) was found in three studies at post‐treatment (Beutler 2003; Brown 2006; Carpenter 2008) and two studies at follow‐up (Beutler 2003; Brown 2006). One study in which one of the treatment groups had double the attrition rate at post‐treatment was considered high‐risk (Markowitz 2008). Attrition rates were typically between 20% and 30% in two other studies (Lydecker 2010; Rohde 2014) and one study among incarcerated females reported zero attrition (Johnson 2012).
Missing data/Intent‐to‐treat (ITT) analysis: three studies used the last observation carried forward (LOCF) method to manage missing data (Beutler 2003; Carpenter 2008; Markowitz 2008) and one imputed missing data, using Markov Chain Monte Carlo multiple imputation (Rohde 2014). All but one study usedITT analyses (Brown 2006). This study also excluded treatment dropouts (attended < 8 treatment sessions) and participants who missed two or more follow‐up assessments from the analyses and was judged to be at very high risk of attrition bias.
Selective reporting
Risk of selective reporting was unclear in all seven studies, as none of them had a published study protocol available. However, the results of all planned analyses using the outcome listed in the methods section are reported in the manuscripts. Two studies did not conduct or report the results of endpoint analyses at all follow‐up points. Trajectory, but not endpoint analyses were conducted (three‐month follow‐up (Brown 2006; Lydecker 2010) or nine‐month follow‐up (Lydecker 2010).
Other potential sources of bias
Fidelity ratings
All seven trials conducted fidelity ratings of the interventions, but only two were performed by independent raters (Johnson 2012; Markowitz 2008). Two studies controlled for therapist allegiance and contamination effects by using separate teams of therapists to deliver the different interventions (Beutler 2003; Markowitz 2008), but it was unclear if either study tested for contamination effects. One study routinely monitored therapist belief in and satisfaction with the treatment model selected and found this was comparable across the treatment groups (Beutler 2003). Risk of bias due to poor treatment fidelity was unclear in the other four studies, although Brown 2006 tested for therapist effects between and within treatment groups and reported it had no impact on the primary depression and substance use outcome variables. While all studies reported information on the number of treatment dropouts or treatment sessions attended, only one controlled for this variable in the analyses (Lydecker 2010).
Concurrent treatment
Only one study (Markowitz 2008) had concurrent pharmacotherapy as an exclusion criterion. None of the remaining studies reported on medication dose or adherence. For those that reported on pharmacotherapy, the main medication prescribed was antidepressants, with 22% to 98% of participants being prescribed an antidepressant during treatment (Brown 2006; Johnson 2012; Lydecker 2010; Rohde 2014), compared with only 1.1% to 2.7% of participants using medication to treat substance use (Johnson 2012; Lydecker 2010). The exception to this is the one study that included people with methadone‐maintained opiate dependence (Carpenter 2008). Few studies reported on the type or number of antidepressants prescribed, though when these were listed selective serotonin reuptake inhibitors (SSRls) or atypical antidepressants (Brown 2006) and lithium, aripiprazole, or quetiapine (Johnson 2012) were described as the most commonly used antidepressants. Only one study stratified the randomisation based on antidepressant use (Carpenter 2008). Five studies compared differences in antidepressant use between the treatment groups or controlled for antidepressant use in their analyses (Brown 2006; Carpenter 2008; Johnson 2012; Lydecker 2010; Rohde 2014), with two studies reporting significant differences between groups in use of antidepressants (Johnson 2012; Lydecker 2010).
One study had concurrent non‐study psychotherapy as an exclusion criterion (Markowitz 2008). A further two studies excluded people attending other psychotherapy beyond 12‐Step Community Addiction Meetings (Brown 2006; Lydecker 2010). It was unclear whether participants were permitted to attend adjunctive psychotherapy in two studies (Beutler 2003; Carpenter 2008), and the risk of other bias was high in the remaining two studies, as participants attended adjunctive therapy and attendance at this therapy was not consistent between the treatment arms (Johnson 2012; Rohde 2014).
Effects of interventions
See: Summary of findings for the main comparison Integrated CBT compared with Twelve Step Facilitation for co‐occurring depression and substance use disorders; Summary of findings 2 Interpersonal Psychotherapy for Depression (IPT‐D) compared with Other Psychological Interventions for co‐occurring depression and substance use disorders
Due to the heterogeneity of outcomes, only two small meta‐analyses could be conducted, followed by a narrative review of the remaining studies. See summary of findings Table for the main comparison for Integrated Cognitive Behavioural Therapy (ICBT) versus Twelve Step Facilitation (TSF); summary of findings Table 2 for Interpersonal Psychotherapy for Depression (IPT‐D) versus other psychological treatments.
Primary outcomes reported include depression score, substance use and treatment retention/adherence. No studies reported information on any of the secondary outcome variables specified in the original Cochrane Review research protocol (Hides 2011), including functioning, quality of life, anxiety symptoms or disorders or the global clinical severity of mental health disorders. No adverse effects linked to treatments delivered were reported.
1. Integrated Cognitive Behavioural Therapy (ICBT) versus Twelve Step Facilitation (TSF)
Two studies with 296 participants compared ICBT to TSF (Brown 2006; Lydecker 2010). Both studies recruited veterans experiencing alcohol, cannabinol and/or stimulant dependence and a major depressive diagnosis. Participants were predominately white males with a mean age of 48.3 (standard deviation (SD) = 7.8). Assessments were completed at post‐treatment and at three months, and six months later. Only one of the two studies assessed outcomes at 12 months post‐treatment (Lydecker 2010).
See: summary of findings Table for the main comparison.
Depression
See: Analysis 1.1 ;Analysis 1.2.
The meta‐analysis examining depression score at post‐treatment and at follow‐up consisted of 296 randomised participants.The meta‐analysis suggested that the ICBT group had higher depression scores, compared with the TSF group, at post‐treatment (mean difference (MD) 4.05, 95% confidence interval (CI) 1.43 to 6.66; 2 studies, 212 participants; Analysis 1.1), however, there did not appear to be any difference between the groups at six‐ to12‐month follow‐up (MD 1.53, 95% CI ‐1.73 to 4.79; 2 studies, 181 participants; Analysis 1.2; Figure 4) follow‐up. Heterogeneity was of no importance (I² = 0%, P = 0.91; I² = 0%, P = 0.44), respectively.

Comparison 1 Integrated CBT vs Twelve Step Facilitation, Outcome: Depression at 6‐12 months
Substance use
See: Analysis 1.3; Analysis 1.4.
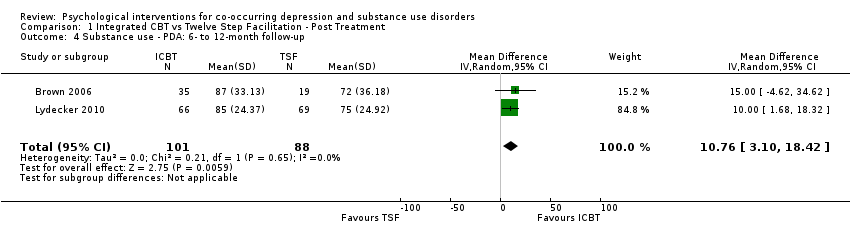
The meta‐analysis consisting of two studies (296 participants) that compared ICBT to TSF, suggested no substantial difference between the groups in proportion of days abstinent in the past three months, as assessed by the Timeline Follow Back (TLFB), at immediately post‐treatment (MD ‐2.84, 95% CI ‐8.04 to 2.35; 2 studies, 220 participants; Analysis 1.3). At six‐to 12‐month follow‐up, the ICBT group experienced on average 10.76% more days abstinent (95% CI 3.10 to 18.42; 2 studies, 189 participants; Analysis 1.4) compared with the TSF group (Figure 5). Heterogeneity was of no importance in either analysis (I² = 0%; P = 0.39; I² = 0%;P = .65), respectively.

Comparison 1 Integrated CBT vs Twelve Step Facilitation, Outcome: Percentage of Days Abstinent at 6 to 12 months.
Treatment attendance and retention
See: Analysis 1.5; Analysis 1.6
The meta‐analysis consisting of two studies (296 participants) that compared ICBT to TSF, revealed no substantial difference between the groups in treatment retention (RR 0.95, 95% CI 0.72 to 1.25; 2 studies, 270 participants; Analysis 1.5) or attendance (MD ‐1.27, 95% CI ‐6.10 to 3.56; 2 studies, 296 participants; Analysis 1.6). Heterogeneity was substantial for both analyses (I² = 74%, P = 0.05; I2 = 67%, P = 0.08).
2. Interpersonal Psychotherapy for Depression (IPT‐D) versus other psychological treatments
Two studies with 64 participants compared IPT‐D with other psychological treatments, one examining Brief Supportive Psychotherapy, with a sample of patients experiencing major depression/dysthymia and secondary alcohol abuse/dependence drawn from a medical college (n = 26; Markowitz 2008); and the other examining psychoeducation, with a sample of participants experiencing major depression and a substance use disorder (including alcohol, cocaine, opiate, marijuana and sedatives/hypnotics) drawn from a female prison (n = 38; Johnson 2012). Both samples were predominantly female (63%‐ to ‐100%), mostly white, with an average age of 36.4 (SD = 9.9).
See: summary of findings Table 2.
Depression
See: Analysis 2.1; Analysis 2.2.
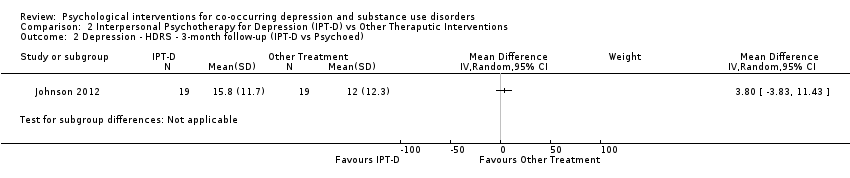
Two studies contributed 64 participants to end‐of‐treatment analyses (eight weeks/16 weeks), and one study (Johnson 2012) with 38 participants assessed three‐month post‐treatment effects. The common outcome measure used in both studies was the clinician‐rated Hamilton Rating Scale for Depression (HDRS) (17‐item and 24‐item scales were used). The end of treatment results, showed no important heterogeneity (I² = 0%; P = 0.54), and suggested participants receiving IPT‐D had lower depressive symptoms at post‐treatment than other treatment (Brief Supportive Psychotherapy/Psychoeducation; standardised mean difference (SMD) ‐0.54, 95% CI ‐1.04 to ‐0.04; I = 0%; 2 studies, 64 participants; Figure 6); however, there was no evidence that this effect was maintained at follow‐up (IPT‐D versus Psychoeducation; MD 3.80, 95% CI ‐3.83 to 11.43; 1 study, 38 participants).

Comparison 2 Interpersonal Psychotherapy for Depression (IPT‐D) vs Other Theraputic Interventions, Outcome: Depression at end of treatment.
Substance use
See: Analysis 2.3; Analysis 2.4.
Although both studies used the Timeline Follow‐Back (TLFB) (Sobell 1992; Sobell 1980), the method of reporting this substance use outcome differed between studies, with one study examining percentage of days abstinent in the month prior to the end of treatment (Markowitz 2008), and the other examining relapse at three months post‐treatment (defined as heavy drinking (4+ drinks) or drug use on at least 10% of non‐incarcerated days or positive urine test). Due to this heterogeneity, substance use outcomes were examined separately for each study. There was no significant difference in the percentage of days abstinent in the month prior to the end of treatment when comparing IPT‐D to Brief Supportive Psychotherapy (MD ‐2.70, 95% CI ‐28.74 to 23.34; 26 participants), and no significant difference in relapse at three months post‐treatment when comparing IPT‐D to Psychoeducation (RR 0.67, 95% CI 0.30 to 1.50;38 participants).
Treatment retention
See: Analysis 2.5.
For the meta‐analysis comparing IPT‐D with other treatment (Brief supportive psychotherapy/psychoeducation), there was no significant difference between the groups in treatment retention (RR 1.00, 95% CI 0.81 to 1.23; I2 = 0%; 2 studies 64 participants).
3. Integrated Functional Family Therapy (FFT) andCoping With Depression (CWD) versus sequenced FFT‐CWD; Integrated FFT and CWD versus sequenced CWD‐FFT
One study with 170 adolescents compared integrated FFT and CWD to sequential FFT followed by CWD, or CWD followed by FFT (Rohde 2014). Adolescents were aged 13 to 18 years, were predominately white (61%) males (88%) experiencing a depressive disorder (54% major depression) and comorbid substance use disorder, which was predominately a cannabis use disorder (94%), comorbid with alcohol use disorder (65%). For ease of comparison the combined treatment was compared with the sequential treatment on primary outcomes. The first row in each analysis compares integrated FFT and CWD versus sequenced FFT‐CWD; and the second row compares integrated FFT and CWD versus sequenced CWD‐FFT. Assessments were completed at post‐treatment (20 weeks) and six and 12 months later.
Depression
See: Analysis 3.1; Analysis 3.2.
The Children’s Depression Rating Scale‐Revised (CDRS‐R), a clinician‐rated depression tool for adolescents, adapted from the HDRS, was used for all comparisons (Poznanski 1995). The analyses reported in the article were separated based on whether or not an adolescent experienced Major Depressive Disorder. The authors were contacted, and scores were obtained and are reported for the total sample. There was no difference in depression scores between the integrated treatment and either of the sequential treatments (CWD‐FFT or FFT‐CWD) immediately post‐treatment (MD ‐3.60, 95% CI ‐8.76 to 1.56; MD ‐3.49, 95% CI ‐8.08 to 1.10) or at 12‐month follow‐up (MD ‐1.44, 95% CI ‐7.98 to 5.10; MD 0.13, 95% CI ‐6.72 to 6.98).
Substance use
See: Analysis 3.3; Analysis 3.4.
The TLFB interview was used (Miller 1994), with the square root of the percentage of past 90‐day daily use reported at all assessment points. The integrated group had higher daily substance use at post‐treatment when compared with the FFT‐CWD (MD 1.30, 95% CI 0.01 to 2.59) but not the CWD‐FFT (MD 0.60, 95% CI ‐0.69 to 1.89). At 12‐month follow‐up the integrated treatment had higher daily substance use than both the FFT‐CWD (MD 1.32, 95% CI 0.00 to 2.64) and the CWD‐FFT (MD 1.32, 95% CI 0.02 to 2.62) sequential groups.
Treatment retention
See: Analysis 3.5; Analysis 3.6.
Treatment adherence was assessed through premature termination (attending < 2 sessions) and mean total session attendance (maximum sessions 24). There was no difference between integrated or sequential treatment for treatment retention (RR 0.47, 95% CI 0.15 to 1.43; RR 0.66, 95% CI 0.20 to 2.12); however, integrated treatment had higher mean treatment attendance than CWD‐FFT (MD 4.10, 95% CI 0.98 to 7.22) but not FFT‐CWD (MD 1.40, 95% CI ‐1.58 to 4.38).
4. Behavioral Therapy for Depression in Drug Dependence (BTDD) versus Relaxation Intervention (REL)
One study with 38 participants on methadone maintenance therapy for opiate dependence, who met criteria for a DSM‐IV depressive disorder, compared BTDD with REL (Carpenter 2008). Participants were predominately white (58%) males (82%) with a mean age of 40.1 years (SD = 10.7). Assessments were completed immediately post‐treatment (24 weeks).
Depression
See: Analysis 4.1; Analysis 4.2.
The the HDRS clinician interview and Beck Depression Inventory (BDI‐II) self‐report measure (Beck 1996) were used to assess post‐treatment depression outcomes. Evidence suggested no difference in depression scores for participants receiving BTDD compared with REL, for either the clinician‐rated HDRS (MD 2.10, 95% CI ‐6.03 to 10.23; 24 participants) or the self‐reported BDI‐II (MD 6.60, 95% CI ‐4.94 to 18.14; 24 participants).
Substance use
See: Analysis 4.3; Analysis 4.4; Analysis 4.5.
The Substance Use Weekly Inventory (SUI), a modification of the TLFB (Sobell 1980), was used at the beginning of each treatment session to assess the past week number of substance‐using days, with substance use confirmed through a urine test. In the study results, proportion of weeks substances were used was only reported for opiates, cocaine and benzodiazepines. There were no significant differences in the proportion of weeks opiates (MD 0.11, 95% CI ‐0.09 to 0.31; 24 participants), cocaine (MD 0.10, 95% CI ‐0.13 to 0.33; 24 participants), and benzodiazepines (MD 0.02, 95% CI ‐0.21 to 0.25; 24 participants) were used throughout treatment.
Treatment retention
See: Analysis 4.6
Treatment adherence was examined through the average total session attendance (maximum sessions 24), with no significant difference between the two groups in treatment attendance (MD ‐3.70, 95% CI ‐7.83 to 0.43; 38 participants).
5. Cognitive Therapy (CT) versus Narrative Therapy (NT) versus Prescriptive Therapy (PT)
One study with 40 patients experiencing comorbid DSM‐IV depression disorder and stimulant (cocaine or methamphetamine) dependence, compared CT, NT and PT (Beutler 2003). Participants were predominately white (75%) males (57%) with a mean age of 33.1 years (SD = 1.83). Assessments were completed immediately post‐treatment (20 weeks) and six months post‐treatment. Given the very small sample size, and the multiple comparisons that would be required to be conducted between treatment conditions, a narrative review of findings is presented below.
Depression
Depression scores were assessed through the Beck Depression Inventory (BDI; Beck 1961) and the HDRS. No differences between treatments were reported on either of these measures.
Substance use
A modified TLFB (Sobell 1992) was used to assess past 30‐day mean days per week of reported substance use, the Addiction Severity Index (ASI; McLellan 1980) was used to create alcohol and drug index scores and urine samples were also conducted to determine abstinence of participants. There was no reported difference between treatment conditions for clean urine samples or reported abstinence, or on the TLFB or ASI.
Treatment retention
Dropout was assessed as failure to attend three consecutive appointments. The study reported that the NT condition had lower dropout rates than with PT or CT, but no other information was provided.
Discussion
Summary of main results
This review assessed the efficacy of psychological interventions alone or in combination with pharmacotherapy for comorbid depression and substance use disorders. Seven RCTs with a total of 608 participants were included. All studies compared different types of psychological interventions; no studies combining psychological interventions with pharmacotherapy; or comparing psychological interventions with no treatment, treatment as usual or delayed treatment control conditions were found.
Two studies compared Integrated Cognitive Behavioural Therapy (ICBT( with Twelve Step Facilitation (TSF), another two studies compared Interpersonal Psychotherapy for Depression (IPT‐D) with other treatment (Brief Supportive Therapy or Psychoeducation), a fifth study compared the integrated delivery of Functional Family Therapy (FFT) and Coping With Depression (CWD) with two sequenced methods (CWD then FFT; FFT then CWD), a sixth study compared Behavioral Therapy for Depression in Drug Dependence (BTDD) with a relaxation intervention, and the final study compared cognitive therapy (CT), narrative therapy (NT) and prescriptive therapy (PT).
Due to heterogeneity in outcomes only two meta‐analyses were conducted. The first meta‐analysis focused on the two studies comparing ICBT versus TSF (see summary of findings Table for the main comparison). Very low‐quality evidence indicated there was no difference in depression symptoms, treatment attendance or retention outcomes at post‐treatment or follow‐up, but a significant improvement in substance use outcomes in favour of the ICBT was found at six‐ to 12‐month follow‐up.
The second meta‐analysis, conducted with two studies, compared IPT‐D with other treatment (Brief Supportive Psychotherapy/Psychoeducation) (see summary of findings Table 2), and found very low‐quality evidence that IPT‐D resulted in lower depressive symptoms at post‐treatment than other treatment, but this effect was not maintained at three‐‐month follow‐up. No significant differences between the groups in treatment retention were found. Substance use was examined separately in each study due to heterogeneity in outcomes. No significant differences in these outcomes (percentage of days abstinent, risk of relapse) were found.
The two other studies, which compared different cognitive behavioural therapy (CBT) interventions (BTDD; CT) with other psychological treatments (Relaxation; NT or PT) found no significant differences on depression, substance use or treatment retention outcomes. The seventh study found integrated FFT and CWD had higher treatment attendance rates than the sequenced treatments but worse substance use outcomes but than the CWD‐FFT group at post‐treatment and both the CWD‐FFT and FFT‐CWD groups at 12‐month follow‐up.
Overall completeness and applicability of evidence
The seven studies identified are insufficient to address the objectives of this review. All included studies were conducted in the USA, which limits their applicability to other contexts. Moreover, the studies that were included in the meta‐analyses were from quite specific populations (i.e. veterans, incarcerated females), with a lack of variation in country source (i.e. all from the USA) or participant demographics (i.e. predominately Caucasian), which also questions the wider application of the findings.
It was difficult to compare the results of studies, as even though five studies compared CBT and two compared IPT‐D with other psychological interventions, there was wide variability in the type of CBT (e.g. cognitive therapy, behaviour therapy) and other psychological treatments compared, as well as the treatment target (depression, substance use, depression and substance use), content, intensity/length and mode of delivery (e.g. group, individual, family). There was also wide variability in the definitions and measures of depression, substance use outcomes use and treatment dropout/retention used across the seven studies. The treatment population also varied considerably ranging from veterans and female prisoners to community adults and adolescents potentially limiting the applicability of results to these particular populations. While requiring all study participants to have comorbid depression and substance use disorders strengthened the internal validity of the review, clinicians in real‐world settings treat only individuals with substance use and depression problems of varying severity, not only people with fully established disorders. Clinicians are also likely to treat individuals with other comorbid presentations (e.g. substance use, depression and anxiety problems). This limits the external validity of the review.
Quality of the evidence
All seven studies were at high risk of performance bias. Two of six studies were at high risk of selection bias due to inadequate random sequence generation (Brown 2006; Lydecker 2010). Two studies were at high risk for detection bias due to the use of non‐blinded interview raters (Carpenter 2008; Lydecker 2010). All four studies that reported self‐report outcomes were at unclear risk of detection bias (Beutler 2003; Carpenter 2008; Markowitz 2008; Rohde 2014) and four of the seven studies were at high risk of attrition bias (Beutler 2003; Brown 2006; Carpenter 2008; Markowitz 2008). Risk of selective reporting was unclear in all seven studies, as none had published research protocols. Due to heterogeneity in outcomes only two meta‐analyses were performed, each comprised of two studies.
The quality of evidence of the meta‐analysis comparing IPT‐D studies with other treatment (Brief Supportive Psychotherapy /Psychoeducation) was very low for assessing its impact on depression and for the substance use and treatment retention outcomes. The meta‐analysis comparing ICBT to TSF also provided very low‐quality evidence for all outcomes. Moreover, other methodological flaws in the seven studies included the use of small sample sizes (Brown 2006; Carpenter 2008; Johnson 2012; Markowitz 2008), the reporting of only post‐treatment outcomes (Beutler 2003; Carpenter 2008; Markowitz 2008) or short‐term outcomes (Johnson 2012), and the uneven group distribution of adjunctive treatment (both pharmacological and psychosocial). While all studies conducted treatment fidelity ratings, risk of bias was unclear in all but the two studies in which the fidelity ratings were performed by independent raters, and no studies tested for possible contamination effects in the control conditions.
Potential biases in the review process
There was low risk of publication bias, as a comprehensive search of published and unpublished studies without any language restrictions was conducted. Nevertheless, there is a chance some trials were missed during the search including unpublished studies, particularly those with negative results; as well as some studies in non‐English languages. A funnel plot to assess publication bias was not constructed due to the small number of studies. The authors of studies that did not report the data required to complete the review were contacted. All responded and provided the relevant data.
Agreements and disagreements with other studies or reviews
The findings of this review are consistent with other meta‐analyses and narrative systematic reviews of the literature, which have found insufficient empirical support to inform psychological treatments for comorbid substance use disorders and depression (Babowitch 2016; Baker 2012; Hesse 2009; Hobden 2018; Riper 2014). Previous reviews have focused on adolescent (Babowitch 2016) and adult (Baker 2012; Hesse 2009; Hobden 2018) populations, and on a wide variety of psychological treatments including CBT, FFT, IPT‐D and TSF. Most of the previous reviews found CBT to be the most popular therapy investigated, and all four of the reviews included studies with integrated motivational interviewing/CBT treatments, with one study only investigating the efficacy of motivational interviewing/CBT in treating comorbid alcohol use disorders and depression (Riper 2014).
Previous reviews have highlighted the promise of integrated approaches (Hesse 2009), particularly those that integrate motivational interviewing and CBT (Babowitch 2016; Baker 2012; Hobden 2018; Riper 2014). Small but significant effect sizes have been found for integrated motivational interviewing/CBT in both adolescent (Babowitch 2016) and adult (Baker 2012; Riper 2014) populations, with longer interventions shown to have greater improvements in mood and alcohol use outcomes (Baker 2012). Unfortunately, many of these studies only focused on alcohol misuse (Babowitch 2016; Baker 2012), examined comorbid depression and/or anxiety (Baker 2012; Hesse 2009), or included non‐randomised controlled trials (Hobden 2018; Riper 2014). No integrated motivational interviewing/CBT studies that meet the strict inclusion criteria of this review (i.e. randomised controlled trial, with diagnostic interviews to confirm presence of a substance use and depression disorder at study entry). Therefore, comments on the efficacy of integrated motivational interviewing/CBT treatments for comorbid substance use and depression disorders could not be made in this review.

Study flow diagram.

'Risk of bias' graph: review authors' judgements about each risk of bias item presented as percentages across all included studies.

'Risk of bias' summary: review authors' judgements about each risk of bias item for each included study.

Comparison 1 Integrated CBT vs Twelve Step Facilitation, Outcome: Depression at 6‐12 months

Comparison 1 Integrated CBT vs Twelve Step Facilitation, Outcome: Percentage of Days Abstinent at 6 to 12 months.

Comparison 2 Interpersonal Psychotherapy for Depression (IPT‐D) vs Other Theraputic Interventions, Outcome: Depression at end of treatment.

Comparison 1 Integrated CBT vs Twelve Step Facilitation ‐ Post Treatment, Outcome 1 Depression ‐ HDRS: end of treatment.

Comparison 1 Integrated CBT vs Twelve Step Facilitation ‐ Post Treatment, Outcome 2 Depression ‐ HDRS: 6‐ to 12‐month follow‐up.

Comparison 1 Integrated CBT vs Twelve Step Facilitation ‐ Post Treatment, Outcome 3 Substance use ‐ PDA: end of treatment.
Comparison 1 Integrated CBT vs Twelve Step Facilitation ‐ Post Treatment, Outcome 4 Substance use ‐ PDA: 6‐ to 12‐month follow‐up.

Comparison 1 Integrated CBT vs Twelve Step Facilitation ‐ Post Treatment, Outcome 5 Treatment retention.

Comparison 1 Integrated CBT vs Twelve Step Facilitation ‐ Post Treatment, Outcome 6 Treatment attendance.

Comparison 2 Interpersonal Psychotherapy for Depression (IPT‐D) vs Other Theraputic Interventions, Outcome 1 Depression ‐ HDRS: end of treatment.
Comparison 2 Interpersonal Psychotherapy for Depression (IPT‐D) vs Other Theraputic Interventions, Outcome 2 Depression ‐ HDRS ‐ 3‐month follow‐up (IPT‐D vs Psychoed).
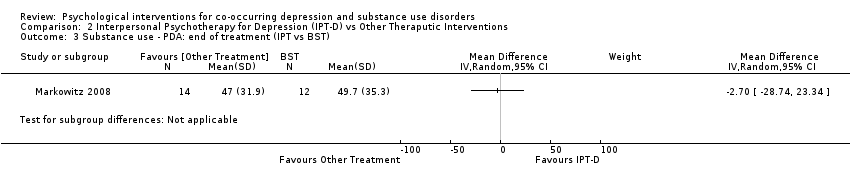
Comparison 2 Interpersonal Psychotherapy for Depression (IPT‐D) vs Other Theraputic Interventions, Outcome 3 Substance use ‐ PDA: end of treatment (IPT vs BST).
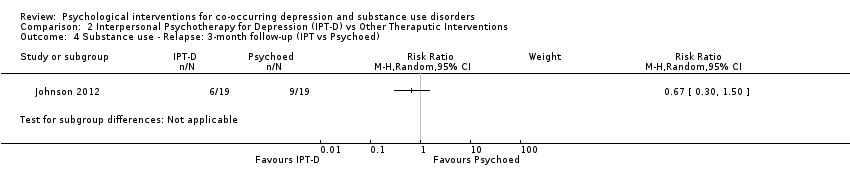
Comparison 2 Interpersonal Psychotherapy for Depression (IPT‐D) vs Other Theraputic Interventions, Outcome 4 Substance use ‐ Relapse: 3‐month follow‐up (IPT vs Psychoed).
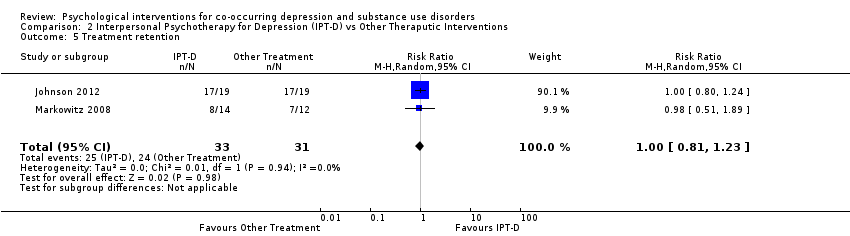
Comparison 2 Interpersonal Psychotherapy for Depression (IPT‐D) vs Other Theraputic Interventions, Outcome 5 Treatment retention.

Comparison 3 Combined FFT & CWD vs sequential FFT‐CWD; Combined FFT & CSD vs sequential CWD‐FFT, Outcome 1 Depression ‐ CDRS‐R: end of treatment.

Comparison 3 Combined FFT & CWD vs sequential FFT‐CWD; Combined FFT & CSD vs sequential CWD‐FFT, Outcome 2 Depression ‐ CDRS‐R: 12‐month follow‐up.

Comparison 3 Combined FFT & CWD vs sequential FFT‐CWD; Combined FFT & CSD vs sequential CWD‐FFT, Outcome 3 Substance use ‐ square root % daily use: end of treatment.

Comparison 3 Combined FFT & CWD vs sequential FFT‐CWD; Combined FFT & CSD vs sequential CWD‐FFT, Outcome 4 Substance use ‐ square root % daily use: 12‐month follow‐up.
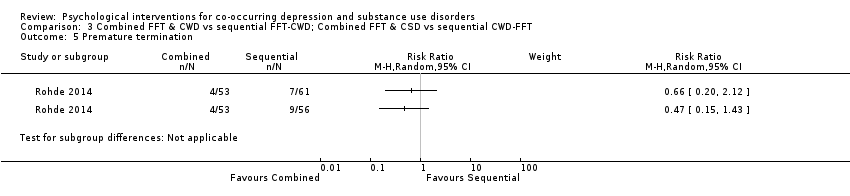
Comparison 3 Combined FFT & CWD vs sequential FFT‐CWD; Combined FFT & CSD vs sequential CWD‐FFT, Outcome 5 Premature termination.

Comparison 3 Combined FFT & CWD vs sequential FFT‐CWD; Combined FFT & CSD vs sequential CWD‐FFT, Outcome 6 Treatment attendance.

Comparison 4 Behavioral Therapy for Depression in Drug Dependence vs Relaxation intervention, Outcome 1 Depression ‐ HDRS: end of treatment.
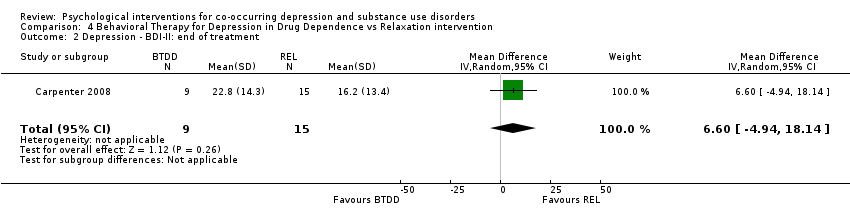
Comparison 4 Behavioral Therapy for Depression in Drug Dependence vs Relaxation intervention, Outcome 2 Depression ‐ BDI‐II: end of treatment.

Comparison 4 Behavioral Therapy for Depression in Drug Dependence vs Relaxation intervention, Outcome 3 Substance use ‐ Opiates: end of treatment.

Comparison 4 Behavioral Therapy for Depression in Drug Dependence vs Relaxation intervention, Outcome 4 Substance use ‐ Cocaine: end of treatment.

Comparison 4 Behavioral Therapy for Depression in Drug Dependence vs Relaxation intervention, Outcome 5 Substance use ‐ Benzodiazepines: end of treatment.

Comparison 4 Behavioral Therapy for Depression in Drug Dependence vs Relaxation intervention, Outcome 6 Treatment attendance.
| Integrated CBT compared with Twelve Step Facilitation for co‐occurring depression and substance use disorders | |||||||
| Patient or population: co‐occurring depression and substance use disorders | |||||||
| Outcomes | Anticipated absolute effects* (95% CI) | Relative effect | № of participants | Certainty of the evidence | Comments | ||
| Risk with Twelve Step Facilitation | Risk with Integrated CBT | ||||||
| Depression score | The mean depression score ranged from 21.0 to 23.2 | MD 4.05 higher | ‐ | 212 | ⊕⊝⊝⊝ | ||
| Depression score | The mean depression score ranged from 21.0 to 27.9 | MD 1.53 higher | ‐ | 181 | ⊕⊝⊝⊝ | ||
| Percent of days abstinent | The mean proportion of days abstinent ranged from 93 to 90 | MD 2.84 lower | ‐ | 220 | ⊕⊝⊝⊝ | ||
| Percent of days abstinent | The mean proportion of days abstinent ranged from 72 to 75 | MD 10.76 higher | ‐ | 189 | ⊕⊝⊝⊝ | ||
| Treatment retention | Moderate | RR 0.95 | 296 | ⊕⊝⊝⊝ | |||
| 785 per 1,000 | 745 per 1,000 | ||||||
| Number of treatment sessions attended | The mean number of Treatment Sessions Attended ranged from 19.4‐22.1 | MD 1.27 lower | ‐ | 270 | ⊕⊝⊝⊝ | ||
| *The risk in the intervention group (and its 95% confidence interval) is based on the assumed risk in the comparison group and the relative effect of the intervention (and its 95% CI). | |||||||
| GRADE Working Group grades of evidence | |||||||
| 1 Downgraded two levels due to very serious risk of bias: high levels of performance bias, attrition bias and uneven medication use between groups. One study also had high risk of selection bias and unclear risk for selective reporting. 2 Downgraded one level due to Imprecision: small number of trials/participants 3 Downgraded one level due to indirectness: population of predominately Caucasian male veterans 4 Downgraded two levels due to very serious risk of bias: high levels of selection bias, performance bias, attrition bias, unclear risk for selective reporting and uneven attendance between groups at 12‐step Community Meetings 5 Downgraded two levels due to very serious risk of bias: mean attendance was based on a reduced sample, not those originally randomised into the study. Also high risk of selection bias, performance bias and attrition bias | |||||||
| Interpersonal Psychotherapy for Depression (IPT‐D) compared with Other Psychological Interventions for co‐occurring depression and substance use disorders | ||||||
| Patient or population: Individuals experiencing co‐occurring depression and substance use disorders | ||||||
| Outcomes | Anticipated absolute effects* (95% CI) | Relative effect | № of participants | Certainty of the evidence | Comments | |
| Risk with Other Theraputic Interventions | Risk with Interpersonal Psychotherapy for Depression (IPT‐D) | |||||
| Depression score | SMD 0.54 SD lower | ‐ | 64 | ⊕⊝⊝⊝ | ||
| Depression score | The mean depression score was 15.8 | MD 3.80 higher | ‐ | 38 | ⊕⊝⊝⊝ | |
| Percentage of days abstinent | The mean percentage of days abstinent was 49.7 | MD 2.70 lower | ‐ | 26 | ⊕⊝⊝⊝ | |
| Substance use ‐ relapse | Study population | RR 0.67 | 38 | ⊕⊝⊝⊝ | ||
| 316 per 1,000 | 212 per 1,000 | |||||
| Treatment retention | Study population | RR 1.00 | 64 | ⊕⊝⊝⊝ | ||
| 774 per 1,000 | 744 per 1,000 | |||||
| *The risk in the intervention group (and its 95% confidence interval) is based on the assumed risk in the comparison group and the relative effect of the intervention (and its 95% CI). | ||||||
| GRADE Working Group grades of evidence | ||||||
| 1 Downgraded two levels due to serious risk of bias: high levels of performance bias due to difficulties with blinding participants and personnel, one of the studies also had high attrition bias and reported group differences in use of antidepressants and adjunctive mental health counselling 2 Downgraded one level due to indirectness: one of the study was based on a female prison population, the other were recruited through a medical college, neither sample is likely to be representative of broader population of individuals experience comorbid substance use and depressive disorders 3 Downgraded two levels due to very small sample size 4 Downgraded two levels due to serious risk of bias: high levels of performance bias due to difficulties with blinding participants and personnel and reported group differences in use of antidepressants and adjunctive mental health counselling 5 Downgraded one level due to indirectness: Female prison population unlikely to be representative of broader population of individuals experience comorbid substance use and depressive disorders 6 Downgraded two levels due to serious risk of bias: high levels of performance bias due to difficulties with blinding participants and personnel 7 Downgraded one level due to indirectness: sample recruited through a medical college, predominately White male, unlikely to be representative of broader population of individuals experience comorbid substance use and depressive disorders | ||||||
| Outcome or subgroup title | No. of studies | No. of participants | Statistical method | Effect size |
| 1 Depression ‐ HDRS: end of treatment Show forest plot | 2 | 212 | Mean Difference (IV, Random, 95% CI) | 4.05 [1.43, 6.66] |
| 2 Depression ‐ HDRS: 6‐ to 12‐month follow‐up Show forest plot | 2 | 181 | Mean Difference (IV, Random, 95% CI) | 1.53 [‐1.73, 4.79] |
| 3 Substance use ‐ PDA: end of treatment Show forest plot | 2 | 220 | Mean Difference (IV, Random, 95% CI) | ‐2.84 [‐8.04, 2.35] |
| 4 Substance use ‐ PDA: 6‐ to 12‐month follow‐up Show forest plot | 2 | 189 | Mean Difference (IV, Random, 95% CI) | 10.76 [3.10, 18.42] |
| 5 Treatment retention Show forest plot | 2 | 296 | Risk Ratio (M‐H, Random, 95% CI) | 0.95 [0.72, 1.25] |
| 6 Treatment attendance Show forest plot | 2 | 270 | Mean Difference (IV, Random, 95% CI) | ‐1.27 [‐6.10, 3.56] |
| Outcome or subgroup title | No. of studies | No. of participants | Statistical method | Effect size |
| 1 Depression ‐ HDRS: end of treatment Show forest plot | 2 | 64 | Std. Mean Difference (IV, Random, 95% CI) | ‐0.54 [‐1.04, ‐0.04] |
| 2 Depression ‐ HDRS ‐ 3‐month follow‐up (IPT‐D vs Psychoed) Show forest plot | 1 | Mean Difference (IV, Random, 95% CI) | Subtotals only | |
| 3 Substance use ‐ PDA: end of treatment (IPT vs BST) Show forest plot | 1 | Mean Difference (IV, Random, 95% CI) | Subtotals only | |
| 4 Substance use ‐ Relapse: 3‐month follow‐up (IPT vs Psychoed) Show forest plot | 1 | Risk Ratio (M‐H, Random, 95% CI) | Subtotals only | |
| 5 Treatment retention Show forest plot | 2 | 64 | Risk Ratio (M‐H, Random, 95% CI) | 1.00 [0.81, 1.23] |
| Outcome or subgroup title | No. of studies | No. of participants | Statistical method | Effect size |
| 1 Depression ‐ CDRS‐R: end of treatment Show forest plot | 1 | Mean Difference (IV, Random, 95% CI) | Subtotals only | |
| 2 Depression ‐ CDRS‐R: 12‐month follow‐up Show forest plot | 1 | Mean Difference (IV, Random, 95% CI) | Subtotals only | |
| 3 Substance use ‐ square root % daily use: end of treatment Show forest plot | 1 | Mean Difference (IV, Random, 95% CI) | Subtotals only | |
| 4 Substance use ‐ square root % daily use: 12‐month follow‐up Show forest plot | 1 | Mean Difference (IV, Random, 95% CI) | Subtotals only | |
| 5 Premature termination Show forest plot | 1 | Risk Ratio (M‐H, Random, 95% CI) | Subtotals only | |
| 6 Treatment attendance Show forest plot | 1 | Mean Difference (IV, Random, 95% CI) | Subtotals only | |
| Outcome or subgroup title | No. of studies | No. of participants | Statistical method | Effect size |
| 1 Depression ‐ HDRS: end of treatment Show forest plot | 1 | 24 | Mean Difference (IV, Random, 95% CI) | 2.10 [‐6.03, 10.23] |
| 2 Depression ‐ BDI‐II: end of treatment Show forest plot | 1 | 24 | Mean Difference (IV, Random, 95% CI) | 6.60 [‐4.94, 18.14] |
| 3 Substance use ‐ Opiates: end of treatment Show forest plot | 1 | 24 | Mean Difference (IV, Random, 95% CI) | 0.11 [‐0.09, 0.31] |
| 4 Substance use ‐ Cocaine: end of treatment Show forest plot | 1 | 24 | Mean Difference (IV, Random, 95% CI) | 0.1 [‐0.13, 0.33] |
| 5 Substance use ‐ Benzodiazepines: end of treatment Show forest plot | 1 | 24 | Mean Difference (IV, Random, 95% CI) | 0.02 [‐0.21, 0.25] |
| 6 Treatment attendance Show forest plot | 1 | 38 | Mean Difference (IV, Random, 95% CI) | ‐3.70 [‐7.83, 0.43] |