Psychological interventions for co‐occurring depression and substance use disorders
Appendices
Appendix 1. CENTRAL search strategy
#1 MeSH descriptor: [Mood Disorders] explode all trees
#2 affective or depression or "depressive disorder" or "mood disorder" or anxiety or dysthymic:ti,ab,kw (Word variations have been searched)
#3 #1 or #2
#4 MeSH descriptor: [Substance‐Related Disorders] explode all trees
#5 drug or substance or alcohol or marijuana or cannabis or meth‐amphetamine or dextro‐ or amphetamine or MDMA or heroin or narcotic or opiate or opioid or opium or ecstasy or methadone or cocaine or psychostimulant* or inhalant* or solvent*:ti,ab,kw and abus* or use* or misus* or usin* or utilis* or depend* or addict* or illegal* or illicit* or habit* or withdraw* or behavi* or abstinence* or abstain* or intoxica* or addict * or disorder*:ti,ab,kw (Word variations have been searched)
#6 #4 or #5
#7 MeSH descriptor: [Psychotherapy] explode all trees
#8 psychotherapy or counselling or behavior* or contigenc* or supportive or reinforcement or motivation* or incentive or "cognitive therapy" (Word variations have been searched)
#9 #7 or #8
#10 #3 and #6 and #9
Appendix 2. PubMed search strategy
-
mood disorders [mh]
-
affective[tw] OR depression[tw] OR "depressive disorder" [tw] OR "mood disorder"[tw] OR anxiety[tw] OR dysthymic[tw]
-
#1 OR #2
-
Substance‐related disorders [mh]
-
(( drug OR substance OR alcohol OR marijuana OR cannabis OR meth/dextro‐amphetamine OR amphetamine OR MDMA OR heroin OR narcotic OR opiate OR opioid or opium OR ecstasy OR methadone OR cocaine or psychostimulant* or inhalant* OR solvent* ) AND (abus* OR use* OR misus* OR usin* OR utilis* OR depend* OR addict* OR illegal* OR illicit* OR habit* OR withdraw* OR behavi* OR abstinence* OR abstain* OR intoxica* OR addict * or disorder*))
-
#5 OR #6
-
Psychotherapy [mh]
-
psychotherapy[tw] OR counselling[tw] OR behavior*[tw] OR contigenc*[tw] OR supportive[tw] OR reinforcement[tw] OR motivation*[tw] OR incentive[tw] OR "cognitive therapy"[tw]
-
#7 OR #8
-
randomized controlled trial [pt]
-
controlled clinical trial [pt]
-
randomized [tw]
-
placebo [tw]
-
clinical trials as topic [mesh: noexp]
-
randomly [tw]
-
trial [tw]
-
#10 OR #11 OR #12 OR #13 OR #14 OR #15 OR #16
-
animals [mh] NOT humans [mh]
-
#17 NOT #18
-
#3 AND #6 AND #9 AND #19
[pt] denotes a Publication Type term;
[tiab] denotes a word in the title or abstract;
[sh] denotes a subheading;
[mh] denotes a Medical Subject Heading (MeSH) term (‘exploded’);
[mesh: noexp] denotes a Medical Subject Heading (MeSH) term (not ‘exploded’);
[ti] denotes a word in the title;
[tw] denote text words across the record included in the title, abstract, MeSH, Publication Types or Substance Names
Appendix 3. Embase search strategy
Single syntax:
'mood disorders'/exp/mj OR affective OR depression OR 'depressive disorder' OR 'mood disorder' OR anxiety OR dysthymic AND 'substance‐related disorders'/exp/mj OR 'drug':ab,ti OR 'substance':ab,ti OR 'alcohol':ab,ti OR 'marijuana':ab,ti OR 'cannabis':ab,ti OR 'meth‐amphetamine':ab,ti OR 'dextro':ab,ti OR 'amphetamine':ab,ti OR 'mdma':ab,ti OR 'heroin':ab,ti OR 'narcotic':ab,ti OR 'opiate':ab,ti OR 'opioid':ab,ti OR 'opium':ab,ti OR 'ecstasy':ab,ti OR 'methadone':ab,ti OR 'cocaine':ab,ti OR 'psychostimulant*':ab,ti OR 'inhalant*':ab,ti OR 'solvent*':ab,ti AND ('abus*':ab,ti OR 'use*':ab,ti OR 'misus*':ab,ti OR 'usin*':ab,ti OR 'utilis*':ab,ti OR 'depend*':ab,ti OR 'illegal*':ab,ti OR 'illicit*':ab,ti OR 'habit*':ab,ti OR 'withdraw*':ab,ti OR 'behavi*':ab,ti OR 'abstinence*':ab,ti OR 'abstain*':ab,ti OR 'intoxica*':ab,ti OR 'addict*':ab,ti OR 'disorder*':ab,ti) AND 'psychotherapy'/exp/mj OR psychotherapy OR counselling OR behavior* OR contigenc* OR supportive OR reinforcement OR motivation* OR incentive OR 'cognitive therapy' AND randomized OR placebo OR randomly OR trial NOT animals NOT human AND ([controlled clinical trial]/lim OR [randomized controlled trial]/lim)
Appendix 4. CINAHL Search Strategy
| S20 | S3 AND S6 AND S9 AND S19 |
| S19 | S17 NOT S18 |
| S18 | TX animal* NOT TX human* |
| S17 | S10 OR S11 OR S12 OR S13 OR S14 OR S15 OR S16 |
| S16 | TX trial |
| S15 | TX randomly |
| S14 | SU clinical trial |
| S13 | TX placebo |
| S12 | TX randomized |
| S11 | PT clinical trial |
| S10 | PT randomized controlled trial |
| S9 | (TX psychotherapy OR counselling OR behavior* OR contigenc* OR supportive OR reinforcement OR motivation* OR incentive OR "cognitive therapy") AND (S7 OR S8) |
| S8 | TX psychotherapy OR counselling OR behavior* OR contigenc* OR supportive OR reinforcement OR motivation* OR incentive OR "cognitive therapy" |
| S7 | (MH "Psychotherapy+") OR (MH "Psychotherapy, Brief") OR (MH "Psychotherapy, Psychodynamic") OR (MH "Psychotherapy, Group+") OR (MH "Cognitive Therapy+") OR (MH "Equine‐Assisted Therapy") |
| S6 | (TX ( drug OR substance OR alcohol OR marijuana OR cannabis OR meth/dextro‐amphetamine OR amphetamine OR MDMA OR heroin OR narcotic OR opiate OR opioid or opium OR ecstasy OR methadone OR cocaine or psychostimulant* or inhalant* OR solvent* ) AND TX ( abus* OR use* OR misus* OR usin* OR utilis* OR depend* OR addict* OR illegal* OR illicit* OR habit* OR withdraw* OR behavi* OR abstinence* OR abstain* OR intoxica* OR addict* or disorder* )) AND (S4 OR S5) |
| S5 | TX ( drug OR substance OR alcohol OR marijuana OR cannabis OR meth/dextro‐amphetamine OR amphetamine OR MDMA OR heroin OR narcotic OR opiate OR opioid or opium OR ecstasy OR methadone OR cocaine or psychostimulant* or inhalant* OR solvent* ) AND TX ( abus* OR use* OR misus* OR usin* OR utilis* OR depend* OR addict* OR illegal* OR illicit* OR habit* OR withdraw* OR behavi* OR abstinence* OR abstain* OR intoxica* OR addict* or disorder* ) |
| S4 | (MH "Substance Use Disorders+") OR (MH "Organic Mental Disorders, Substance‐Induced+") OR (MH "Alcohol‐Related Disorders+") |
| S3 | (TX affective OR depression OR "depressive disorder" OR "mood disorder" OR anxiety OR dysthymic) AND (S1 OR S2) |
| S2 | TX affective OR depression OR "depressive disorder" OR "mood disorder" OR anxiety OR dysthymic |
| S1 | (MH "Affective Disorders+") |
Appendix 5. Criteria for 'Risk of bias' assessment
| Item | Judgment | Description |
| 1. Random sequence generation (selection bias) | Low risk | The investigators describe a random component in the sequence generation process such as: random number table; computer random number generator; coin tossing; shuffling cards or envelopes; throwing dice; drawing of lots; minimisation. |
| High risk | The investigators describe a non‐random component in the sequence generation process such as: odd or even date of birth; date (or day) of admission; hospital or clinic record number; alternation; judgement of the clinician; results of a laboratory test or a series of tests; availability of the intervention. | |
| Unclear risk | Insufficient information about the sequence generation process to permit judgement of low or high risk. | |
| 2. Allocation concealment (selection bias) | Low risk | Investigators enrolling participants could not foresee assignment because one of the following, or an equivalent method, was used to conceal allocation: central allocation (including telephone, web‐based, and pharmacy‐controlled, randomisation); sequentially numbered drug containers of identical appearance; sequentially numbered, opaque, sealed envelopes. |
| high risk | Investigators enrolling participants could possibly foresee assignments because one of the following method was used: open random allocation schedule (e.g. a list of random numbers); assignment envelopes without appropriate safeguards (e.g. if envelopes were unsealed or nonopaque or not sequentially numbered); alternation or rotation; date of birth; case record number; any other explicitly unconcealed procedure. | |
| Unclear risk | Insufficient information to permit judgement of low or high risk This is usually the case if the method of concealment is not described or not described in sufficient detail to allow a definite judgement. | |
| 3. Blinding of participants and providers (performance bias) Objective outcomes | low risk | No blinding or incomplete blinding, but the review authors judge that the outcome is not likely to be influenced by lack of blinding. Blinding of participants and key study personnel ensured, and unlikely that the blinding could have been broken. |
| High risk | No blinding or incomplete blinding, and the outcome is likely to be influenced by lack of blinding. Blinding of key study participants and personnel attempted, but likely that the blinding could have been broken, and the outcome is likely to be influenced by lack of blinding. | |
| Unclear risk | Insufficient information to permit judgement of low or high risk. | |
| 4. Blinding of participants and providers (performance bias) Subjective outcomes | Low risk | Blinding of participants and providers ensured and unlikely that the blinding could have been broken. |
| High risk | No blinding or incomplete blinding, and the outcome is likely to be influenced by lack of blinding. Blinding of key study participants and personnel attempted, but likely that the blinding could have been broken, and the outcome is likely to be influenced by lack of blinding. | |
| Unclear risk | Insufficient information to permit judgement of low or high risk. | |
| 5. Blinding of outcome assessor (detection bias) Objective outcomes | Low risk | No blinding of outcome assessment, but the review authors judge that the outcome measurement is not likely to be influenced by lack of blinding. Blinding of outcome assessment ensured, and unlikely that the blinding could have been broken. |
| High risk | No blinding of outcome assessment, and the outcome measurement is likely to be influenced by lack of blinding. Blinding of outcome assessment, but likely that the blinding could have been broken, and the outcome measurement is likely to be influenced by lack of blinding | |
| Unclear risk | Insufficient information to permit judgement of low or high risk. | |
| 6.Blinding of outcome assessor (detection bias) Subjective outcomes | Low risk | Blinding of outcome assessment ensured, and unlikely that the blinding could have been broken. |
| high risk | No blinding of outcome assessment, and the outcome measurement is likely to be influenced by lack of blinding. Blinding of outcome assessment, but likely that the blinding could have been broken, and the outcome measurement is likely to be influenced by lack of blinding. | |
| Unclear risk | Insufficient information to permit judgement of low or high risk. | |
| 7. Incomplete outcome data (attrition bias) For all outcomes except retention in treatment or drop out | Low risk | No missing outcome data. Reasons for missing outcome data unlikely to be related to true outcome (for survival data, censoring unlikely to be introducing bias). Missing outcome data balanced in numbers across intervention groups, with similar reasons for missing data across groups. For dichotomous outcome data, the proportion of missing outcomes compared with observed event risk not enough to have a clinically relevant impact on the intervention effect estimate. For continuous outcome data, plausible effect size (difference in means or standardised difference in means) among missing outcomes not enough to have a clinically relevant impact on observed effect size. Missing data have been imputed using appropriate methods. All randomised patients are reported/analysed in the group they were allocated to by randomisation irrespective of non‐compliance and co‐interventions (intention to treat). |
| High risk | Reason for missing outcome data likely to be related to true outcome, with either imbalance in numbers or reasons for missing data across intervention groups. For dichotomous outcome data, the proportion of missing outcomes compared with observed event risk enough to induce clinically relevant bias in intervention effect estimate. For continuous outcome data, plausible effect size (difference in means or standardised difference in means) among missing outcomes enough to induce clinically relevant bias in observed effect size. ‘As‐treated’ analysis done with substantial departure of the intervention received from that assigned at randomisation. | |
| Unclear risk | Insufficient information to permit judgement of low or high risk (e.g. number randomised not stated, no reasons for missing data provided; number of drop out not reported for each group). | |
| 8. Selective reporting (reporting bias) | Low risk | The study protocol is available and all of the study’s pre‐specified (primary and secondary) outcomes that are of interest in the review have been reported in the pre‐specified way. The study protocol is not available but it is clear that the published reports include all expected outcomes, including those that were pre‐specified (convincing text of this nature may be uncommon). |
| High risk | Not all of the study’s pre‐specified primary outcomes have been reported. One or more primary outcomes is reported using measurements, analysis methods or subsets of the data (e.g. subscales) that were not pre‐specified. One or more reported primary outcomes were not pre‐specified (unless clear justification for their reporting is provided, such as an unexpected adverse effect). One or more outcomes of interest in the review are reported incompletely so that they cannot be entered in a meta‐analysis. The study report fails to include results for a key outcome that would be expected to have been reported for such a study. | |
| Unclear risk | Insufficient information to permit judgement of low or high risk. | |
| 9. Other bias (treatment fidelity, completeness and contamination adequately addressed) | Low risk | The number of sessions and treatment components delivered were reported; Treatment fidelity was assessed by an independent rater; The content of separate treatments was compared for cross‐contamination effects. Separate therapists delivered different treatments to avoid cross‐contamination. |
| High risk | Treatment completeness, fidelity and contamination not assessed. | |
| Unclear risk | Insufficient information to permit judgement. This is usually the case if treatment fidelity was assessed by non‐independent raters or if treatment completeness, fidelity and contamination were assessed but not described or not described in sufficient detail to allow a definite judgement. |

Study flow diagram.

'Risk of bias' graph: review authors' judgements about each risk of bias item presented as percentages across all included studies.

'Risk of bias' summary: review authors' judgements about each risk of bias item for each included study.

Comparison 1 Integrated CBT vs Twelve Step Facilitation, Outcome: Depression at 6‐12 months

Comparison 1 Integrated CBT vs Twelve Step Facilitation, Outcome: Percentage of Days Abstinent at 6 to 12 months.

Comparison 2 Interpersonal Psychotherapy for Depression (IPT‐D) vs Other Theraputic Interventions, Outcome: Depression at end of treatment.

Comparison 1 Integrated CBT vs Twelve Step Facilitation ‐ Post Treatment, Outcome 1 Depression ‐ HDRS: end of treatment.

Comparison 1 Integrated CBT vs Twelve Step Facilitation ‐ Post Treatment, Outcome 2 Depression ‐ HDRS: 6‐ to 12‐month follow‐up.

Comparison 1 Integrated CBT vs Twelve Step Facilitation ‐ Post Treatment, Outcome 3 Substance use ‐ PDA: end of treatment.
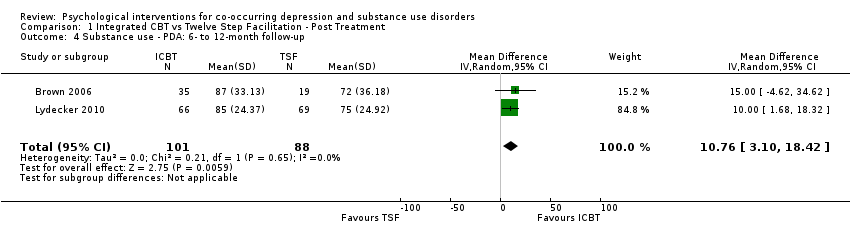
Comparison 1 Integrated CBT vs Twelve Step Facilitation ‐ Post Treatment, Outcome 4 Substance use ‐ PDA: 6‐ to 12‐month follow‐up.

Comparison 1 Integrated CBT vs Twelve Step Facilitation ‐ Post Treatment, Outcome 5 Treatment retention.

Comparison 1 Integrated CBT vs Twelve Step Facilitation ‐ Post Treatment, Outcome 6 Treatment attendance.

Comparison 2 Interpersonal Psychotherapy for Depression (IPT‐D) vs Other Theraputic Interventions, Outcome 1 Depression ‐ HDRS: end of treatment.
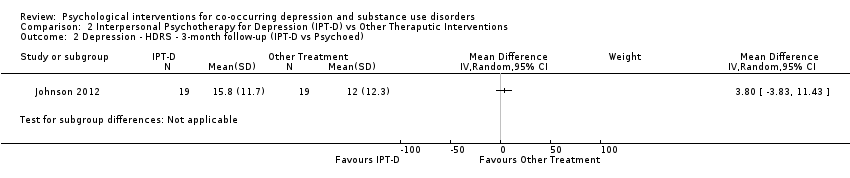
Comparison 2 Interpersonal Psychotherapy for Depression (IPT‐D) vs Other Theraputic Interventions, Outcome 2 Depression ‐ HDRS ‐ 3‐month follow‐up (IPT‐D vs Psychoed).
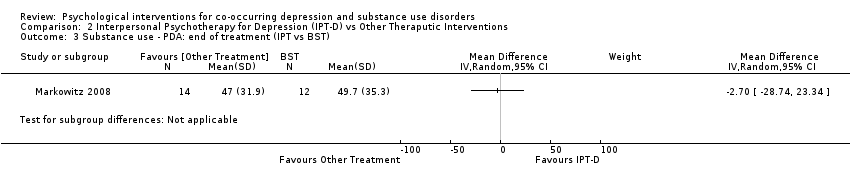
Comparison 2 Interpersonal Psychotherapy for Depression (IPT‐D) vs Other Theraputic Interventions, Outcome 3 Substance use ‐ PDA: end of treatment (IPT vs BST).
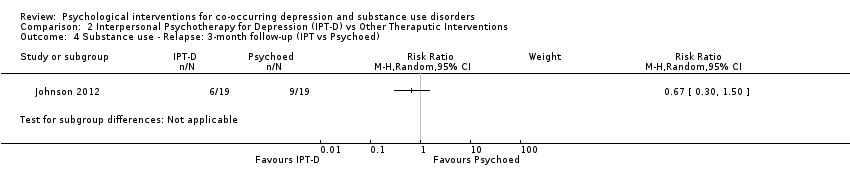
Comparison 2 Interpersonal Psychotherapy for Depression (IPT‐D) vs Other Theraputic Interventions, Outcome 4 Substance use ‐ Relapse: 3‐month follow‐up (IPT vs Psychoed).
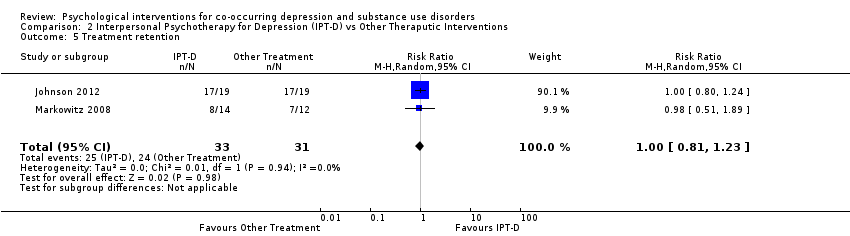
Comparison 2 Interpersonal Psychotherapy for Depression (IPT‐D) vs Other Theraputic Interventions, Outcome 5 Treatment retention.

Comparison 3 Combined FFT & CWD vs sequential FFT‐CWD; Combined FFT & CSD vs sequential CWD‐FFT, Outcome 1 Depression ‐ CDRS‐R: end of treatment.

Comparison 3 Combined FFT & CWD vs sequential FFT‐CWD; Combined FFT & CSD vs sequential CWD‐FFT, Outcome 2 Depression ‐ CDRS‐R: 12‐month follow‐up.

Comparison 3 Combined FFT & CWD vs sequential FFT‐CWD; Combined FFT & CSD vs sequential CWD‐FFT, Outcome 3 Substance use ‐ square root % daily use: end of treatment.

Comparison 3 Combined FFT & CWD vs sequential FFT‐CWD; Combined FFT & CSD vs sequential CWD‐FFT, Outcome 4 Substance use ‐ square root % daily use: 12‐month follow‐up.
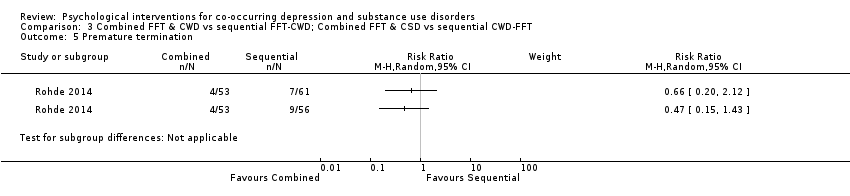
Comparison 3 Combined FFT & CWD vs sequential FFT‐CWD; Combined FFT & CSD vs sequential CWD‐FFT, Outcome 5 Premature termination.

Comparison 3 Combined FFT & CWD vs sequential FFT‐CWD; Combined FFT & CSD vs sequential CWD‐FFT, Outcome 6 Treatment attendance.

Comparison 4 Behavioral Therapy for Depression in Drug Dependence vs Relaxation intervention, Outcome 1 Depression ‐ HDRS: end of treatment.
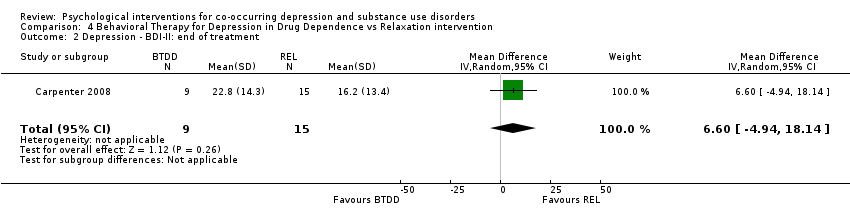
Comparison 4 Behavioral Therapy for Depression in Drug Dependence vs Relaxation intervention, Outcome 2 Depression ‐ BDI‐II: end of treatment.

Comparison 4 Behavioral Therapy for Depression in Drug Dependence vs Relaxation intervention, Outcome 3 Substance use ‐ Opiates: end of treatment.

Comparison 4 Behavioral Therapy for Depression in Drug Dependence vs Relaxation intervention, Outcome 4 Substance use ‐ Cocaine: end of treatment.

Comparison 4 Behavioral Therapy for Depression in Drug Dependence vs Relaxation intervention, Outcome 5 Substance use ‐ Benzodiazepines: end of treatment.

Comparison 4 Behavioral Therapy for Depression in Drug Dependence vs Relaxation intervention, Outcome 6 Treatment attendance.
| Integrated CBT compared with Twelve Step Facilitation for co‐occurring depression and substance use disorders | |||||||
| Patient or population: co‐occurring depression and substance use disorders | |||||||
| Outcomes | Anticipated absolute effects* (95% CI) | Relative effect | № of participants | Certainty of the evidence | Comments | ||
| Risk with Twelve Step Facilitation | Risk with Integrated CBT | ||||||
| Depression score | The mean depression score ranged from 21.0 to 23.2 | MD 4.05 higher | ‐ | 212 | ⊕⊝⊝⊝ | ||
| Depression score | The mean depression score ranged from 21.0 to 27.9 | MD 1.53 higher | ‐ | 181 | ⊕⊝⊝⊝ | ||
| Percent of days abstinent | The mean proportion of days abstinent ranged from 93 to 90 | MD 2.84 lower | ‐ | 220 | ⊕⊝⊝⊝ | ||
| Percent of days abstinent | The mean proportion of days abstinent ranged from 72 to 75 | MD 10.76 higher | ‐ | 189 | ⊕⊝⊝⊝ | ||
| Treatment retention | Moderate | RR 0.95 | 296 | ⊕⊝⊝⊝ | |||
| 785 per 1,000 | 745 per 1,000 | ||||||
| Number of treatment sessions attended | The mean number of Treatment Sessions Attended ranged from 19.4‐22.1 | MD 1.27 lower | ‐ | 270 | ⊕⊝⊝⊝ | ||
| *The risk in the intervention group (and its 95% confidence interval) is based on the assumed risk in the comparison group and the relative effect of the intervention (and its 95% CI). | |||||||
| GRADE Working Group grades of evidence | |||||||
| 1 Downgraded two levels due to very serious risk of bias: high levels of performance bias, attrition bias and uneven medication use between groups. One study also had high risk of selection bias and unclear risk for selective reporting. 2 Downgraded one level due to Imprecision: small number of trials/participants 3 Downgraded one level due to indirectness: population of predominately Caucasian male veterans 4 Downgraded two levels due to very serious risk of bias: high levels of selection bias, performance bias, attrition bias, unclear risk for selective reporting and uneven attendance between groups at 12‐step Community Meetings 5 Downgraded two levels due to very serious risk of bias: mean attendance was based on a reduced sample, not those originally randomised into the study. Also high risk of selection bias, performance bias and attrition bias | |||||||
| Interpersonal Psychotherapy for Depression (IPT‐D) compared with Other Psychological Interventions for co‐occurring depression and substance use disorders | ||||||
| Patient or population: Individuals experiencing co‐occurring depression and substance use disorders | ||||||
| Outcomes | Anticipated absolute effects* (95% CI) | Relative effect | № of participants | Certainty of the evidence | Comments | |
| Risk with Other Theraputic Interventions | Risk with Interpersonal Psychotherapy for Depression (IPT‐D) | |||||
| Depression score | SMD 0.54 SD lower | ‐ | 64 | ⊕⊝⊝⊝ | ||
| Depression score | The mean depression score was 15.8 | MD 3.80 higher | ‐ | 38 | ⊕⊝⊝⊝ | |
| Percentage of days abstinent | The mean percentage of days abstinent was 49.7 | MD 2.70 lower | ‐ | 26 | ⊕⊝⊝⊝ | |
| Substance use ‐ relapse | Study population | RR 0.67 | 38 | ⊕⊝⊝⊝ | ||
| 316 per 1,000 | 212 per 1,000 | |||||
| Treatment retention | Study population | RR 1.00 | 64 | ⊕⊝⊝⊝ | ||
| 774 per 1,000 | 744 per 1,000 | |||||
| *The risk in the intervention group (and its 95% confidence interval) is based on the assumed risk in the comparison group and the relative effect of the intervention (and its 95% CI). | ||||||
| GRADE Working Group grades of evidence | ||||||
| 1 Downgraded two levels due to serious risk of bias: high levels of performance bias due to difficulties with blinding participants and personnel, one of the studies also had high attrition bias and reported group differences in use of antidepressants and adjunctive mental health counselling 2 Downgraded one level due to indirectness: one of the study was based on a female prison population, the other were recruited through a medical college, neither sample is likely to be representative of broader population of individuals experience comorbid substance use and depressive disorders 3 Downgraded two levels due to very small sample size 4 Downgraded two levels due to serious risk of bias: high levels of performance bias due to difficulties with blinding participants and personnel and reported group differences in use of antidepressants and adjunctive mental health counselling 5 Downgraded one level due to indirectness: Female prison population unlikely to be representative of broader population of individuals experience comorbid substance use and depressive disorders 6 Downgraded two levels due to serious risk of bias: high levels of performance bias due to difficulties with blinding participants and personnel 7 Downgraded one level due to indirectness: sample recruited through a medical college, predominately White male, unlikely to be representative of broader population of individuals experience comorbid substance use and depressive disorders | ||||||
| Outcome or subgroup title | No. of studies | No. of participants | Statistical method | Effect size |
| 1 Depression ‐ HDRS: end of treatment Show forest plot | 2 | 212 | Mean Difference (IV, Random, 95% CI) | 4.05 [1.43, 6.66] |
| 2 Depression ‐ HDRS: 6‐ to 12‐month follow‐up Show forest plot | 2 | 181 | Mean Difference (IV, Random, 95% CI) | 1.53 [‐1.73, 4.79] |
| 3 Substance use ‐ PDA: end of treatment Show forest plot | 2 | 220 | Mean Difference (IV, Random, 95% CI) | ‐2.84 [‐8.04, 2.35] |
| 4 Substance use ‐ PDA: 6‐ to 12‐month follow‐up Show forest plot | 2 | 189 | Mean Difference (IV, Random, 95% CI) | 10.76 [3.10, 18.42] |
| 5 Treatment retention Show forest plot | 2 | 296 | Risk Ratio (M‐H, Random, 95% CI) | 0.95 [0.72, 1.25] |
| 6 Treatment attendance Show forest plot | 2 | 270 | Mean Difference (IV, Random, 95% CI) | ‐1.27 [‐6.10, 3.56] |
| Outcome or subgroup title | No. of studies | No. of participants | Statistical method | Effect size |
| 1 Depression ‐ HDRS: end of treatment Show forest plot | 2 | 64 | Std. Mean Difference (IV, Random, 95% CI) | ‐0.54 [‐1.04, ‐0.04] |
| 2 Depression ‐ HDRS ‐ 3‐month follow‐up (IPT‐D vs Psychoed) Show forest plot | 1 | Mean Difference (IV, Random, 95% CI) | Subtotals only | |
| 3 Substance use ‐ PDA: end of treatment (IPT vs BST) Show forest plot | 1 | Mean Difference (IV, Random, 95% CI) | Subtotals only | |
| 4 Substance use ‐ Relapse: 3‐month follow‐up (IPT vs Psychoed) Show forest plot | 1 | Risk Ratio (M‐H, Random, 95% CI) | Subtotals only | |
| 5 Treatment retention Show forest plot | 2 | 64 | Risk Ratio (M‐H, Random, 95% CI) | 1.00 [0.81, 1.23] |
| Outcome or subgroup title | No. of studies | No. of participants | Statistical method | Effect size |
| 1 Depression ‐ CDRS‐R: end of treatment Show forest plot | 1 | Mean Difference (IV, Random, 95% CI) | Subtotals only | |
| 2 Depression ‐ CDRS‐R: 12‐month follow‐up Show forest plot | 1 | Mean Difference (IV, Random, 95% CI) | Subtotals only | |
| 3 Substance use ‐ square root % daily use: end of treatment Show forest plot | 1 | Mean Difference (IV, Random, 95% CI) | Subtotals only | |
| 4 Substance use ‐ square root % daily use: 12‐month follow‐up Show forest plot | 1 | Mean Difference (IV, Random, 95% CI) | Subtotals only | |
| 5 Premature termination Show forest plot | 1 | Risk Ratio (M‐H, Random, 95% CI) | Subtotals only | |
| 6 Treatment attendance Show forest plot | 1 | Mean Difference (IV, Random, 95% CI) | Subtotals only | |
| Outcome or subgroup title | No. of studies | No. of participants | Statistical method | Effect size |
| 1 Depression ‐ HDRS: end of treatment Show forest plot | 1 | 24 | Mean Difference (IV, Random, 95% CI) | 2.10 [‐6.03, 10.23] |
| 2 Depression ‐ BDI‐II: end of treatment Show forest plot | 1 | 24 | Mean Difference (IV, Random, 95% CI) | 6.60 [‐4.94, 18.14] |
| 3 Substance use ‐ Opiates: end of treatment Show forest plot | 1 | 24 | Mean Difference (IV, Random, 95% CI) | 0.11 [‐0.09, 0.31] |
| 4 Substance use ‐ Cocaine: end of treatment Show forest plot | 1 | 24 | Mean Difference (IV, Random, 95% CI) | 0.1 [‐0.13, 0.33] |
| 5 Substance use ‐ Benzodiazepines: end of treatment Show forest plot | 1 | 24 | Mean Difference (IV, Random, 95% CI) | 0.02 [‐0.21, 0.25] |
| 6 Treatment attendance Show forest plot | 1 | 38 | Mean Difference (IV, Random, 95% CI) | ‐3.70 [‐7.83, 0.43] |