| Integrated CBT compared with Twelve Step Facilitation for co‐occurring depression and substance use disorders |
| Patient or population: co‐occurring depression and substance use disorders
Setting:
Intervention: Integrated CBT
Comparison: Twelve Step Facilitation |
| Depression score
Assessed with: Hamilton Depression Rating Scale (HDRS) ‐ Structured clinical interview (21 items)
Scale from: 0 to 54 (higher score worse)
Follow‐up: end of treatment | The mean depression score ranged from 21.0 to 23.2 | | MD 4.05 higher
(1.43 higher to 6.66 higher) | ‐ | 212
(2 RCTs) | ⊕⊝⊝⊝
VERY LOW 1 2 3 | |
| Depression score
Assessed with: Hamilton Depression Rating Scale (HDRS) ‐ Structured clinical interview (21 items)
Scale from: 0 to 54 (higher score worse)
Follow‐up: 6 months to 12 months | The mean depression score ranged from 21.0 to 27.9 | | MD 1.53 higher
(1.73 lower to 4.79 higher) | ‐ | 181
(2 RCTs) | ⊕⊝⊝⊝
VERY LOW 1 2 3 | |
| Percent of days abstinent
Assessed with: The calendar‐assisted structured interview ‐ Time‐Line Follow‐Back (TLFB) for past 3‐month substance use
Scale from: 0 to 100 (lower score better)
Follow‐up: end of treatment | The mean proportion of days abstinent ranged from 93 to 90 | | MD 2.84 lower
(8.04 lower to 2.35 higher) | ‐ | 220
(2 RCTs) | ⊕⊝⊝⊝
VERY LOW 1 2 3 | |
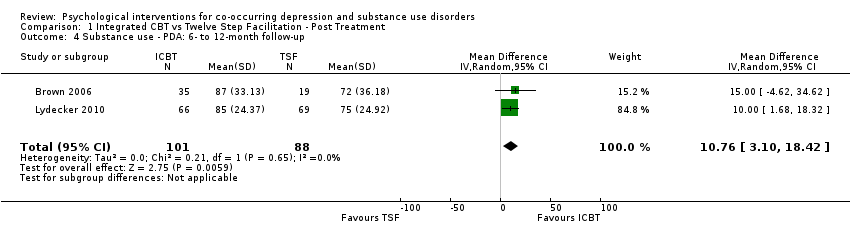
| Percent of days abstinent
Assessed with: TLFB for past 3‐month substance use
Scale from: 0 to 100 (lower score better)
Follow‐up: 6 months to 12 months | The mean proportion of days abstinent ranged from 72 to 75 | | MD 10.76 higher
(3.10 higher to 18.42 higher) | ‐ | 189
(2 RCTs) | ⊕⊝⊝⊝
VERY LOW 2 3 4 | |
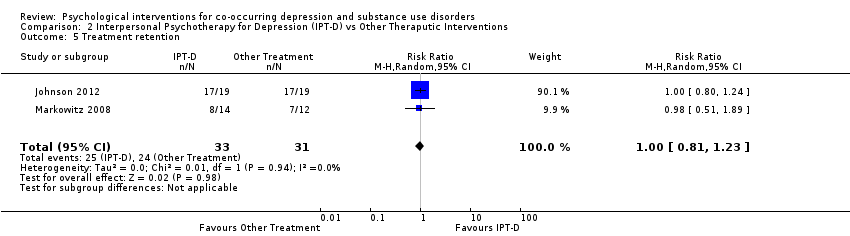
| Treatment retention
Assessed with: dropped out of treatment after attending an average of 1.2 sessions | Moderate | RR 0.95
(0.72 to 1.25) | 296
(2 RCTs) | ⊕⊝⊝⊝
VERY LOW 1 2 3 | |
| 785 per 1,000 | | 745 per 1,000
(565 to 981) |
| Number of treatment sessions attended
Scale from: 0 to 36 | The mean number of Treatment Sessions Attended ranged from 19.4‐22.1 | | MD 1.27 lower
(6.10 lower to 3.56 higher) | ‐ | 270
(2 RCTs) | ⊕⊝⊝⊝
VERY LOW 2 3 5 | |
| *The risk in the intervention group (and its 95% confidence interval) is based on the assumed risk in the comparison group and the relative effect of the intervention (and its 95% CI).
CI: Confidence interval; MD: mean difference; RR: Risk ratio |
| GRADE Working Group grades of evidence
High certainty: we are very confident that the true effect lies close to that of the estimate of the effect
Moderate certainty: we are moderately confident in the effect estimate. The true effect is likely to be close to the estimate of the effect, but there is a possibility that it is substantially different
Low certainty: our confidence in the effect estimate is limited. The true effect may be substantially different from the estimate of the effect
Very low certainty: we have very little confidence in the effect estimate. The true effect is likely to be substantially different from the estimate of effect |