Inicio escolar tardío para el apoyo de la educación, la salud y el bienestar de alumnos de educación secundaria
Información
- DOI:
- https://doi.org/10.1002/14651858.CD009467.pub2Copiar DOI

- Base de datos:
-
- Cochrane Database of Systematic Reviews
- Versión publicada:
-
- 03 julio 2017see what's new
- Tipo:
-
- Intervention
- Etapa:
-
- Review
- Grupo Editorial Cochrane:
-
Grupo Cochrane de Salud pública
- Copyright:
-
- Copyright © 2017 The Cochrane Collaboration. Published by John Wiley & Sons, Ltd.
Cifras del artículo
Altmetric:
Citado por:
Autores
Contributions of authors
RM led the final round of the review. He assessed documents for inclusion and exclusion, extracted study findings, critically appraised the studies, led the meta‐analysis, and led the writing of the final review.
ETS assessed documents for inclusion and exclusion, extracted study findings, critically appraised the studies, assisted with the meta‐analysis, and edited the review.
CMD led the initial round of the review. She contributed to the development of the search strategy, undertook Internet and hand searches, assessed documents for inclusion and exclusion, assessed the unit of analysis issues and led initial drafts of the review.
L‐AU led the development of the search strategy and undertook the electronic database searches, she wrote a section of the review methods and edited drafts of the report.
JF led the 'Risk of bias' assessment and reviewed and edited the review.
RS led the meta‐analysis, populated some of the 'Summary of findings' table and conducted a portion of the 'Risk of bias' assessments.
LN wrote the review background, assisted with the handsearches, assessed documents for inclusion and exclusion, and reviewed and edited the review.
RB provided advisory support and reviewed and edited the review document.
AP assessed documents for inclusion and exclusion, extracted data, and contributed to writing the review.
IC assessed documents for inclusion and exclusion, extracted data, and contributed to writing of review.
SH conducted several rounds of electronic database searches.
Sources of support
Internal sources
-
Toronto District School Board, Canada.
In‐kind time for LN and RB.
-
Department of Public Health Sciences, Canada.
In‐kind office support for CMD, IC and AP.
External sources
-
Canadian Institutes of Health Research and the Population Health Intervention Research Network., Canada.
Salary support for CMD.
-
Campbell Collaboration, Education Coordinating Group Systematic Review Grant, Australia.
Review completion grant provided through the Campbell Collaboration, Education Coordinating Group.
Declarations of interest
Three authors of this review (CMD, LN, RB) have recently been involved in an evaluation of a high school late start program in Toronto, Canada (Brown 2011), which is one of the studies included in this review. None of these authors were involved in the data extraction for that study.
Acknowledgements
We would like to thank the Cochrane Public Health for providing editorial support and guidance and the Campbell Education Group for editorial and financial support that aided in the completion of this review. The Canadian Institutes of Health Research and the Population Health Improvement Research Network provided salary support for the third author. We would also like to thank the Toronto District School Board, office of Organizational Development/Research and Information Services for providing in‐kind research assistant staff time. We acknowledge research assistant Jessica Byrnes and four library and information specialists who, in addition to our co‐author Lee‐Anne Ufholz, helped in the development and conduct of the detailed search and updates: Margaret Sampson (Medical Librarian, Children's Hospital of Eastern Ontario), Helen Morgan (Studies Search Coordinator for Cochrane Public Health at the time), and Sarah Guay (library student intern, Queen's University). We are also grateful to our review advisory group members: Mark Petticrew, Nancy Edwards, Cathy Dandy, Sam Miceli, Myra Taylor, and Beverly Shea.
Version history
| Published | Title | Stage | Authors | Version |
| 2017 Jul 03 | Later school start times for supporting the education, health, and well‐being of high school students | Review | Robert Marx, Emily E Tanner‐Smith, Colleen M Davison, Lee‐Anne Ufholz, John Freeman, Ravi Shankar, Lisa Newton, Robert S Brown, Alyssa S Parpia, Ioana Cozma, Shawn Hendrikx | |
| 2011 Nov 09 | Later school start times for supporting the education, health and well‐being of high school students | Protocol | Colleen M Davison, Lisa Newton, Robert S Brown, John Freeman, Lee‐Anne Ufholz, J. David Smith | |
Differences between protocol and review
Although the protocol lists an additional objective (exploring possible differential effects of later school start times among subtypes of schools, like rural and urban schools or schools in different climatic conditions), the final review could not explore this objective because studies did not report sufficient information about the schools included in their samples and did not permit comparison across school subtypes. Further, the current search did not locate any ITS studies that met the inclusion criteria, and we therefore did not include the 'Risk of bias' assessment tools for ITS studies. The protocol lists the handsearching of journals that might not be indexed in databases; although the protocol lists that they would be searched from 2010 to present, we searched them from 2014 because we updated the search in 2016, as noted in the review.
We were not able to collect and report on information related to intervention costs, intervention implementation, intervention history or the differential effects of interventions. This was largely due to limitations in the type and amount of information available in the study reports. We sought additional information from study authors by email, and we collected companion and qualitative studies, but limitations still remained. For this reason, the review has less of a focus on equity and cost‐effectiveness than we had originally planned.
Additionally, we have reported on 'student sleepiness and fatigue,' an outcome that we did not explicitly mention in the protocol. As sleepiness and fatigue are the opposite of alertness, including it as an outcome is in keeping with the interests of the review.
Notes
None.
Keywords
MeSH
Medical Subject Headings (MeSH) Keywords
Medical Subject Headings Check Words
Adolescent; Humans; Young Adult;
PICO

Study flow diagram.

Risk of bias summary: review authors' judgements about each risk of bias item for each included study.

Forest plot of comparison: 1 Early school start vs late school start, outcome: 1.1 School‐night sleep duration.
Forest plot of comparison: 1 Early school start vs Late school start, outcome: 1.2 BMI Score ‐ Cross‐over trial.

Forest plot of comparison: 1 Early school start vs Late school start, outcome: 1.3 Waist Circumference ‐ Cross‐over trial.

Forest plot of comparison: 1 Early school start vs Late school start, outcome: 1.4 Body Fat ‐ Cross‐over trial.
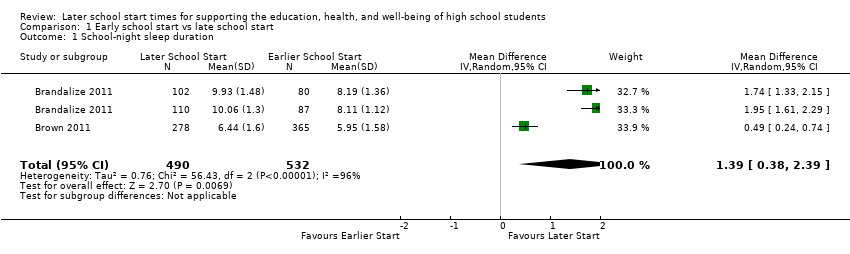
Comparison 1 Early school start vs late school start, Outcome 1 School‐night sleep duration.
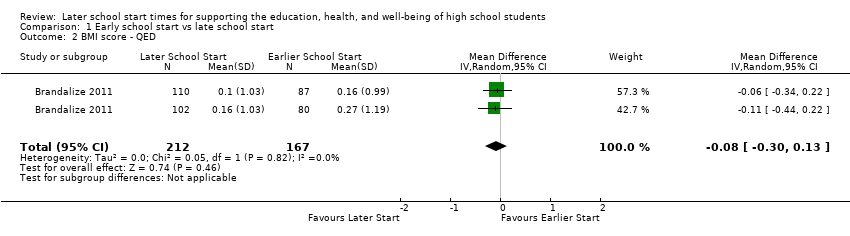
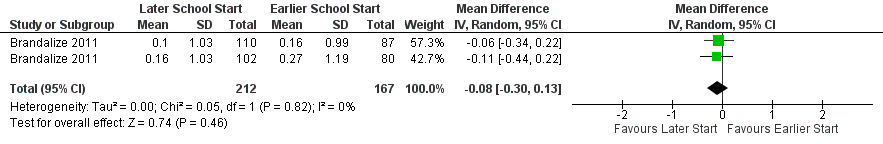
Comparison 1 Early school start vs late school start, Outcome 2 BMI score ‐ QED.

Comparison 1 Early school start vs late school start, Outcome 3 Waist circumference ‐ QED.

Comparison 1 Early school start vs late school start, Outcome 4 Body fat ‐ QED.
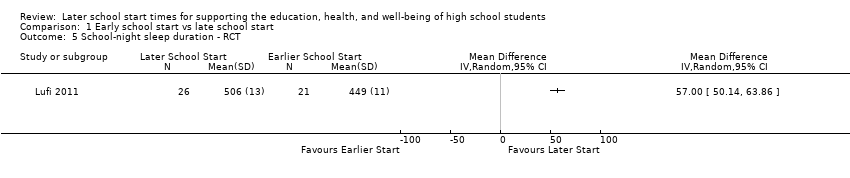
Comparison 1 Early school start vs late school start, Outcome 5 School‐night sleep duration ‐ RCT.

Comparison 1 Early school start vs late school start, Outcome 6 Concentration performance ‐ RCT.

Comparison 1 Early school start vs late school start, Outcome 7 Attention level ‐ RCT.
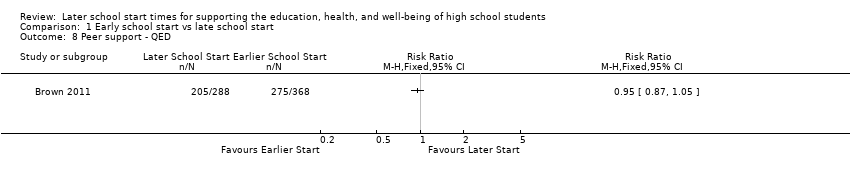
Comparison 1 Early school start vs late school start, Outcome 8 Peer support ‐ QED.

Comparison 1 Early school start vs late school start, Outcome 9 Social support ‐ QED.

Comparison 1 Early school start vs late school start, Outcome 10 Extracurricular activities ‐ QED.
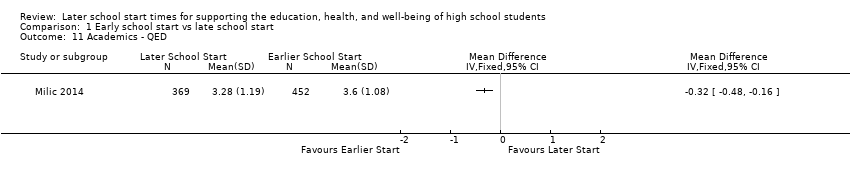
Comparison 1 Early school start vs late school start, Outcome 11 Academics ‐ QED.

Comparison 1 Early school start vs late school start, Outcome 12 Risk of losing sleep ‐ QED.

Comparison 1 Early school start vs late school start, Outcome 13 Overly sleepy ‐ QED.

Comparison 1 Early school start vs late school start, Outcome 14 Sleepiness ‐ QED.

Comparison 1 Early school start vs late school start, Outcome 15 Percentage of students getting adequate sleep.
| Early versus delayed school starts | |||
| Patient or population: students aged 13‐19 | |||
| Outcomes | Impacts | № of Participants (studies) | Quality of the evidence |
| Student academic outcomes | There is no clear association between later school start times and student academic outcomes, as two studies reported significant positive associations (b = 1.78, b = 0.98; effect sizes could not be calculated from one study), one study reported a non‐significant negative association (b = −0.02), and one study reported a significant negative association (MD −0.32 GPA points on a scale of 0 to 4, with higher GPAs indicating better grades). | 254,743 (4) | ⊕⊝⊝⊝ |
| Amount or quality of sleep | All studies that evaluated the association between later school start times and amount or quality of sleep reported significant positive associations, providing evidence that later school start times are associated with increased sleep (effect sizes ranged from MD 0.49 to 1.95 hours) and lower risk of losing sleep (RR 0.41). | 52,340 (8) | ⊕⊝⊝⊝ |
| Mental health outcomes | There is limited evidence concerning the association between later school start times and mental health outcomes: one study reported significant differences in self‐reported depression symptoms for students in later starting schools (07:25 and 08:30) than earlier starting schools (07:15), but no significant difference between students starting school at 08:30 vs 07:25. | 1200 (1) | ⊕⊝⊝⊝ |
| Truancy or attendance outcomes | There is mixed evidence concerning the association between later school starts and attendance outcomes: one study reported a significant increase in attendance, one study reported a non‐significant increase in attendance, and one study reported a significant increase in attendance for 2 of 6 schools and non‐significant effects (no further information provided) for the other 4 schools. | 255,122 (4) | ⊕⊝⊝⊝ |
| Alertness | There is mixed evidence concerning the association between later school starts and student reports of alertness or sleepiness. Two studies found an association between later school start times and decreased daytime sleepiness, while one study found no difference between student reports at later and earlier starting schools. One study reported a significant increase in attention levels but a non‐significant increase in concentration levels. | 2735 (4) | ⊕⊝⊝⊝ |
| Adverse events/unintended consequences | Authors provided limited information concerning adverse events and unintended consequences but did offer that later school start times may be associated with decreased morning interactions between parents and children, decreased alertness in mid‐afternoon, and increased logistical challenges, including missing extracurricular activities, transportation troubles, and safety concerns (as students may have to walk home in the dark). | 207,576 (4) | ⊕⊝⊝⊝ |
| b: regression coefficient; CI: confidence interval; GPA: grade point average; MD: mean difference; RR: risk ratio | |||
| GRADE Working Group grades of evidence | |||
| aDowngraded one level (from starting point of 'low' for observational study designs). The GRADE rating of 'very low' for all findings reflects study designs (absence of RCTs), high risk of bias within the studies, and inconsistency within the estimates. | |||
| Outcome or subgroup title | No. of studies | No. of participants | Statistical method | Effect size |
| 1 School‐night sleep duration Show forest plot | 2 | 1022 | Mean Difference (IV, Random, 95% CI) | 1.39 [0.38, 2.39] |
| 2 BMI score ‐ QED Show forest plot | 1 | 379 | Mean Difference (IV, Random, 95% CI) | ‐0.08 [‐0.30, 0.13] |
| 3 Waist circumference ‐ QED Show forest plot | 1 | 379 | Mean Difference (IV, Random, 95% CI) | ‐1.14 [‐3.34, 1.06] |
| 4 Body fat ‐ QED Show forest plot | 1 | 379 | Mean Difference (IV, Random, 95% CI) | ‐1.45 [‐2.63, ‐0.27] |
| 5 School‐night sleep duration ‐ RCT Show forest plot | 1 | Mean Difference (IV, Random, 95% CI) | Totals not selected | |
| 6 Concentration performance ‐ RCT Show forest plot | 1 | Mean Difference (IV, Random, 95% CI) | Totals not selected | |
| 7 Attention level ‐ RCT Show forest plot | 1 | Mean Difference (IV, Random, 95% CI) | Totals not selected | |
| 8 Peer support ‐ QED Show forest plot | 1 | Risk Ratio (M‐H, Fixed, 95% CI) | Totals not selected | |
| 9 Social support ‐ QED Show forest plot | 1 | Risk Ratio (M‐H, Fixed, 95% CI) | Totals not selected | |
| 10 Extracurricular activities ‐ QED Show forest plot | 1 | Risk Ratio (M‐H, Fixed, 95% CI) | Totals not selected | |
| 11 Academics ‐ QED Show forest plot | 1 | Mean Difference (IV, Fixed, 95% CI) | Totals not selected | |
| 12 Risk of losing sleep ‐ QED Show forest plot | 1 | Risk Ratio (M‐H, Fixed, 95% CI) | Totals not selected | |
| 13 Overly sleepy ‐ QED Show forest plot | 1 | Risk Ratio (M‐H, Fixed, 95% CI) | Totals not selected | |
| 14 Sleepiness ‐ QED Show forest plot | 1 | Mean Difference (IV, Fixed, 95% CI) | Totals not selected | |
| 15 Percentage of students getting adequate sleep Show forest plot | 1 | 905 | Risk Ratio (M‐H, Random, 95% CI) | 1.50 [1.33, 1.70] |