Contenido relacionado
Revisiones y protocolos relacionados
Sarah Jones, William D‐C Man, Wei Gao, Irene J Higginson, Andrew Wilcock, Matthew Maddocks | 17 octubre 2016
Brenda Monaghan, Brian Caulfield, Dónal P O'Mathúna | 20 enero 2010
Kylie Hill, Vinicius Cavalheri, Sunita Mathur, Marc Roig, Tania Janaudis‐Ferreira, Priscila Robles, Thomas E Dolmage, Roger Goldstein | 29 mayo 2018
Adam Hurlow, Michael I Bennett, Karen A Robb, Mark I Johnson, Karen H Simpson, Stephen G Oxberry | 14 marzo 2012
Cathy Payne, Philip J Wiffen, Suzanne Martin | 7 abril 2017
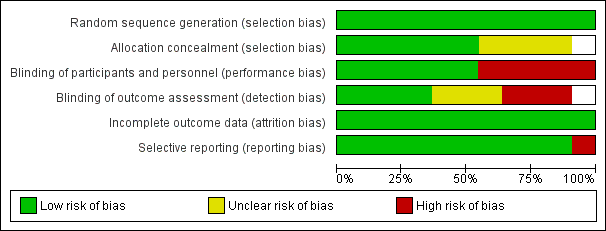
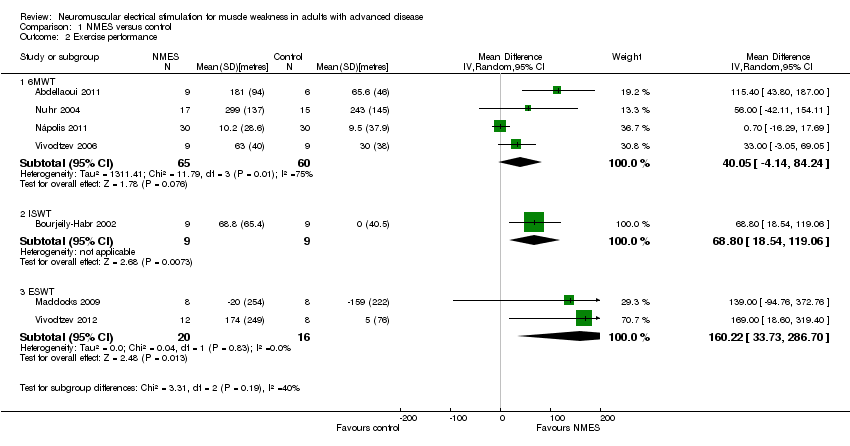
Antonio Jose Grande, Valter Silva, Larissa Sawaris Neto, João Pedro Teixeira Basmage, Maria S Peccin, Matthew Maddocks | 18 marzo 2021
Steffen T Simon, Irene J Higginson, Sara Booth, Richard Harding, Vera Weingärtner, Claudia Bausewein | 20 octubre 2016
Kelechi E Nnoaham, Jharna Kumbang | 10 julio 2014
Sheena Derry, Roy Rabbie, R Andrew Moore | 30 abril 2013
Mark I Johnson, Carole A Paley, Tracey E Howe, Kathleen A Sluka | 15 junio 2015