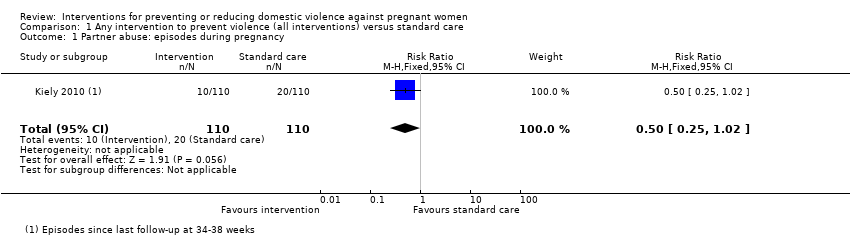
| 1 Partner abuse: episodes during pregnancy Show forest plot | 1 | 220 | Risk Ratio (M‐H, Fixed, 95% CI) | 0.5 [0.25, 1.02] |
|
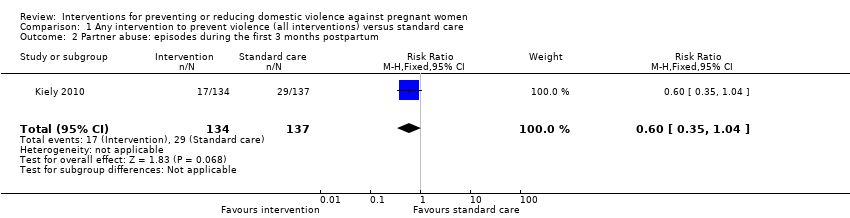
| 2 Partner abuse: episodes during the first 3 months postpartum Show forest plot | 1 | 271 | Risk Ratio (M‐H, Fixed, 95% CI) | 0.60 [0.35, 1.04] |
|
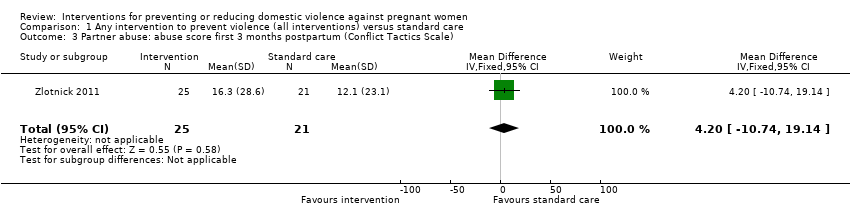
| 3 Partner abuse: abuse score first 3 months postpartum (Conflict Tactics Scale) Show forest plot | 1 | 46 | Mean Difference (IV, Fixed, 95% CI) | 4.20 [‐10.74, 19.14] |
|
| 4 Partner abuse: abuse score in first 3 months postpartum (Conflict Tactics Scale) Show forest plot | 1 | | Mean Difference (IV, Fixed, 95% CI) | Subtotals only |
|
| 4.1 Psychological abuse | 1 | 106 | Mean Difference (IV, Fixed, 95% CI) | ‐0.81 [‐1.45, ‐0.17] |
| 4.2 Minor physical violence score | 1 | 106 | Mean Difference (IV, Fixed, 95% CI) | ‐0.46 [‐0.82, ‐0.10] |
| 4.3 Severe physical violence score | 1 | 106 | Mean Difference (IV, Fixed, 95% CI) | 0.08 [‐0.28, 0.44] |
| 4.4 Sexual abuse score | 1 | 106 | Mean Difference (IV, Fixed, 95% CI) | ‐0.09 [‐0.24, 0.06] |
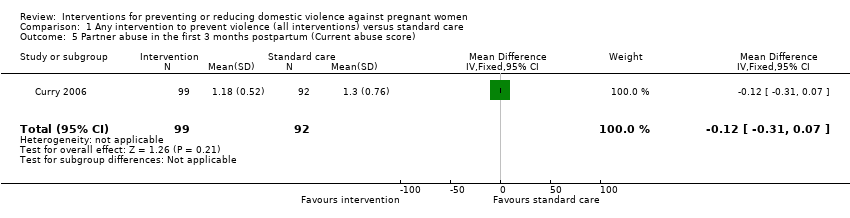
| 5 Partner abuse in the first 3 months postpartum (Current abuse score) Show forest plot | 1 | 191 | Mean Difference (IV, Fixed, 95% CI) | ‐0.12 [‐0.31, 0.07] |
|
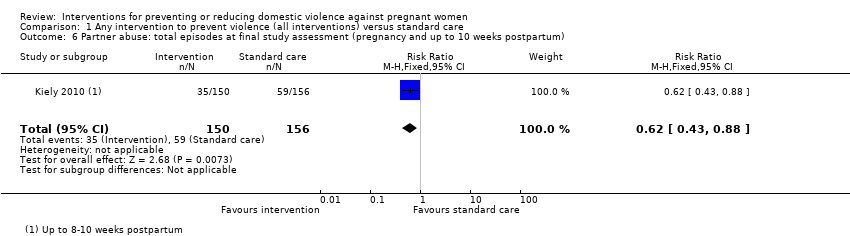
| 6 Partner abuse: total episodes at final study assessment (pregnancy and up to 10 weeks postpartum) Show forest plot | 1 | 306 | Risk Ratio (M‐H, Fixed, 95% CI) | 0.62 [0.43, 0.88] |
|
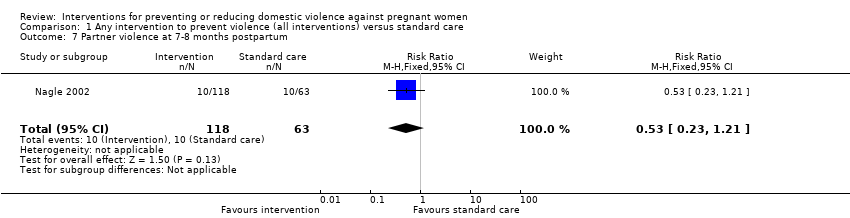
| 7 Partner violence at 7‐8 months postpartum Show forest plot | 1 | 181 | Risk Ratio (M‐H, Fixed, 95% CI) | 0.53 [0.23, 1.21] |
|
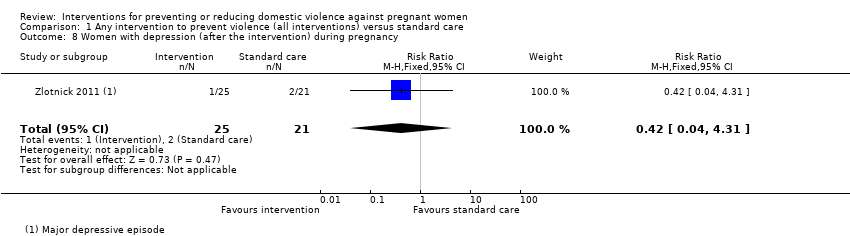
| 8 Women with depression (after the intervention) during pregnancy Show forest plot | 1 | 46 | Risk Ratio (M‐H, Fixed, 95% CI) | 0.42 [0.04, 4.31] |
|
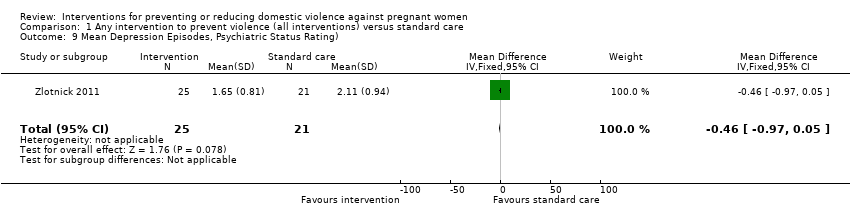
| 9 Mean Depression Episodes, Psychiatric Status Rating) Show forest plot | 1 | 46 | Mean Difference (IV, Fixed, 95% CI) | ‐0.46 [‐0.97, 0.05] |
|
| 10 Depression scores (after the intervention) during pregnancy | 0 | 0 | Mean Difference (IV, Fixed, 95% CI) | 0.0 [0.0, 0.0] |
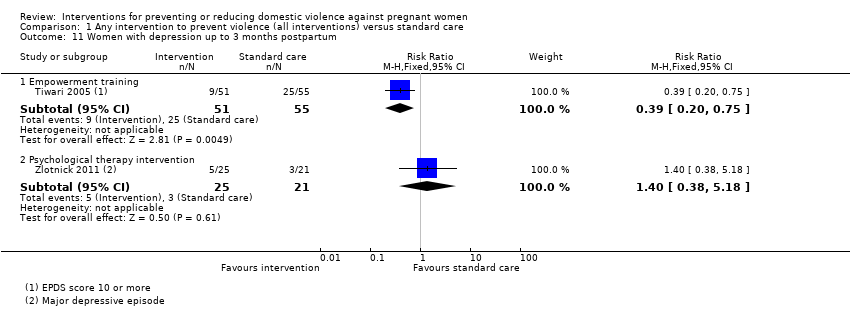
| 11 Women with depression up to 3 months postpartum Show forest plot | 2 | | Risk Ratio (M‐H, Fixed, 95% CI) | Subtotals only |
|
| 11.1 Empowerment training | 1 | 106 | Risk Ratio (M‐H, Fixed, 95% CI) | 0.39 [0.20, 0.75] |
| 11.2 Psychological therapy intervention | 1 | 46 | Risk Ratio (M‐H, Fixed, 95% CI) | 1.40 [0.38, 5.18] |
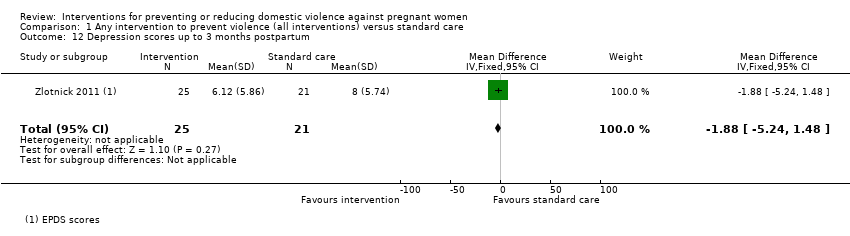
| 12 Depression scores up to 3 months postpartum Show forest plot | 1 | 46 | Mean Difference (IV, Fixed, 95% CI) | ‐1.88 [‐5.24, 1.48] |
|
| 13 Women with depression up to 1 year postpartum Show forest plot | 1 | 182 | Risk Ratio (M‐H, Fixed, 95% CI) | 0.85 [0.37, 1.98] |
|
| 14 Depression scores up to 1 year postpartum Show forest plot | 1 | 182 | Mean Difference (IV, Fixed, 95% CI) | ‐0.65 [‐2.41, 1.11] |
|
| 15 Apgar score less than 7 at 1 minute | 0 | 0 | Risk Ratio (M‐H, Fixed, 95% CI) | 0.0 [0.0, 0.0] |
| 16 Apgar score less than 7 at 5 minutes | 0 | 0 | Risk Ratio (M‐H, Fixed, 95% CI) | 0.0 [0.0, 0.0] |
| 17 Stillbirth | 0 | 0 | Risk Ratio (M‐H, Fixed, 95% CI) | 0.0 [0.0, 0.0] |
| 18 Neonatal death | 0 | 0 | Risk Ratio (M‐H, Fixed, 95% CI) | 0.0 [0.0, 0.0] |
| 19 Miscarriage (up to 20 weeks) | 0 | 0 | Risk Ratio (M‐H, Fixed, 95% CI) | 0.0 [0.0, 0.0] |
| 20 Maternal mortality | 0 | 0 | Risk Ratio (M‐H, Fixed, 95% CI) | 0.0 [0.0, 0.0] |
| 21 Antepartum haemorrhage | 0 | 0 | Risk Ratio (M‐H, Fixed, 95% CI) | 0.0 [0.0, 0.0] |
| 22 Placental abruption | 0 | 0 | Risk Ratio (M‐H, Fixed, 95% CI) | 0.0 [0.0, 0.0] |
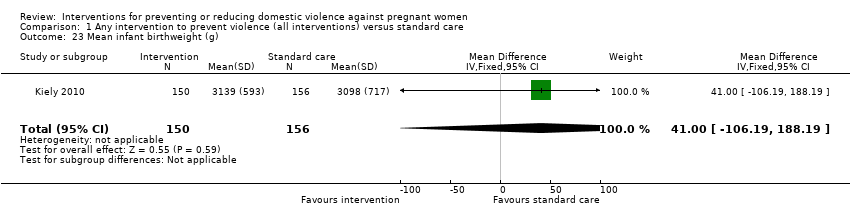
| 23 Mean infant birthweight (g) Show forest plot | 1 | 306 | Mean Difference (IV, Fixed, 95% CI) | 41.0 [‐106.19, 188.19] |
|
| 24 Number of low‐birthweight (< 2500 g) babies Show forest plot | 1 | 306 | Risk Ratio (M‐H, Fixed, 95% CI) | 0.74 [0.41, 1.32] |
|
| 25 Preterm labour (before 37 weeks' gestation) Show forest plot | 1 | 306 | Risk Ratio (M‐H, Fixed, 95% CI) | 0.69 [0.40, 1.20] |
|
| 26 (Non‐prespecified outcome) Mean gestational age at birth (weeks) Show forest plot | 1 | 306 | Mean Difference (IV, Fixed, 95% CI) | 1.40 [0.33, 2.47] |
|
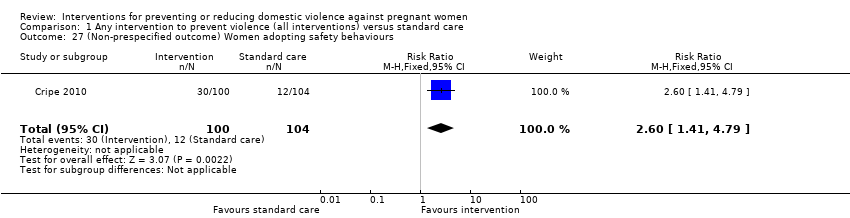
| 27 (Non‐prespecified outcome) Women adopting safety behaviours Show forest plot | 1 | 204 | Risk Ratio (M‐H, Fixed, 95% CI) | 2.6 [1.41, 4.79] |
|
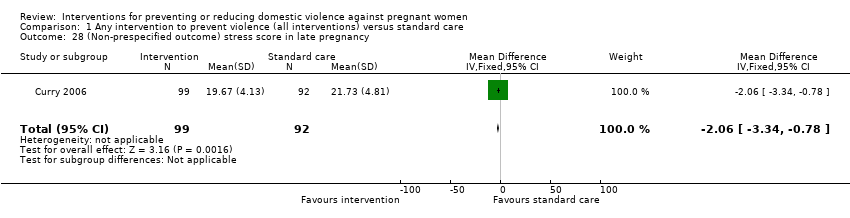
| 28 (Non‐prespecified outcome) stress score in late pregnancy Show forest plot | 1 | 191 | Mean Difference (IV, Fixed, 95% CI) | ‐2.06 [‐3.34, ‐0.78] |
|
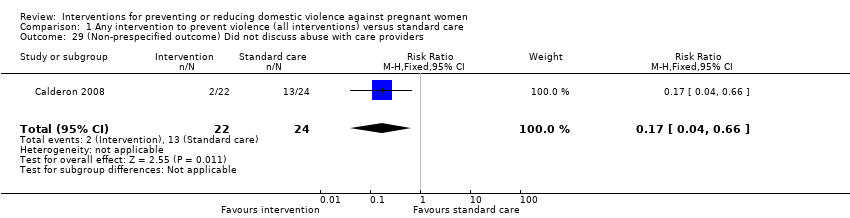
| 29 (Non‐prespecified outcome) Did not discuss abuse with care providers Show forest plot | 1 | 46 | Risk Ratio (M‐H, Fixed, 95% CI) | 0.17 [0.04, 0.66] |
|
| 30 (Non‐prespecified outcome) Women reporting any domestic violence 2‐4 years postpartum Show forest plot | 1 | 735 | Risk Ratio (M‐H, Fixed, 95% CI) | 0.81 [0.60, 1.08] |
|