Fingolimod para la esclerosis múltiple recurrente‐remitente
Información
- DOI:
- https://doi.org/10.1002/14651858.CD009371.pub2Copiar DOI

- Base de datos:
-
- Cochrane Database of Systematic Reviews
- Versión publicada:
-
- 19 abril 2016see what's new
- Tipo:
-
- Intervention
- Etapa:
-
- Review
- Grupo Editorial Cochrane:
-
Grupo Cochrane de Esclerosis múltiple y enfermedades raras del sistema nervioso central
- Copyright:
-
- Copyright © 2016 The Cochrane Collaboration. Published by John Wiley & Sons, Ltd.
Cifras del artículo
Altmetric:
Citado por:
Autores
Contributions of authors
| Roles and responsibilities | |
| Drafting the protocol | All review authors |
| Selecting which studies to include | LLM, RP, IP |
| Planning data sheet for study data extraction | LLM,IP |
| Extracting data from studies | LLM, IT, IP |
| Assessing risk of bias of studies | LLM, IP, IT |
| Entering data into RevMan | LLM, IP, IT |
| Carrying out data analysis and interpreting results | LLM, IT, GF |
| Drafting the manuscript and final review | LLM, GF |
| Editing | LLM |
| Approving the final version | All review authors |
Declarations of interest
Loredana La Mantia: none.
Belal Firwana: none.
Irene Tramacere: none.
Ilaria Pacchetti: none.
Roberto Palumbo: none.
Graziella Filippini: none. As Co‐ordinating Editor, Dr. Filippini was excluded from the editorial process to ensure separation of the author and the editorial process. This includes all editorial decisions and related activities (e.g. Sign‐off for publication).
Acknowledgements
We wish to thank: Dr. Anas Shaneh Saz, Rim Hasan and Suleiman Kojan for their contribution in writing the review protocol.
We also thank Andrea Fittipaldo, Trials Search Co‐ordinator, for support provided in paper retrieval, and Sara Nuzzo for helping with data extraction of primary studies.
We are grateful to Liliana Coco for valuable and helpful technical assistance provided, as well as for support in writing the review.
We are grateful to Prof. Bianca Weinstock‐Guttman for valuable and helpful comments.
Version history
| Published | Title | Stage | Authors | Version |
| 2016 Apr 19 | Fingolimod for relapsing‐remitting multiple sclerosis | Review | Loredana La Mantia, Irene Tramacere, Belal Firwana, Ilaria Pacchetti, Roberto Palumbo, Graziella Filippini | |
| 2011 Oct 05 | Fingolimod for relapsing remitting multiple sclerosis | Protocol | Anas Shaneh Saz, Belal M Firwana, Rim Hasan, Suleiman Kojan, Loredana La Mantia, Graziella Filippini | |
Differences between protocol and review
-
Background was amended.
-
Types of studies: cohort studies, case‐control studies, case reports or case‐series were not included in this review because an ad hoc review has been planned.
-
Participants: MS diagnostic criteria, which we accepted for inclusion of participants, have been added.
-
Primary outcome measures: 1) number of participants relapse‐free at six, 12 and 24 months, and number of participants free from disability progression at 12, 24 and 36 months were included as primary outcome measures more relevant to participants; 2) annualised relapse rate was moved to secondary outcomes; 3) number of participants who withdrew from the study because of serious adverse events was added as a primary outcome, and the rate of serious adverse events was excluded.
-
Secondary outcomes were amended.
-
Electronic searches were amended.
-
Dealing with missing data: a likely scenario was used as a sensitivity analysis to deal with missing data. An intention‐to‐treat analysis, using the last reported observed response ('carry forward'), previously reported in the review protocol, was not performed according to the Cochrane Handbook for Systematic Reviews of Interventions (Chapter 8.13.2.3) (Higgins 2011b).
-
'Summary of findings' tables were added.
Keywords
MeSH
Medical Subject Headings (MeSH) Keywords
Medical Subject Headings Check Words
Humans;
PICO

Study flow diagram.

Risk of bias summary: review authors' judgements about each risk of bias item for each included study.
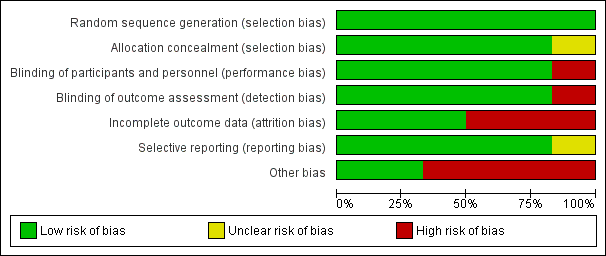
Risk of bias graph: review authors' judgements about each risk of bias item presented as percentages across all included studies.

N, number of patients; n, number of events.
Significant differences (based on Fisher exact test) are reported in red.

N, number of patients; n, number of events.
* One case of basal‐cell carcinoma was not reported as a serious adverse event by the site investigator (Calabresi 2014).
Significant differences (based on Fisher exact test) are reported in red.

Comparison 1 Participants free from relapse, Outcome 1 At 6 months.
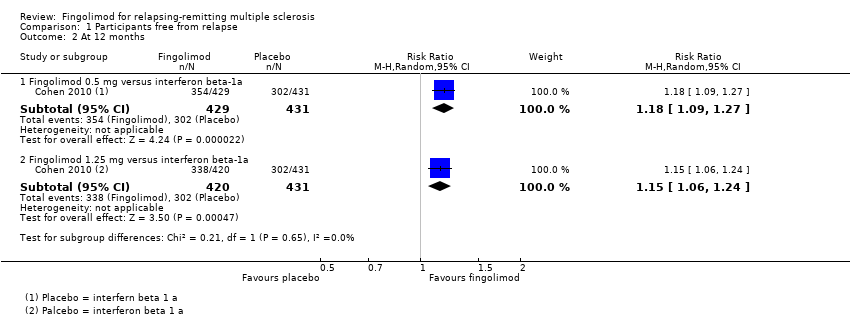
Comparison 1 Participants free from relapse, Outcome 2 At 12 months.

Comparison 1 Participants free from relapse, Outcome 3 At 24 months.

Comparison 2 Participants free from disability worsening, Outcome 1 At 12 months.

Comparison 2 Participants free from disability worsening, Outcome 2 At 24 months.
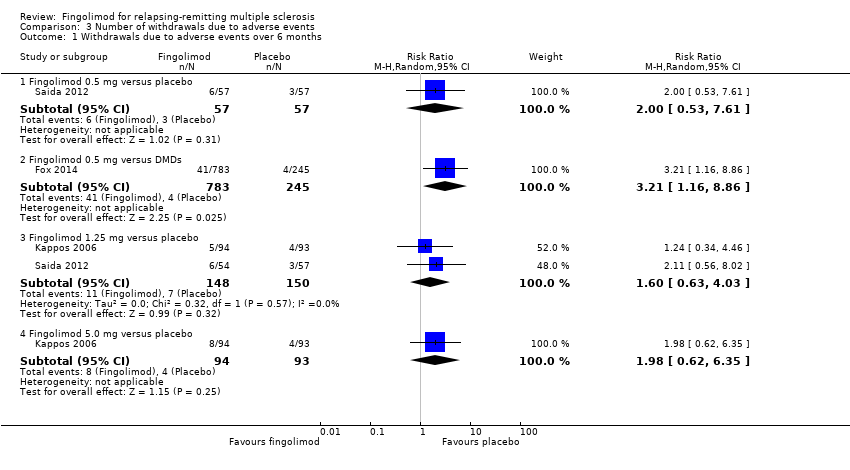
Comparison 3 Number of withdrawals due to adverse events, Outcome 1 Withdrawals due to adverse events over 6 months.

Comparison 3 Number of withdrawals due to adverse events, Outcome 2 Withdrawals due to adverse events over 12 months.

Comparison 3 Number of withdrawals due to adverse events, Outcome 3 Withdrawals due to adverse events over 24 months.

Comparison 3 Number of withdrawals due to adverse events, Outcome 4 Withdrawals due to serious adverse events over 6 months.

Comparison 3 Number of withdrawals due to adverse events, Outcome 5 Withdrawals due to serious adverse events over 12 months.

Comparison 3 Number of withdrawals due to adverse events, Outcome 6 Withdrawals due to serious adverse events over 24 months.
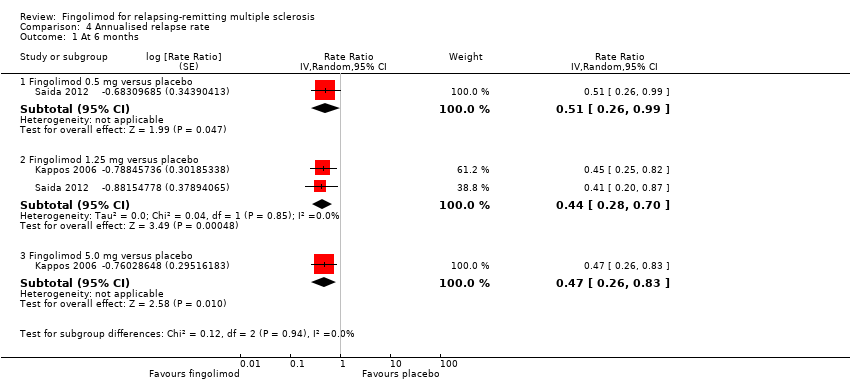
Comparison 4 Annualised relapse rate, Outcome 1 At 6 months.

Comparison 4 Annualised relapse rate, Outcome 2 At 12 months.

Comparison 4 Annualised relapse rate, Outcome 3 At 24 months.

Comparison 5 Participants free from gadolinium‐enhancing lesions, Outcome 1 At 6 months.
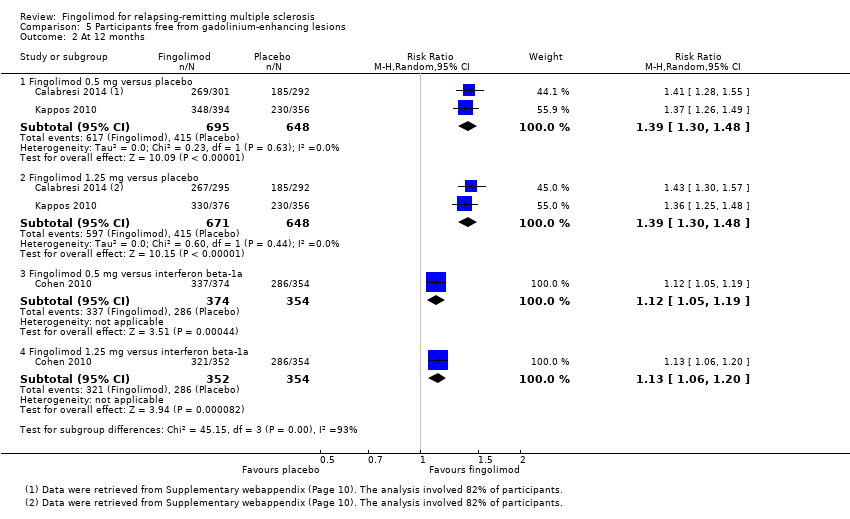
Comparison 5 Participants free from gadolinium‐enhancing lesions, Outcome 2 At 12 months.
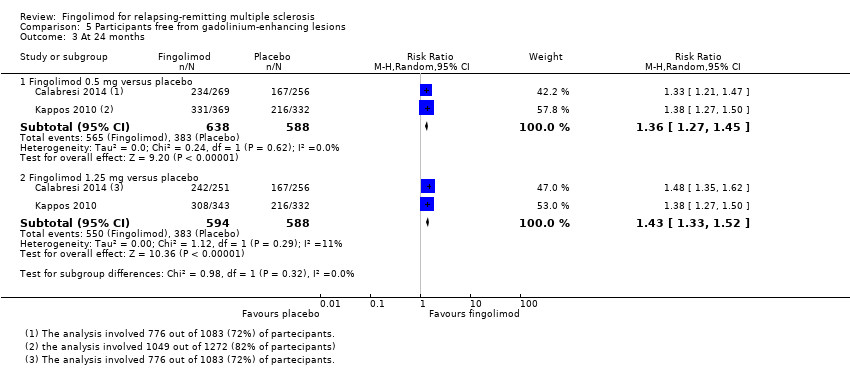
Comparison 5 Participants free from gadolinium‐enhancing lesions, Outcome 3 At 24 months.

Comparison 6 Mean change of MRI T2‐weighted lesion load, Outcome 1 At 12 months.

Comparison 6 Mean change of MRI T2‐weighted lesion load, Outcome 2 At 24 months.
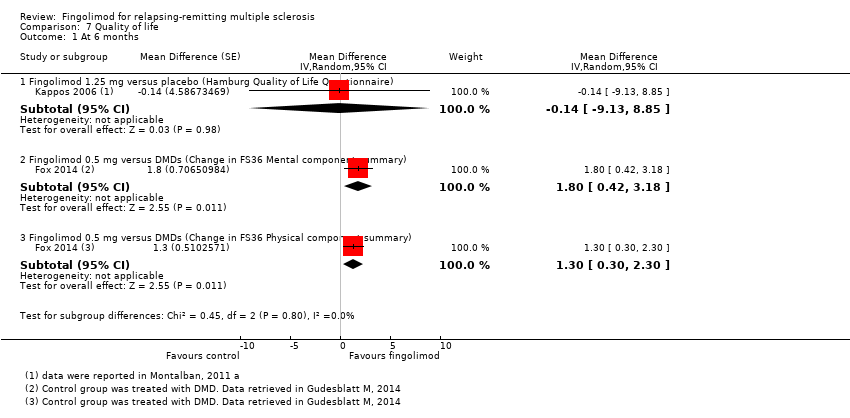
Comparison 7 Quality of life, Outcome 1 At 6 months.

Comparison 7 Quality of life, Outcome 2 At 24 months.
| Fingolimod 0.5 mg versus placebo for relapsing‐remitting multiple sclerosis | |||||
| Participants or population: people with relapsing‐remitting multiple sclerosis | |||||
| Outcomes at 24 months | Illustrative comparative risks* (95% CI) | Relative effect | No. of Participants | Quality of the evidence | |
| Assumed risk | Corresponding risk | ||||
| Control (placebo) | Fingolimod 0.5 mg | ||||
| Participants free from relapse | 49 per 100 | 70 per 100 | RR 1.44 | 1556 | ⊕⊕⊕⊝ |
| Participants free from disability worsening | 82 per 100 | 87 per 100 | RR 1.07 | 1556 | ⊕⊕⊝⊝ |
| Withdrawals due to adverse events | 9 per 100 | 13 per 100 | RR 1.42 | 1556 | ⊕⊝⊝⊝ |
| Annualised relapse rate | ‐ | ‐ | Rate ratio 0.50 | 1556 | ⊕⊕⊕⊝ |
| Participants free from MRI gadolinium‐enhancing lesions | 65 per 100 | 89 per 100 | RR 1.36 | 1226 | ⊕⊕⊝⊝ |
| *For dichotomous outcomes, the corresponding risk with fingolimod 0.5 mg (and its 95% CI) is based on the assumed risk with the control group (i.e. the mean proportion of events in the control group across the two studies) and the relative effect of fingolimod (and its 95% CI). For the annualised relapse rate, only the relative effect (i.e., the rate ratio) is given, because the assumed risk with the control group is not estimable. | |||||
| GRADE Working Group grades of evidence | |||||
| a Study limitations: significant differences in reasons for incomplete outcome data between treatment and control groups. | |||||
| Fingolimod 0.5 mg versus intramuscular interferon beta‐1a for relapsing‐remitting multiple sclerosis | |||||
| Participants or population: people with relapsing‐remitting multiple sclerosis | |||||
| Outcomes at 12 months | Illustrative comparative risks* (95% CI) | Relative effect | No. of Participants | Quality of the evidence | |
| Assumed risk | Corresponding risk | ||||
| Control (interferon beta‐1a) | Fingolimod 0.5 mg | ||||
| Participants free from relapse | 70 per 100 | 83 per 100 | RR 1.18 | 860 | ⊕⊕⊕⊝ |
| Participants free from disability worsening | 92 per 100 | 94 per 100 | RR 1.02 | 860 | ⊕⊕⊝⊝ |
| Withdrawals due to adverse events | 4 per 100 | 6 per 100 | RR 1.51 | 860 | ⊕⊕⊕⊝ |
| Annualised relapse rate | ‐ | ‐ | Rate ratio 0.48 | 860 | ⊕⊕⊕⊝ |
| Participants free from MRI gadolinium‐enhancing lesions | 81 per 100 | 90 per 100 | RR 1.12 | 728 | ⊕⊕⊕⊝ |
| *For dichotomous outcomes, the corresponding risk with the intervention (and its 95% CI) is based on the assumed risk with the control (i.e. the mean proportion of events in the control group across studies) and the relative effect of the intervention (and its 95% CI). For the annualised relapse rate, only the relative effect (i.e., the rate ratio) is given. | |||||
| GRADE Working Group grades of evidence | |||||
| a Imprecision: total number of events (i.e. the number of participants with disability worsening/gadolinium‐enhancing lesions) was less than 300 (the threshold rule‐of‐thumb value), and thus the available evidence did not meet the optimal information size criteria. b Indirectness: surrogate outcome (progression confirmed at three months of follow‐up). | |||||
| Study name | Clinical outcomes | Time point assessment | MRI outcomes | Time point assessment |
| 1.Annualised relapse rate 2. Time to disability progression confirmed at 3 months 3. Time to disability progression confirmed at 6 months 4. Safety 5. Time to first relapse 6. Proportion of relapse‐free participants 7. Change from baseline to the end of study on the MSFC score 8. Quality of life using the Euro quality of life scale (EQ‐5D) 9. Patient Reported Indices in Multiple Sclerosis 10. Fatigue using the Modified Fatigue Impact Scale | 24 months | 1.Percent brain‐volume change from baseline at 24 months 2.Number and volume of gadolinium‐enhancing T1 lesions 3. Number of new or newly enlarged T2 lesions 4. Proportion of participants free of gadolinium‐enhancing T1 lesions 5. Proportion of participants free of new or newly enlarged T2 lesions 6. Proportion of participants free of new inflammatory activity (no gadolinium‐enhancing T1 lesions and no new or newly enlarged T2 lesions) 7. Percentage change from baseline in volume of gadolinium‐enhanced T1 lesions 8. Percentage change from baseline in volume of new or newly enlarged T2 lesions 9. Brain volume | 24 months | |
| 1. Annualised relapse rate 2. Progression of disability (confirmed at 3 months) | 12 months | Number of new or enlarged lesions on T2‐weighted scans | 12 months | |
| 1. Treatment satisfaction 2. Fatigue 3. Depression 4. Activities of daily living 5. Health‐related Quality Of Life 6, Side effects | 6 months | Not included | ||
| 1. Number of participants remaining free of relapse 2. Annualised relapse rate 3, Time to the first relapse | 6 months | 1.Number of gadolinium‐enhanced lesions per participant recorded on T1‐weighted MRI at monthly intervals for 6 months 2.Total volume of gadolinium‐enhanced lesions per participants 3. Proportion of participants with gadolinium‐enhanced lesions 4. Total number of new lesion per participant on T‐weighted images 5. Changes in lesion volume on T2‐weighted images 6. Brain volume from baseline to month 6 | 6 months | |
| 1. Annualised relapse rate 2. Time to confirmed disability progression (confirmed after 3 months ) 3. Time to a first relapse 4. Time to disability progression (confirmed after 6 months) 5. Changes in the EDSS score 6. Changes in the MSFC z score between baseline and 24 months | 24 months | 1. Number of gadolinium‐enhancing lesions 2. Proportion of participants free from gadolinium‐enhancing lesions 3. Number of new or enlarged lesions on T2‐weighted MRI scans 4. Proportion of participants free from new or enlarged lesions on T2‐weighted scan 5. Volumes of hyperintense lesions on T2‐weighted scan 6. Volumes of hypointense lesions on T1‐weighted scans 7. Change in brain volume between baseline and 24 months 8. Safety and tolerability measures | 24 months | |
| Percentage of participants free from relapse | 6 months | Participants free from gadolinium‐enhancing lesions | 6 months | |
| EDSS: Expanded Disability Status Scale; MSFC: Multiple Sclerosis Functional Composite The primary outcome of each study is underlined | ||||
| Study name | Drugs | No. participants | Female (%) | Course of disease of RR‐SP (%) | Age, years, mean (SD) | Mean EDSS score (SD) | Disease duration, mean (SD) | Pre‐1 year number of relapses, mean (SD) | Percentage of pre‐study treatment‐naive participants | Percentage of participants with MRI enhancing lesions | Mean lesion volume on T2‐weighted images (mm3 ) (SD) |
| Placebo | 355 | 81 | 100 ‐ 0 | 40·1 (8·4) | 2·2 (1·5) | 10·6 (7·9) | 1·5 (0·9) | 27 | 36 | 5553 (7841) | |
| Fingolimod 0.5 mg | 358 | 77 | 100 ‐ 0 | 40·6 (8·4) | 2·2 (1·4) | 10·4 (8·0) | 1·4 (0·9) | 26 | 39 | 5484 (8000) | |
| Fingolimod 1.25 mg | 370 | 76 | 100 ‐ 0 | 40·9 (8·9) | 2·3 (2·0) | 10·8 (8·2) | 1·5 (1·0) | 22 | 31 | 4936 (7286) | |
| Interferon beta‐1a (Avonex) | 435 | 67.8 | 100 ‐ 0 | 36.0 (8.3) | 2.19 (1.26) | 7.4 (6.3) | 1.5 (0.8) | 43.7 | 36.9 | 4924 (5711) | |
| Fingolimod 0.5 mg | 431 | 65.4 | 100 ‐ 0 | 36.7 (8.8) | 2.24 (1.33) | 7.5 (6.2) | 1.5 (1.2) | 44.8 | 32.6 | 5170 (6642) | |
| Fingolimod 1.25 mg | 426 | 68.8 | 100 ‐ 0 | 35.8 (8.4) | 2.21 (1.31) | 7.3 (6.0) | 1.5 (0.9) | 41.5 | 34.5 | 5085 (5962) | |
| DMD§ | 263 | 79.1 | 100 ‐ 0 | 45.1 (9.82) | 2.4 (1.32) | 11.7 (8.44) | 0.8 (1.32) | 0 | NR | NR | |
| Fingolimod 0.5 mg | 790 | 76.1 | 100 ‐ 0 | 46.0 (9.82) | 2.4 (1.32) | 12.1 (8.38) | 0.8 (1.20) | 0 | NR | NR | |
| Placebo | 93 | 66 | 90 ‐ 10 | 37.1 (19‐56)* | 2.6 (0.0‐6.5)* | 8.4 (0.2‐28.2)* | 1.2 (0‐5)* | NR | 51 | 8805 (123‐62,218)* | |
| Fingolimod 1.25 mg | 94 | 75 | 89 ‐ 11 | 38.0 (19‐60)* | 2.7 (0.0‐6.0)* | 8.6 (0.3‐50.2)* | 1.3 (0‐5)* | NR | 47 | 10,219 (293‐104,504)* | |
| Fingolimod 5.0 mg | 94 | 71 | 87 ‐ 13 | 38.3 (18‐59)* | 2.5 (0.0‐6.0)* | 9.5 (0.5‐42.2)* | 1.3 (0‐4)* | NR | 57 | 8722 (349‐70,218)* | |
| Placebo | 418 | 71.3 | 100 ‐ 0 | 37.2 (8.6) | 2.5 (1.3) | 8.1 (6.4) | 1.4 (0.7) | 59.6 | 37 | 6162 (7085) | |
| Fingolimod 0.5 mg | 425 | 69.6 | 100 ‐ 0 | 36.6 (8.8) | 2.3 (1.3) | 8.0 (6.6) | 1.5 (0.8) | 57.4 | 38 | 6128 (7623) | |
| Fingolimod 1.25 mg | 429 | 68.8 | 100 ‐ 0 | 37.4 (8.9) | 2.4 (1.4) | 8.4 (6.9) | 1.5 (0.8) | 60.4 | 39.4 | 6829 (8491) | |
| Placebo | 57 | 68.4 | 100 ‐ 0 | 35.0 (8.9) | 2.1 (1.7) | 8.2 (7.3) | 1.7 (1.6) | NR | 42.1 | 31.6 (22.6)** | |
| Fingolimod 0.5 mg | 57 | 70.2 | 94.7 ‐ 5.3 | 35.0 (9.0) | 2.3 (1.9) | 8.2 (6.8) | 1.4 (1.0) | NR | 42.1 | 30.4 (22.7)** | |
| Fingolimod 1.25 mg | 57 | 68.4 | 98.2 ‐ 1.8 | 36.0 (9.3) | 1.8 (1.7) | 7.1 (5.3) | 1.5 (0.9) | NR | 49.1 | 31.7 (23.3)** | |
| DMD: disease‐modifying drug;EDSS: Expanded Disability Status Scale; MRI: magnetic resonance imaging; NR: not reported; RR: relapsing‐remitting; SD: standard deviation; SP: secondary progressive * Range (SD was not provided) | |||||||||||
| Study name | Risk of bias | Did the researchers actively monitor for adverse events (AEs) (low risk of bias) or did they simply provide spontaneous reporting of AEs that arose (high risk of bias)? | Risk of bias | Did the authors define serious AEs (SAEs) according to an accepted international classification and report the number of SAEs? |
| Low | "We did extensive safety and tolerability assessments, in part as a response to preclinical safety concerns raised by the FDA and additional safety areas of interest identified in previous phase 2 and earlier clinical studies. We also recorded adverse events, serious adverse events, serious adverse events of special interest, 24 h Holter electrocardiography (ECG) post first‐dose and at 3 months, first‐dose bradycardia events, infections, laboratory tests, vital signs, ECG, echocardiography, pulmonary function. tests, chest high‐resolution CT,chest radiographs, ophthalmic examinations, including serial optical coherence tomography, and dermatological assessments." Clinical assessments were performed at screening and at randomisation (baseline), and study visits, including safety assessments, were scheduled at 2 weeks and 1, 2, 3, 6, 9, 12, 15, 18, 21, and 24 months after randomisation" | Unclear | "We also recorded adverse events, serious adverse events, serious adverse events of special interest, 24 h Holter electrocardiography (ECG) post fist‐dose and at 3 months, first‐dose bradycardia events, infections, laboratory tests, vital signs, ECG, echocardiography, pulmonary function tests, chest high‐resolution CT,chest radiographs, ophthalmic examinations, including serial optical coherence tomography, and dermatological assessments" | |
| Low | "An independent data and safety monitoring board evaluated overall safety in the fingolimod phase 3 program" and "Safety assessments were conducted during screening, at baseline, and at months 1, 2, 3, 6, 9, and 12" (pg 404) | Low | SAEs were predefined per standard criteria (death, life‐threatening event, persistent disability, congenital defect, unplanned hospitalisation, or otherwise medically significant) (FDA 2010 Clinical review of safety pg 151) | |
| Low | "Safety and tolerability (secondary study objectives) were assessed via reporting of | Unclear | Not specified | |
| Low | "An independent external data and safety monitoring board evaluated adverse events and other safety data" and "Adverse events were assessed and reported at each visit (scheduled and unscheduled) by the treating physicians. Laboratory evaluations were undertaken at a central laboratory". "Vital signs were obtained at each visit, and laboratory and hematologic measures were obtained at baseline, day 1, and months 1,3,6,9, and 12. Electrocardiograms were obtained at baseline, on days 1 and 7, and at months 1,3,6,12, and 24 hour Holter electrocardiographic monitoring was performed at selected sites at baseline, day 1, and month 3. Pulmonary function tests... were performed at screening and months 6 and 12" (pg 1126) | Low | Categorisation of SAEs conformed to ICH guidelines (International Conference on Harmonisation of Technical Requirements for Registration of Pharmaceuticals for Human Use) | |
| Low | "An independent data and safety monitoring board evaluated the safety" and "Study visits, including safety assessments, were scheduled at 2 weeks and 1, 2, 3, 6, 9, 12, 15, 18, 21, and 24 months after randomization" (pg 389) | Low | SAEs were predefined per standard criteria (death, life‐threatening event, persistent disability, congenital defect, unplanned hospitalisation, or otherwise medically significant) (FDA 2010 Clinical review of safety pg 151) | |
| Low | "Adverse events, serious adverse events assessments were conducted at screening, baseline, days 1 and 15, and months 1,2,3,4,5 and 6" (pg 2) and "Safety assessment included recording of AEs, SAEs, hematology values, vital signs, results of dermatological and ophthalmological examinations and results of pulmonary and liver function tests" (Supplementary data online appendix) | Low | Categorisation of SAEs conformed to ICH guidelines (International Conference on Harmonisation of Technical Requirements for Registration of Pharmaceuticals for Human Use) | |
| AE: adverse event; CT: chest tomography; ECG: electrocardiography; FDA: Food and Drug Administration; SAE: serious adverse event | ||||
| Outcome or subgroup title | No. of studies | No. of participants | Statistical method | Effect size |
| 1 At 6 months Show forest plot | 2 | Risk Ratio (M‐H, Random, 95% CI) | Subtotals only | |
| 1.1 Fingolimod 0.5 mg versus placebo | 1 | 114 | Risk Ratio (M‐H, Random, 95% CI) | 1.22 [0.96, 1.54] |
| 1.2 Fingolimod 1.25 mg versus placebo | 2 | 299 | Risk Ratio (M‐H, Random, 95% CI) | 1.27 [1.11, 1.45] |
| 1.3 Fingolimod 5.0 mg versus placebo | 1 | 184 | Risk Ratio (M‐H, Random, 95% CI) | 1.30 [1.10, 1.53] |
| 2 At 12 months Show forest plot | 1 | Risk Ratio (M‐H, Random, 95% CI) | Subtotals only | |
| 2.1 Fingolimod 0.5 mg versus interferon beta‐1a | 1 | 860 | Risk Ratio (M‐H, Random, 95% CI) | 1.18 [1.09, 1.27] |
| 2.2 Fingolimod 1.25 mg versus interferon beta‐1a | 1 | 851 | Risk Ratio (M‐H, Random, 95% CI) | 1.15 [1.06, 1.24] |
| 3 At 24 months Show forest plot | 2 | Risk Ratio (M‐H, Random, 95% CI) | Subtotals only | |
| 3.1 Fingolimod 0.5 mg versus placebo | 2 | 1556 | Risk Ratio (M‐H, Random, 95% CI) | 1.44 [1.28, 1.63] |
| 3.2 Fingolimod 1.25 mg versus placebo | 2 | 1572 | Risk Ratio (M‐H, Random, 95% CI) | 1.51 [1.29, 1.76] |
| Outcome or subgroup title | No. of studies | No. of participants | Statistical method | Effect size |
| 1 At 12 months Show forest plot | 1 | Risk Ratio (M‐H, Random, 95% CI) | Subtotals only | |
| 1.1 Fingolimod 0.5 mg versus interferon beta‐1a | 1 | 860 | Risk Ratio (M‐H, Random, 95% CI) | 1.02 [0.99, 1.06] |
| 1.2 Fingolimod 1.25 mg versus interferon beta‐1a | 1 | 851 | Risk Ratio (M‐H, Random, 95% CI) | 1.01 [0.98, 1.05] |
| 2 At 24 months Show forest plot | 2 | Risk Ratio (M‐H, Random, 95% CI) | Subtotals only | |
| 2.1 Fingolimod 0.5 mg versus placebo | 2 | 1556 | Risk Ratio (M‐H, Random, 95% CI) | 1.07 [1.02, 1.11] |
| 2.2 Fingolimod 1.25 mg versus placebo | 2 | 1572 | Risk Ratio (M‐H, Random, 95% CI) | 1.08 [1.03, 1.12] |
| Outcome or subgroup title | No. of studies | No. of participants | Statistical method | Effect size |
| 1 Withdrawals due to adverse events over 6 months Show forest plot | 3 | Risk Ratio (M‐H, Random, 95% CI) | Subtotals only | |
| 1.1 Fingolimod 0.5 mg versus placebo | 1 | 114 | Risk Ratio (M‐H, Random, 95% CI) | 2.0 [0.53, 7.61] |
| 1.2 Fingolimod 0.5 mg versus DMDs | 1 | 1028 | Risk Ratio (M‐H, Random, 95% CI) | 3.21 [1.16, 8.86] |
| 1.3 Fingolimod 1.25 mg versus placebo | 2 | 298 | Risk Ratio (M‐H, Random, 95% CI) | 1.60 [0.63, 4.03] |
| 1.4 Fingolimod 5.0 mg versus placebo | 1 | 187 | Risk Ratio (M‐H, Random, 95% CI) | 1.98 [0.62, 6.35] |
| 2 Withdrawals due to adverse events over 12 months Show forest plot | 1 | Risk Ratio (M‐H, Random, 95% CI) | Subtotals only | |
| 2.1 Fingolimod 0.5 mg versus interferon beta‐1a | 1 | 860 | Risk Ratio (M‐H, Random, 95% CI) | 1.51 [0.81, 2.80] |
| 2.2 Fingolimod 1.25 mg versus interferon beta‐1a | 1 | 851 | Risk Ratio (M‐H, Random, 95% CI) | 2.69 [1.54, 4.72] |
| 3 Withdrawals due to adverse events over 24 months Show forest plot | 2 | Risk Ratio (M‐H, Random, 95% CI) | Subtotals only | |
| 3.1 Fingolimod 0.5 mg versus placebo | 2 | 1556 | Risk Ratio (M‐H, Random, 95% CI) | 1.42 [0.89, 2.25] |
| 3.2 Fingolimod 1.25 mg versus placebo | 2 | 1572 | Risk Ratio (M‐H, Random, 95% CI) | 1.93 [1.48, 2.52] |
| 4 Withdrawals due to serious adverse events over 6 months Show forest plot | 3 | Risk Ratio (M‐H, Random, 95% CI) | Subtotals only | |
| 4.1 Fingolimod 0.5 mg versus placebo | 1 | 114 | Risk Ratio (M‐H, Random, 95% CI) | 1.67 [0.42, 6.65] |
| 4.2 Fingolimod 0.5 mg versus DMDs | 1 | 1028 | Risk Ratio (M‐H, Random, 95% CI) | 2.71 [0.83, 8.88] |
| 4.3 Fingolimod 1.25 mg versus placebo | 2 | 298 | Risk Ratio (M‐H, Random, 95% CI) | 2.36 [0.99, 5.66] |
| 4.4 Fingolimod 5.0 mg versus placebo | 1 | 187 | Risk Ratio (M‐H, Random, 95% CI) | 2.77 [1.04, 7.38] |
| 5 Withdrawals due to serious adverse events over 12 months Show forest plot | 1 | Risk Ratio (M‐H, Random, 95% CI) | Subtotals only | |
| 5.1 Fingolimod 0.5 mg versus interferon beta‐1a | 1 | 860 | Risk Ratio (M‐H, Random, 95% CI) | 1.21 [0.72, 2.02] |
| 5.2 Fingolimod 1.25 mg versus interferon beta‐1a | 1 | 851 | Risk Ratio (M‐H, Random, 95% CI) | 1.85 [1.15, 2.96] |
| 6 Withdrawals due to serious adverse events over 24 months Show forest plot | 2 | Risk Ratio (M‐H, Random, 95% CI) | Subtotals only | |
| 6.1 Fingolimod 0.5 mg versus placebo | 2 | 1556 | Risk Ratio (M‐H, Random, 95% CI) | 0.91 [0.55, 1.50] |
| 6.2 Fingolimod 1.25 mg versus placebo | 2 | 1572 | Risk Ratio (M‐H, Random, 95% CI) | 0.98 [0.74, 1.29] |
| Outcome or subgroup title | No. of studies | No. of participants | Statistical method | Effect size |
| 1 At 6 months Show forest plot | 2 | Rate Ratio (Random, 95% CI) | Subtotals only | |
| 1.1 Fingolimod 0.5 mg versus placebo | 1 | Rate Ratio (Random, 95% CI) | 0.51 [0.26, 0.99] | |
| 1.2 Fingolimod 1.25 mg versus placebo | 2 | Rate Ratio (Random, 95% CI) | 0.44 [0.28, 0.70] | |
| 1.3 Fingolimod 5.0 mg versus placebo | 1 | Rate Ratio (Random, 95% CI) | 0.47 [0.26, 0.83] | |
| 2 At 12 months Show forest plot | 1 | Rate Ratio (Random, 95% CI) | 0.56 [0.46, 0.69] | |
| 2.1 Fingolimod 0.5 mg versus interferon beta‐1a | 1 | Rate Ratio (Random, 95% CI) | 0.48 [0.34, 0.70] | |
| 2.2 Fingolimod 1.25 versus interferon beta‐1a | 1 | Rate Ratio (Random, 95% CI) | 0.61 [0.47, 0.78] | |
| 3 At 24 months Show forest plot | 2 | Rate Ratio (Random, 95% CI) | Subtotals only | |
| 3.1 Fingolimod 0.5 mg versus placebo | 2 | Rate Ratio (Random, 95% CI) | 0.50 [0.40, 0.62] | |
| 3.2 Fingolimod 1.25 mg versus placebo | 2 | Rate Ratio (Random, 95% CI) | 0.47 [0.38, 0.59] | |
| Outcome or subgroup title | No. of studies | No. of participants | Statistical method | Effect size |
| 1 At 6 months Show forest plot | 4 | Risk Ratio (M‐H, Random, 95% CI) | Subtotals only | |
| 1.1 Fingolimod 0.5 mg versus placebo | 3 | 1519 | Risk Ratio (M‐H, Random, 95% CI) | 1.42 [1.33, 1.51] |
| 1.2 Fingolimod 1.25 mg versus placebo | 4 | 1674 | Risk Ratio (M‐H, Random, 95% CI) | 1.43 [1.34, 1.53] |
| 1.3 Fingolimod 5 mg versus placebo | 1 | 158 | Risk Ratio (M‐H, Random, 95% CI) | 1.74 [1.35, 2.25] |
| 2 At 12 months Show forest plot | 3 | Risk Ratio (M‐H, Random, 95% CI) | Subtotals only | |
| 2.1 Fingolimod 0.5 mg versus placebo | 2 | 1343 | Risk Ratio (M‐H, Random, 95% CI) | 1.39 [1.30, 1.48] |
| 2.2 Fingolimod 1.25 mg versus placebo | 2 | 1319 | Risk Ratio (M‐H, Random, 95% CI) | 1.39 [1.30, 1.48] |
| 2.3 Fingolimod 0.5 mg versus interferon beta‐1a | 1 | 728 | Risk Ratio (M‐H, Random, 95% CI) | 1.12 [1.05, 1.19] |
| 2.4 Fingolimod 1.25 mg versus interferon beta‐1a | 1 | 706 | Risk Ratio (M‐H, Random, 95% CI) | 1.13 [1.06, 1.20] |
| 3 At 24 months Show forest plot | 2 | Risk Ratio (M‐H, Random, 95% CI) | Subtotals only | |
| 3.1 Fingolimod 0.5 mg versus placebo | 2 | 1226 | Risk Ratio (M‐H, Random, 95% CI) | 1.36 [1.27, 1.45] |
| 3.2 Fingolimod 1.25 mg versus placebo | 2 | 1182 | Risk Ratio (M‐H, Random, 95% CI) | 1.43 [1.33, 1.52] |
| Outcome or subgroup title | No. of studies | No. of participants | Statistical method | Effect size |
| 1 At 12 months Show forest plot | 2 | Mean Difference (IV, Random, 95% CI) | Subtotals only | |
| 1.1 Fingolimod 0.5 mg versus placebo | 1 | 733 | Mean Difference (IV, Random, 95% CI) | ‐15.30 [‐24.34, ‐6.26] |
| 1.2 Fingolimod 1.25 mg versus placebo | 1 | 706 | Mean Difference (IV, Random, 95% CI) | ‐16.0 [‐25.23, ‐6.77] |
| 1.3 Fingolimod 0.5 mg versus interferon beta‐1a | 1 | 733 | Mean Difference (IV, Random, 95% CI) | ‐0.5 [‐6.32, 5.32] |
| 1.4 Fingolimod 1.25 mg versus interferon beta‐1a | 1 | 711 | Mean Difference (IV, Random, 95% CI) | ‐3.7 [‐9.18, 1.78] |
| 2 At 24 months Show forest plot | 2 | Mean Difference (IV, Random, 95% CI) | Subtotals only | |
| 2.1 Fingolimod 0.5 mg versus placebo | 2 | 1216 | Mean Difference (IV, Random, 95% CI) | ‐20.43 [‐34.03, ‐6.83] |
| 2.2 Fingolimod 1.25 mg versus placebo | 2 | 1171 | Mean Difference (IV, Random, 95% CI) | ‐32.51 [‐40.39, ‐24.62] |
| Outcome or subgroup title | No. of studies | No. of participants | Statistical method | Effect size |
| 1 At 6 months Show forest plot | 2 | Mean Difference (Random, 95% CI) | Subtotals only | |
| 1.1 Fingolimod 1.25 mg versus placebo (Hamburg Quality of Life Questionnaire) | 1 | Mean Difference (Random, 95% CI) | ‐0.14 [‐9.13, 8.85] | |
| 1.2 Fingolimod 0.5 mg versus DMDs (Change in FS36 Mental component summary) | 1 | Mean Difference (Random, 95% CI) | 1.8 [0.42, 3.18] | |
| 1.3 Fingolimod 0.5 mg versus DMDs (Change in FS36 Physical component summary) | 1 | Mean Difference (Random, 95% CI) | 1.30 [0.30, 2.30] | |
| 2 At 24 months Show forest plot | 1 | Mean Difference (IV, Random, 95% CI) | Subtotals only | |
| 2.1 Fingolimod 0.5 mg versus placebo (Euro quality of life scale) | 1 | 713 | Mean Difference (IV, Random, 95% CI) | ‐0.01 [‐0.04, 0.02] |