Fingolimod para la esclerosis múltiple recurrente‐remitente
Resumen
Antecedentes
El fingolimod se autorizó en 2010 para el tratamiento de los pacientes con la forma recurrente‐remitente (RR) de esclerosis múltiple (EM). Se diseñó para reducir la frecuencia de las exacerbaciones y retardar el empeoramiento de la discapacidad. Se han planteado preocupaciones sobre su seguridad y eficacia, principalmente en comparación con otros fármacos que modifican la enfermedad (FME).
Objetivos
Evaluar la seguridad y los efectos beneficiosos del fingolimod versus placebo, u otros fármacos que modifican la enfermedad (FME), para reducir la actividad de la enfermedad en los pacientes con esclerosis múltiple recurrente‐remitente (EMRR).
Métodos de búsqueda
Se hicieron búsquedas en el registro especializado del Grupo Cochrane de Esclerosis Múltiple y Enfermedades Raras del Sistema Nervioso Central (Cochrane Multiple Sclerosis and Rare Diseases of the Central Nervous System (CNS) Group) y en los US Food and Drug Administration reports (15 febrero 2016).
Criterios de selección
Ensayos controlados aleatorios (ECA) que evalúan los efectos beneficiosos y perjudiciales del fingolimod versus placebo u otros FME aprobados para los pacientes con EMRR.
Obtención y análisis de los datos
Se utilizaron los procedimientos metodológicos estándar previstos por Cochrane.
Resultados principales
Seis ECA cumplieron los criterios de inclusión. La población general incluyó 5152 participantes; 1621 controles y 3531 tratados con fingolimod en dosis diferentes; 2061 con 0,5 mg; 1376 con 1,25 mg y 94 con 5 mg diarios. Entre los controles, 923 participantes fueron tratados con placebo y 698 con otros FME. La duración del tratamiento fue seis meses en tres ensayos, 12 meses en uno y 24 meses en dos. Un estudio tuvo alto riesgo de sesgo por el cegamiento, tres estudios tuvieron alto riesgo de sesgo por el informe incompleto de los resultados y cuatro estudios tuvieron alto riesgo de sesgo por otras razones (los coautores estaban afiliados a la compañía farmacéutica). Se recuperaron 10 ensayos en curso; cuatro de ellos han sido completados.
Al comparar fingolimod administrado a la dosis autorizada de 0,5 mg con placebo, se encontró que el fármaco a los 24 meses aumentó la probabilidad de no presentar recurrencia (cociente de riesgos [CR] 1,44; intervalo de confianza [IC] del 95%: 1,28 a 1,63; pruebas de calidad moderada), pero podría dar lugar a poca o ninguna diferencia en la prevención de la progresión de la discapacidad (CR 1,07; IC del 95%: 1,02 a 1,11; variables principales de resultado clínicas; pruebas de baja calidad). Se observó un efecto beneficioso en otras medidas de actividad inflamatoria de la enfermedad que incluyen la actividad clínica (tasas anuales de recurrencia): cociente de tasas 0,50; IC del 95%: 0,40 a 0,62; pruebas de calidad moderada; y la actividad de imagenología de resonancia magnética (IRM) (lesiones realzadas con gadolinio): CR de no presentar lesiones realzadas con gadolinio (IRM): 1,36; IC del 95%: 1,27 a 1,45; pruebas de baja calidad. El cambio medio en la carga de la lesión potenciada en T2 por IRM favoreció a fingolimod a los 12 y a los 24 meses.
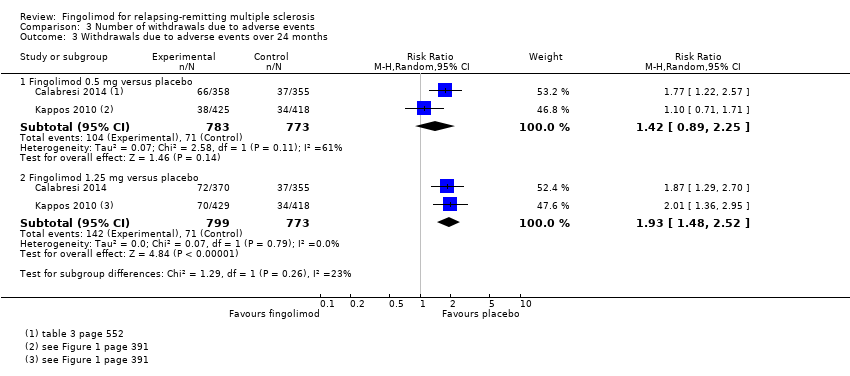
No se observó un aumento significativo en el riesgo de interrupción debido a eventos adversos para el fingolimod 0,5 mg en comparación con placebo a los seis y a los 24 meses. El riesgo de interrupción del fingolimod fue significativamente mayor en comparación con placebo para la dosis de 1,25 mg a los 24 meses (CR 1,93; IC del 95%: 1,48 a 2,52).
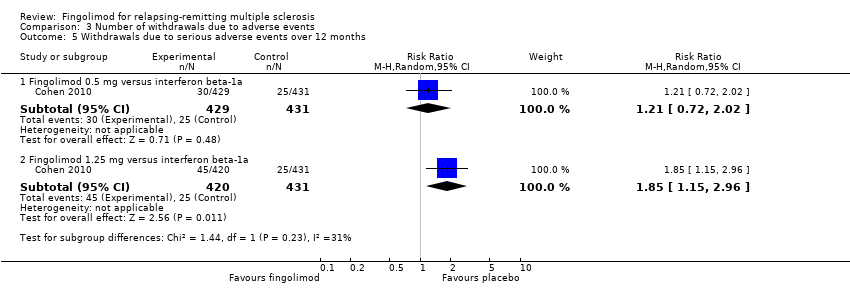
No se observó un aumento significativo en el riesgo de interrupción debido a eventos adversos graves para el fingolimod 0,5 mg en comparación con placebo a los seis y a los 24 meses. Se encontró un aumento significativo en el riesgo de interrupción debido a eventos adversos graves para el fingolimod 5 mg (CR 2,77; IC del 95%: 1,04 a 7,38) en comparación con placebo a los seis meses.
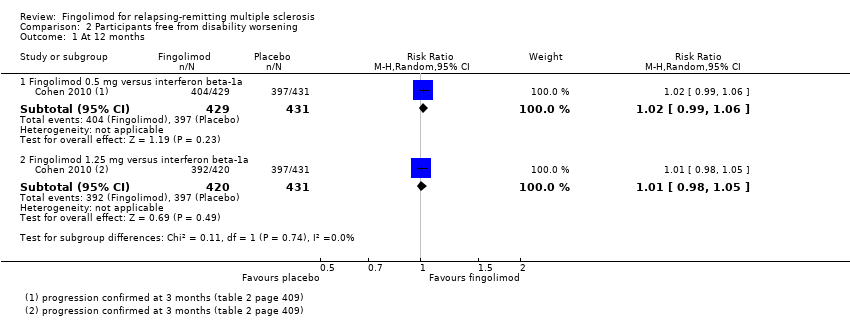
Al comparar fingolimod 0,5 mg con interferón beta‐1a intramuscular, se encontraron pruebas de calidad moderada de que al año el fármaco aumentó discretamente el número de participantes sin recurrencia (CR 1,18; IC del 95%: 1,09 a 1,27) o de lesiones realzadas con gadolinio (CR 1,12; IC del 95%: 1,05 a 1,19) y disminuyó la tasa de recurrencia (cociente de tasas 0,48; IC del 95%: 0,34 a 0,70). No se detectaron ventajas en la prevención de la progresión de la discapacidad (CR 1,02; IC del 95%: 0,99 a 1,06; pruebas de baja calidad). No se detectaron diferencias significativas en el cambio en la carga de la lesión potenciada en T2.
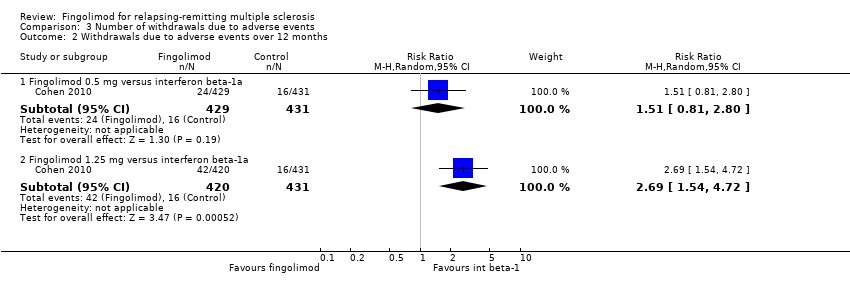
Hubo mayores probabilidades de que los participantes interrumpieran el fingolimod en comparación con otros FME debido a eventos adversos a corto plazo (seis meses) (CR 3,21; IC del 95%: 1,16 a 8,86), pero no hubo diferencias significativas versus el interferón beta‐1a a los 12 meses (CR 1,51; IC del 95%: 0,81 a 2,80; pruebas de calidad moderada). Una incidencia mayor de eventos adversos indicó una tasa menor de tolerabilidad del fingolimod en comparación con el interferón beta‐1a.
La calidad de vida mejoró en los participantes después de cambiar de un FME diferente a fingolimod a los seis meses, pero este efecto no se encontró en comparación con placebo a los 24 meses.
Todos los estudios fueron patrocinados por Novartis Pharma.
Conclusiones de los autores
El tratamiento con fingolimod en comparación con placebo en pacientes con EMRR es eficaz para reducir la actividad inflamatoria de la enfermedad, pero puede dar lugar a poca o ninguna diferencia en la prevención del empeoramiento de la discapacidad. El riesgo de retiro debido a eventos adversos requiere la monitorización cuidadosa de los pacientes con el transcurso del tiempo. Las pruebas sobre el perfil de riesgo‐beneficio del fingolimod en comparación con interferón beta‐1a intramuscular no estuvieron claras y se basaron en un número pequeño de ECA directos con una duración corta del seguimiento. Los resultados de los ensayos en curso posiblemente cumplirán con estos aspectos.
PICOs
Resumen en términos sencillos
Fingolimod para la esclerosis múltiple recurrente‐remitente
Antecedentes
Debido a la patogenia autoinmune de la esclerosis múltiple (EM), la mayoría de los tratamientos se han basado en las propiedades inmunomoduladoras e inmunosupresoras de fármacos como interferones, glatiramer, azatioprina, ciclofosfamida y mitoxantrona.
El fingolimod fue el primer agente que se aprobó como tratamiento oral en 2010. Se absorbe de manera eficaz, su absorción no está afectada por la ingesta dietética y, como tratamiento oral, ha despertado gran interés en los pacientes al tener una vía de administración más aceptable que las inyecciones.
Objetivo de la revisión
Evaluar la seguridad y los efectos beneficiosos del fingolimod para reducir la actividad de la enfermedad en los pacientes con EM recurrente‐remitente (EMRR). Han aparecido varios problemas de seguridad que incluyen las infecciones graves y los efectos adversos cardíacos.
Características de los estudios
Se incluyeron seis estudios publicados entre 2006 y 2014, con 5152 pacientes que presentaban EMRR. La duración del tratamiento fue de seis meses en tres estudios, 12 meses en un estudio, y 24 meses en dos estudios.
Resultados clave y calidad de las pruebas
La conclusión principal de esta revisión fue que fingolimod, administrado como monoterapia a la dosis autorizada de 0,5 mg una vez al día aumenta la probabilidad no presentar recurrencia a los 24 meses en comparación con placebo. El efecto beneficioso se confirmó mediante medidas de actividad de la enfermedad definidas por los exámenes de imaginología de resonancia magnética (IRM). Sin embargo, no hubo efectos sobre la prevención del empeoramiento de la discapacidad; el tratamiento no se asoció con un mayor riesgo de retiros de pacientes debido a eventos adversos.
Al comparar la misma dosis de fingolimod con interferón beta‐1a intramuscular, el fármaco logró un aumento discreto al año en el número de participantes sin recurrencia o sin lesiones inflamatorias realzadas y disminuyó la tasa de recurrencia. Nuevamente, no se detectaron ventajas en la prevención de la progresión de la discapacidad. Se encontró una mayor probabilidad de interrupción debido a eventos adversos a corto plazo (seis meses) para el fingolimod en comparación con los fármacos inmunomoduladores, y no hubo diferencias significativas en comparación con interferón beta a los 12 meses.
La duración de todos los estudios fue igual o menor de 24 meses, por lo que la eficacia (pero principalmente la seguridad) del fingolimod más allá de los 24 meses todavía no está clara. Este es un punto clave para una enfermedad que dura toda la vida con la probabilidad de tratamientos crónicos, como la EM.
El riesgo de eventos adversos requiere la monitorización cuidadosa de los pacientes con el transcurso del tiempo e indica la necesidad de estudios con un seguimiento más prolongado, en especial si se considera la advertencia reciente sobre el desarrollo de leucoencefalopatía multifocal progresiva.
Los seis estudios incluidos en esta revisión fueron patrocinados por Novartis Pharma, y la mayoría de los coautores de los artículos publicados estaban afiliados a la compañía farmacéutica; lo anterior se reconoce como una posible fuente de sesgo.
Conclusiones de los autores
Summary of findings
| Fingolimod 0.5 mg versus placebo for relapsing‐remitting multiple sclerosis | |||||
| Participants or population: people with relapsing‐remitting multiple sclerosis | |||||
| Outcomes at 24 months | Illustrative comparative risks* (95% CI) | Relative effect | No. of Participants | Quality of the evidence | |
| Assumed risk | Corresponding risk | ||||
| Control (placebo) | Fingolimod 0.5 mg | ||||
| Participants free from relapse | 49 per 100 | 70 per 100 | RR 1.44 | 1556 | ⊕⊕⊕⊝ |
| Participants free from disability worsening | 82 per 100 | 87 per 100 | RR 1.07 | 1556 | ⊕⊕⊝⊝ |
| Withdrawals due to adverse events | 9 per 100 | 13 per 100 | RR 1.42 | 1556 | ⊕⊝⊝⊝ |
| Annualised relapse rate | ‐ | ‐ | Rate ratio 0.50 | 1556 | ⊕⊕⊕⊝ |
| Participants free from MRI gadolinium‐enhancing lesions | 65 per 100 | 89 per 100 | RR 1.36 | 1226 | ⊕⊕⊝⊝ |
| *For dichotomous outcomes, the corresponding risk with fingolimod 0.5 mg (and its 95% CI) is based on the assumed risk with the control group (i.e. the mean proportion of events in the control group across the two studies) and the relative effect of fingolimod (and its 95% CI). For the annualised relapse rate, only the relative effect (i.e., the rate ratio) is given, because the assumed risk with the control group is not estimable. | |||||
| GRADE Working Group grades of evidence | |||||
| a Study limitations: significant differences in reasons for incomplete outcome data between treatment and control groups. | |||||
| Fingolimod 0.5 mg versus intramuscular interferon beta‐1a for relapsing‐remitting multiple sclerosis | |||||
| Participants or population: people with relapsing‐remitting multiple sclerosis | |||||
| Outcomes at 12 months | Illustrative comparative risks* (95% CI) | Relative effect | No. of Participants | Quality of the evidence | |
| Assumed risk | Corresponding risk | ||||
| Control (interferon beta‐1a) | Fingolimod 0.5 mg | ||||
| Participants free from relapse | 70 per 100 | 83 per 100 | RR 1.18 | 860 | ⊕⊕⊕⊝ |
| Participants free from disability worsening | 92 per 100 | 94 per 100 | RR 1.02 | 860 | ⊕⊕⊝⊝ |
| Withdrawals due to adverse events | 4 per 100 | 6 per 100 | RR 1.51 | 860 | ⊕⊕⊕⊝ |
| Annualised relapse rate | ‐ | ‐ | Rate ratio 0.48 | 860 | ⊕⊕⊕⊝ |
| Participants free from MRI gadolinium‐enhancing lesions | 81 per 100 | 90 per 100 | RR 1.12 | 728 | ⊕⊕⊕⊝ |
| *For dichotomous outcomes, the corresponding risk with the intervention (and its 95% CI) is based on the assumed risk with the control (i.e. the mean proportion of events in the control group across studies) and the relative effect of the intervention (and its 95% CI). For the annualised relapse rate, only the relative effect (i.e., the rate ratio) is given. | |||||
| GRADE Working Group grades of evidence | |||||
| a Imprecision: total number of events (i.e. the number of participants with disability worsening/gadolinium‐enhancing lesions) was less than 300 (the threshold rule‐of‐thumb value), and thus the available evidence did not meet the optimal information size criteria. b Indirectness: surrogate outcome (progression confirmed at three months of follow‐up). | |||||
Antecedentes
Descripción de la afección
La esclerosis múltiple (EM) es la causa no traumática más frecuente de discapacidad neurológica en adultos jóvenes (Compston 2002; Noseworthy 2000). La incidencia general de la EM es de 3,5 a 6,6 personas por 100 000, mientras que la tasa de prevalencia es de 100 a 120 personas por 100 000(Alonso 2008; Richards 2002). Una revisión reciente mostró un aumento de la tasa de prevalencia e incidencia con el transcurso del tiempo alrededor de la Cuenca mediterránea, en especial en mujeres ( Elhami 2011). Europa occidental y Norteamérica son áreas de alta prevalencia (Koch‐Henriksen 2010). El costo social asociado con la EM es alto debido a su larga duración, la pérdida temprana de la productividad, la necesidad de ayuda para la actividades cotidianas y el uso de inmunoterapia sumamente costosa y asistencia sanitaria multidisciplinaria (Koutsouraki 2010). Se cree ampliamente que la EM es una enfermedad de mediación inmune en la que las manifestaciones y el curso clínico, así como la respuesta al tratamiento, parecen ser heterogéneos, como lo pueden ser los mecanismos patógenos subyacentes (Compston 2008).
Se distinguen diferentes subtipos clínicos de EM. Aproximadamente el 80% de los pacientes tienen un curso inicial de la enfermedad caracterizado por recurrencias y remisiones (EM recurrente‐remitente [EMRR]). Los restantes tienen EM progresiva primaria o transitoria y experimentan disminución progresiva de la función neurológica a partir de la aparición. En los pacientes con EMRR, la discapacidad puede ser resultado de uno o más de los siguientes factores: recuperación incompleta de las recurrencias, desarrollo de EM progresiva secundaria (EMPS) o deficiencia cognitiva. Sin embargo, hasta el 17% de los pacientes con EM benigna nunca desarrollan discapacidad física clínicamente importante (Pittock 2004).
Debido a la patogenia autoinmune de la enfermedad, la base del tratamiento son los fármacos inmunomoduladores que incluyen el interferón beta y el acetato de glatiramer, que habitualmente se consideran fármacos muy seguros. Sin embargo, solamente permiten un control parcial de la enfermedad. El arsenal disponible se ha ampliado en años recientes con agentes inyectables y orales con mecanismos de acción más selectivos y mayor eficacia (Oh J 2013).
Descripción de la intervención
El fingolimod es un modulador del receptor esfingosina‐1‐fosfato (S1P), 2‐amino‐2‐(2‐[4‐octilfenil]etil)‐1, 3‐propanediol (Brinkmann 2002).
Es un profármaco que es fosforilado por las quinasas de esfingosina a fosfofingolimod activo. Hay al menos cinco subtipos de receptores S1P, conocidos como subtipos S1P 1‐5 (S1P1‐5), y cuatro se unen al fingolimod‐fosfato (Chun 2010). El S1P1 se expresa marcadamente en los linfocitos T y B. El fingolimod induce la disminución del número de receptores S1P1 de los linfocitos y previene el egreso de las células de los tejidos linfoides secundarios (Chun 2010; Pinschewer 2000). por lo tanto, los linfocitos se mantienen fuera del Sistema Nervioso Central (SNC) (Matloubian 2004; Pinschewer 2000). Después de la administración oral, el fingolimod se absorbe de manera eficaz y su absorción es no afectada por la ingesta dietética. Después de la administración de una dosis, la concentración sanguínea del fingolimod aumenta de forma sostenida las primeras 12 horas y se mantiene elevada durante el período de 24 horas hasta la próxima dosis. Tiene una vida media de seis a nueve días. Las concentraciones sanguíneas estables se alcanzan dentro de uno a dos meses después de la administración una vez al día y los niveles estables son aproximadamente diez veces mayores que con la dosis inicial (David 2012).
Otros efectos de fingolimod son la activación transitoria de los receptores S1P en los miocitos ventriculares (asociada con la reducción transitoria de la frecuencia cardíaca) y el aumento de la hiperreactividad pulmonar (asociada con los efectos de broncoespasmo y constricción de las vías respiratorias), mediados por S1P1 y S1P3 y una función en la regulación de la permeabilidad endotelial y el tono vascular. También se ha informado que el fingolimod es un antagonista competitivo de los receptores canabinoides, y se ha mostrado que la activación de los receptores canabinoides estimula el catabolismo de la esfingomielina (Paugh 2006).
El fingolimod puede prevenir los rechazos del injerto renal y suprimir diversos trastornos autoinmunes (Liu 2013).
El fingolimod, comercializado como Gilenya ® (Novartis Pharma), se proporciona como cápsulas de gelatina dura de 0,5 mg para uso oral, una vez al día. Cada cápsula contiene 0,56 mg de clorhidrato de fingolimod, equivalente a 0,5 mg de fingolimod.
De qué manera podría funcionar la intervención
Se ha mostrado que el fingolimod reduce la actividad de la enfermedad y los déficits neurológicos establecidos en los modelos animales (Brinkmann 2002). La administración profiláctica de fingolimod a animales con encefalitis autoinmune experimental (EAE), un modelo de EM, previene completamente el desarrollo de EAE, mientras que la administración terapéutica reduce significativamente la gravedad clínica de la EAE (Chun 2010). Los ensayos de fase II y fase III en pacientes con EMRR mostraron una reducción significativa en la tasa de recurrencia y del número de lesiones realzadas con gadolinio y lesiones potenciadas en T2 nuevas en la imaginología de resonancia magnética (IRM), en comparación con placebo e interferón beta‐1a (Oh J 2013). Estos efectos se han relacionado con el secuestro de los linfocitos dentro de los ganglios linfáticos y con una disminución significativa de los linfocitos que circulan en la periferia, lo que impide que los linfocitos autoagresivos crucen la barrera hematoencefálica. Algunos estudios han mostrado que el fingolimod puede promover procesos neuroprotectores y reparadores dentro del SNC mediante la modulación de los receptores S1P en las células gliales y neurales (Miron 2008; Paugh 2006; Pinschewer 2000).
El fingolimod fue el primer fármaco autorizado como tratamiento oral en los Estados Unidos el 21 de septiembre de 2010 por la Food and Drug Administration (FDA) de los EE.UU. "para el tratamiento de los pacientes con formas recurrentes de EM para reducir la frecuencia de las exacerbaciones clínicas y retardar la aparición de discapacidades físicas." La autorización de la comercialización solamente se autorizó para la dosis de 0,5 mg debido a un perfil de seguridad más favorable para esta dosis en comparación con la dosis de 1,25 mg: "la dosis mayor, a la vez que expone a los pacientes a más riesgos, no expone a los pacientes a un aumento significativo de la eficacia," y se proporcionaron recomendaciones específicas para la monitorización de los pacientes y las contraindicaciones (FDA 2010).
La aprobación por parte del European Medicines Agency Committee for Medicinal Products for Human Use el 27 enero, 2011(EMA 2011), ha sido actualizada recientemente (EMA 2015). Gilenya® se indica como un tratamiento modificador de la enfermedad único en la EMRR sumamente activa para los siguientes grupos de pacientes adultos.
-
Pacientes con gran actividad de la enfermedad a pesar del tratamiento con al menos un fármaco que modifica la enfermedad (FME). Estos pacientes se pueden definir como los que no han logrado responder a un curso completo y adecuado (habitualmente al menos un año de tratamiento) de al menos un FME. Los pacientes deben haber tenido al menos una recurrencia en el año anterior mientras estaban en tratamiento y tener al menos nueve lesiones en T2 hiperintensas en la IRM craneal o al menos una lesión realzada con gadolinio. Un paciente que "no responde" también se podría definir como un paciente con una tasa de recurrencia sin cambio o aumentada o recurrencias graves en curso, en comparación con el año anterior.
-
Pacientes con EMRR grave que evoluciona rápidamente, definida como dos o más recurrencias invalidantes en un año y una o más lesiones realzadas con gadolinio en la IRM cerebral o un aumento significativo de la carga de lesiones en T2 en comparación con una IRM anterior.
Por qué es importante realizar esta revisión
Los tratamientos orales han despertado un gran interés activo entre las partes interesadas, lo que indica una nueva era de tratamientos de la EM con mejor eficacia y vías más aceptables de administración. Después de la autorización del uso del fingolimod para el tratamiento de la EMRR, se han publicado diferentes revisiones descriptivas que confirman la efectividad del fingolimod en los pacientes con EM(Del Santo 2011; Freedman 2013; Hillert 2012; Hutchinson 2014; Oh J 2013), pero que también señalan inquietudes acerca de los eventos adversos graves (Lu 2013; Parfenov 2013). Han aparecido varios problemas de seguridad con la monitorización posterior a la comercialización, que incluyen infecciones graves y efectos adversos cardíacos (AIFA 2015; EMA 2015; Oh J 2013). Se ha cuestionado la ventaja de este tratamiento (en comparación con otros FME), lo que indica la necesidad de reservar el uso del fingolimod para los pacientes que se puedan monitorizar cuidadosamente.
Hasta la fecha no se ha realizado una revisión sistemática de ensayos que evalúan el efecto beneficioso y la seguridad del fingolimod. Al evaluar y actualizar su perfil de riesgo‐beneficio, los resultados de esta revisión podrían aclarar el uso del fingolimod en la práctica clínica.
Objetivos
Evaluar la seguridad y los efectos beneficiosos del fingolimod versus placebo, u otros fármacos que modifican la enfermedad (FME), para reducir la actividad de la enfermedad en los pacientes con esclerosis múltiple recurrente‐remitente (EMRR).
Métodos
Criterios de inclusión de estudios para esta revisión
Tipos de estudios
Se consideraron los ensayos controlados aleatorios (ECA) que examinaron fingolimod versus placebo u otros fármacos que modifican la enfermedad (FME) autorizados para la esclerosis múltiple recurrente‐remitente (EMRR), independientemente del estado de publicación y el idioma. Se excluyeron los estudios cruzados (crossover).
Tipos de participantes
Se incluyeron participantes de cualquier edad, sexo y raza afectados por EMRR según los criterios de diagnóstico de McDonald (Mc Donald 2001; Polman 2005; Polman 2011).
Tipos de intervenciones
-
Fingolimod, cualquier dosis y vía de administración, versus placebo sin restricción de la duración del tratamiento.
-
Fingolimod, cualquier dosis y vía de administración, versus otros FME autorizados sin restricción de la duración del tratamiento.
Tipos de medida de resultado
Resultados primarios
1. Número de participantes sin recurrencias a los seis, 12 y 24 meses después de la asignación al azar y al final del seguimiento.
2. Número de participantes sin empeoramiento de la discapacidad a los 12, 24 y 36 meses después de la asignación al azar y al final del seguimiento. El empeoramiento de la discapacidad se define como un aumento de al menos 1 punto en la Expanded Disability Status Scale (EDSS) (Kurtzke 1983), o un aumento de 0,5 puntos si la EDSS inicial fue 5,5; confirmado durante dos exámenes neurológicos posteriores separados por un intervalo de al menos seis meses sin recurrencias. Se consideraron por separado los estudios que informaron el empeoramiento de la discapacidad mediante criterios diferentes.
3. Número de participantes que se retiraron del estudio debido a
a) eventos adversos;
b) eventos adversos graves, es decir muerte, eventos potencialmente mortales, hospitalización, discapacidad o daño permanente, defecto congénito / anomalía congénita (FDA 2013).
Resultados secundarios
4. Tasa anual de recurrencia a los seis, 12 y 24 meses después de la asignación al azar y al final del seguimiento.
5. Número de participantes sin lesiones resaltadas con gadolinio en la IRM a los seis, 12 y 24 meses después de la asignación al azar y al final del seguimiento.
6. Cambio medio de la carga total de lesiones potenciadas en T‐2 en la IRM a los 12 y 24 meses después de la asignación al azar y al final del seguimiento.
7. Calidad de vida medida con cuestionarios validados como el MSQOL‐54 (Vickrey 1995).
Results
Description of studies
Results of the search
Results of the search are described in a PRISMA flow chart (Figure 1; Moher 2009). We assessed for eligibility 81 out of 481 records; 19 studies did not satisfy the inclusion criteria (Characteristics of excluded studies). We included a total of six RCTs (Calabresi 2014; Cohen 2010; Fox 2014; Kappos 2006, Kappos 2010; Saida 2012). Fifty‐six reports were ancillary to these primary studies. We found 10 ongoing trials; six are still ongoing (Characteristics of ongoing studies) and four have been completed and are awaiting classification (NCT01317004; NCT01333501; NCT01534182; NCT01623596) (Characteristics of studies awaiting classification).

Study flow diagram.
Included studies
The six trials were as follows.
-
Calabresi 2014 (FREEDOMS II study) (phase III).
-
Cohen 2010 (TRANSFORMS study) (phase III).
-
Fox 2014 (EPOC study) (phase IV).
-
Kappos 2006 (phase II).
-
Kappos 2010 (FREEDOMS study) (phase III).
-
Saida 2012 (phase II).
These trials were published between 2006 and 2014. Four studies compared fingolimod to placebo (Calabresi 2014; Kappos 2006; Kappos 2010; Saida 2012), one to intramuscular interferon beta‐1a (Cohen 2010), and one to other DMDs (interferon beta‐1a, interferon beta‐1b, glatiramer acetate) (Fox 2014). Four studies used fingolimod at doses of 0.5 mg and 1.25 mg (Calabresi 2014; Cohen 2010; Kappos 2010; Saida 2012). One study used doses of 1.25 mg and 5.0 mg (Kappos 2006). One study evaluated only the dose of 0.5 mg (Fox 2014). Fingolimod was administered orally in all studies.
The primary outcome was annualised relapse rate in three studies (Calabresi 2014; Cohen 2010; Kappos 2010); MRI measures of activity in two studies: number of gadolinium‐enhancing lesions (Kappos 2006) and percentage of participants free from gadolinium‐enhancing lesions (Saida 2012); and treatment satisfaction in the other study (Fox 2014). Outcome measures and time points of assessment considered by each of the included trials are listed in Table 1.
| Study name | Clinical outcomes | Time point assessment | MRI outcomes | Time point assessment |
| 1.Annualised relapse rate 2. Time to disability progression confirmed at 3 months 3. Time to disability progression confirmed at 6 months 4. Safety 5. Time to first relapse 6. Proportion of relapse‐free participants 7. Change from baseline to the end of study on the MSFC score 8. Quality of life using the Euro quality of life scale (EQ‐5D) 9. Patient Reported Indices in Multiple Sclerosis 10. Fatigue using the Modified Fatigue Impact Scale | 24 months | 1.Percent brain‐volume change from baseline at 24 months 2.Number and volume of gadolinium‐enhancing T1 lesions 3. Number of new or newly enlarged T2 lesions 4. Proportion of participants free of gadolinium‐enhancing T1 lesions 5. Proportion of participants free of new or newly enlarged T2 lesions 6. Proportion of participants free of new inflammatory activity (no gadolinium‐enhancing T1 lesions and no new or newly enlarged T2 lesions) 7. Percentage change from baseline in volume of gadolinium‐enhanced T1 lesions 8. Percentage change from baseline in volume of new or newly enlarged T2 lesions 9. Brain volume | 24 months | |
| 1. Annualised relapse rate 2. Progression of disability (confirmed at 3 months) | 12 months | Number of new or enlarged lesions on T2‐weighted scans | 12 months | |
| 1. Treatment satisfaction 2. Fatigue 3. Depression 4. Activities of daily living 5. Health‐related Quality Of Life 6, Side effects | 6 months | Not included | ||
| 1. Number of participants remaining free of relapse 2. Annualised relapse rate 3, Time to the first relapse | 6 months | 1.Number of gadolinium‐enhanced lesions per participant recorded on T1‐weighted MRI at monthly intervals for 6 months 2.Total volume of gadolinium‐enhanced lesions per participants 3. Proportion of participants with gadolinium‐enhanced lesions 4. Total number of new lesion per participant on T‐weighted images 5. Changes in lesion volume on T2‐weighted images 6. Brain volume from baseline to month 6 | 6 months | |
| 1. Annualised relapse rate 2. Time to confirmed disability progression (confirmed after 3 months ) 3. Time to a first relapse 4. Time to disability progression (confirmed after 6 months) 5. Changes in the EDSS score 6. Changes in the MSFC z score between baseline and 24 months | 24 months | 1. Number of gadolinium‐enhancing lesions 2. Proportion of participants free from gadolinium‐enhancing lesions 3. Number of new or enlarged lesions on T2‐weighted MRI scans 4. Proportion of participants free from new or enlarged lesions on T2‐weighted scan 5. Volumes of hyperintense lesions on T2‐weighted scan 6. Volumes of hypointense lesions on T1‐weighted scans 7. Change in brain volume between baseline and 24 months 8. Safety and tolerability measures | 24 months | |
| Percentage of participants free from relapse | 6 months | Participants free from gadolinium‐enhancing lesions | 6 months |
EDSS: Expanded Disability Status Scale; MSFC: Multiple Sclerosis Functional Composite
The primary outcome of each study is underlined
Confirmed relapse was defined as the occurrence of new symptoms, or worsening of previously stable or improving symptoms, and signs not associated with fever, lasting more than 24 hours. Symptoms had to appear at least 30 days after the onset of a preceding relapse (Cohen 2010; Saida 2012), and had to be accompanied by an increase of at least half a point in the EDSS score (Calabresi 2014; Cohen 2010; Kappos 2006; Kappos 2010) or one point in at least one of the functions in the Kurtzke Functional System score (excluding bowel‐bladder and mental systems) (Kappos 2006) or one point in each of two functions in the Kurtzke Functional Systems score, or two points in one of the functions in the Kurtzke Functional System score (excluding bowel–bladder or cerebral systems) (Calabresi 2014; Cohen 2010; Kappos 2010; Saida 2012).
Confirmed disability progression was defined as an increase of one point in the EDSS score (or 0.50 points if the baseline EDSS score was > 5·0), that was
confirmed three months later in the absence of relapse (Calabresi 2014; Cohen 2010; Kappos 2010). Disability progression confirmed at six months was available in two studies at 24 months (Calabresi 2014; Kappos 2010). Assessment of disability was performed using the Multiple Sclerosis Functional Composite (MSFC) score change in one study (Kappos 2006). Disability progression was not considered by Fox 2014 and Saida 2012.
The treatment duration was six months in three trials (Fox 2014; Kappos 2006; Saida 2012), 12 months in one trial (Cohen 2010), and 24 months in two trials (Calabresi 2014; Kappos 2010).
The Characteristics of included studies tables provide further details.
All studies were sponsored by Novartis Pharma.
Description of participants
The overall population included in the six trials was 5152 participants with 3531 treated with fingolimod; 2061 with 0.5 mg daily, 1376 with 1.25 mg daily, and 94 with 5.0 mg daily. The comparison population included 1621 participants; 923 treated with placebo and 698 with intramuscular interferon beta‐1a or other DMDs. Enrolled participants were Caucasian, except in Saida 2012, which included Japanese participants. Participants were affected by relapsing‐remitting multiple sclerosis (RRMS) in all studies, and secondary progressive multiple sclerosis (SPMS) in a small percentage in two studies; 11% in Kappos 2006 and 2.3% in Saida 2012 (Table 2).
| Study name | Drugs | No. participants | Female (%) | Course of disease of RR‐SP (%) | Age, years, mean (SD) | Mean EDSS score (SD) | Disease duration, mean (SD) | Pre‐1 year number of relapses, mean (SD) | Percentage of pre‐study treatment‐naive participants | Percentage of participants with MRI enhancing lesions | Mean lesion volume on T2‐weighted images (mm3 ) (SD) |
| Placebo | 355 | 81 | 100 ‐ 0 | 40·1 (8·4) | 2·2 (1·5) | 10·6 (7·9) | 1·5 (0·9) | 27 | 36 | 5553 (7841) | |
| Fingolimod 0.5 mg | 358 | 77 | 100 ‐ 0 | 40·6 (8·4) | 2·2 (1·4) | 10·4 (8·0) | 1·4 (0·9) | 26 | 39 | 5484 (8000) | |
| Fingolimod 1.25 mg | 370 | 76 | 100 ‐ 0 | 40·9 (8·9) | 2·3 (2·0) | 10·8 (8·2) | 1·5 (1·0) | 22 | 31 | 4936 (7286) | |
| Interferon beta‐1a (Avonex) | 435 | 67.8 | 100 ‐ 0 | 36.0 (8.3) | 2.19 (1.26) | 7.4 (6.3) | 1.5 (0.8) | 43.7 | 36.9 | 4924 (5711) | |
| Fingolimod 0.5 mg | 431 | 65.4 | 100 ‐ 0 | 36.7 (8.8) | 2.24 (1.33) | 7.5 (6.2) | 1.5 (1.2) | 44.8 | 32.6 | 5170 (6642) | |
| Fingolimod 1.25 mg | 426 | 68.8 | 100 ‐ 0 | 35.8 (8.4) | 2.21 (1.31) | 7.3 (6.0) | 1.5 (0.9) | 41.5 | 34.5 | 5085 (5962) | |
| DMD§ | 263 | 79.1 | 100 ‐ 0 | 45.1 (9.82) | 2.4 (1.32) | 11.7 (8.44) | 0.8 (1.32) | 0 | NR | NR | |
| Fingolimod 0.5 mg | 790 | 76.1 | 100 ‐ 0 | 46.0 (9.82) | 2.4 (1.32) | 12.1 (8.38) | 0.8 (1.20) | 0 | NR | NR | |
| Placebo | 93 | 66 | 90 ‐ 10 | 37.1 (19‐56)* | 2.6 (0.0‐6.5)* | 8.4 (0.2‐28.2)* | 1.2 (0‐5)* | NR | 51 | 8805 (123‐62,218)* | |
| Fingolimod 1.25 mg | 94 | 75 | 89 ‐ 11 | 38.0 (19‐60)* | 2.7 (0.0‐6.0)* | 8.6 (0.3‐50.2)* | 1.3 (0‐5)* | NR | 47 | 10,219 (293‐104,504)* | |
| Fingolimod 5.0 mg | 94 | 71 | 87 ‐ 13 | 38.3 (18‐59)* | 2.5 (0.0‐6.0)* | 9.5 (0.5‐42.2)* | 1.3 (0‐4)* | NR | 57 | 8722 (349‐70,218)* | |
| Placebo | 418 | 71.3 | 100 ‐ 0 | 37.2 (8.6) | 2.5 (1.3) | 8.1 (6.4) | 1.4 (0.7) | 59.6 | 37 | 6162 (7085) | |
| Fingolimod 0.5 mg | 425 | 69.6 | 100 ‐ 0 | 36.6 (8.8) | 2.3 (1.3) | 8.0 (6.6) | 1.5 (0.8) | 57.4 | 38 | 6128 (7623) | |
| Fingolimod 1.25 mg | 429 | 68.8 | 100 ‐ 0 | 37.4 (8.9) | 2.4 (1.4) | 8.4 (6.9) | 1.5 (0.8) | 60.4 | 39.4 | 6829 (8491) | |
| Placebo | 57 | 68.4 | 100 ‐ 0 | 35.0 (8.9) | 2.1 (1.7) | 8.2 (7.3) | 1.7 (1.6) | NR | 42.1 | 31.6 (22.6)** | |
| Fingolimod 0.5 mg | 57 | 70.2 | 94.7 ‐ 5.3 | 35.0 (9.0) | 2.3 (1.9) | 8.2 (6.8) | 1.4 (1.0) | NR | 42.1 | 30.4 (22.7)** | |
| Fingolimod 1.25 mg | 57 | 68.4 | 98.2 ‐ 1.8 | 36.0 (9.3) | 1.8 (1.7) | 7.1 (5.3) | 1.5 (0.9) | NR | 49.1 | 31.7 (23.3)** |
DMD: disease‐modifying drug;EDSS: Expanded Disability Status Scale; MRI: magnetic resonance imaging; NR: not reported; RR: relapsing‐remitting; SD: standard deviation; SP: secondary progressive
* Range (SD was not provided)
** Number of T2 lesions (volume was not provided)
§ interferon beta‐1b (Extavia® or Betaseron®) 0.25 mg injected subcutaneously every other day (46 participants); interferon beta‐1a (Avonex®) 30 μg intramuscular injected once a week (60 participants); interferon beta‐1a (Rebif®) 22 μg or 44 μg injected subcutaneously three times a week (65 participants); or glatiramer acetate (Copaxone®) 20 mg injected subcutaneously once‐daily (92 participants)
The inclusion criteria were similar among studies. Previous treatment with immunomodulating agents for at least six months were required in Fox 2014, and accepted in all other studies if the suspension occurred more than three months before trial onset (Calabresi 2014; Kappos 2006; Kappos 2010; Saida 2012), not specified in Cohen 2010.
Exclusion criteria were similar and included clinically significant systemic diseases, macular oedema (not specified for Kappos 2006), and diabetes (not specified for Kappos 2006 and Cohen 2010). Participants treated with immunosuppressants were excluded (Kappos 2010; Fox 2014), they had to interrupt treatment in the six months prior to randomisation (Saida 2012), interrupt azathioprine or methotrexate within six months, cyclophosphamide within 12 months, mitoxantrone or cladribine within 24 months (Kappos 2006), and natalizumab at least six months before randomisation (Calabresi 2014). Two studies specified as exclusion criteria the presence of cardiac abnormalities or leukopenia or lymphopenia (Kappos 2006; Saida 2012). Participants with varicella zoster immunoglobulin G (IgG) antibody negative at screening were excluded in three studies (Calabresi 2014; Fox 2014; Saida 2012).
The baseline clinical characteristics were homogeneous in term of age (ranging from 35.0 to 38.3 years), disability score (EDSS 1.8 to 2.7), disease duration (7.1 to 9.5 years), and mean relapse number in the year before randomisation (1.2 to 1.7). Percentage of prestudy treatment‐naive participants were different among studies, ranging from 0% to 60.4%. MRI enhancing lesions were detected in 31% to 49% of the participants, while the volume of MRI T2‐weighted lesions at baseline ranged from 4924 mm3 to 10,219 mm3 (Table 2).
Excluded studies
We excluded 18 studies because type of participants (three studies), design (seven studies) or intervention (one study) did not meet our inclusion criteria, five studies were not original articles (reporting pooled data of trials), and two studies were overviews (Characteristics of excluded studies).
Risk of bias in included studies
We evaluated risk of bias separately for benefit estimate (Characteristics of included studies), and adverse events monitoring (Table 3).
| Study name | Risk of bias | Did the researchers actively monitor for adverse events (AEs) (low risk of bias) or did they simply provide spontaneous reporting of AEs that arose (high risk of bias)? | Risk of bias | Did the authors define serious AEs (SAEs) according to an accepted international classification and report the number of SAEs? |
| Low | "We did extensive safety and tolerability assessments, in part as a response to preclinical safety concerns raised by the FDA and additional safety areas of interest identified in previous phase 2 and earlier clinical studies. We also recorded adverse events, serious adverse events, serious adverse events of special interest, 24 h Holter electrocardiography (ECG) post first‐dose and at 3 months, first‐dose bradycardia events, infections, laboratory tests, vital signs, ECG, echocardiography, pulmonary function. tests, chest high‐resolution CT,chest radiographs, ophthalmic examinations, including serial optical coherence tomography, and dermatological assessments." Clinical assessments were performed at screening and at randomisation (baseline), and study visits, including safety assessments, were scheduled at 2 weeks and 1, 2, 3, 6, 9, 12, 15, 18, 21, and 24 months after randomisation" | Unclear | "We also recorded adverse events, serious adverse events, serious adverse events of special interest, 24 h Holter electrocardiography (ECG) post fist‐dose and at 3 months, first‐dose bradycardia events, infections, laboratory tests, vital signs, ECG, echocardiography, pulmonary function tests, chest high‐resolution CT,chest radiographs, ophthalmic examinations, including serial optical coherence tomography, and dermatological assessments" | |
| Low | "An independent data and safety monitoring board evaluated overall safety in the fingolimod phase 3 program" and "Safety assessments were conducted during screening, at baseline, and at months 1, 2, 3, 6, 9, and 12" (pg 404) | Low | SAEs were predefined per standard criteria (death, life‐threatening event, persistent disability, congenital defect, unplanned hospitalisation, or otherwise medically significant) (FDA 2010 Clinical review of safety pg 151) | |
| Low | "Safety and tolerability (secondary study objectives) were assessed via reporting of | Unclear | Not specified | |
| Low | "An independent external data and safety monitoring board evaluated adverse events and other safety data" and "Adverse events were assessed and reported at each visit (scheduled and unscheduled) by the treating physicians. Laboratory evaluations were undertaken at a central laboratory". "Vital signs were obtained at each visit, and laboratory and hematologic measures were obtained at baseline, day 1, and months 1,3,6,9, and 12. Electrocardiograms were obtained at baseline, on days 1 and 7, and at months 1,3,6,12, and 24 hour Holter electrocardiographic monitoring was performed at selected sites at baseline, day 1, and month 3. Pulmonary function tests... were performed at screening and months 6 and 12" (pg 1126) | Low | Categorisation of SAEs conformed to ICH guidelines (International Conference on Harmonisation of Technical Requirements for Registration of Pharmaceuticals for Human Use) | |
| Low | "An independent data and safety monitoring board evaluated the safety" and "Study visits, including safety assessments, were scheduled at 2 weeks and 1, 2, 3, 6, 9, 12, 15, 18, 21, and 24 months after randomization" (pg 389) | Low | SAEs were predefined per standard criteria (death, life‐threatening event, persistent disability, congenital defect, unplanned hospitalisation, or otherwise medically significant) (FDA 2010 Clinical review of safety pg 151) | |
| Low | "Adverse events, serious adverse events assessments were conducted at screening, baseline, days 1 and 15, and months 1,2,3,4,5 and 6" (pg 2) and "Safety assessment included recording of AEs, SAEs, hematology values, vital signs, results of dermatological and ophthalmological examinations and results of pulmonary and liver function tests" (Supplementary data online appendix) | Low | Categorisation of SAEs conformed to ICH guidelines (International Conference on Harmonisation of Technical Requirements for Registration of Pharmaceuticals for Human Use) |
AE: adverse event; CT: chest tomography; ECG: electrocardiography; FDA: Food and Drug Administration; SAE: serious adverse event
Allocation
We considered the method used to generate a random sequence and conceal allocation to be at low risk of bias in all trials except one; we judged Calabresi 2014 to be at unclear risk of bias.
Blinding
All included trials, except one open‐label trial were described as double‐blinded (Fox 2014). The drug in the treatment group was reported as identical in appearance to the drug in the control group. Assessors of clinical and radiological outcomes were reported as unaware of participants' assignment. We judged Fox 2014 to be at high risk of bias and the other trials to be at low risk of bias for blinding.
Incomplete outcome data
All trials provided a sufficient description of follow‐up and withdrawals. We judged three trials to be at high risk of attrition bias because significant differences in reasons of dropouts between treated and control groups were found ( Calabresi 2014 ; Fox 2014 ; Kappos 2010).
Selective reporting
We judged all trials to be at low risk of bias apart from Calabresi 2014, which we judged to be at unclear risk of bias as it did not report on clinically relevant results.
Other potential sources of bias
All trials were sponsored by Novartis Pharma. We judged four trials to be at high risk of bias because the study sponsor participated in conducting the study, or data analysis and some study co‐authors were affiliated to the pharmaceutical company (Calabresi 2014; Cohen 2010; Fox 2014; Kappos 2010) .
Further details are provided in relevant sections of the Characteristics of included studies tables and are presented as the 'Risk of bias' summary and 'Risk of bias' graph (Figure 2; Figure 3).

Risk of bias summary: review authors' judgements about each risk of bias item for each included study.

Risk of bias graph: review authors' judgements about each risk of bias item presented as percentages across all included studies.
Methods of adverse events monitoring
We judged the risk of bias regarding methods of adverse events monitoring to be low for all studies. We judged the risk of bias regarding methods of serious adverse events monitoring to be unclear for the Calabresi 2014 and for the Fox 2014 studies and low for four others (Table 3).
Effects of interventions
See: Summary of findings for the main comparison Fingolimod 0.5 mg versus placebo for relapsing‐remitting multiple sclerosis; Summary of findings 2 Fingolimod 0.5 mg versus interferon beta‐1a for relapsing‐remitting multiple sclerosis
We defined two main comparisons, one evaluating the effect of fingolimod versus placebo and one evaluating the effect of fingolimod versus intramuscular IFN‐beta 1a or other DMDs. For each comparison, we considered the effect of fingolimod separately for the approved dose (0.5 mg) and the other treatment schedules (1.25 mg and 5.0 mg).
We reported the main results concerning benefit and withdrawals due to adverse events of fingolimod at the approved dose of 0.5 mg compared to placebo at 24 months in summary of findings Table for the main comparison and compared to intramuscular interferon beta‐1a at 12 months in summary of findings Table 2.
Fingolimod compared to placebo
Primary Outcomes
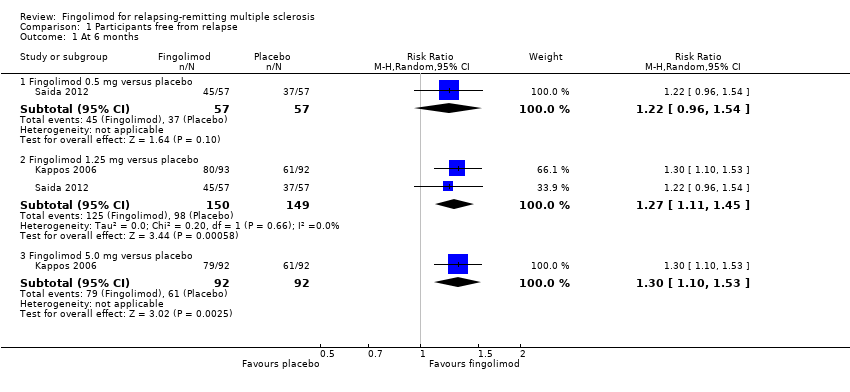
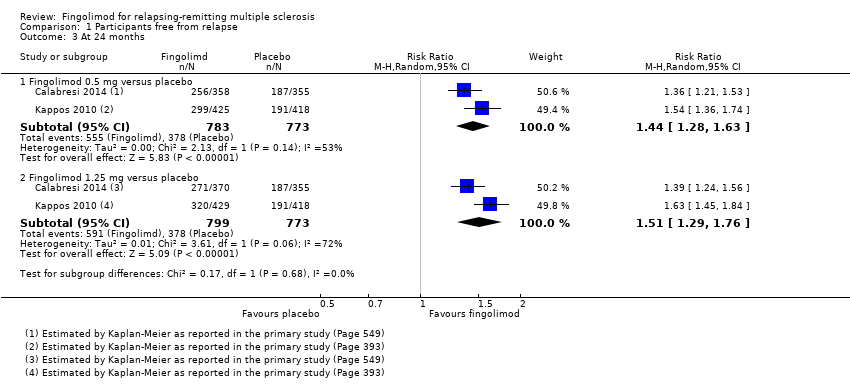
The number of participants who were free from relapses during treatment with fingolimod 0.5 mg compared to placebo were retrieved from one trial (114 participants = 2.2%) at six months (Saida 2012), and two trials (1556 participants =30%) at 24 months (Calabresi 2014; Kappos 2010). At six months, there was a slight non‐significant benefit (risk ratio (RR) 1.22, 95% confidence interval (CI) 0.96 to 1.54) (Analysis 1.1). At 24 months the overall results indicated a benefit of fingolimod (RR 1.44, 95% CI 1.28 to 1.63; moderate quality evidence) (summary of findings Table for the main comparison; Analysis 1.3). The higher doses were effective at six months at 1.25 mg (RR 1.27, 95% CI 1.11 to 1.45) and 5 mg (RR 1.30, 95% CI 1.10 to 1.53) (Analysis 1.1), and at 24 months at 1.25 mg (RR 1.51, 95% CI 1.29 to 1.76) (Analysis 1.3).
Data from two trials were available to calculate the number of participants without disability worsening during the first 24 months of treatment with fingolimod compared to placebo (Calabresi 2014; Kappos 2010). The results indicated little or no difference of fingolimod at 0.5 mg (RR 1.07, 95% CI 1.02 to 1.11; low quality evidence) (summary of findings Table for the main comparison). Similar results were found when fingolimod was used at 1.25 mg (RR 1.08, 95% CI 1.03 to 1.12) (Analysis 2.2).
The number of participants who withdrew from the study because of adverse events with 0.5 mg of fingolimod compared to placebo was retrieved from two trials during the first six months (RR 2.00, 95% CI 0.53 to 7.61) (Kappos 2006; Saida 2012: Analysis 3.1); and two trials during the first 24 months of treatment (RR 1.42, 95% CI 0.89 to 2.25; very low quality evidence) (Calabresi 2014; Kappos 2010; summary of findings Table for the main comparison; Analysis 3.3). The risk of discontinuing 1.25 mg of fingolimod due to adverse events compared to placebo significantly increased at 24 months (RR 1.93, 95% CI 1.48 to 2,52) (Analysis 3.3).
Detailed descriptive data on the type of adverse events, as reported in the primary studies, are provided in Figure 4. It should be noted that infections, hypertension, and abnormal liver tests were more frequent in the fingolimod group than in the placebo group.
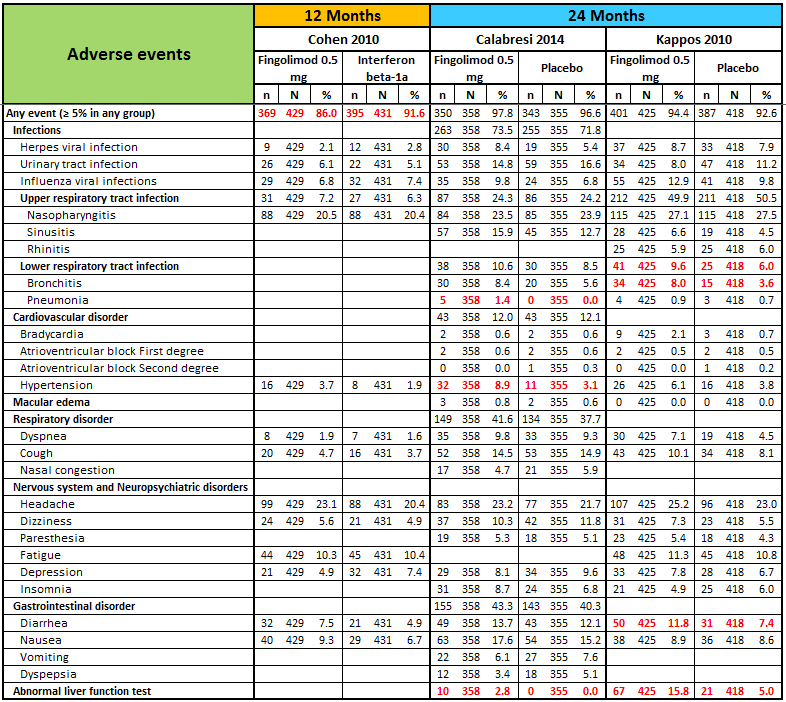
N, number of patients; n, number of events.
Significant differences (based on Fisher exact test) are reported in red.
The number of participants who withdrew because of serious adverse events were available from two trials at six months (Kappos 2006; Saida 2012), and two trials at 24 months (Calabresi 2014; Kappos 2010). No difference was found between placebo and fingolimod administered at 0.5 mg and 1.25 mg (Analysis 3.4; Analysis 3.6). A significant increased risk of discontinuation was found for fingolimod 5.0 mg versus placebo at six months (RR 2.77, 95% CI 1.04 to 7.38) (Analysis 3.4).
Detailed descriptive data on the type of serious adverse events, as reported in the primary studies, are provided in Figure 5. It should be noted that infections, basal‐cell carcinoma, and atrioventricular blocks were more frequent in the fingolimod group than in the placebo group.
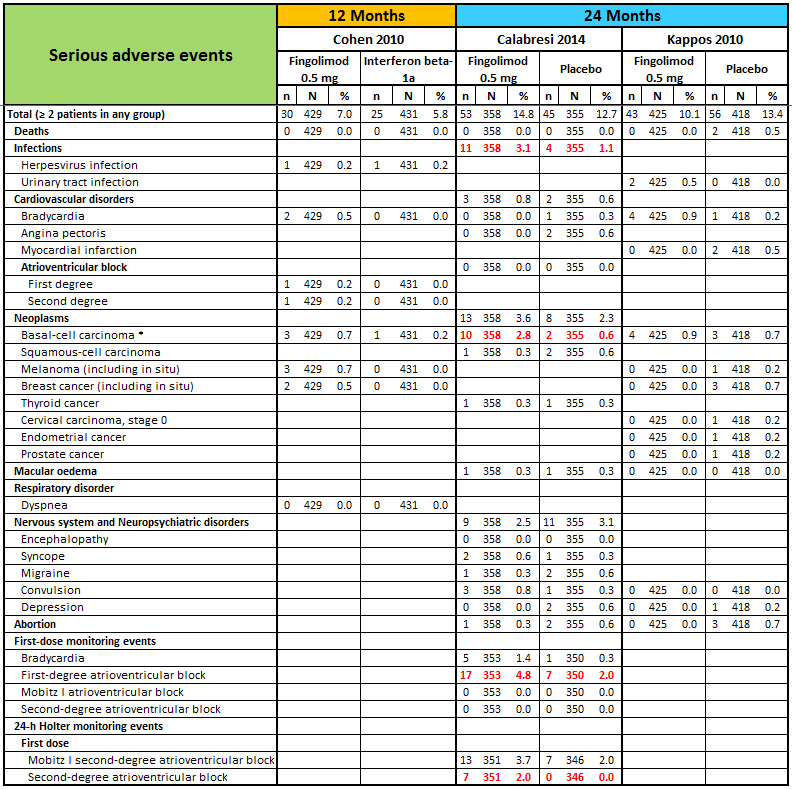
N, number of patients; n, number of events.
* One case of basal‐cell carcinoma was not reported as a serious adverse event by the site investigator (Calabresi 2014).
Significant differences (based on Fisher exact test) are reported in red.
The results regarding data analysed according to a likely scenario did not add any additional information (data not reported).
Secondary outcomes
The annualised relapse rate was evaluated by two trials at six months (Kappos 2006; Saida 2012), and two trials at 24 months (Calabresi 2014; Kappos 2010): at these time points the results favoured fingolimod 0.5 mg compared to placebo at six months (rate ratio 0.51, 95% CI 0.26 to 0.99; Analysis 4.1) and 24 months (rate ratio 0.50, 95% CI 0.40 to 0.62; moderate quality evidence) (summary of findings Table for the main comparison; Analysis 4.3). Similar data were found for higher doses (Analysis 4.1, Analysis 4.3).
The number of participants free from MRI gadolinium‐enhancing lesions was evaluated by four trials at six months (Calabresi 2014; Kappos 2006; Kappos 2010; Saida 2012; Analysis 5.1), two trials at 12 months (Calabresi 2014; Kappos 2010; Analysis 5.2), and two trials at 24 months (Calabresi 2014; Kappos 2010; Analysis 5.3). We found better results for fingolimod doses compared to placebo at each time point: fingolimod 0.5 mg at six months (RR 1.42, 95% CI 1.33 to 1.51); 0.5 mg at 12 months (RR 1.39, 95% CI 1.30 to 1.48); and 0.5 mg at 24 months (RR 1.36, 95% CI 1.27 to 1.45; low quality evidence) (summary of findings Table for the main comparison).
The mean change of MRI T2‐weighted lesion load was evaluated by one trial at 12 months (Kappos 2010): the results favoured fingolimod 0.5 mg compared to placebo (mean difference (MD) ‐15.30, 95% CI ‐24.34 to ‐6.26); similar data were found when fingolimod was used at 1.25 mg for 12 months (Analysis 6.1). At 24 months the results also favoured fingolimod 0.5 mg compared to placebo (MD ‐20.43, 95% CI ‐34.03 to ‐6.83); similar data were found for fingolimod 1.25 mg (Analysis 6.2).
Quality of life was measured by the Hamburg Quality of Life Questionnarie in one trial at six months (Kappos 2006), and by the Euro quality of life scale (EQ‐5D) in one trial at 24 months (Calabresi 2014). No differences were found between fingolimod and placebo in either study (Analysis 7.1; Analysis 7.2).
Fingolimod compared to intramuscular interferon beta‐1a or other DMDs
Primary Outcomes
Data from one trial were available to evaluate the primary outcomes during the first 12 months of treatment with fingolimod 0.5 mg compared to intramuscular interferon beta‐1a (Cohen 2010).
The overall results (RR 1.18, 95% CI 1.09 to 1.27; moderate quality evidence) indicated a slight advantage for fingolimod 0.5 mg in favouring freedom from relapse (summary of findings Table 2). Similar results were found when fingolimod was used at 1.25 mg (RR 1.15, 95% CI 1.06 to 1.24) (Analysis 1.2).
The results indicated no difference in favouring freedom from disability worsening at 12 months between fingolimod 0.5 mg and intramuscular interferon beta‐1a (RR 1.02, 95% CI 0.99 to 1.06; low quality evidence) (summary of findings Table 2). Similar results were found when fingolimod was used at 1.25 mg (RR 1.01, 95% CI 0.98 to 1.05) (Analysis 2.1).
Compared to intramuscular interferon beta‐1a, the number of participants who withdrew due to adverse events was higher, but not significant for fingolimod 0.5 mg (RR 1.51, 95% CI 0.81 to 2.80; moderate quality evidence) (summary of findings Table 2). Significant risk was found when used at 1.25 mg (RR 2.69, 95% CI 1.54 to 4.72) (Analysis 3.2).
Compared to intramuscular interferon beta‐1a, the number of participants who withdrew due to serious adverse events was higher, but not significant for fingolimod 0.5 mg (RR 1.21, 95% CI 0.72 to 2.02), and significantly higher for fingolimod 1.25 mg (RR 1.85, 95% CI 1.15 to 2.96) (Analysis 3.5).
Data from one trial were available to calculate the number of participants who withdrew due to adverse events during the first six months (Fox 2014): the RR was significantly higher for fingolimod 0.5 mg compared to other DMDs (RR 3.21, 95% CI 1.16 to 8.86) (Analysis 3.1).
Data from the same trial showed that the number of participants who withdrew due to serious adverse events were higher with fingolimod 0.5 mg compared to other DMDs (Fox 2014), but the result was not significant (RR 2.71, 95% CI 0.83 to 8.88) (Analysis 3.4).
Detailed descriptive data on the type of adverse and serious adverse events are provided in Figure 4 and Figure 5, respectively. The higher incidence of adverse events in fingolimod versus interferon beta‐1a, suggests lower tolerability for fingolimod. It should be noted that hypertension was more frequent in participants taking fingolimod, and depression was more frequent in the interferon beta‐1a group.
Secondary outcomes
The annualised relapse rate was evaluated by one trial at 12 months (Cohen 2010). A significant benefit for fingolimod 0.5 mg (RR 0.48, 95% CI 0.34 to 0.70) and fingolimod 1.25 mg (RR 0.61, 95% CI 0.47 to 0.78) doses compared to intramuscular interferon beta‐1a was observed (Analysis 4.2).
The number of participants free from MRI gadolinium‐enhancing lesions at 12 months was evaluated by the same trial (Cohen 2010); a slight advantage for fingolimod 0.5 mg (RR 1.12, 95% CI 1.05 to 1.19) and fingolimod 1.25 mg (RR 1.13, 95% CI 1.06 to 1.20) compared to intramuscular interferon beta‐1a was observed (Analysis 5.2).
The mean change of MRI T2‐weighted lesion load at 12 months was evaluated by the same trial (Cohen 2010); we found no significant reduction for fingolimod 0.5 mg (MD ‐0.50, 95% CI ‐6.32 to 5.32) and fingolimod 1.25 mg (MD ‐3.70, 95% CI ‐9.18 to 1.78) doses compared to intramuscular interferon beta‐1a (Analysis 6.1).
Quality of life was measured at six months by the FS36 questionnaire in participants treated with fingolimod 0.5 mg compared to DMDs (Fox 2014). The results favoured fingolimod (Analysis 7.1).
Discusión
Resumen de los resultados principales
Seis ECA contribuyeron a esta revisión. La población general incluyó 5152 participantes; 3531 se asignaron al azar a fingolimod (2061 fueron tratados con la dosis autorizada de 0,5 mg diarios) y 1621 fueron controles, 923 fueron tratados con placebo y 698 con interferón beta‐1a intramuscular u otros FME. La duración del tratamiento fue de seis meses en tres ensayos (Fox 2014; Kappos 2006; Saida 2012),12 meses en un ensayo (Cohen 2010a), y 24 meses en dos ensayos (Calabresi 2014; Kappos 2010). Todos los estudios fueron patrocinados por Novartis Pharma.
El fingolimod administrado a la dosis autorizada de 0,5 mg por vía oral una vez al día es eficaz para aumentar el número de pacientes sin recurrencia (pruebas de calidad moderada) y de lesiones realzadas con gadolinio en la IRM (pruebas de baja calidad) y para reducir la tasa anual de recurrencia (pruebas de calidad moderada) a los 24 meses en comparación con placebo. No se observó un efecto beneficioso sobre la prevención del empeoramiento de la discapacidad (pruebas de baja calidad). El riesgo de retiro debido a eventos adversos no fue significativo (pruebas de muy baja calidad) (Resumen de los hallazgos para la comparación principal). Además, los cambios en la carga de lesiones potenciadas en T2 en la IRM a los 12 y los 24 meses favorecieron al fingolimod versus placebo.
Se observó una ventaja leve del fingolimod a una dosis de 0,5 mg en comparación con el interferón beta‐1a intramuscular con respecto al aumento de la ausencia de recurrencias y de las lesiones realzadas con gadolinio a los 12 meses (pruebas de calidad moderada). Se encontró un efecto beneficioso en otras medidas de actividad clínica (tasa de recurrencia: pruebas de calidad moderada). No se encontraron diferencias entre los dos tratamientos activos con respecto a la prevención del empeoramiento de la discapacidad a los 12 meses (pruebas de baja calidad). El riesgo de retiro debido a eventos adversos no fue significativo (pruebas de calidad moderada) (Resumen de los hallazgos 2), a pesar de una peor tolerabilidad debido al aumento de la incidencia de eventos adversos. Además, no se observaron diferencias con respecto al cambio medio de la carga de lesiones potenciadas en T2 en la IRM a los 12 meses.
Compleción y aplicabilidad general de las pruebas
Todos los estudios evaluaron los resultados clínicos y de la IRM seleccionados para esta revisión, excepto Fox 2014, que solamente incluyó resultados orientados al paciente. Los participantes fueron adultos con esclerosis múltiple recurrente‐remitente (EMRR), con una alta frecuencia de recurrencias previas al estudio, escasa discapacidad y una duración de la enfermedad de más de cinco años (Tabla 2).
Se deben destacar los siguientes cuatro puntos relevantes para la práctica clínica:
-
Medidas de respuesta al tratamiento.
-
Empeoramiento de la discapacidad.
-
Comparación con otros tratamientos activos.
-
Impacto sobre la calidad de vida.
-
La evaluación de la actividad de la enfermedad se ha incorporado recientemente para redefinir los fenotipos de la enfermedad EM (Lublin 2014). Por otro lado, las expectativas con el tratamiento han evolucionado para incluir la posible remisión de los síntomas de la EM hasta la ausencia de actividad de la enfermedad. El número de participantes sin eventos clínicos (recurrencia y empeoramiento de la discapacidad) y en la IRM (lesiones realzadas con gadolinio) se eligieron como medidas de resultado separadas. Lo anterior se hizo para destacar el posible efecto beneficioso del tratamiento. Se ha incluido una variable principal de resultado adicional de la IRM (volumen total de hiperintensidad anormal en T2) como un marcador de la gravedad de la enfermedad (Lavery 2014). No se incluyeron medidas compuestas como "ninguna prueba de actividad de la enfermedad" (NPAE) porque todavía no se aceptan como un resultado primario y son de valor pronóstico incierto(Giovannoni 2015; Rotstein 2015). Solamente se ha publicado el análisis post hoc con respecto a NPAE en las poblaciones agrupadas de los ensayos de fingolimod (Kappos 2015b; Nixon 2014), y faltaron datos útiles en los estudios primarios.
-
No se encontraron pruebas significativas de que el fingolimod modificó el riesgo de empeoramiento de la discapacidad, a pesar de su eficacia sobre la actividad inflamatoria de la enfermedad. Se consideró el empeoramiento de la discapacidad cuando se confirmó a los seis meses de seguimiento. Con el uso de criterios menos estrictos (tres meses), Calabresi 2014 yKappos 2010 encontraron que el fingolimod fue eficaz durante el período de 24 meses; sin embargo, este resultado puede estar relacionado con la aparición de discapacidades reversibles relacionadas con la recurrencia. La disociación entre la recurrencia y el empeoramiento de la discapacidad está bien documentada durante el curso natural de la enfermedad (Scalfari 2010; Scalfari 2013). Por otro lado, podrían ser difícil detectar cambios significativos mediante los resultados actualmente aprobados para medir la discapacidad clínica, principalmente en las primeras etapas de la enfermedad y después de un período corto de tratamiento Scalfari 2013). Lavery 2014). También podría haber un efecto divergente cuando ocurren diferentes mecanismos patógenos (degenerativo e inflamatorio). En realidad, no se han informado efectos sobre la EM progresiva(Lublin 2016; Novartis 2016).
-
En esta revisión solamente se incluyó una comparación relacionada con los resultados clínicos y de la IRM, es decir, fingolimod versus interferón beta‐1a intramuscular. En las actualizaciones futuras de la revisión se evaluarán los ensayos en curso de fingolimod en comparación con otros FME autorizados.
-
No se encontraron efectos beneficiosos del fingolimod sobre la calidad de vida en los pacientes con EMRR a los dos años de tratamiento en comparación con placebo (Análisis 7.2). Este resultado es relevante si se consideran las expectativas con el tratamiento oral después de la era de los fármacos inyectables; después de la introducción del fingolimod, los pacientes con EMRR han cambiado a este fármaco en lugar de a otros tratamientos y lo hicieron debido a la comodidad (Warrender‐Sparkes 2015). Los tipos de escalas y métodos de evaluación utilizados para medir la calidad de vida en los estudios incluidos podría haber influido en el efecto calculado del fingolimod para este resultado (Tabla 1).
Se deben destacar las siguientes limitaciones de la revisión: .
-
La duración de los ensayos incluidos fue igual o menor de 24 meses. Se informaron estudios de extensión, pero en su mayoría los participantes tratados con placebo cambiaron al grupo fingolimod. En esta revisión se excluyeron los estudios de extensión abiertos.
-
No se exploró la influencia de las características iniciales de los pacientes sobre el efecto del fingolimod debido a la falta de datos útiles en los ensayos incluidos. Están disponibles datos contradictorios en la literatura. Por ejemplo, un artículo informó que la respuesta al fingolimod se asoció con la alta frecuencia inicial de recurrencia de los pacientes (Oh J 2013). Un análisis de subgrupos post hoc del estudio FREEDOM (Kappos 2010), informó una falta de efectos beneficiosos del fingolimod sobre la tasa de recurrencia en los pacientes con EM mayores de 40 años y sobre el empeoramiento de la discapacidad en los pacientes con una puntuación inicial en la Expanded Disability Status Scale (EDSS) menor de 3,5 (Devonshire 2012). Se encontró que fingolimod fue superior a interferón beta‐1a intramuscular en todos los subgrupos definidos por los factores demográficos o las características iniciales de la enfermedad (Cohen 2013). Otro estudio informó que fingolimod demostró una eficacia similar en los pacientes con EMRR, independientemente de los antecedentes de tratamiento previo(Kremenchutzky 2014).
-
Todos los ensayos incluidos excluyeron a los pacientes con trastornos sistémicos, mientras que en el mundo real la comorbilidad es frecuente. Es necesario tomar precauciones y hacer nuevas recomendaciones antes y después del comienzo del tratamiento, o al reiniciar el tratamiento con fingolimod(EMA 2011; EMA 2015).
-
No se planificó explorar los resultados de seguridad más allá de la duración de los ECA primarios. La Food and Drug Administration (FDA) requirió la planificación de dos estudios (FDA 2010):
-
Un estudio prospectivo observacional paralelo de cohortes posterior a la comercialización en los pacientes con esclerosis múltiple recurrente para evaluar el riesgo potencialmente grave de: toxicidad ocular, toxicidad cardíaca y vascular, toxicidad pulmonar, epilepsia, infecciones graves y oportunistas, neoplasias malignas, toxicidad hepática y recurrencia de esclerosis múltiple atípica. Los resultados específicos examinados deben incluir, pero no limitarse a, edema macular, bradicardia sintomática, bloqueo auriculoventricular de segundo y tercer grados y linfoma. Envío del Informe Final: 15 diciembre 2020.
-
Desarrollar y mantener un estudio prospectivo observacional del registro de exposición durante el embarazo, realizado en los Estados Unidos. Envío del Informe Final: 31 octubre 2017.
-
Hasta el 31 de octubre de 2011 se informaron 89 embarazos en los estudios clínicos finalizados o en curso, con 74 embarazos en los brazos de tratamiento con fingolimod. De 66 embarazos con exposición in utero al fingolimod hubo 28 nacidos vivos, nueve abortos espontáneos, 24 abortos electivos (un caso de tetralogía de Fallot, uno de muerte intrauterina espontánea y uno por problemas con el desarrollo fetal), dos neonatos nacieron con malformaciones (uno con encorvamiento congénito unilateral posteromedial de la tibia y uno acraneo). Hubo cinco casos (7,6%) de desarrollo fetal anormal en los 66 embarazos. Debido también al riesgo conocido de teratogenicidad en animales, las pacientes en edad fértil deben utilizar una anticoncepción eficaz durante el tratamiento con fingolimod y durante dos meses después de la interrupción del tratamiento (Karlsson 2014).
Calidad de la evidencia
La calidad de las pruebas de todos los resultados incluidos a los 24 meses se disminuyó debido a diferencias significativas en las razones para los datos incompletos de los resultados entre los grupos fingolimod 0,5 mg y placebo. Se disminuyó de manera adicional la calidad de las pruebas para el empeoramiento de la discapacidad, los retiros debido a eventos adversos y las lesiones realzadas con gadolinio en la IRM debido al tamaño de información insuficiente y a los amplios intervalos de confianza. La calidad de las pruebas para los retiros se disminuyó de manera adicional debido a la inconsistencia. En general se dio una calificación GRADE moderada para las recurrencias, baja para la progresión de la discapacidad, muy baja para los retiros debido a eventos adversos, y baja para las lesiones realzadas con gadolinio en la IRM.
La calidad de las pruebas de todos los resultados incluidos a los 12 meses se disminuyó debido al tamaño de información insuficiente entre los grupos de fingolimod 0,5 mg e interferón beta‐1a intramuscular en (Karlsson 2014).lo que dio lugar a pruebas de calidad moderada. La calidad de las pruebas para el empeoramiento de la discapacidad se disminuyó de manera adicional porque este estudio requirió de un seguimiento de solamente tres meses para confirmar el empeoramiento sostenido de la discapacidad. Aunque fue necesario aceptar la definición proporcionada en el artículo original, esta definición se evaluó como no fiable para detectar el empeoramiento sostenido de la discapacidad.
Sesgos potenciales en el proceso de revisión
La estrategia de búsqueda de los ensayos, así como los contactos iniciados con los investigadores principales, indican la probabilidad de que se identificaron todos los estudios relevantes y se obtuvieron todos los datos relevantes.
Acuerdos y desacuerdos con otros estudios o revisiones
Se han publicado revisiones anteriores sobre fingolimod en comparación con placebo u otros FME autorizados en la EMRR, pero solamente se han informado datos descriptivos (Ali 2013; Doggrell 2010; Fox 2012; Gajofatto 2015; Gold 2011; Oh J 2013).
Otras revisiones han utilizado una metodología estructurada que incluye el metanálisis de redes, pero han considerado a un número escaso de ECA, y las variables principales de resultado fueron diferentes y limitadas. Una revisión sistemática no Cochrane evaluó la eficacia y seguridad del fingolimod a diferentes dosis (Bao 2012); se basó en tres ECA publicados hasta 2010. Los resultados indicaron que fingolimod fue seguro y eficaz para tratar la EMRR al considerar variables principales de resultado clínicas y de la IRM (tasa de incidencia de la denominada "lesión intensa" potenciada en T2).
Una revisión evaluó los efectos comparativos del fingolimod versus otros FME mediante el metanálisis de redes. Incluyó diez estudios; dos evaluaron los efectos del fingolimod (Del Santo 2011). La variable principal de resultado se limitó a la tasa sin recurrencia a los 12 meses. Los resultados indicaron que fingolimod fue superior a interferón beta‐1a (comparación directa) y glatiramer (comparación indirecta) en cuanto a la prevención de la recurrencia a los 12 meses de seguimiento.
Los resultados de una revisión Cochrane que evaluó el efecto de los inmunomoduladores y los inmunodepresores en los pacientes con EMRR mediante el metanálisis de redes, demostró que alemtuzumab, natalizumab y fingolimod son las mejores elecciones contra las recurrencias, pero las pruebas se limitaron a los primeros 24 meses de seguimiento (Tramacere 2015).
Risk of bias summary: review authors' judgements about each risk of bias item for each included study.
Risk of bias graph: review authors' judgements about each risk of bias item presented as percentages across all included studies.
N, number of patients; n, number of events.
Significant differences (based on Fisher exact test) are reported in red.
N, number of patients; n, number of events.
* One case of basal‐cell carcinoma was not reported as a serious adverse event by the site investigator (Calabresi 2014).
Significant differences (based on Fisher exact test) are reported in red.
Comparison 1 Participants free from relapse, Outcome 1 At 6 months.

Comparison 1 Participants free from relapse, Outcome 2 At 12 months.
Comparison 1 Participants free from relapse, Outcome 3 At 24 months.
Comparison 2 Participants free from disability worsening, Outcome 1 At 12 months.

Comparison 2 Participants free from disability worsening, Outcome 2 At 24 months.

Comparison 3 Number of withdrawals due to adverse events, Outcome 1 Withdrawals due to adverse events over 6 months.
Comparison 3 Number of withdrawals due to adverse events, Outcome 2 Withdrawals due to adverse events over 12 months.
Comparison 3 Number of withdrawals due to adverse events, Outcome 3 Withdrawals due to adverse events over 24 months.

Comparison 3 Number of withdrawals due to adverse events, Outcome 4 Withdrawals due to serious adverse events over 6 months.
Comparison 3 Number of withdrawals due to adverse events, Outcome 5 Withdrawals due to serious adverse events over 12 months.

Comparison 3 Number of withdrawals due to adverse events, Outcome 6 Withdrawals due to serious adverse events over 24 months.
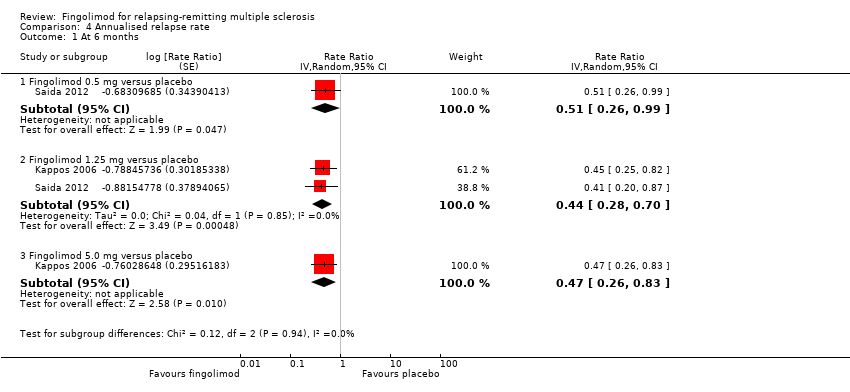
Comparison 4 Annualised relapse rate, Outcome 1 At 6 months.

Comparison 4 Annualised relapse rate, Outcome 2 At 12 months.

Comparison 4 Annualised relapse rate, Outcome 3 At 24 months.

Comparison 5 Participants free from gadolinium‐enhancing lesions, Outcome 1 At 6 months.
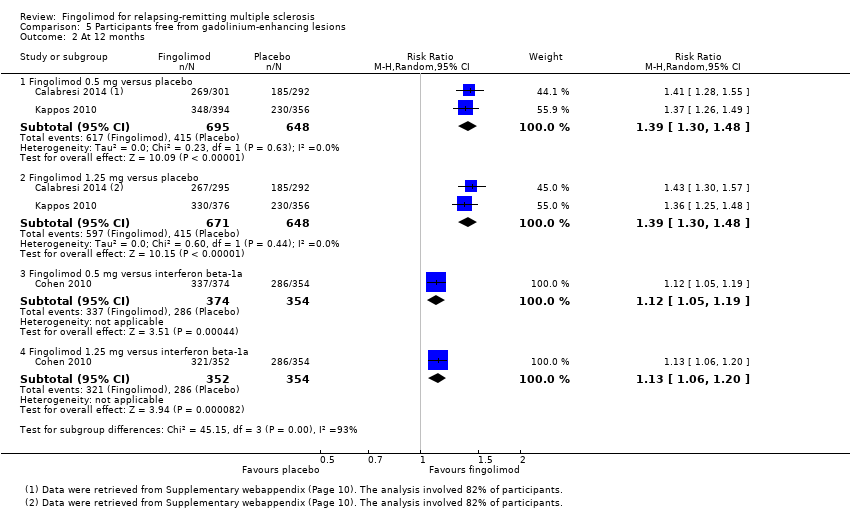
Comparison 5 Participants free from gadolinium‐enhancing lesions, Outcome 2 At 12 months.

Comparison 5 Participants free from gadolinium‐enhancing lesions, Outcome 3 At 24 months.
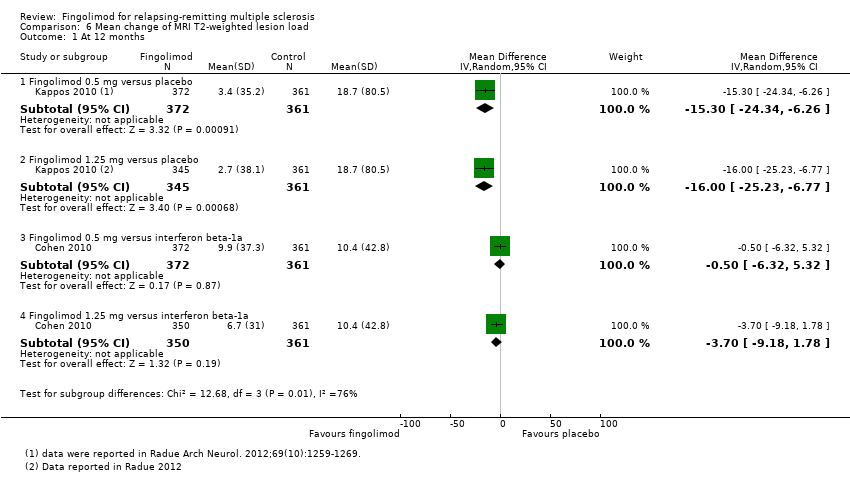
Comparison 6 Mean change of MRI T2‐weighted lesion load, Outcome 1 At 12 months.
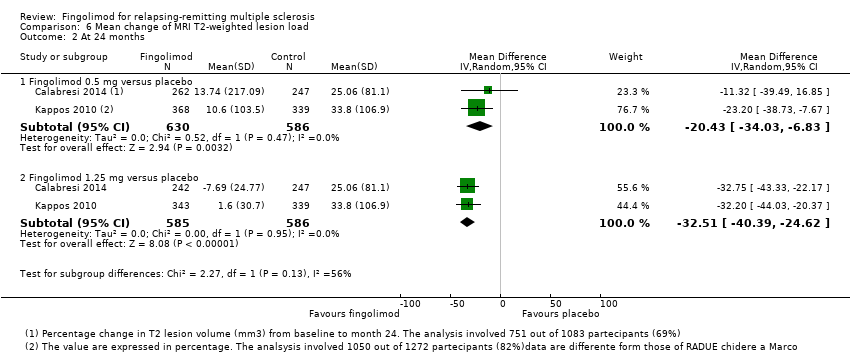
Comparison 6 Mean change of MRI T2‐weighted lesion load, Outcome 2 At 24 months.

Comparison 7 Quality of life, Outcome 1 At 6 months.
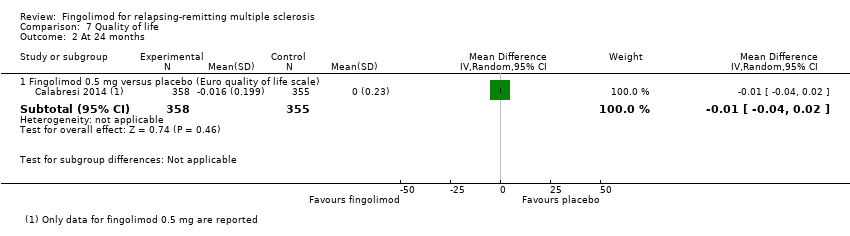
Comparison 7 Quality of life, Outcome 2 At 24 months.
| Fingolimod 0.5 mg versus placebo for relapsing‐remitting multiple sclerosis | |||||
| Participants or population: people with relapsing‐remitting multiple sclerosis | |||||
| Outcomes at 24 months | Illustrative comparative risks* (95% CI) | Relative effect | No. of Participants | Quality of the evidence | |
| Assumed risk | Corresponding risk | ||||
| Control (placebo) | Fingolimod 0.5 mg | ||||
| Participants free from relapse | 49 per 100 | 70 per 100 | RR 1.44 | 1556 | ⊕⊕⊕⊝ |
| Participants free from disability worsening | 82 per 100 | 87 per 100 | RR 1.07 | 1556 | ⊕⊕⊝⊝ |
| Withdrawals due to adverse events | 9 per 100 | 13 per 100 | RR 1.42 | 1556 | ⊕⊝⊝⊝ |
| Annualised relapse rate | ‐ | ‐ | Rate ratio 0.50 | 1556 | ⊕⊕⊕⊝ |
| Participants free from MRI gadolinium‐enhancing lesions | 65 per 100 | 89 per 100 | RR 1.36 | 1226 | ⊕⊕⊝⊝ |
| *For dichotomous outcomes, the corresponding risk with fingolimod 0.5 mg (and its 95% CI) is based on the assumed risk with the control group (i.e. the mean proportion of events in the control group across the two studies) and the relative effect of fingolimod (and its 95% CI). For the annualised relapse rate, only the relative effect (i.e., the rate ratio) is given, because the assumed risk with the control group is not estimable. | |||||
| GRADE Working Group grades of evidence | |||||
| a Study limitations: significant differences in reasons for incomplete outcome data between treatment and control groups. | |||||
| Fingolimod 0.5 mg versus intramuscular interferon beta‐1a for relapsing‐remitting multiple sclerosis | |||||
| Participants or population: people with relapsing‐remitting multiple sclerosis | |||||
| Outcomes at 12 months | Illustrative comparative risks* (95% CI) | Relative effect | No. of Participants | Quality of the evidence | |
| Assumed risk | Corresponding risk | ||||
| Control (interferon beta‐1a) | Fingolimod 0.5 mg | ||||
| Participants free from relapse | 70 per 100 | 83 per 100 | RR 1.18 | 860 | ⊕⊕⊕⊝ |
| Participants free from disability worsening | 92 per 100 | 94 per 100 | RR 1.02 | 860 | ⊕⊕⊝⊝ |
| Withdrawals due to adverse events | 4 per 100 | 6 per 100 | RR 1.51 | 860 | ⊕⊕⊕⊝ |
| Annualised relapse rate | ‐ | ‐ | Rate ratio 0.48 | 860 | ⊕⊕⊕⊝ |
| Participants free from MRI gadolinium‐enhancing lesions | 81 per 100 | 90 per 100 | RR 1.12 | 728 | ⊕⊕⊕⊝ |
| *For dichotomous outcomes, the corresponding risk with the intervention (and its 95% CI) is based on the assumed risk with the control (i.e. the mean proportion of events in the control group across studies) and the relative effect of the intervention (and its 95% CI). For the annualised relapse rate, only the relative effect (i.e., the rate ratio) is given. | |||||
| GRADE Working Group grades of evidence | |||||
| a Imprecision: total number of events (i.e. the number of participants with disability worsening/gadolinium‐enhancing lesions) was less than 300 (the threshold rule‐of‐thumb value), and thus the available evidence did not meet the optimal information size criteria. b Indirectness: surrogate outcome (progression confirmed at three months of follow‐up). | |||||
| Study name | Clinical outcomes | Time point assessment | MRI outcomes | Time point assessment |
| 1.Annualised relapse rate 2. Time to disability progression confirmed at 3 months 3. Time to disability progression confirmed at 6 months 4. Safety 5. Time to first relapse 6. Proportion of relapse‐free participants 7. Change from baseline to the end of study on the MSFC score 8. Quality of life using the Euro quality of life scale (EQ‐5D) 9. Patient Reported Indices in Multiple Sclerosis 10. Fatigue using the Modified Fatigue Impact Scale | 24 months | 1.Percent brain‐volume change from baseline at 24 months 2.Number and volume of gadolinium‐enhancing T1 lesions 3. Number of new or newly enlarged T2 lesions 4. Proportion of participants free of gadolinium‐enhancing T1 lesions 5. Proportion of participants free of new or newly enlarged T2 lesions 6. Proportion of participants free of new inflammatory activity (no gadolinium‐enhancing T1 lesions and no new or newly enlarged T2 lesions) 7. Percentage change from baseline in volume of gadolinium‐enhanced T1 lesions 8. Percentage change from baseline in volume of new or newly enlarged T2 lesions 9. Brain volume | 24 months | |
| 1. Annualised relapse rate 2. Progression of disability (confirmed at 3 months) | 12 months | Number of new or enlarged lesions on T2‐weighted scans | 12 months | |
| 1. Treatment satisfaction 2. Fatigue 3. Depression 4. Activities of daily living 5. Health‐related Quality Of Life 6, Side effects | 6 months | Not included | ||
| 1. Number of participants remaining free of relapse 2. Annualised relapse rate 3, Time to the first relapse | 6 months | 1.Number of gadolinium‐enhanced lesions per participant recorded on T1‐weighted MRI at monthly intervals for 6 months 2.Total volume of gadolinium‐enhanced lesions per participants 3. Proportion of participants with gadolinium‐enhanced lesions 4. Total number of new lesion per participant on T‐weighted images 5. Changes in lesion volume on T2‐weighted images 6. Brain volume from baseline to month 6 | 6 months | |
| 1. Annualised relapse rate 2. Time to confirmed disability progression (confirmed after 3 months ) 3. Time to a first relapse 4. Time to disability progression (confirmed after 6 months) 5. Changes in the EDSS score 6. Changes in the MSFC z score between baseline and 24 months | 24 months | 1. Number of gadolinium‐enhancing lesions 2. Proportion of participants free from gadolinium‐enhancing lesions 3. Number of new or enlarged lesions on T2‐weighted MRI scans 4. Proportion of participants free from new or enlarged lesions on T2‐weighted scan 5. Volumes of hyperintense lesions on T2‐weighted scan 6. Volumes of hypointense lesions on T1‐weighted scans 7. Change in brain volume between baseline and 24 months 8. Safety and tolerability measures | 24 months | |
| Percentage of participants free from relapse | 6 months | Participants free from gadolinium‐enhancing lesions | 6 months | |
| EDSS: Expanded Disability Status Scale; MSFC: Multiple Sclerosis Functional Composite The primary outcome of each study is underlined | ||||
| Study name | Drugs | No. participants | Female (%) | Course of disease of RR‐SP (%) | Age, years, mean (SD) | Mean EDSS score (SD) | Disease duration, mean (SD) | Pre‐1 year number of relapses, mean (SD) | Percentage of pre‐study treatment‐naive participants | Percentage of participants with MRI enhancing lesions | Mean lesion volume on T2‐weighted images (mm3 ) (SD) |
| Placebo | 355 | 81 | 100 ‐ 0 | 40·1 (8·4) | 2·2 (1·5) | 10·6 (7·9) | 1·5 (0·9) | 27 | 36 | 5553 (7841) | |
| Fingolimod 0.5 mg | 358 | 77 | 100 ‐ 0 | 40·6 (8·4) | 2·2 (1·4) | 10·4 (8·0) | 1·4 (0·9) | 26 | 39 | 5484 (8000) | |
| Fingolimod 1.25 mg | 370 | 76 | 100 ‐ 0 | 40·9 (8·9) | 2·3 (2·0) | 10·8 (8·2) | 1·5 (1·0) | 22 | 31 | 4936 (7286) | |
| Interferon beta‐1a (Avonex) | 435 | 67.8 | 100 ‐ 0 | 36.0 (8.3) | 2.19 (1.26) | 7.4 (6.3) | 1.5 (0.8) | 43.7 | 36.9 | 4924 (5711) | |
| Fingolimod 0.5 mg | 431 | 65.4 | 100 ‐ 0 | 36.7 (8.8) | 2.24 (1.33) | 7.5 (6.2) | 1.5 (1.2) | 44.8 | 32.6 | 5170 (6642) | |
| Fingolimod 1.25 mg | 426 | 68.8 | 100 ‐ 0 | 35.8 (8.4) | 2.21 (1.31) | 7.3 (6.0) | 1.5 (0.9) | 41.5 | 34.5 | 5085 (5962) | |
| DMD§ | 263 | 79.1 | 100 ‐ 0 | 45.1 (9.82) | 2.4 (1.32) | 11.7 (8.44) | 0.8 (1.32) | 0 | NR | NR | |
| Fingolimod 0.5 mg | 790 | 76.1 | 100 ‐ 0 | 46.0 (9.82) | 2.4 (1.32) | 12.1 (8.38) | 0.8 (1.20) | 0 | NR | NR | |
| Placebo | 93 | 66 | 90 ‐ 10 | 37.1 (19‐56)* | 2.6 (0.0‐6.5)* | 8.4 (0.2‐28.2)* | 1.2 (0‐5)* | NR | 51 | 8805 (123‐62,218)* | |
| Fingolimod 1.25 mg | 94 | 75 | 89 ‐ 11 | 38.0 (19‐60)* | 2.7 (0.0‐6.0)* | 8.6 (0.3‐50.2)* | 1.3 (0‐5)* | NR | 47 | 10,219 (293‐104,504)* | |
| Fingolimod 5.0 mg | 94 | 71 | 87 ‐ 13 | 38.3 (18‐59)* | 2.5 (0.0‐6.0)* | 9.5 (0.5‐42.2)* | 1.3 (0‐4)* | NR | 57 | 8722 (349‐70,218)* | |
| Placebo | 418 | 71.3 | 100 ‐ 0 | 37.2 (8.6) | 2.5 (1.3) | 8.1 (6.4) | 1.4 (0.7) | 59.6 | 37 | 6162 (7085) | |
| Fingolimod 0.5 mg | 425 | 69.6 | 100 ‐ 0 | 36.6 (8.8) | 2.3 (1.3) | 8.0 (6.6) | 1.5 (0.8) | 57.4 | 38 | 6128 (7623) | |
| Fingolimod 1.25 mg | 429 | 68.8 | 100 ‐ 0 | 37.4 (8.9) | 2.4 (1.4) | 8.4 (6.9) | 1.5 (0.8) | 60.4 | 39.4 | 6829 (8491) | |
| Placebo | 57 | 68.4 | 100 ‐ 0 | 35.0 (8.9) | 2.1 (1.7) | 8.2 (7.3) | 1.7 (1.6) | NR | 42.1 | 31.6 (22.6)** | |
| Fingolimod 0.5 mg | 57 | 70.2 | 94.7 ‐ 5.3 | 35.0 (9.0) | 2.3 (1.9) | 8.2 (6.8) | 1.4 (1.0) | NR | 42.1 | 30.4 (22.7)** | |
| Fingolimod 1.25 mg | 57 | 68.4 | 98.2 ‐ 1.8 | 36.0 (9.3) | 1.8 (1.7) | 7.1 (5.3) | 1.5 (0.9) | NR | 49.1 | 31.7 (23.3)** | |
| DMD: disease‐modifying drug;EDSS: Expanded Disability Status Scale; MRI: magnetic resonance imaging; NR: not reported; RR: relapsing‐remitting; SD: standard deviation; SP: secondary progressive * Range (SD was not provided) | |||||||||||
| Study name | Risk of bias | Did the researchers actively monitor for adverse events (AEs) (low risk of bias) or did they simply provide spontaneous reporting of AEs that arose (high risk of bias)? | Risk of bias | Did the authors define serious AEs (SAEs) according to an accepted international classification and report the number of SAEs? |
| Low | "We did extensive safety and tolerability assessments, in part as a response to preclinical safety concerns raised by the FDA and additional safety areas of interest identified in previous phase 2 and earlier clinical studies. We also recorded adverse events, serious adverse events, serious adverse events of special interest, 24 h Holter electrocardiography (ECG) post first‐dose and at 3 months, first‐dose bradycardia events, infections, laboratory tests, vital signs, ECG, echocardiography, pulmonary function. tests, chest high‐resolution CT,chest radiographs, ophthalmic examinations, including serial optical coherence tomography, and dermatological assessments." Clinical assessments were performed at screening and at randomisation (baseline), and study visits, including safety assessments, were scheduled at 2 weeks and 1, 2, 3, 6, 9, 12, 15, 18, 21, and 24 months after randomisation" | Unclear | "We also recorded adverse events, serious adverse events, serious adverse events of special interest, 24 h Holter electrocardiography (ECG) post fist‐dose and at 3 months, first‐dose bradycardia events, infections, laboratory tests, vital signs, ECG, echocardiography, pulmonary function tests, chest high‐resolution CT,chest radiographs, ophthalmic examinations, including serial optical coherence tomography, and dermatological assessments" | |
| Low | "An independent data and safety monitoring board evaluated overall safety in the fingolimod phase 3 program" and "Safety assessments were conducted during screening, at baseline, and at months 1, 2, 3, 6, 9, and 12" (pg 404) | Low | SAEs were predefined per standard criteria (death, life‐threatening event, persistent disability, congenital defect, unplanned hospitalisation, or otherwise medically significant) (FDA 2010 Clinical review of safety pg 151) | |
| Low | "Safety and tolerability (secondary study objectives) were assessed via reporting of | Unclear | Not specified | |
| Low | "An independent external data and safety monitoring board evaluated adverse events and other safety data" and "Adverse events were assessed and reported at each visit (scheduled and unscheduled) by the treating physicians. Laboratory evaluations were undertaken at a central laboratory". "Vital signs were obtained at each visit, and laboratory and hematologic measures were obtained at baseline, day 1, and months 1,3,6,9, and 12. Electrocardiograms were obtained at baseline, on days 1 and 7, and at months 1,3,6,12, and 24 hour Holter electrocardiographic monitoring was performed at selected sites at baseline, day 1, and month 3. Pulmonary function tests... were performed at screening and months 6 and 12" (pg 1126) | Low | Categorisation of SAEs conformed to ICH guidelines (International Conference on Harmonisation of Technical Requirements for Registration of Pharmaceuticals for Human Use) | |
| Low | "An independent data and safety monitoring board evaluated the safety" and "Study visits, including safety assessments, were scheduled at 2 weeks and 1, 2, 3, 6, 9, 12, 15, 18, 21, and 24 months after randomization" (pg 389) | Low | SAEs were predefined per standard criteria (death, life‐threatening event, persistent disability, congenital defect, unplanned hospitalisation, or otherwise medically significant) (FDA 2010 Clinical review of safety pg 151) | |
| Low | "Adverse events, serious adverse events assessments were conducted at screening, baseline, days 1 and 15, and months 1,2,3,4,5 and 6" (pg 2) and "Safety assessment included recording of AEs, SAEs, hematology values, vital signs, results of dermatological and ophthalmological examinations and results of pulmonary and liver function tests" (Supplementary data online appendix) | Low | Categorisation of SAEs conformed to ICH guidelines (International Conference on Harmonisation of Technical Requirements for Registration of Pharmaceuticals for Human Use) | |
| AE: adverse event; CT: chest tomography; ECG: electrocardiography; FDA: Food and Drug Administration; SAE: serious adverse event | ||||
| Outcome or subgroup title | No. of studies | No. of participants | Statistical method | Effect size |
| 1 At 6 months Show forest plot | 2 | Risk Ratio (M‐H, Random, 95% CI) | Subtotals only | |
| 1.1 Fingolimod 0.5 mg versus placebo | 1 | 114 | Risk Ratio (M‐H, Random, 95% CI) | 1.22 [0.96, 1.54] |
| 1.2 Fingolimod 1.25 mg versus placebo | 2 | 299 | Risk Ratio (M‐H, Random, 95% CI) | 1.27 [1.11, 1.45] |
| 1.3 Fingolimod 5.0 mg versus placebo | 1 | 184 | Risk Ratio (M‐H, Random, 95% CI) | 1.30 [1.10, 1.53] |
| 2 At 12 months Show forest plot | 1 | Risk Ratio (M‐H, Random, 95% CI) | Subtotals only | |
| 2.1 Fingolimod 0.5 mg versus interferon beta‐1a | 1 | 860 | Risk Ratio (M‐H, Random, 95% CI) | 1.18 [1.09, 1.27] |
| 2.2 Fingolimod 1.25 mg versus interferon beta‐1a | 1 | 851 | Risk Ratio (M‐H, Random, 95% CI) | 1.15 [1.06, 1.24] |
| 3 At 24 months Show forest plot | 2 | Risk Ratio (M‐H, Random, 95% CI) | Subtotals only | |
| 3.1 Fingolimod 0.5 mg versus placebo | 2 | 1556 | Risk Ratio (M‐H, Random, 95% CI) | 1.44 [1.28, 1.63] |
| 3.2 Fingolimod 1.25 mg versus placebo | 2 | 1572 | Risk Ratio (M‐H, Random, 95% CI) | 1.51 [1.29, 1.76] |
| Outcome or subgroup title | No. of studies | No. of participants | Statistical method | Effect size |
| 1 At 12 months Show forest plot | 1 | Risk Ratio (M‐H, Random, 95% CI) | Subtotals only | |
| 1.1 Fingolimod 0.5 mg versus interferon beta‐1a | 1 | 860 | Risk Ratio (M‐H, Random, 95% CI) | 1.02 [0.99, 1.06] |
| 1.2 Fingolimod 1.25 mg versus interferon beta‐1a | 1 | 851 | Risk Ratio (M‐H, Random, 95% CI) | 1.01 [0.98, 1.05] |
| 2 At 24 months Show forest plot | 2 | Risk Ratio (M‐H, Random, 95% CI) | Subtotals only | |
| 2.1 Fingolimod 0.5 mg versus placebo | 2 | 1556 | Risk Ratio (M‐H, Random, 95% CI) | 1.07 [1.02, 1.11] |
| 2.2 Fingolimod 1.25 mg versus placebo | 2 | 1572 | Risk Ratio (M‐H, Random, 95% CI) | 1.08 [1.03, 1.12] |
| Outcome or subgroup title | No. of studies | No. of participants | Statistical method | Effect size |
| 1 Withdrawals due to adverse events over 6 months Show forest plot | 3 | Risk Ratio (M‐H, Random, 95% CI) | Subtotals only | |
| 1.1 Fingolimod 0.5 mg versus placebo | 1 | 114 | Risk Ratio (M‐H, Random, 95% CI) | 2.0 [0.53, 7.61] |
| 1.2 Fingolimod 0.5 mg versus DMDs | 1 | 1028 | Risk Ratio (M‐H, Random, 95% CI) | 3.21 [1.16, 8.86] |
| 1.3 Fingolimod 1.25 mg versus placebo | 2 | 298 | Risk Ratio (M‐H, Random, 95% CI) | 1.60 [0.63, 4.03] |
| 1.4 Fingolimod 5.0 mg versus placebo | 1 | 187 | Risk Ratio (M‐H, Random, 95% CI) | 1.98 [0.62, 6.35] |
| 2 Withdrawals due to adverse events over 12 months Show forest plot | 1 | Risk Ratio (M‐H, Random, 95% CI) | Subtotals only | |
| 2.1 Fingolimod 0.5 mg versus interferon beta‐1a | 1 | 860 | Risk Ratio (M‐H, Random, 95% CI) | 1.51 [0.81, 2.80] |
| 2.2 Fingolimod 1.25 mg versus interferon beta‐1a | 1 | 851 | Risk Ratio (M‐H, Random, 95% CI) | 2.69 [1.54, 4.72] |
| 3 Withdrawals due to adverse events over 24 months Show forest plot | 2 | Risk Ratio (M‐H, Random, 95% CI) | Subtotals only | |
| 3.1 Fingolimod 0.5 mg versus placebo | 2 | 1556 | Risk Ratio (M‐H, Random, 95% CI) | 1.42 [0.89, 2.25] |
| 3.2 Fingolimod 1.25 mg versus placebo | 2 | 1572 | Risk Ratio (M‐H, Random, 95% CI) | 1.93 [1.48, 2.52] |
| 4 Withdrawals due to serious adverse events over 6 months Show forest plot | 3 | Risk Ratio (M‐H, Random, 95% CI) | Subtotals only | |
| 4.1 Fingolimod 0.5 mg versus placebo | 1 | 114 | Risk Ratio (M‐H, Random, 95% CI) | 1.67 [0.42, 6.65] |
| 4.2 Fingolimod 0.5 mg versus DMDs | 1 | 1028 | Risk Ratio (M‐H, Random, 95% CI) | 2.71 [0.83, 8.88] |
| 4.3 Fingolimod 1.25 mg versus placebo | 2 | 298 | Risk Ratio (M‐H, Random, 95% CI) | 2.36 [0.99, 5.66] |
| 4.4 Fingolimod 5.0 mg versus placebo | 1 | 187 | Risk Ratio (M‐H, Random, 95% CI) | 2.77 [1.04, 7.38] |
| 5 Withdrawals due to serious adverse events over 12 months Show forest plot | 1 | Risk Ratio (M‐H, Random, 95% CI) | Subtotals only | |
| 5.1 Fingolimod 0.5 mg versus interferon beta‐1a | 1 | 860 | Risk Ratio (M‐H, Random, 95% CI) | 1.21 [0.72, 2.02] |
| 5.2 Fingolimod 1.25 mg versus interferon beta‐1a | 1 | 851 | Risk Ratio (M‐H, Random, 95% CI) | 1.85 [1.15, 2.96] |
| 6 Withdrawals due to serious adverse events over 24 months Show forest plot | 2 | Risk Ratio (M‐H, Random, 95% CI) | Subtotals only | |
| 6.1 Fingolimod 0.5 mg versus placebo | 2 | 1556 | Risk Ratio (M‐H, Random, 95% CI) | 0.91 [0.55, 1.50] |
| 6.2 Fingolimod 1.25 mg versus placebo | 2 | 1572 | Risk Ratio (M‐H, Random, 95% CI) | 0.98 [0.74, 1.29] |
| Outcome or subgroup title | No. of studies | No. of participants | Statistical method | Effect size |
| 1 At 6 months Show forest plot | 2 | Rate Ratio (Random, 95% CI) | Subtotals only | |
| 1.1 Fingolimod 0.5 mg versus placebo | 1 | Rate Ratio (Random, 95% CI) | 0.51 [0.26, 0.99] | |
| 1.2 Fingolimod 1.25 mg versus placebo | 2 | Rate Ratio (Random, 95% CI) | 0.44 [0.28, 0.70] | |
| 1.3 Fingolimod 5.0 mg versus placebo | 1 | Rate Ratio (Random, 95% CI) | 0.47 [0.26, 0.83] | |
| 2 At 12 months Show forest plot | 1 | Rate Ratio (Random, 95% CI) | 0.56 [0.46, 0.69] | |
| 2.1 Fingolimod 0.5 mg versus interferon beta‐1a | 1 | Rate Ratio (Random, 95% CI) | 0.48 [0.34, 0.70] | |
| 2.2 Fingolimod 1.25 versus interferon beta‐1a | 1 | Rate Ratio (Random, 95% CI) | 0.61 [0.47, 0.78] | |
| 3 At 24 months Show forest plot | 2 | Rate Ratio (Random, 95% CI) | Subtotals only | |
| 3.1 Fingolimod 0.5 mg versus placebo | 2 | Rate Ratio (Random, 95% CI) | 0.50 [0.40, 0.62] | |
| 3.2 Fingolimod 1.25 mg versus placebo | 2 | Rate Ratio (Random, 95% CI) | 0.47 [0.38, 0.59] | |
| Outcome or subgroup title | No. of studies | No. of participants | Statistical method | Effect size |
| 1 At 6 months Show forest plot | 4 | Risk Ratio (M‐H, Random, 95% CI) | Subtotals only | |
| 1.1 Fingolimod 0.5 mg versus placebo | 3 | 1519 | Risk Ratio (M‐H, Random, 95% CI) | 1.42 [1.33, 1.51] |
| 1.2 Fingolimod 1.25 mg versus placebo | 4 | 1674 | Risk Ratio (M‐H, Random, 95% CI) | 1.43 [1.34, 1.53] |
| 1.3 Fingolimod 5 mg versus placebo | 1 | 158 | Risk Ratio (M‐H, Random, 95% CI) | 1.74 [1.35, 2.25] |
| 2 At 12 months Show forest plot | 3 | Risk Ratio (M‐H, Random, 95% CI) | Subtotals only | |
| 2.1 Fingolimod 0.5 mg versus placebo | 2 | 1343 | Risk Ratio (M‐H, Random, 95% CI) | 1.39 [1.30, 1.48] |
| 2.2 Fingolimod 1.25 mg versus placebo | 2 | 1319 | Risk Ratio (M‐H, Random, 95% CI) | 1.39 [1.30, 1.48] |
| 2.3 Fingolimod 0.5 mg versus interferon beta‐1a | 1 | 728 | Risk Ratio (M‐H, Random, 95% CI) | 1.12 [1.05, 1.19] |
| 2.4 Fingolimod 1.25 mg versus interferon beta‐1a | 1 | 706 | Risk Ratio (M‐H, Random, 95% CI) | 1.13 [1.06, 1.20] |
| 3 At 24 months Show forest plot | 2 | Risk Ratio (M‐H, Random, 95% CI) | Subtotals only | |
| 3.1 Fingolimod 0.5 mg versus placebo | 2 | 1226 | Risk Ratio (M‐H, Random, 95% CI) | 1.36 [1.27, 1.45] |
| 3.2 Fingolimod 1.25 mg versus placebo | 2 | 1182 | Risk Ratio (M‐H, Random, 95% CI) | 1.43 [1.33, 1.52] |
| Outcome or subgroup title | No. of studies | No. of participants | Statistical method | Effect size |
| 1 At 12 months Show forest plot | 2 | Mean Difference (IV, Random, 95% CI) | Subtotals only | |
| 1.1 Fingolimod 0.5 mg versus placebo | 1 | 733 | Mean Difference (IV, Random, 95% CI) | ‐15.30 [‐24.34, ‐6.26] |
| 1.2 Fingolimod 1.25 mg versus placebo | 1 | 706 | Mean Difference (IV, Random, 95% CI) | ‐16.0 [‐25.23, ‐6.77] |
| 1.3 Fingolimod 0.5 mg versus interferon beta‐1a | 1 | 733 | Mean Difference (IV, Random, 95% CI) | ‐0.5 [‐6.32, 5.32] |
| 1.4 Fingolimod 1.25 mg versus interferon beta‐1a | 1 | 711 | Mean Difference (IV, Random, 95% CI) | ‐3.7 [‐9.18, 1.78] |
| 2 At 24 months Show forest plot | 2 | Mean Difference (IV, Random, 95% CI) | Subtotals only | |
| 2.1 Fingolimod 0.5 mg versus placebo | 2 | 1216 | Mean Difference (IV, Random, 95% CI) | ‐20.43 [‐34.03, ‐6.83] |
| 2.2 Fingolimod 1.25 mg versus placebo | 2 | 1171 | Mean Difference (IV, Random, 95% CI) | ‐32.51 [‐40.39, ‐24.62] |
| Outcome or subgroup title | No. of studies | No. of participants | Statistical method | Effect size |
| 1 At 6 months Show forest plot | 2 | Mean Difference (Random, 95% CI) | Subtotals only | |
| 1.1 Fingolimod 1.25 mg versus placebo (Hamburg Quality of Life Questionnaire) | 1 | Mean Difference (Random, 95% CI) | ‐0.14 [‐9.13, 8.85] | |
| 1.2 Fingolimod 0.5 mg versus DMDs (Change in FS36 Mental component summary) | 1 | Mean Difference (Random, 95% CI) | 1.8 [0.42, 3.18] | |
| 1.3 Fingolimod 0.5 mg versus DMDs (Change in FS36 Physical component summary) | 1 | Mean Difference (Random, 95% CI) | 1.30 [0.30, 2.30] | |
| 2 At 24 months Show forest plot | 1 | Mean Difference (IV, Random, 95% CI) | Subtotals only | |
| 2.1 Fingolimod 0.5 mg versus placebo (Euro quality of life scale) | 1 | 713 | Mean Difference (IV, Random, 95% CI) | ‐0.01 [‐0.04, 0.02] |