| Autologous serum compared with artificial tears for dry eye |
| Patient or population: participants with dry eye Settings: eye clinics Intervention: autologous serum 20% Comparison: artificial tears |
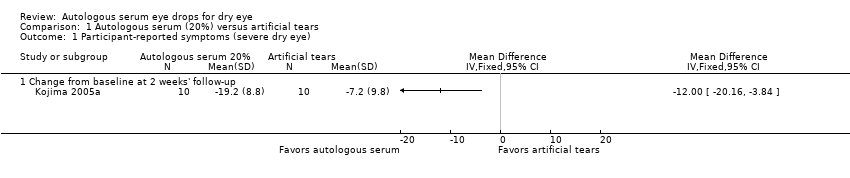
| Participant‐reported symptoms Range of scale: 0‐100, where a higher score is worse Follow‐up: 2‐4 weeks | Mean change in symptom score in the control group was 7.2 point improvement | Mean change in symptom score in the autologous serum group was 12.0 points more improved (20.16 to 3.84 more improved) | | 20
(1 RCT) | ⊕⊕⊝⊝
lowa,b | Trial investigators of 2 other studies reported more symptomatic improvement in the autologous serum group than in the artificial tears group; however, studies used a cross‐over design and did not provide sufficient data for comparison of treatments between groups |
| Tear hyperosmolarity Follow‐up: 2‐4 weeks | Not reported |
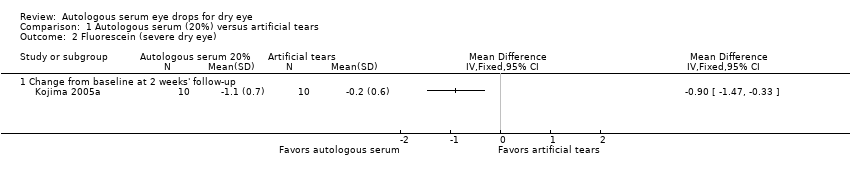
| Fluorescein staining Range of scale: 0‐9, where a higher score is worse Follow‐up: 2‐4 weeks | Mean change in fluorescein score in the control group was 0.2 point improvement | Mean change in fluorescein score in the autologous serum group was 0.9 points more improved (1.47 to 0.33 more improved) | | 20
(1 RCT) | ⊕⊕⊝⊝
lowa,b | Trial investigators of 2 other studies reported a non‐significant difference in Oxford Scale scores; however, studies used a cross‐over design and did not provide sufficient data for comparison of treatments between groups |
| Rose Bengal staining Range of scale: 0‐9, where a higher score is worse Follow‐up: 2‐4 weeks | Mean change in Rose Bengal score in the control group was 0.1 point improvement | Mean change in Rose Bengal score in the autologous serum group was 2.2 points more improved (2.73 to 1.67 more improved) | | 20
(1 RCT) | ⊕⊕⊝⊝
lowa,b | Trial investigators of 2 other studies did not report data for this outcome |
| Tear film break‐up time Follow‐up: 2‐4 weeks | Mean change in tear film break‐up time in the control group was 0.1 seconds | Mean change in tear film break‐up time in the autologous serum group was 2.00 seconds longer (0.99 to 3.01 longer) | | 20
(1 RCT) | ⊕⊕⊝⊝
lowa,b | Trial investigators of 2 other studies reported the difference in TBUT between groups as 1 and 2 seconds; however, studies used a cross‐over study design and did not provide sufficient data for comparison of treatments between groups |
| Schirmer’s test Score < 4 mm indicates severe dry eye Follow‐up: 2‐4 weeks | Mean Schirmer’s test score in the control group was 3.7 mm | Mean Schirmer’s test score in the autologous serum group was
0.40 mm lower (2.91 lower to 2.11 mm higher) | | 20
(1 RCT) | ⊕⊕⊝⊝
lowa,b | Trial investigators of 1 other study reported no difference in Schirmer’s test scores between groups; however, the study used a cross‐over design and did not provide sufficient data for comparison of treatments between groups |
| Adverse events | Not reported |
| *The basis for the assumed risk is the control group risk across studies. The corresponding risk (and its 95% confidence interval) is based on the assumed risk in the comparison group and the relative effect of the intervention (and its 95% CI)
CI: confidence interval; RR: risk ratio |
| GRADE Working Group grades of evidence
High‐certainty: Further research is very unlikely to change our confidence in the estimate of effect
Moderate‐certainty: Further research is likely to have an important impact on our confidence in the estimate of effect and may change the estimate
Low‐certainty: Further research is very likely to have an important impact on our confidence in the estimate of effect and is likely to change the estimate
Very low‐certainty: We are very uncertain about the estimate |