Losigamone add‐on therapy for partial epilepsy
Información
- DOI:
- https://doi.org/10.1002/14651858.CD009324.pub3Copiar DOI

- Base de datos:
-
- Cochrane Database of Systematic Reviews
- Versión publicada:
-
- 10 diciembre 2015see what's new
- Tipo:
-
- Intervention
- Etapa:
-
- Review
- Grupo Editorial Cochrane:
-
Grupo Cochrane de Epilepsia
- Copyright:
-
- Copyright © 2015 The Cochrane Collaboration. Published by John Wiley & Sons, Ltd.
Cifras del artículo
Altmetric:
Citado por:
Autores
Contributions of authors
Yousheng Xiao, Man Luo, Hongye Luo, Jin Wang drafted the protocol.
Trials search co‐ordinator developed the search strategy.
Yousheng Xiao, Man Luo selected relevant articles for inclusion.
Yousheng Xiao, Man Luo extracted the data from included studies.
Yousheng Xiao, Man Luo assessed the risk of bias in included studies.
Yousheng Xiao, Man Luo entered data to RevMan.
Yousheng Xiao, Man Luo, Hongye Luo, Jin Wang carried out the analysis.
Yousheng Xiao, Jin Wang interpreted the results.
Yousheng Xiao, Man Luo, Hongye Luo, Jin Wang drafted the final review.
Jin Wang updated the review.
Sources of support
Internal sources
-
No sources of support supplied
External sources
-
National Institute for Health Research, NIHR, UK.
This review was supported by the National Institute for Health Research, via Cochrane Infrastructure funding to the Epilepsy Group. The views and opinions expressed therein are those of the authors and do not necessarily reflect those of the Systematic Reviews Programme, NIHR, NHS or the Department of Health.
Declarations of interest
None known.
Acknowledgements
We would like to thank Professor Anthony Marson for his constructive suggestions and comments. We would like to thank Ann Johnston, Andrew McKay and Keven Hearn for their suggestions and comments. We would also like to thank Rachael Kelly from the Cochrane Epilepsy Review Group for her help in developing this review.
Version history
| Published | Title | Stage | Authors | Version |
| 2019 Dec 11 | Losigamone add‐on therapy for focal epilepsy | Review | Hongchang Chen, Honghu He, Yousheng Xiao, Man Luo, Hongye Luo, Jin Wang | |
| 2018 Jan 22 | Losigamone add‐on therapy for focal epilepsy | Review | Yousheng Xiao, Man Luo, Jin Wang, Hongye Luo | |
| 2015 Dec 10 | Losigamone add‐on therapy for partial epilepsy | Review | Yousheng Xiao, Man Luo, Jin Wang, Hongye Luo | |
| 2012 Jun 13 | Losigamone add‐on therapy for partial epilepsy | Review | Yousheng Xiao, Man Luo, Jin Wang, Hongye Luo | |
| 2011 Sep 07 | Losigamone add‐on therapy for partial epilepsy | Protocol | Yousheng Xiao, Man Luo, Jin Wang, Hongye Luo | |
Keywords
MeSH
Medical Subject Headings (MeSH) Keywords
Medical Subject Headings Check Words
Adult; Aged; Humans; Middle Aged;
PICO

Study flow diagram.

Risk of bias graph: review authors' judgments about each risk of bias item presented as percentages across all included studies.

Risk of bias summary: review authors' judgments about each risk of bias item for each included study.

Comparison 1 Losigamone versus placebo: 50% or greater reduction in seizure frequency, Outcome 1 All doses.
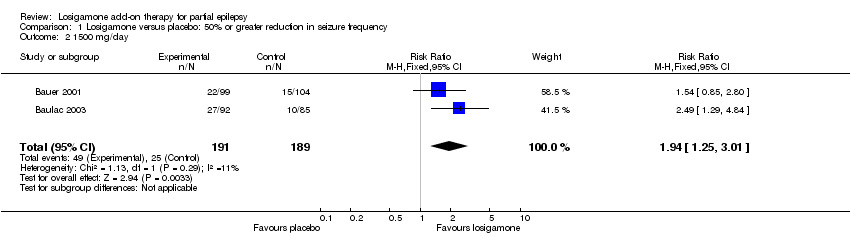
Comparison 1 Losigamone versus placebo: 50% or greater reduction in seizure frequency, Outcome 2 1500 mg/day.

Comparison 1 Losigamone versus placebo: 50% or greater reduction in seizure frequency, Outcome 3 1200 mg/day.
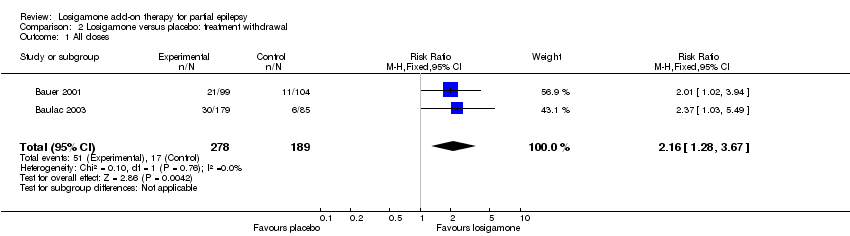
Comparison 2 Losigamone versus placebo: treatment withdrawal, Outcome 1 All doses.

Comparison 2 Losigamone versus placebo: treatment withdrawal, Outcome 2 1500 mg/day.
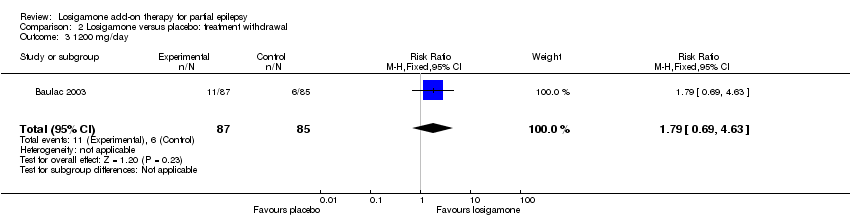
Comparison 2 Losigamone versus placebo: treatment withdrawal, Outcome 3 1200 mg/day.

Comparison 3 Losigamone versus placebo: adverse events, Outcome 1 The proportion of participants experiencing any adverse events (random model).

Comparison 3 Losigamone versus placebo: adverse events, Outcome 2 The proportion of participants experiencing any adverse events (fixed model).
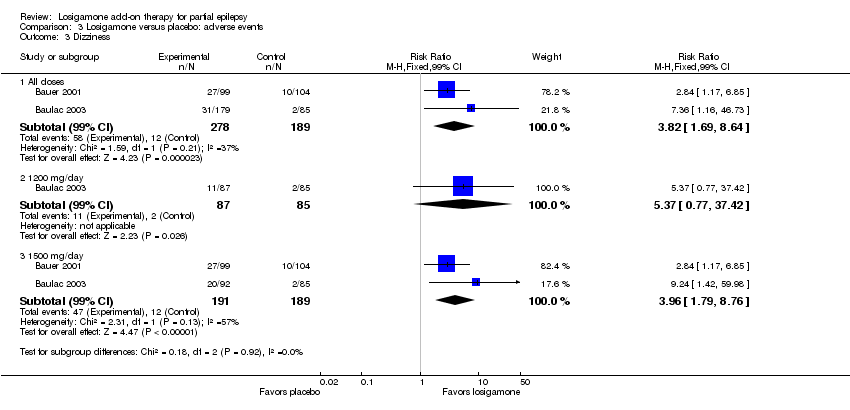
Comparison 3 Losigamone versus placebo: adverse events, Outcome 3 Dizziness.

Comparison 3 Losigamone versus placebo: adverse events, Outcome 4 Headache.
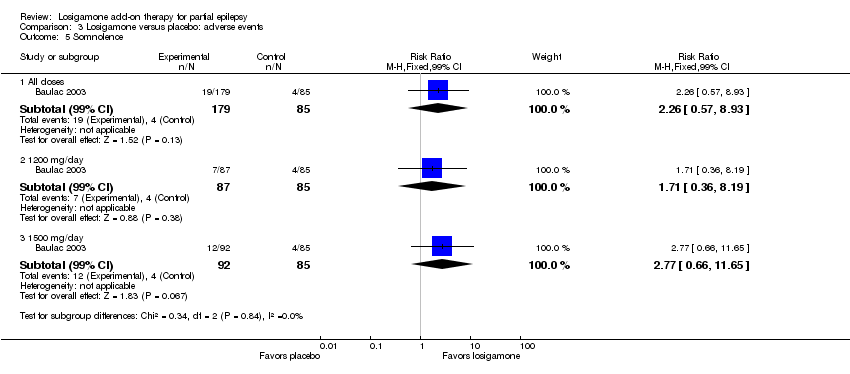
Comparison 3 Losigamone versus placebo: adverse events, Outcome 5 Somnolence.

Comparison 3 Losigamone versus placebo: adverse events, Outcome 6 Fatigue.

Comparison 3 Losigamone versus placebo: adverse events, Outcome 7 Ataxia.

Comparison 3 Losigamone versus placebo: adverse events, Outcome 8 Nausea.

Comparison 3 Losigamone versus placebo: adverse events, Outcome 9 Diplopia.
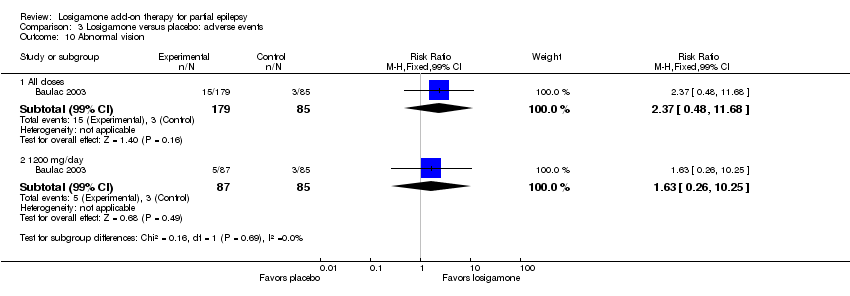
Comparison 3 Losigamone versus placebo: adverse events, Outcome 10 Abnormal vision.

Comparison 3 Losigamone versus placebo: adverse events, Outcome 11 Vertigo.

Comparison 3 Losigamone versus placebo: adverse events, Outcome 12 Depression.
| Losigamone compared to placebo for partial epilepsy | |||||
| Patient or population: partial epilepsy | |||||
| Outcomes | Illustrative comparative risks* (95% CI) | Relative effect | No of Participants | Quality of the evidence | |
| Assumed risk | Corresponding risk | ||||
| Placebo | Losigamone | ||||
| 50% or greater reduction in seizure frequency | Study population | RR 1.76 | 467 | ⊕⊕⊕⊝ | |
| 132 per 1000 | 233 per 1000 | ||||
| Moderate | |||||
| 131 per 1000 | 231 per 1000 | ||||
| Treatment withdrawal | Study population | RR 2.16 | 467 | ⊕⊕⊕⊝ | |
| 90 per 1000 | 194 per 1000 | ||||
| Moderate | |||||
| 88 per 1000 | 190 per 1000 | ||||
| The proportion of participants experiencing any adverse events | Study population | RR 1.34 | 467 | ⊕⊕⊕⊝ | |
| 471 per 1000 | 631 per 1000 | ||||
| Moderate | |||||
| 482 per 1000 | 646 per 1000 | ||||
| Adverse event (dizziness) | Study population | RR 3.82 | 467 | ⊕⊕⊕⊝ | |
| 63 per 1000 | 243 per 1000 | ||||
| Moderate | |||||
| 60 per 1000 | 229 per 1000 | ||||
| *The basis for the assumed risk (e.g. the median control group risk across studies) is provided in footnotes. The corresponding risk (and its 95% confidence interval) is based on the assumed risk in the comparison group and the relative effect of the intervention (and its 95% CI). | |||||
| GRADE Working Group grades of evidence | |||||
| 1 One of the two included trials did not describe the method used to generate the random list and did not mention allocation concealment | |||||
| Study ID | Review's primary outcomes | Review's secondary outcomes | Other study outcomes | |||
| 50% or greater reduction in seizure frequency | Seizure freedom | Treatment withdrawal | Adverse events | Change in seizure frequency | The percentage reduction in seizure frequency | |
| √ | × | √ | √ | √ | × | |
| √ | × | √ | √ | × | √ | |
| √Full reporting of outcomes for treatment comparison × No reporting of outcomes for treatment comparison | ||||||
| Outcome or subgroup title | No. of studies | No. of participants | Statistical method | Effect size |
| 1 All doses Show forest plot | 2 | 467 | Risk Ratio (M‐H, Fixed, 95% CI) | 1.76 [1.14, 2.72] |
| 2 1500 mg/day Show forest plot | 2 | 380 | Risk Ratio (M‐H, Fixed, 95% CI) | 1.94 [1.25, 3.01] |
| 3 1200 mg/day Show forest plot | 1 | 172 | Risk Ratio (M‐H, Fixed, 95% CI) | 1.47 [0.70, 3.08] |
| Outcome or subgroup title | No. of studies | No. of participants | Statistical method | Effect size |
| 1 All doses Show forest plot | 2 | 467 | Risk Ratio (M‐H, Fixed, 95% CI) | 2.16 [1.28, 3.67] |
| 2 1500 mg/day Show forest plot | 2 | 380 | Risk Ratio (M‐H, Fixed, 95% CI) | 2.34 [1.38, 3.99] |
| 3 1200 mg/day Show forest plot | 1 | 172 | Risk Ratio (M‐H, Fixed, 95% CI) | 1.79 [0.69, 4.63] |
| Outcome or subgroup title | No. of studies | No. of participants | Statistical method | Effect size |
| 1 The proportion of participants experiencing any adverse events (random model) Show forest plot | 2 | Risk Ratio (M‐H, Random, 95% CI) | Subtotals only | |
| 1.1 All doses | 2 | 467 | Risk Ratio (M‐H, Random, 95% CI) | 1.34 [1.00, 1.80] |
| 1.2 1200 mg/day | 1 | 172 | Risk Ratio (M‐H, Random, 95% CI) | 1.06 [0.83, 1.34] |
| 1.3 1500 mg/day | 2 | 380 | Risk Ratio (M‐H, Random, 95% CI) | 1.40 [1.14, 1.71] |
| 2 The proportion of participants experiencing any adverse events (fixed model) Show forest plot | 2 | Risk Ratio (M‐H, Fixed, 95% CI) | Subtotals only | |
| 2.1 All doses | 2 | 467 | Risk Ratio (M‐H, Fixed, 95% CI) | 1.33 [1.12, 1.57] |
| 3 Dizziness Show forest plot | 2 | Risk Ratio (M‐H, Fixed, 99% CI) | Subtotals only | |
| 3.1 All doses | 2 | 467 | Risk Ratio (M‐H, Fixed, 99% CI) | 3.82 [1.69, 8.64] |
| 3.2 1200 mg/day | 1 | 172 | Risk Ratio (M‐H, Fixed, 99% CI) | 5.37 [0.77, 37.42] |
| 3.3 1500 mg/day | 2 | 380 | Risk Ratio (M‐H, Fixed, 99% CI) | 3.96 [1.79, 8.76] |
| 4 Headache Show forest plot | 1 | Risk Ratio (M‐H, Fixed, 99% CI) | Subtotals only | |
| 4.1 All doses | 1 | 264 | Risk Ratio (M‐H, Fixed, 99% CI) | 1.19 [0.43, 3.30] |
| 4.2 1200 mg/day | 1 | 172 | Risk Ratio (M‐H, Fixed, 99% CI) | 0.85 [0.24, 3.06] |
| 4.3 1500 mg/day | 1 | 177 | Risk Ratio (M‐H, Fixed, 99% CI) | 1.50 [0.50, 4.47] |
| 5 Somnolence Show forest plot | 1 | Risk Ratio (M‐H, Fixed, 99% CI) | Subtotals only | |
| 5.1 All doses | 1 | 264 | Risk Ratio (M‐H, Fixed, 99% CI) | 2.26 [0.57, 8.93] |
| 5.2 1200 mg/day | 1 | 172 | Risk Ratio (M‐H, Fixed, 99% CI) | 1.71 [0.36, 8.19] |
| 5.3 1500 mg/day | 1 | 177 | Risk Ratio (M‐H, Fixed, 99% CI) | 2.77 [0.66, 11.65] |
| 6 Fatigue Show forest plot | 1 | Risk Ratio (M‐H, Fixed, 99% CI) | Subtotals only | |
| 6.1 All doses | 1 | 264 | Risk Ratio (M‐H, Fixed, 99% CI) | 2.26 [0.57, 8.93] |
| 6.2 1200 mg/day | 1 | 172 | Risk Ratio (M‐H, Fixed, 99% CI) | 1.71 [0.36, 8.19] |
| 6.3 1500 mg/day | 1 | 177 | Risk Ratio (M‐H, Fixed, 99% CI) | 2.77 [0.66, 11.65] |
| 7 Ataxia Show forest plot | 1 | Risk Ratio (M‐H, Fixed, 99% CI) | Subtotals only | |
| 7.1 All doses | 1 | 264 | Risk Ratio (M‐H, Fixed, 99% CI) | 10.03 [0.24, 411.20] |
| 7.2 1200 mg/day | 1 | 172 | Risk Ratio (M‐H, Fixed, 99% CI) | 10.75 [0.24, 473.22] |
| 7.3 1500 mg/day | 1 | 177 | Risk Ratio (M‐H, Fixed, 99% CI) | 10.17 [0.23, 448.02] |
| 8 Nausea Show forest plot | 1 | Risk Ratio (M‐H, Fixed, 99% CI) | Subtotals only | |
| 8.1 All doses | 1 | 264 | Risk Ratio (M‐H, Fixed, 99% CI) | 0.85 [0.21, 3.45] |
| 8.2 1200 mg/day | 1 | 172 | Risk Ratio (M‐H, Fixed, 99% CI) | 0.39 [0.05, 3.25] |
| 8.3 1500 mg/day | 1 | 177 | Risk Ratio (M‐H, Fixed, 99% CI) | 1.29 [0.30, 5.56] |
| 9 Diplopia Show forest plot | 1 | Risk Ratio (M‐H, Fixed, 99% CI) | Subtotals only | |
| 9.1 All doses | 1 | 264 | Risk Ratio (M‐H, Fixed, 99% CI) | 2.85 [0.59, 13.70] |
| 9.2 1200 mg/day | 1 | 172 | Risk Ratio (M‐H, Fixed, 99% CI) | 2.28 [0.40, 12.90] |
| 9.3 1500 mg/day | 1 | 177 | Risk Ratio (M‐H, Fixed, 99% CI) | 3.39 [0.66, 17.33] |
| 10 Abnormal vision Show forest plot | 1 | Risk Ratio (M‐H, Fixed, 99% CI) | Subtotals only | |
| 10.1 All doses | 1 | 264 | Risk Ratio (M‐H, Fixed, 99% CI) | 2.37 [0.48, 11.68] |
| 10.2 1200 mg/day | 1 | 172 | Risk Ratio (M‐H, Fixed, 99% CI) | 1.63 [0.26, 10.25] |
| 11 Vertigo Show forest plot | 1 | Risk Ratio (M‐H, Fixed, 99% CI) | Subtotals only | |
| 11.1 All doses | 1 | 264 | Risk Ratio (M‐H, Fixed, 99% CI) | 6.17 [0.44, 87.50] |
| 11.2 1200 mg/day | 1 | 172 | Risk Ratio (M‐H, Fixed, 99% CI) | 5.86 [0.37, 92.10] |
| 11.3 1500 mg/day | 1 | 177 | Risk Ratio (M‐H, Fixed, 99% CI) | 6.47 [0.42, 98.79] |
| 12 Depression Show forest plot | 1 | Risk Ratio (M‐H, Fixed, 99% CI) | Subtotals only | |
| 12.1 All doses | 1 | 264 | Risk Ratio (M‐H, Fixed, 99% CI) | 0.63 [0.09, 4.40] |
| 12.2 1200 mg/day | 1 | 172 | Risk Ratio (M‐H, Fixed, 99% CI) | 0.98 [0.12, 7.71] |
| 12.3 1500 mg/day | 1 | 177 | Risk Ratio (M‐H, Fixed, 99% CI) | 0.92 [0.12, 7.30] |