| 1 The proportion of participants experiencing any adverse events (random model) Show forest plot | 2 | | Risk Ratio (M‐H, Random, 95% CI) | Subtotals only |
|
| 1.1 All doses | 2 | 467 | Risk Ratio (M‐H, Random, 95% CI) | 1.34 [1.00, 1.80] |
| 1.2 1200 mg/day | 1 | 172 | Risk Ratio (M‐H, Random, 95% CI) | 1.06 [0.83, 1.34] |
| 1.3 1500 mg/day | 2 | 380 | Risk Ratio (M‐H, Random, 95% CI) | 1.40 [1.14, 1.71] |
| 2 The proportion of participants experiencing any adverse events (fixed model) Show forest plot | 2 | | Risk Ratio (M‐H, Fixed, 95% CI) | Subtotals only |
|
| 2.1 All doses | 2 | 467 | Risk Ratio (M‐H, Fixed, 95% CI) | 1.33 [1.12, 1.57] |
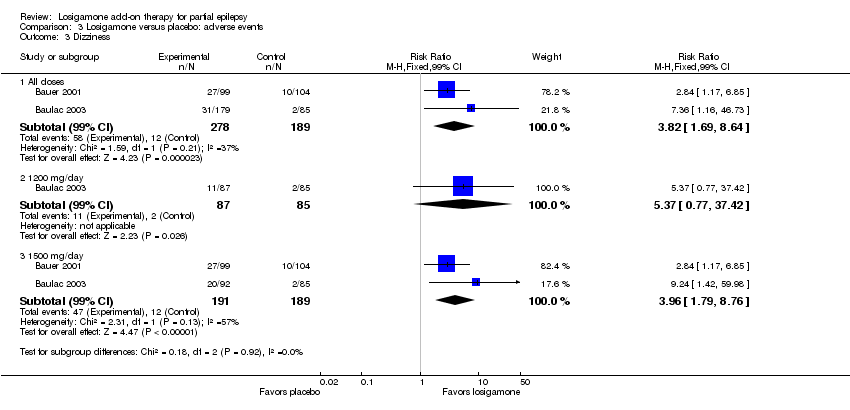
| 3 Dizziness Show forest plot | 2 | | Risk Ratio (M‐H, Fixed, 99% CI) | Subtotals only |
|
| 3.1 All doses | 2 | 467 | Risk Ratio (M‐H, Fixed, 99% CI) | 3.82 [1.69, 8.64] |
| 3.2 1200 mg/day | 1 | 172 | Risk Ratio (M‐H, Fixed, 99% CI) | 5.37 [0.77, 37.42] |
| 3.3 1500 mg/day | 2 | 380 | Risk Ratio (M‐H, Fixed, 99% CI) | 3.96 [1.79, 8.76] |
| 4 Headache Show forest plot | 1 | | Risk Ratio (M‐H, Fixed, 99% CI) | Subtotals only |
|
| 4.1 All doses | 1 | 264 | Risk Ratio (M‐H, Fixed, 99% CI) | 1.19 [0.43, 3.30] |
| 4.2 1200 mg/day | 1 | 172 | Risk Ratio (M‐H, Fixed, 99% CI) | 0.85 [0.24, 3.06] |
| 4.3 1500 mg/day | 1 | 177 | Risk Ratio (M‐H, Fixed, 99% CI) | 1.50 [0.50, 4.47] |
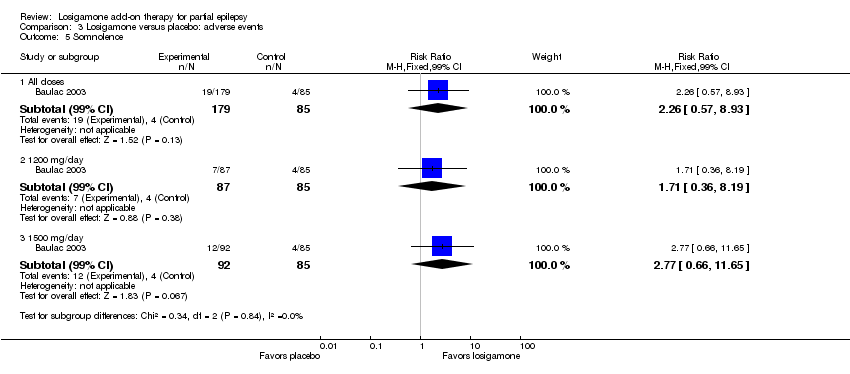
| 5 Somnolence Show forest plot | 1 | | Risk Ratio (M‐H, Fixed, 99% CI) | Subtotals only |
|
| 5.1 All doses | 1 | 264 | Risk Ratio (M‐H, Fixed, 99% CI) | 2.26 [0.57, 8.93] |
| 5.2 1200 mg/day | 1 | 172 | Risk Ratio (M‐H, Fixed, 99% CI) | 1.71 [0.36, 8.19] |
| 5.3 1500 mg/day | 1 | 177 | Risk Ratio (M‐H, Fixed, 99% CI) | 2.77 [0.66, 11.65] |
| 6 Fatigue Show forest plot | 1 | | Risk Ratio (M‐H, Fixed, 99% CI) | Subtotals only |
|
| 6.1 All doses | 1 | 264 | Risk Ratio (M‐H, Fixed, 99% CI) | 2.26 [0.57, 8.93] |
| 6.2 1200 mg/day | 1 | 172 | Risk Ratio (M‐H, Fixed, 99% CI) | 1.71 [0.36, 8.19] |
| 6.3 1500 mg/day | 1 | 177 | Risk Ratio (M‐H, Fixed, 99% CI) | 2.77 [0.66, 11.65] |
| 7 Ataxia Show forest plot | 1 | | Risk Ratio (M‐H, Fixed, 99% CI) | Subtotals only |
|
| 7.1 All doses | 1 | 264 | Risk Ratio (M‐H, Fixed, 99% CI) | 10.03 [0.24, 411.20] |
| 7.2 1200 mg/day | 1 | 172 | Risk Ratio (M‐H, Fixed, 99% CI) | 10.75 [0.24, 473.22] |
| 7.3 1500 mg/day | 1 | 177 | Risk Ratio (M‐H, Fixed, 99% CI) | 10.17 [0.23, 448.02] |
| 8 Nausea Show forest plot | 1 | | Risk Ratio (M‐H, Fixed, 99% CI) | Subtotals only |
|
| 8.1 All doses | 1 | 264 | Risk Ratio (M‐H, Fixed, 99% CI) | 0.85 [0.21, 3.45] |
| 8.2 1200 mg/day | 1 | 172 | Risk Ratio (M‐H, Fixed, 99% CI) | 0.39 [0.05, 3.25] |
| 8.3 1500 mg/day | 1 | 177 | Risk Ratio (M‐H, Fixed, 99% CI) | 1.29 [0.30, 5.56] |
| 9 Diplopia Show forest plot | 1 | | Risk Ratio (M‐H, Fixed, 99% CI) | Subtotals only |
|
| 9.1 All doses | 1 | 264 | Risk Ratio (M‐H, Fixed, 99% CI) | 2.85 [0.59, 13.70] |
| 9.2 1200 mg/day | 1 | 172 | Risk Ratio (M‐H, Fixed, 99% CI) | 2.28 [0.40, 12.90] |
| 9.3 1500 mg/day | 1 | 177 | Risk Ratio (M‐H, Fixed, 99% CI) | 3.39 [0.66, 17.33] |
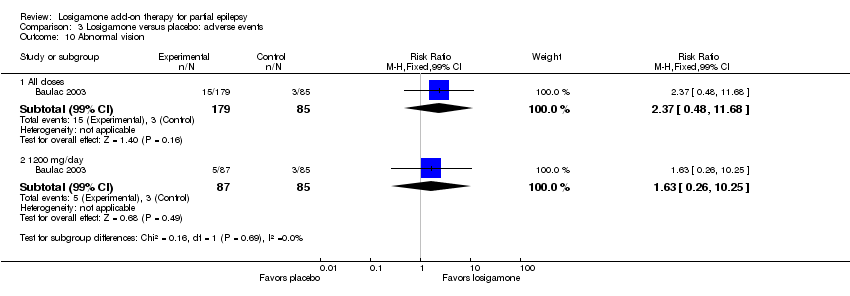
| 10 Abnormal vision Show forest plot | 1 | | Risk Ratio (M‐H, Fixed, 99% CI) | Subtotals only |
|
| 10.1 All doses | 1 | 264 | Risk Ratio (M‐H, Fixed, 99% CI) | 2.37 [0.48, 11.68] |
| 10.2 1200 mg/day | 1 | 172 | Risk Ratio (M‐H, Fixed, 99% CI) | 1.63 [0.26, 10.25] |
| 11 Vertigo Show forest plot | 1 | | Risk Ratio (M‐H, Fixed, 99% CI) | Subtotals only |
|
| 11.1 All doses | 1 | 264 | Risk Ratio (M‐H, Fixed, 99% CI) | 6.17 [0.44, 87.50] |
| 11.2 1200 mg/day | 1 | 172 | Risk Ratio (M‐H, Fixed, 99% CI) | 5.86 [0.37, 92.10] |
| 11.3 1500 mg/day | 1 | 177 | Risk Ratio (M‐H, Fixed, 99% CI) | 6.47 [0.42, 98.79] |
| 12 Depression Show forest plot | 1 | | Risk Ratio (M‐H, Fixed, 99% CI) | Subtotals only |
|
| 12.1 All doses | 1 | 264 | Risk Ratio (M‐H, Fixed, 99% CI) | 0.63 [0.09, 4.40] |
| 12.2 1200 mg/day | 1 | 172 | Risk Ratio (M‐H, Fixed, 99% CI) | 0.98 [0.12, 7.71] |
| 12.3 1500 mg/day | 1 | 177 | Risk Ratio (M‐H, Fixed, 99% CI) | 0.92 [0.12, 7.30] |