Psychosocial interventions to reduce alcohol consumption in concurrent problem alcohol and illicit drug users
Información
- DOI:
- https://doi.org/10.1002/14651858.CD009269.pub3Copiar DOI

- Base de datos:
-
- Cochrane Database of Systematic Reviews
- Versión publicada:
-
- 03 diciembre 2014see what's new
- Tipo:
-
- Intervention
- Etapa:
-
- Review
- Grupo Editorial Cochrane:
-
Grupo Cochrane de Alcohol y drogas
- Copyright:
-
- Copyright © 2014 The Cochrane Collaboration. Published by John Wiley & Sons, Ltd.
Cifras del artículo
Altmetric:
Citado por:
Autores
Contributions of authors
JK: designed and coordinated the review, wrote and re‐drafted the protocol and full review.
HT: double screened titles, abstracts and full texts, carried out double data extraction and commented on draft updates
WC, CAF, CSMOG: contributed to design of the first version of this review and commented on drafts
LGG, JS: provided methodological advice and commented on review drafts
GB, EK, CD: commented on review drafts
Sources of support
Internal sources
-
No sources of support supplied
External sources
-
Cochrane Training Fellowship (No. CTF/2010/9) from Health Research Board, Ireland.
-
PINTA feasibility study (No. HRA_HSR/2012/14) grant from Health Research Board, Ireland.
-
Medical Emergency Responders: Integration and Training (MERIT) grant from Department of Health, Ireland.
Declarations of interest
The authors declare that they have no competing interests.
Acknowledgements
Health Research Board Ireland funded this project. For the first version of our review, Jennifer Collery and Kathryn Smyth from UCD Health sciences library provided extensive support with the search strategy, in conjunction with the support from the GDAG, especially Suzanna Mitrova (records screening) and Silvia Minozzi (quality advice). We thank the following individuals for retrieving full‐text papers: Cendrine Robinson (Uniformed Services University of the Health Sciences, US); Constance M Pollack (The College of Problems on Drug Dependence, US); Jan R Böhnke (University of Trier, Germany); Maria Jakubekova (helped with German translations); Amy Drahota and Marialena Trivela (UK Cochrane Centre) for excellent training in systematic reviews and answering follow‐up questions; and Adeline Nyamathi and Nelson Feldman for providing additional information/data regarding their trials included in our review.
Version history
| Published | Title | Stage | Authors | Version |
| 2018 Dec 05 | Psychosocial interventions to reduce alcohol consumption in concurrent problem alcohol and illicit drug users | Review | Jan Klimas, Christopher Fairgrieve, Helen Tobin, Catherine‐Anne Field, Clodagh SM O'Gorman, Liam G Glynn, Eamon Keenan, Jean Saunders, Gerard Bury, Colum Dunne, Walter Cullen | |
| 2014 Dec 03 | Psychosocial interventions to reduce alcohol consumption in concurrent problem alcohol and illicit drug users | Review | Jan Klimas, Helen Tobin, Catherine‐Anne Field, Clodagh SM O'Gorman, Liam G Glynn, Eamon Keenan, Jean Saunders, Gerard Bury, Colum Dunne, Walter Cullen | |
| 2012 Nov 14 | Psychosocial interventions to reduce alcohol consumption in concurrent problem alcohol and illicit drug users | Review | Jan Klimas, Catherine‐Anne Field, Walter Cullen, Clodagh SM O'Gorman, Liam G Glynn, Eamon Keenan, Jean Saunders, Gerard Bury, Colum Dunne | |
| 2011 Aug 10 | Psychosocial interventions for problem alcohol use in illicit drug users | Protocol | Jan Klimas, Catherine‐Anne Field, Walter Cullen, Clodagh SM O'Gorman, Liam G Glynn, Eamon Keenan, Jean Saunders, Gerard Bury, Colum Dunne | |
Differences between protocol and review
According to the protocol we intended to exclude studies comparing psychosocial with pharmacological treatments. However, we exempted trials with two psychosocial arms in addition to pharmacological arms from this rule in the review. We did not conduct the subgroup/sensitivity analyses planned in the protocol owing to the lack of studies identified. We simplified the wording of the primary and secondary outcome measures from those in the protocol for ease of presentation, as follows:
-
reduction and/or stabilisation of alcohol use = alcohol use or abstinence;
-
illicit drug use outcomes (changes in illicit drug use) = illicit drug use or abstinence.
We have added new references to the Background sections 'Description of the condition' and 'Why is it important to do this review', to reflect recent developments in the field. We reduced the text in the sections 'Experimental interventions' and 'Types of participants' so as to exclude examples. We removed mention of the Newcastle‐Ottawa scale for assessing the quality of non‐randomised studies from the review as it was not used in any of the studies (observational studies were not included in the review).
Keywords
MeSH
Medical Subject Headings (MeSH) Keywords
- Adaptation, Psychological;
- Alcohol Drinking [*prevention & control, psychology];
- Cocaine‐Related Disorders [complications, therapy];
- Hepatitis C [prevention & control];
- Motivational Interviewing [methods];
- Psychotherapy [*methods];
- Psychotherapy, Brief;
- Randomized Controlled Trials as Topic;
- Substance‐Related Disorders [*complications, therapy];
- Temperance;
Medical Subject Headings Check Words
Adult; Humans;
PICO

Study flow diagram from first publication of this review in 2012.

Study flow diagram for a review update: previous studies incorporated into results of new literature search
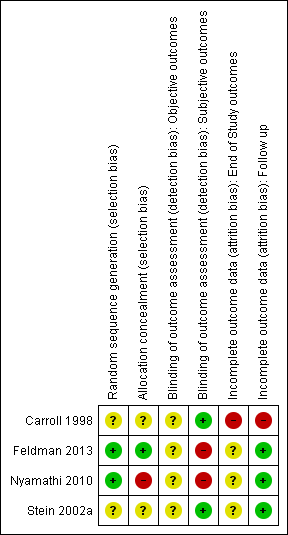
Risk of bias summary: review authors' judgements about each risk of bias item for each included study.
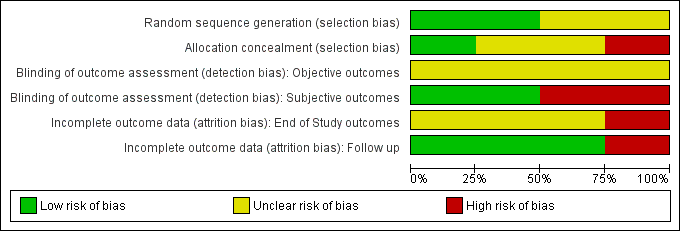
Risk of bias graph: review authors' judgements about each risk of bias item presented as percentages across all included studies.

Comparison 1 Cognitive‐behavioural coping skills training (CBT) versus 12‐step facilitation (TSF), Outcome 1 Continuous outcomes.

Comparison 1 Cognitive‐behavioural coping skills training (CBT) versus 12‐step facilitation (TSF), Outcome 2 Dichotomous outcomes.
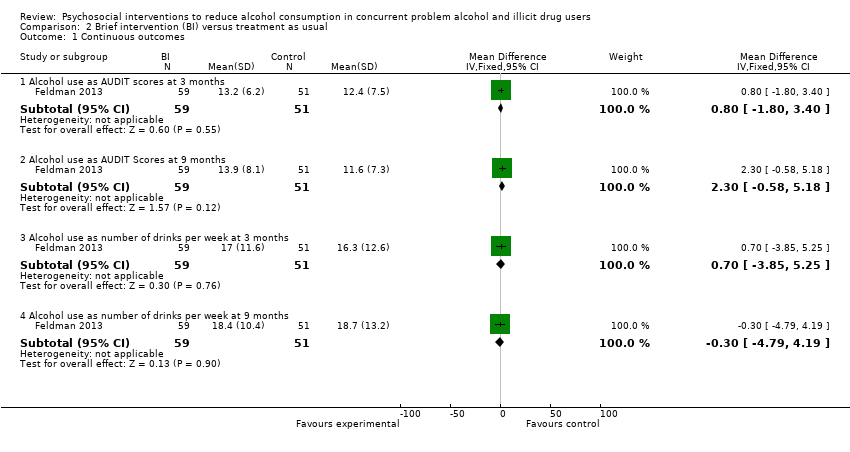
Comparison 2 Brief intervention (BI) versus treatment as usual, Outcome 1 Continuous outcomes.

Comparison 2 Brief intervention (BI) versus treatment as usual, Outcome 2 Dichotomous outcomes.

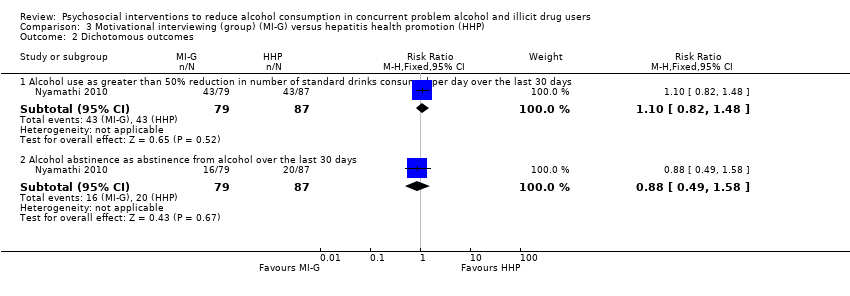
Comparison 3 Motivational interviewing (group) (MI‐G) versus hepatitis health promotion (HHP), Outcome 1 Continuous outcomes.
Comparison 3 Motivational interviewing (group) (MI‐G) versus hepatitis health promotion (HHP), Outcome 2 Dichotomous outcomes.
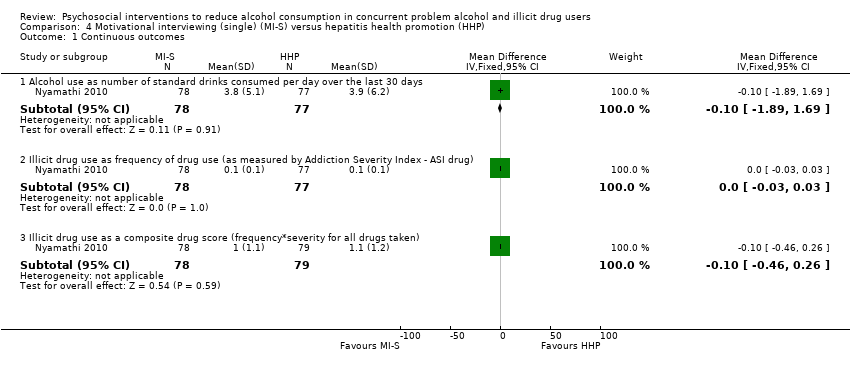
Comparison 4 Motivational interviewing (single) (MI‐S) versus hepatitis health promotion (HHP), Outcome 1 Continuous outcomes.

Comparison 4 Motivational interviewing (single) (MI‐S) versus hepatitis health promotion (HHP), Outcome 2 Dichotomous outcomes.

Comparison 5 Brief motivational intervention (BMI) versus assessment‐only, Outcome 1 Continuous outcomes.

Comparison 5 Brief motivational intervention (BMI) versus assessment‐only, Outcome 2 Dichotomous outcomes.
| Population: participants with alcohol use in concurrent problem alcohol and illicit drug users | ||||||
| Outcomes | Illustrative comparative risks* (95% CI) | Relative effect | No. of participants | Quality of the evidence | Comments | |
| Assumed risk | Corresponding risk | |||||
| Control | CBT versus TSF | |||||
| Maximum number of weeks of consecutive alcohol abstinence during treatment | The mean maximum number of weeks of consecutive alcohol abstinence during treatment in the control groups was | The mean maximum number of weeks of consecutive alcohol abstinence during treatment in the intervention group was | ‐ | 41 | ⊕⊕⊝⊝ | ‐ |
| Maximum number of weeks of consecutive abstinence from cocaine during treatment | The mean maximum number of weeks of consecutive abstinence from cocaine during treatment in the control groups was | The mean maximum number of weeks of consecutive abstinence from cocaine during treatment in the intervention group was | ‐ | 41 | ⊕⊕⊝⊝ | ‐ |
| Number of people achieving 3 or more weeks of consecutive alcohol abstinence during treatment | Study population | RR 1.96 | 41 | ⊕⊕⊝⊝ | ‐ | |
| 111 per 1000 | 218 per 1000 | |||||
| Moderate | ||||||
| 111 per 1000 | 218 per 1000 | |||||
| Alcohol abstinence | Study population | RR 2.38 | 41 | ⊕⊕⊝⊝ | ‐ | |
| 0 per 1000 | 0 per 1000 | |||||
| Moderate | ||||||
| 0 per 1000 | 0 per 1000 | |||||
| *The basis for the assumed risk (e.g. the median control group risk across studies) is provided in footnotes. The corresponding risk (and its 95% CI) is based on the assumed risk in the comparison group and the relative effect of the intervention (and its 95% CI). | ||||||
| GRADE Working Group grades of evidence | ||||||
| 1 Incomplete outcome data | ||||||
| Population: participants with alcohol use in concurrent problem alcohol and illicit drug users | ||||||
| Outcomes | Illustrative comparative risks* (95% CI) | Relative effect | No. of participants | Quality of the evidence | Comments | |
| Assumed risk | Corresponding risk | |||||
| Control | BI versus treatment as usual | |||||
| Number of standard drinks per week | The mean number of standard drinks per week in the control groups was | The mean number of standard drinks per week in the intervention groups was | ‐ | 110 | ⊕⊕⊝⊝ | ‐ |
| Number of standard drinks per week | The mean number of standard drinks per week in the control groups was | The mean number of standard drinks per week in the intervention groups was | ‐ | 110 | ⊕⊕⊝⊝ | ‐ |
| Decreased alcohol use | Study population | RR 1.13 | 110 | ⊕⊕⊝⊝ | ‐ | |
| 314 per 1000 | 355 per 1000 | |||||
| Moderate | ||||||
| 314 per 1000 | 355 per 1000 | |||||
| Decreased alcohol use | Study population | RR 1.34 | 110 | ⊕⊕⊝⊝ | ‐ | |
| 216 per 1000 | 289 per 1000 | |||||
| Moderate | ||||||
| 216 per 1000 | 289 per 1000 | |||||
| *The basis for the assumed risk (e.g. the median control group risk across studies) is provided in footnotes. The corresponding risk (and its 95% CI) is based on the assumed risk in the comparison group and the relative effect of the intervention (and its 95% CI). | ||||||
| GRADE Working Group grades of evidence | ||||||
| 1 Allocation and assessment of outcomes weren't blinded | ||||||
| Population: participants with alcohol use in concurrent problem alcohol and illicit drug users | ||||||
| Outcomes | Illustrative comparative risks* (95% CI) | Relative effect | No. of participants | Quality of the evidence | Comments | |
| Assumed risk | Corresponding risk | |||||
| Control | MI‐G versus HHP | |||||
| Number of standard drinks per day | The mean number of standard drinks per day in the control groups was | The mean number of standard drinks per day in the intervention groups was | ‐ | 147 | ⊕⊕⊝⊝ | ‐ |
| Over 50% less standard drinks per day | Study population | RR 1.1 | 166 | ⊕⊕⊝⊝ | ‐ | |
| 494 per 1000 | 544 per 1000 | |||||
| Moderate | ||||||
| 494 per 1000 | 543 per 1000 | |||||
| Alcohol abstinence | Study population | RR 0.88 | 166 | ⊕⊕⊝⊝ | ‐ | |
| 230 per 1000 | 202 per 1000 | |||||
| Moderate | ||||||
| 230 per 1000 | 202 per 1000 | |||||
| *The basis for the assumed risk (e.g. the median control group risk across studies) is provided in footnotes. The corresponding risk (and its 95% CI) is based on the assumed risk in the comparison group and the relative effect of the intervention (and its 95% CI). | ||||||
| GRADE Working Group grades of evidence | ||||||
| 1 Masking: open label. Allocation and assessment of outcomes weren't blinded | ||||||
| Population: participants with alcohol use in concurrent problem alcohol and illicit drug users | ||||||
| Outcomes | Illustrative comparative risks* (95% CI) | Relative effect | No. of participants | Quality of the evidence | Comments | |
| Assumed risk | Corresponding risk | |||||
| Control | MI‐S versus hepatitis HHP | |||||
| Number of standard drinks consumed per day | The mean number of standard drinks consumed per day in the control groups was | The mean number of standard drinks consumed per day in the intervention groups was | ‐ | 155 | ⊕⊕⊝⊝ | ‐ |
| Over 50% less standard drinks per day | Study population | RR 0.92 | 177 | ⊕⊕⊝⊝ | ‐ | |
| 494 per 1000 | 455 per 1000 | |||||
| Moderate | ||||||
| 494 per 1000 | 454 per 1000 | |||||
| Alcohol abstinence | Study population | RR 0.97 | 177 | ⊕⊕⊝⊝ | ‐ | |
| 230 per 1000 | 223 per 1000 | |||||
| Moderate | ||||||
| 230 per 1000 | 223 per 1000 | |||||
| *The basis for the assumed risk (e.g. the median control group risk across studies) is provided in footnotes. The corresponding risk (and its 95% CI) is based on the assumed risk in the comparison group and the relative effect of the intervention (and its 95% CI). | ||||||
| GRADE Working Group grades of evidence | ||||||
| 1 Masking: open label. Allocation and assessment of outcomes weren't blinded | ||||||
| Population: participants with alcohol use in concurrent problem alcohol and illicit drug users | ||||||
| Outcomes | Illustrative comparative risks* (95% CI) | Relative effect | No. of participants | Quality of the evidence | Comments | |
| Assumed risk | Corresponding risk | |||||
| Control | BMI) versus assessment‐only | |||||
| Number of days with alcohol use at 6 months | The mean number of days with alcohol use at 6 months in the control groups was | The mean number of days with alcohol use at 6 months in the intervention groups was | ‐ | 187 | ⊕⊕⊕⊝ | ‐ |
| 25% reduction of drinking days in the past 30 days | Study population | RR 1.23 | 187 | ⊕⊕⊕⊝ | ‐ | |
| 522 per 1000 | 642 per 1000 | |||||
| Moderate | ||||||
| 522 per 1000 | 642 per 1000 | |||||
| 50% reduction of drinking days in the past 30 days | Study population | RR 1.27 | 187 | ⊕⊕⊕⊝ | ‐ | |
| 457 per 1000 | 580 per 1000 | |||||
| Moderate | ||||||
| 457 per 1000 | 580 per 1000 | |||||
| Seven or more drinking days' reduction in the past 30 days | Study population | RR 1.67 | 187 | ⊕⊕⊕⊝ | ‐ | |
| 239 per 1000 | 399 per 1000 | |||||
| Moderate | ||||||
| 239 per 1000 | 399 per 1000 | |||||
| *The basis for the assumed risk (e.g. the median control group risk across studies) is provided in footnotes. The corresponding risk (and its 95% CI) is based on the assumed risk in the comparison group and the relative effect of the intervention (and its 95% CI). | ||||||
| GRADE Working Group grades of evidence | ||||||
| 1 Sparse data: only 1 study with relatively few participants included in comparison | ||||||
| Outcome or subgroup title | No. of studies | No. of participants | Statistical method | Effect size |
| 1 Continuous outcomes Show forest plot | 1 | Mean Difference (IV, Fixed, 95% CI) | Subtotals only | |
| 1.1 Alcohol abstinence as maximum number of weeks of consecutive alcohol abstinence during treatment | 1 | 41 | Mean Difference (IV, Fixed, 95% CI) | 0.40 [‐1.14, 1.94] |
| 1.2 Illicit drug abstinence as maximum number of weeks of consecutive abstinence from cocaine during treatment | 1 | 41 | Mean Difference (IV, Fixed, 95% CI) | 0.8 [‐0.70, 2.30] |
| 2 Dichotomous outcomes Show forest plot | 1 | Risk Ratio (M‐H, Fixed, 95% CI) | Subtotals only | |
| 2.1 Alcohol abstinence as number achieving 3 or more weeks of consecutive alcohol abstinence during treatment | 1 | 41 | Risk Ratio (M‐H, Fixed, 95% CI) | 1.96 [0.43, 8.94] |
| 2.2 Illicit drug abstinence as number achieving 3 or more weeks of consecutive abstinence from cocaine during treatment | 1 | 41 | Risk Ratio (M‐H, Fixed, 95% CI) | 1.10 [0.42, 2.88] |
| 2.3 Alcohol abstinence during follow‐up year | 1 | 41 | Risk Ratio (M‐H, Fixed, 95% CI) | 2.38 [0.10, 55.06] |
| 2.4 Illicit drug abstinence as abstinence from cocaine during follow‐up year | 1 | 41 | Risk Ratio (M‐H, Fixed, 95% CI) | 0.39 [0.04, 3.98] |
| Outcome or subgroup title | No. of studies | No. of participants | Statistical method | Effect size |
| 1 Continuous outcomes Show forest plot | 1 | Mean Difference (IV, Fixed, 95% CI) | Subtotals only | |
| 1.1 Alcohol use as AUDIT scores at 3 months | 1 | 110 | Mean Difference (IV, Fixed, 95% CI) | 0.80 [‐1.80, 3.40] |
| 1.2 Alcohol use as AUDIT Scores at 9 months | 1 | 110 | Mean Difference (IV, Fixed, 95% CI) | 2.30 [‐0.58, 5.18] |
| 1.3 Alcohol use as number of drinks per week at 3 months | 1 | 110 | Mean Difference (IV, Fixed, 95% CI) | 0.70 [‐3.85, 5.25] |
| 1.4 Alcohol use as number of drinks per week at 9 months | 1 | 110 | Mean Difference (IV, Fixed, 95% CI) | ‐0.30 [‐4.79, 4.19] |
| 2 Dichotomous outcomes Show forest plot | 1 | Risk Ratio (M‐H, Fixed, 95% CI) | Subtotals only | |
| 2.1 Alcohol use as decreased alcohol use at 3 months | 1 | 110 | Risk Ratio (M‐H, Fixed, 95% CI) | 1.13 [0.67, 1.93] |
| 2.2 Alcohol use as decreased alcohol use at 9 months | 1 | 110 | Risk Ratio (M‐H, Fixed, 95% CI) | 1.34 [0.69, 2.58] |
| Outcome or subgroup title | No. of studies | No. of participants | Statistical method | Effect size |
| 1 Continuous outcomes Show forest plot | 1 | Mean Difference (IV, Fixed, 95% CI) | Subtotals only | |
| 1.1 Alcohol use as number of standard drinks consumed per day over the last 30 days | 1 | 147 | Mean Difference (IV, Fixed, 95% CI) | ‐0.40 [‐2.03, 1.23] |
| 1.2 Illicit drug use as frequency of drug use (as measured by Addiction Severity Index ‐ ASI drug) | 1 | 147 | Mean Difference (IV, Fixed, 95% CI) | 0.0 [‐0.03, 0.03] |
| 1.3 Illicit drug use as a composite drug score (frequency*severity for all drugs taken) | 1 | 151 | Mean Difference (IV, Fixed, 95% CI) | 0.0 [‐0.42, 0.42] |
| 2 Dichotomous outcomes Show forest plot | 1 | Risk Ratio (M‐H, Fixed, 95% CI) | Subtotals only | |
| 2.1 Alcohol use as greater than 50% reduction in number of standard drinks consumed per day over the last 30 days | 1 | 166 | Risk Ratio (M‐H, Fixed, 95% CI) | 1.10 [0.82, 1.48] |
| 2.2 Alcohol abstinence as abstinence from alcohol over the last 30 days | 1 | 166 | Risk Ratio (M‐H, Fixed, 95% CI) | 0.88 [0.49, 1.58] |
| Outcome or subgroup title | No. of studies | No. of participants | Statistical method | Effect size |
| 1 Continuous outcomes Show forest plot | 1 | Mean Difference (IV, Fixed, 95% CI) | Subtotals only | |
| 1.1 Alcohol use as number of standard drinks consumed per day over the last 30 days | 1 | 155 | Mean Difference (IV, Fixed, 95% CI) | ‐0.10 [‐1.89, 1.69] |
| 1.2 Illicit drug use as frequency of drug use (as measured by Addiction Severity Index ‐ ASI drug) | 1 | 155 | Mean Difference (IV, Fixed, 95% CI) | 0.0 [‐0.03, 0.03] |
| 1.3 Illicit drug use as a composite drug score (frequency*severity for all drugs taken) | 1 | 157 | Mean Difference (IV, Fixed, 95% CI) | ‐0.10 [‐0.46, 0.26] |
| 2 Dichotomous outcomes Show forest plot | 1 | Risk Ratio (M‐H, Fixed, 95% CI) | Subtotals only | |
| 2.1 Alcohol use as greater than 50% reduction in number of standard drinks consumed per day over the last 30 days | 1 | 177 | Risk Ratio (M‐H, Fixed, 95% CI) | 0.92 [0.68, 1.26] |
| 2.2 Alcohol abstinence as abstinence from alcohol over the last 30 days | 1 | 177 | Risk Ratio (M‐H, Fixed, 95% CI) | 0.97 [0.56, 1.67] |
| Outcome or subgroup title | No. of studies | No. of participants | Statistical method | Effect size |
| 1 Continuous outcomes Show forest plot | 1 | Mean Difference (IV, Fixed, 95% CI) | Subtotals only | |
| 1.1 Alcohol use as number of days in the past 30 days with alcohol use at 1 month | 1 | 187 | Mean Difference (IV, Fixed, 95% CI) | ‐0.30 [‐3.38, 2.78] |
| 1.2 Alcohol use as number of days in the past 30 days with alcohol use at 6 months | 1 | 187 | Mean Difference (IV, Fixed, 95% CI) | ‐1.5 [‐4.56, 1.56] |
| 2 Dichotomous outcomes Show forest plot | 1 | Risk Ratio (M‐H, Fixed, 95% CI) | Subtotals only | |
| 2.1 Alcohol use as 25% reduction of drinking days in the past 30 days | 1 | 187 | Risk Ratio (M‐H, Fixed, 95% CI) | 1.23 [0.96, 1.57] |
| 2.2 Alcohol use as 50% reduction of drinking days in the past 30 days | 1 | 187 | Risk Ratio (M‐H, Fixed, 95% CI) | 1.27 [0.96, 1.68] |
| 2.3 Alcohol use as 75% reduction of drinking days in the past 30 days | 1 | 187 | Risk Ratio (M‐H, Fixed, 95% CI) | 1.21 [0.84, 1.75] |
| 2.4 Alcohol use as 1 or more drinking days' reduction in the past 30 days | 1 | 187 | Risk Ratio (M‐H, Fixed, 95% CI) | 1.12 [0.91, 1.38] |
| 2.5 Alcohol use as 7 or more drinking days' reduction in the past 30 days | 1 | 187 | Risk Ratio (M‐H, Fixed, 95% CI) | 1.67 [1.08, 2.60] |