Scolaris Content Display Scolaris Content Display

Study flow diagram from first publication of this review in 2012.
Figuras y tablas -
Figure 1

Study flow diagram from first publication of this review in 2012.

Study flow diagram for a review update: previous studies incorporated into results of new literature search
Figuras y tablas -
Figure 2

Study flow diagram for a review update: previous studies incorporated into results of new literature search

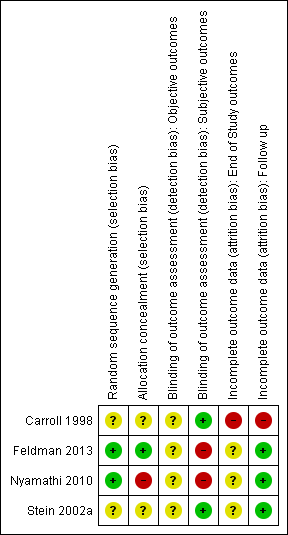
Risk of bias summary: review authors' judgements about each risk of bias item for each included study.
Figuras y tablas -
Figure 3

Risk of bias summary: review authors' judgements about each risk of bias item for each included study.

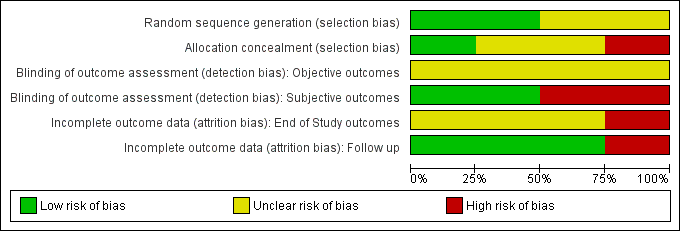
Risk of bias graph: review authors' judgements about each risk of bias item presented as percentages across all included studies.
Figuras y tablas -
Figure 4

Risk of bias graph: review authors' judgements about each risk of bias item presented as percentages across all included studies.

Comparison 1 Cognitive‐behavioural coping skills training (CBT) versus 12‐step facilitation (TSF), Outcome 1 Continuous outcomes.
Figuras y tablas -
Analysis 1.1

Comparison 1 Cognitive‐behavioural coping skills training (CBT) versus 12‐step facilitation (TSF), Outcome 1 Continuous outcomes.

Comparison 1 Cognitive‐behavioural coping skills training (CBT) versus 12‐step facilitation (TSF), Outcome 2 Dichotomous outcomes.
Figuras y tablas -
Analysis 1.2

Comparison 1 Cognitive‐behavioural coping skills training (CBT) versus 12‐step facilitation (TSF), Outcome 2 Dichotomous outcomes.

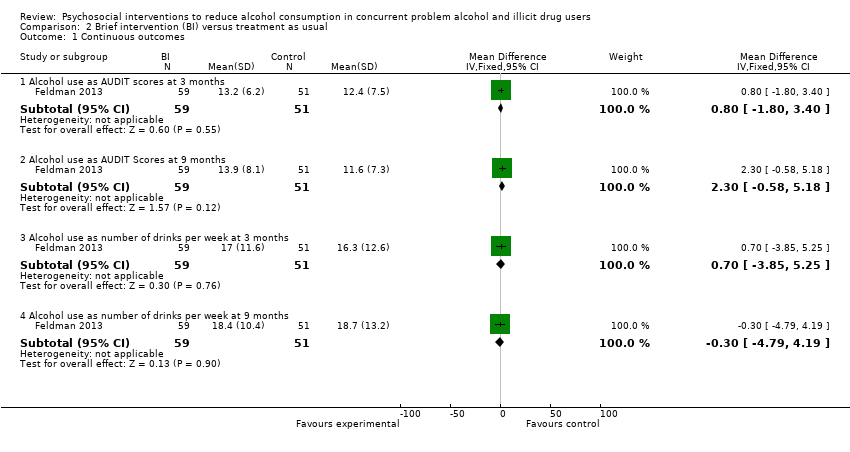
Comparison 2 Brief intervention (BI) versus treatment as usual, Outcome 1 Continuous outcomes.
Figuras y tablas -
Analysis 2.1

Comparison 2 Brief intervention (BI) versus treatment as usual, Outcome 1 Continuous outcomes.

Comparison 2 Brief intervention (BI) versus treatment as usual, Outcome 2 Dichotomous outcomes.
Figuras y tablas -
Analysis 2.2

Comparison 2 Brief intervention (BI) versus treatment as usual, Outcome 2 Dichotomous outcomes.

Comparison 3 Motivational interviewing (group) (MI‐G) versus hepatitis health promotion (HHP), Outcome 1 Continuous outcomes.
Figuras y tablas -
Analysis 3.1

Comparison 3 Motivational interviewing (group) (MI‐G) versus hepatitis health promotion (HHP), Outcome 1 Continuous outcomes.

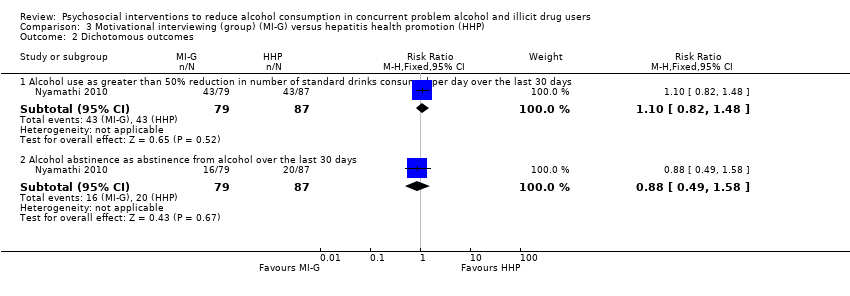
Comparison 3 Motivational interviewing (group) (MI‐G) versus hepatitis health promotion (HHP), Outcome 2 Dichotomous outcomes.
Figuras y tablas -
Analysis 3.2

Comparison 3 Motivational interviewing (group) (MI‐G) versus hepatitis health promotion (HHP), Outcome 2 Dichotomous outcomes.

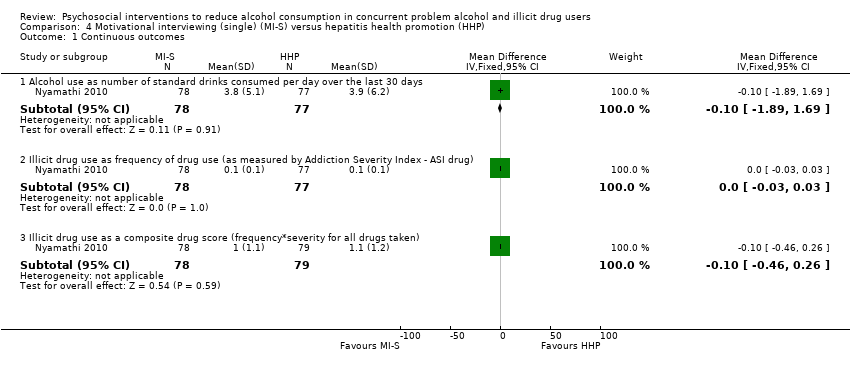
Comparison 4 Motivational interviewing (single) (MI‐S) versus hepatitis health promotion (HHP), Outcome 1 Continuous outcomes.
Figuras y tablas -
Analysis 4.1

Comparison 4 Motivational interviewing (single) (MI‐S) versus hepatitis health promotion (HHP), Outcome 1 Continuous outcomes.

Comparison 4 Motivational interviewing (single) (MI‐S) versus hepatitis health promotion (HHP), Outcome 2 Dichotomous outcomes.
Figuras y tablas -
Analysis 4.2

Comparison 4 Motivational interviewing (single) (MI‐S) versus hepatitis health promotion (HHP), Outcome 2 Dichotomous outcomes.

Comparison 5 Brief motivational intervention (BMI) versus assessment‐only, Outcome 1 Continuous outcomes.
Figuras y tablas -
Analysis 5.1

Comparison 5 Brief motivational intervention (BMI) versus assessment‐only, Outcome 1 Continuous outcomes.

Comparison 5 Brief motivational intervention (BMI) versus assessment‐only, Outcome 2 Dichotomous outcomes.
Figuras y tablas -
Analysis 5.2

Comparison 5 Brief motivational intervention (BMI) versus assessment‐only, Outcome 2 Dichotomous outcomes.

Summary of findings for the main comparison. Cognitive‐behavioural coping skills training (CBT) versus 12‐step facilitation (TSF) for alcohol use in concurrent problem alcohol and illicit drug users

Population: participants with alcohol use in concurrent problem alcohol and illicit drug users
Settings: substance abuse treatment centre
Intervention: CBT versus TSF

Outcomes

Illustrative comparative risks* (95% CI)

Relative effect
(95% CI)

No. of participants
(studies)

Quality of the evidence
(GRADE)

Comments

Assumed risk

Corresponding risk

Control

CBT versus TSF

Maximum number of weeks of consecutive alcohol abstinence during treatment
Substance abuse calendar and breathalyser. Scale from: 0 to 12.
Follow up: 12 weeks

The mean maximum number of weeks of consecutive alcohol abstinence during treatment in the control groups was
1.8 weeks

The mean maximum number of weeks of consecutive alcohol abstinence during treatment in the intervention group was
0.4 higher
(1.14 lower to 1.94 higher)

41
(1 study)

⊕⊕⊝⊝
low1,2

Maximum number of weeks of consecutive abstinence from cocaine during treatment
Substance abuse calendar and urinalysis. Scale from: 0 to 12.
Follow up: 12 weeks

The mean maximum number of weeks of consecutive abstinence from cocaine during treatment in the control groups was
1.3 weeks

The mean maximum number of weeks of consecutive abstinence from cocaine during treatment in the intervention group was
0.8 higher
(0.7 lower to 2.3 higher)

41
(1 study)

⊕⊕⊝⊝
low1,2

Number of people achieving 3 or more weeks of consecutive alcohol abstinence during treatment
Substance abuse calendar and breathalyser
Follow up: 12 weeks

Study population

RR 1.96
(0.43 to 8.94)

41
(1 study)

⊕⊕⊝⊝
low1,2

111 per 1000

218 per 1000
(48 to 993)

Moderate

111 per 1000

218 per 1000
(48 to 992)

Alcohol abstinence
Substance abuse calendar and breathalyser
Follow up: 1 year

Study population

RR 2.38
(0.1 to 55.06)

41
(1 study)

⊕⊕⊝⊝
low1,2

0 per 1000

0 per 1000
(0 to 0)

Moderate

0 per 1000

0 per 1000
(0 to 0)

*The basis for the assumed risk (e.g. the median control group risk across studies) is provided in footnotes. The corresponding risk (and its 95% CI) is based on the assumed risk in the comparison group and the relative effect of the intervention (and its 95% CI).
CI: Confidence interval; RR: Risk ratio;

GRADE Working Group grades of evidence
High quality: Further research is very unlikely to change our confidence in the estimate of effect.
Moderate quality: Further research is likely to have an important impact on our confidence in the estimate of effect and may change the estimate.
Low quality: Further research is very likely to have an important impact on our confidence in the estimate of effect and is likely to change the estimate.
Very low quality: We are very uncertain about the estimate.

1 Incomplete outcome data
2 Sparse data: only 1 study with relatively few participants included in comparison

Figuras y tablas -
Summary of findings for the main comparison. Cognitive‐behavioural coping skills training (CBT) versus 12‐step facilitation (TSF) for alcohol use in concurrent problem alcohol and illicit drug users
Summary of findings 2. Brief intervention (BI) versus treatment as usual for alcohol use in concurrent problem alcohol and illicit drug users

Population: participants with alcohol use in concurrent problem alcohol and illicit drug users
Settings:
Intervention: BI versus treatment as usual

Outcomes

Illustrative comparative risks* (95% CI)

Relative effect
(95% CI)

No. of participants
(studies)

Quality of the evidence
(GRADE)

Comments

Assumed risk

Corresponding risk

Control

BI versus treatment as usual

Number of standard drinks per week
unreported
Follow up: 3 months

The mean number of standard drinks per week in the control groups was
16.3 standard drinks

The mean number of standard drinks per week in the intervention groups was
0.7 higher
(3.85 lower to 5.25 higher)

110
(1 study)

⊕⊕⊝⊝
low1,2

Number of standard drinks per week
unreported
Follow up: 9 months

The mean number of standard drinks per week in the control groups was
18.7 standard drinks

The mean number of standard drinks per week in the intervention groups was
0.3 lower
(4.79 lower to 4.19 higher)

110
(1 study)

⊕⊕⊝⊝
low1,2

Decreased alcohol use
1st question from the Alcohol Use Disorders Identification Test: How often do you have a drink containing alcohol?
Follow up: 3 months

Study population

RR 1.13
(0.67 to 1.93)

110
(1 study)

⊕⊕⊝⊝
low1,2

314 per 1000

355 per 1000
(210 to 605)

Moderate

314 per 1000

355 per 1000
(210 to 606)

Decreased alcohol use
1st question from the Alcohol Use Disorders Identification Test: How often do you have a drink containing alcohol?
Follow up: 9 months

Study population

RR 1.34
(0.69 to 2.58)

110
(1 study)

⊕⊕⊝⊝
low1,2

216 per 1000

289 per 1000
(149 to 556)

Moderate

216 per 1000

289 per 1000
(149 to 557)

*The basis for the assumed risk (e.g. the median control group risk across studies) is provided in footnotes. The corresponding risk (and its 95% CI) is based on the assumed risk in the comparison group and the relative effect of the intervention (and its 95% CI).
CI: Confidence interval; RR: Risk ratio;

GRADE Working Group grades of evidence
High quality: Further research is very unlikely to change our confidence in the estimate of effect.
Moderate quality: Further research is likely to have an important impact on our confidence in the estimate of effect and may change the estimate.
Low quality: Further research is very likely to have an important impact on our confidence in the estimate of effect and is likely to change the estimate.
Very low quality: We are very uncertain about the estimate.

1 Allocation and assessment of outcomes weren't blinded
2 Sparse data: only 1 study with relatively few participants included in comparison

Figuras y tablas -
Summary of findings 2. Brief intervention (BI) versus treatment as usual for alcohol use in concurrent problem alcohol and illicit drug users
Summary of findings 3. Motivational interviewing (group) (MI‐G) versus hepatitis health promotion (HHP) for alcohol use in concurrent problem alcohol and illicit drug users

Population: participants with alcohol use in concurrent problem alcohol and illicit drug users
Settings: methadone outpatient clinics
Intervention: MI‐G versus HHP

Outcomes

Illustrative comparative risks* (95% CI)

Relative effect
(95% CI)

No. of participants
(studies)

Quality of the evidence
(GRADE)

Comments

Assumed risk

Corresponding risk

Control

MI‐G versus HHP

Number of standard drinks per day
counts
Follow up: 6 months

The mean number of standard drinks per day in the control groups was
3.9 standard drinks

The mean number of standard drinks per day in the intervention groups was
0.4 lower
(2.03 lower to 1.23 higher)

147
(1 study)

⊕⊕⊝⊝
low1,2

Over 50% less standard drinks per day
Timeline follow back
Follow up: 6 months

Study population

RR 1.1
(0.82 to 1.48)

166
(1 study)

⊕⊕⊝⊝
low1,2

494 per 1000

544 per 1000
(405 to 731)

Moderate

494 per 1000

543 per 1000
(405 to 731)

Alcohol abstinence
Timeline follow back
Follow up: 6 months

Study population

RR 0.88
(0.49 to 1.58)

166
(1 study)

⊕⊕⊝⊝
low1,2

230 per 1000

202 per 1000
(113 to 363)

Moderate

230 per 1000

202 per 1000
(113 to 363)

*The basis for the assumed risk (e.g. the median control group risk across studies) is provided in footnotes. The corresponding risk (and its 95% CI) is based on the assumed risk in the comparison group and the relative effect of the intervention (and its 95% CI).
CI: Confidence interval; RR: Risk ratio;

GRADE Working Group grades of evidence
High quality: Further research is very unlikely to change our confidence in the estimate of effect.
Moderate quality: Further research is likely to have an important impact on our confidence in the estimate of effect and may change the estimate.
Low quality: Further research is very likely to have an important impact on our confidence in the estimate of effect and is likely to change the estimate.
Very low quality: We are very uncertain about the estimate.

1 Masking: open label. Allocation and assessment of outcomes weren't blinded
2 Sparse data: only 1 study with relatively few participants included in comparison

Figuras y tablas -
Summary of findings 3. Motivational interviewing (group) (MI‐G) versus hepatitis health promotion (HHP) for alcohol use in concurrent problem alcohol and illicit drug users
Summary of findings 4. Motivational interviewing (single) (MI‐S) versus hepatitis health promotion (HHP) for alcohol use in concurrent problem alcohol and illicit drug users

Population: participants with alcohol use in concurrent problem alcohol and illicit drug users
Settings:
Intervention: MI‐S versus HHP

Outcomes

Illustrative comparative risks* (95% CI)

Relative effect
(95% CI)

No. of participants
(studies)

Quality of the evidence
(GRADE)

Comments

Assumed risk

Corresponding risk

Control

MI‐S versus hepatitis HHP

Number of standard drinks consumed per day
counts
Follow up: 6 months

The mean number of standard drinks consumed per day in the control groups was
3.9 standard drinks

The mean number of standard drinks consumed per day in the intervention groups was
0.1 lower
(1.89 lower to 1.69 higher)

155
(1 study)

⊕⊕⊝⊝
low1,2

Over 50% less standard drinks per day
Timeline follow back
Follow up: 6 months

Study population

RR 0.92
(0.68 to 1.26)

177
(1 study)

⊕⊕⊝⊝
low1,2

494 per 1000

455 per 1000
(336 to 623)

Moderate

494 per 1000

454 per 1000
(336 to 622)

Alcohol abstinence
Timeline follow back
Follow‐up: 6 months

Study population

RR 0.97
(0.56 to 1.67)

177
(1 study)

⊕⊕⊝⊝
low1,2

230 per 1000

223 per 1000
(129 to 384)

Moderate

230 per 1000

223 per 1000
(129 to 384)

*The basis for the assumed risk (e.g. the median control group risk across studies) is provided in footnotes. The corresponding risk (and its 95% CI) is based on the assumed risk in the comparison group and the relative effect of the intervention (and its 95% CI).
CI: Confidence interval; RR: Risk ratio;

GRADE Working Group grades of evidence
High quality: Further research is very unlikely to change our confidence in the estimate of effect.
Moderate quality: Further research is likely to have an important impact on our confidence in the estimate of effect and may change the estimate.
Low quality: Further research is very likely to have an important impact on our confidence in the estimate of effect and is likely to change the estimate.
Very low quality: We are very uncertain about the estimate.

1 Masking: open label. Allocation and assessment of outcomes weren't blinded
2 Sparse data: only 1 study with relatively few participants included in comparison

Figuras y tablas -
Summary of findings 4. Motivational interviewing (single) (MI‐S) versus hepatitis health promotion (HHP) for alcohol use in concurrent problem alcohol and illicit drug users
Summary of findings 5. Brief motivational intervention (BMI) versus assessment‐only for alcohol use in concurrent problem alcohol and illicit drug users

Population: participants with alcohol use in concurrent problem alcohol and illicit drug users
Settings: addiction clinic
Intervention: BMI versus assessment‐only

Outcomes

Illustrative comparative risks* (95% CI)

Relative effect
(95% CI)

No. of participants
(studies)

Quality of the evidence
(GRADE)

Comments

Assumed risk

Corresponding risk

Control

BMI) versus assessment‐only

Number of days with alcohol use at 6 months
Timeline follow back. Scale from: 0 to 31.
Follow up: 6 months

The mean number of days with alcohol use at 6 months in the control groups was
9.1 days

The mean number of days with alcohol use at 6 months in the intervention groups was
1.5 lower
(4.56 lower to 1.56 higher)

187
(1 study)

⊕⊕⊕⊝
moderate1

25% reduction of drinking days in the past 30 days
Timeline follow back
Follow up: 6 months

Study population

RR 1.23
(0.96 to 1.57)

187
(1 study)

⊕⊕⊕⊝
moderate1

522 per 1000

642 per 1000
(501 to 819)

Moderate

522 per 1000

642 per 1000
(501 to 820)

50% reduction of drinking days in the past 30 days
Timeline follow back
Follow up: 6 months

Study population

RR 1.27
(0.96 to 1.68)

187
(1 study)

⊕⊕⊕⊝
moderate1

457 per 1000

580 per 1000
(438 to 767)

Moderate

457 per 1000

580 per 1000
(439 to 768)

Seven or more drinking days' reduction in the past 30 days
Timeline follow back
Follow up: 6 months

Study population

RR 1.67
(1.08 to 2.6)

187
(1 study)

⊕⊕⊕⊝
moderate1

239 per 1000

399 per 1000
(258 to 622)

Moderate

239 per 1000

399 per 1000
(258 to 621)

*The basis for the assumed risk (e.g. the median control group risk across studies) is provided in footnotes. The corresponding risk (and its 95% CI) is based on the assumed risk in the comparison group and the relative effect of the intervention (and its 95% CI).
CI: Confidence interval; RR: Risk ratio;

GRADE Working Group grades of evidence
High quality: Further research is very unlikely to change our confidence in the estimate of effect.
Moderate quality: Further research is likely to have an important impact on our confidence in the estimate of effect and may change the estimate.
Low quality: Further research is very likely to have an important impact on our confidence in the estimate of effect and is likely to change the estimate.
Very low quality: We are very uncertain about the estimate.

1 Sparse data: only 1 study with relatively few participants included in comparison

Figuras y tablas -
Summary of findings 5. Brief motivational intervention (BMI) versus assessment‐only for alcohol use in concurrent problem alcohol and illicit drug users
Comparison 1. Cognitive‐behavioural coping skills training (CBT) versus 12‐step facilitation (TSF)

Outcome or subgroup title

No. of studies

No. of participants

Statistical method

Effect size

1 Continuous outcomes Show forest plot

1

Mean Difference (IV, Fixed, 95% CI)

Subtotals only

1.1 Alcohol abstinence as maximum number of weeks of consecutive alcohol abstinence during treatment

1

41

Mean Difference (IV, Fixed, 95% CI)

0.40 [‐1.14, 1.94]

1.2 Illicit drug abstinence as maximum number of weeks of consecutive abstinence from cocaine during treatment

1

41

Mean Difference (IV, Fixed, 95% CI)

0.8 [‐0.70, 2.30]

2 Dichotomous outcomes Show forest plot

1

Risk Ratio (M‐H, Fixed, 95% CI)

Subtotals only

2.1 Alcohol abstinence as number achieving 3 or more weeks of consecutive alcohol abstinence during treatment

1

41

Risk Ratio (M‐H, Fixed, 95% CI)

1.96 [0.43, 8.94]

2.2 Illicit drug abstinence as number achieving 3 or more weeks of consecutive abstinence from cocaine during treatment

1

41

Risk Ratio (M‐H, Fixed, 95% CI)

1.10 [0.42, 2.88]

2.3 Alcohol abstinence during follow‐up year

1

41

Risk Ratio (M‐H, Fixed, 95% CI)

2.38 [0.10, 55.06]

2.4 Illicit drug abstinence as abstinence from cocaine during follow‐up year

1

41

Risk Ratio (M‐H, Fixed, 95% CI)

0.39 [0.04, 3.98]

Figuras y tablas -
Comparison 1. Cognitive‐behavioural coping skills training (CBT) versus 12‐step facilitation (TSF)
Comparison 2. Brief intervention (BI) versus treatment as usual

Outcome or subgroup title

No. of studies

No. of participants

Statistical method

Effect size

1 Continuous outcomes Show forest plot

1

Mean Difference (IV, Fixed, 95% CI)

Subtotals only

1.1 Alcohol use as AUDIT scores at 3 months

1

110

Mean Difference (IV, Fixed, 95% CI)

0.80 [‐1.80, 3.40]

1.2 Alcohol use as AUDIT Scores at 9 months

1

110

Mean Difference (IV, Fixed, 95% CI)

2.30 [‐0.58, 5.18]

1.3 Alcohol use as number of drinks per week at 3 months

1

110

Mean Difference (IV, Fixed, 95% CI)

0.70 [‐3.85, 5.25]

1.4 Alcohol use as number of drinks per week at 9 months

1

110

Mean Difference (IV, Fixed, 95% CI)

‐0.30 [‐4.79, 4.19]

2 Dichotomous outcomes Show forest plot

1

Risk Ratio (M‐H, Fixed, 95% CI)

Subtotals only

2.1 Alcohol use as decreased alcohol use at 3 months

1

110

Risk Ratio (M‐H, Fixed, 95% CI)

1.13 [0.67, 1.93]

2.2 Alcohol use as decreased alcohol use at 9 months

1

110

Risk Ratio (M‐H, Fixed, 95% CI)

1.34 [0.69, 2.58]

Figuras y tablas -
Comparison 2. Brief intervention (BI) versus treatment as usual
Comparison 3. Motivational interviewing (group) (MI‐G) versus hepatitis health promotion (HHP)

Outcome or subgroup title

No. of studies

No. of participants

Statistical method

Effect size

1 Continuous outcomes Show forest plot

1

Mean Difference (IV, Fixed, 95% CI)

Subtotals only

1.1 Alcohol use as number of standard drinks consumed per day over the last 30 days 

1

147

Mean Difference (IV, Fixed, 95% CI)

‐0.40 [‐2.03, 1.23]

1.2 Illicit drug use as frequency of drug use (as measured by Addiction Severity Index ‐ ASI drug)

1

147

Mean Difference (IV, Fixed, 95% CI)

0.0 [‐0.03, 0.03]

1.3 Illicit drug use as a composite drug score (frequency*severity for all drugs taken)

1

151

Mean Difference (IV, Fixed, 95% CI)

0.0 [‐0.42, 0.42]

2 Dichotomous outcomes Show forest plot

1

Risk Ratio (M‐H, Fixed, 95% CI)

Subtotals only

2.1 Alcohol use as greater than 50% reduction in number of standard drinks consumed per day over the last 30 days

1

166

Risk Ratio (M‐H, Fixed, 95% CI)

1.10 [0.82, 1.48]

2.2 Alcohol abstinence as abstinence from alcohol over the last 30 days

1

166

Risk Ratio (M‐H, Fixed, 95% CI)

0.88 [0.49, 1.58]

Figuras y tablas -
Comparison 3. Motivational interviewing (group) (MI‐G) versus hepatitis health promotion (HHP)
Comparison 4. Motivational interviewing (single) (MI‐S) versus hepatitis health promotion (HHP)

Outcome or subgroup title

No. of studies

No. of participants

Statistical method

Effect size

1 Continuous outcomes Show forest plot

1

Mean Difference (IV, Fixed, 95% CI)

Subtotals only

1.1 Alcohol use as number of standard drinks consumed per day over the last 30 days 

1

155

Mean Difference (IV, Fixed, 95% CI)

‐0.10 [‐1.89, 1.69]

1.2 Illicit drug use as frequency of drug use (as measured by Addiction Severity Index ‐ ASI drug)

1

155

Mean Difference (IV, Fixed, 95% CI)

0.0 [‐0.03, 0.03]

1.3 Illicit drug use as a composite drug score (frequency*severity for all drugs taken)

1

157

Mean Difference (IV, Fixed, 95% CI)

‐0.10 [‐0.46, 0.26]

2 Dichotomous outcomes Show forest plot

1

Risk Ratio (M‐H, Fixed, 95% CI)

Subtotals only

2.1 Alcohol use as greater than 50% reduction in number of standard drinks consumed per day over the last 30 days

1

177

Risk Ratio (M‐H, Fixed, 95% CI)

0.92 [0.68, 1.26]

2.2 Alcohol abstinence as abstinence from alcohol over the last 30 days

1

177

Risk Ratio (M‐H, Fixed, 95% CI)

0.97 [0.56, 1.67]

Figuras y tablas -
Comparison 4. Motivational interviewing (single) (MI‐S) versus hepatitis health promotion (HHP)
Comparison 5. Brief motivational intervention (BMI) versus assessment‐only

Outcome or subgroup title

No. of studies

No. of participants

Statistical method

Effect size

1 Continuous outcomes Show forest plot

1

Mean Difference (IV, Fixed, 95% CI)

Subtotals only

1.1 Alcohol use as number of days in the past 30 days with alcohol use at 1 month

1

187

Mean Difference (IV, Fixed, 95% CI)

‐0.30 [‐3.38, 2.78]

1.2 Alcohol use as number of days in the past 30 days with alcohol use at 6 months

1

187

Mean Difference (IV, Fixed, 95% CI)

‐1.5 [‐4.56, 1.56]

2 Dichotomous outcomes Show forest plot

1

Risk Ratio (M‐H, Fixed, 95% CI)

Subtotals only

2.1 Alcohol use as 25% reduction of drinking days in the past 30 days

1

187

Risk Ratio (M‐H, Fixed, 95% CI)

1.23 [0.96, 1.57]

2.2 Alcohol use as 50% reduction of drinking days in the past 30 days

1

187

Risk Ratio (M‐H, Fixed, 95% CI)

1.27 [0.96, 1.68]

2.3 Alcohol use as 75% reduction of drinking days in the past 30 days

1

187

Risk Ratio (M‐H, Fixed, 95% CI)

1.21 [0.84, 1.75]

2.4 Alcohol use as 1 or more drinking days' reduction in the past 30 days

1

187

Risk Ratio (M‐H, Fixed, 95% CI)

1.12 [0.91, 1.38]

2.5 Alcohol use as 7 or more drinking days' reduction in the past 30 days

1

187

Risk Ratio (M‐H, Fixed, 95% CI)

1.67 [1.08, 2.60]

Figuras y tablas -
Comparison 5. Brief motivational intervention (BMI) versus assessment‐only