氯巴占单药治疗局灶性或全面性癫痫发作
摘要
研究背景
本综述是原先发表于2014年第10期的Cochrane系统综述的更新版。需要扩大可供临床医生使用的单一疗法选择,以治疗新的局灶性或全面性癫痫发作。对氯巴占单药治疗的Cochrane系统综述将有望确定其在治疗新发或未经治疗的癫痫发作中的地位,并突出证据的空白。
研究目的
评价氯巴占单药治疗新发局灶性或全面性癫痫患者的疗效、有效性、耐受性和安全性。
检索策略
对于最近的更新,我们在2018年3月19日检索了以下数据库:Cochrane研究注册库(CRS Web),其中包括Cochrane癫痫组专业注册库(Cochrane Epilepsy Group Specialized Register)和Cochrane对照试验中心注册库(Cochrane Central Register of Controlled Trials, CENTRAL),MEDLINE(Ovid,始自1946年)、BIOSIS Previews(始自1969年)、美国临床试验注册平台(ClinicalTrials.gov)和世界卫生组织国际临床试验注册平台(World Health Organization International Clinical Trials Registry Platform, ICTRP)。检索没有语言限制。
纳入排除标准
比较了氯巴占单药治疗与安慰剂或其他抗癫痫药物治疗有两次或多次无端癫痫发作或需要短期连续抗癫痫药物治疗的单次急性症状性癫痫发作的患者的随机或半随机对照试验,符合纳入标准。
资料收集与分析
主要结局指标是分配治疗的时间(保留时间),反映疗效和耐受性。次要结局指标包括短期和长期有效性、耐受性、生活质量和耐受性。两位综述作者独立提取资料。
主要结果
我们确定了三项符合综述标准的试验,这些试验纳入了206名受试者。已确定的研究均未报告预先选择的主要结局指标。无法进行meta分析。由于存在偏倚风险,在两项研究中缺乏关于分配方案隐藏的细节以及实施和检测偏倚的高风险,促使我们由于存在偏倚风险而降低了我们某些结果的证据质量。(通过使用GRADE方法)。
关于12个月的保留时间,我们没有发现氯巴占和卡马西平之间存在统计学显著差异的证据(风险比(risk ratio, RR)=0.83,95%置信区间(confidence interval, CI) [0.61, 1.12];低质量证据)。有低质量证据表明,与苯妥英相比,氯巴占的保留效果更好(RR=1.43,95%CI [1.08, 1.90])。我们无法确定与苯妥英钠相比,接受氯巴占治疗的受试者是否因不良反应而停药的可能性较小(RR=0.10,95%CI [0.01, 1.65],低质量证据)。
作者结论
我们在一项单独的临床试验中发现,氯巴占在未接受药物治疗的儿童中保留12个月时与卡马西平相比没有优势,而在患有神经囊尾蚴病的青少年和成人中,氯巴占在保留6个月时略优于苯妥英。目前,现有证据不足以为临床实践提供信息。
PICO
简语概要
氯巴占单药治疗局灶性或全面性癫痫发作
系统综述问题
我们评价了氯巴占单药治疗新发或未经治疗的局灶性或全面性癫痫发作的证据。
系统综述背景
癫痫的特征是大脑有异常的癫痫发作倾向,这是异常神经元电活动的离散发作。癫痫发作可能同时来自大脑的特定部分(局灶性癫痫发作)或整个大脑(全面性癫痫发作)。在本综述中,我们评价了氯巴占作为新发或未经治疗的局灶性或全面性癫痫发作的单一疗法(单一药物治疗)。
研究特征
我们的检索确定了三项低质量研究,这些研究比较了氯巴占与卡马西平和苯妥英单药治疗癫痫发作。他们纳入了一项比较了氯巴占和卡马西平单药治疗115名未经治疗的癫痫儿童的疗效的多中心研究;一项在48名患有神经囊尾蚴病的青少年和成人中比较氯巴占和苯妥英的单中心研究;一项比较了氯巴占和卡马西平单药治疗43名患有中央颞叶尖峰(BCECTS)的儿童良性癫痫的单中心研究。在抗癫痫药物的临床试验中,有效性通常通过一个人继续接受分配治疗的时间来衡量,这反映了如果药物无效或出现不可接受的副作用,该人将停止服药。
主要研究结果
在12个月的保留期中,在以前未经治疗的局灶性或全面性癫痫发作的患者中,氯巴占与卡马西平相比无明显优势。在一项研究中注意到氯巴占在6个月的保留时间比苯妥英稍有优势,该研究仅限于因神经囊尾蚴病而癫痫发作的受试者。在4周内,4至40周以及在氯巴占和卡马西平治疗的最后9个月中实现无癫痫发作的BCECTS受试者的比例没有显著差异。此外,在服用氯巴占与卡马西平的4周内,癫痫发作减少50%或更多的受试者比例没有显著差异。然而,随机分配到氯巴占组的受试者比使用卡马西平组的受试者更快地控制了癫痫发作。
没有一项研究评价了受试者在分配治疗中停留的时间(保留时间)或生活质量。我们确实评价了研究中关于在特定时间点继续接受治疗的受试者人数的数据。然而,由于该研究的受试者人数较少,我们无法确定接受氯巴占治疗的局灶性或全面性癫痫患者是否比接受卡马西平治疗的患者更有可能在12个月时继续接受治疗。其中一项研究表明,服用氯巴占和卡马西平的受试者的社会和学术结局有所改善;但是,没有进行比较分析。
证据质量
目前,没有足够的证据表明氯巴占单药治疗局灶性或全面性癫痫的临床实践。结局的证据质量也受到设计问题和样本量小的影响。对于新发/未经治疗的癫痫发作患者,迫切需要设计良好、有足够把握度的、随机对照的氯巴占单药治疗试验。
证据检索截至2018年3月。
Authors' conclusions
Summary of findings
| Clobazam versus carbamazepine for focal or generalized seizures | ||||||
| Patient or population: people with focal or generalized seizures | ||||||
| Outcomes | Illustrative comparative risks* (95% CI) | Relative effect | No of participants | Quality of the evidence | Comments | |
| Assumed risk | Corresponding risk | |||||
| Carbamazepine | Clobazam | |||||
| Time on allocated treatment (retention time) | Outcome not reported | Outcome not reported | Outcome not reported | Outcome not reported | Outcome not reported | |
| Retention at 12 months | Study population | RR 0.83 (0.61 to 1.12) | 115 | ⊕⊕⊝⊝ | ||
| 654 per 1000 | 543 per 1000 (399 to 732) | |||||
| Seizure freedom at 4 weeks | 720 per 1000 | 611 per 1000 (396 to 950) | RR 0.85 (0.55 to 1.32) | 43 (1 study) | low2,3,4 | |
| Seizure freedom 4‐40 weeks | 760 per 1000 | 722 per 1000 (502 to 1034) | RR 0.95 (0.66 to 1.36) | 43 (1 study) | low2,3,4 | |
| 50% responder rate | 800 per 1000 | 944 per 1000 (752 to 1184) | RR 1.18 (0.94 to 1.48) | 43 (1 study) | low2,3,4 | |
| Adverse effects requiring withdrawal/discontinuation of study medication | Outcome not reported | Outcome not reported | Outcome not reported | Outcome not reported | Outcome not reported | |
| *The basis for the assumed risk (e.g. the median control group risk across studies) is provided in footnotes. The corresponding risk (and its 95% confidence interval) is based on the assumed risk in the comparison group and the relative effect of the intervention (and its 95% CI). | ||||||
| GRADE Working Group grades of evidence | ||||||
| 1Blinding of participants and personnel was not done in this open‐label study. This can potentially affect assessment of this outcome. Downgraded by 1. 4Allocation concealment not stated, which could potentially introduce selection bias. Blinding of participants and personnel was not done in this open‐label study. | ||||||
| Clobazam versus phenytoin for focal or generalized seizures | ||||||
| Patient or population: drug‐naïve people with focal or generalized seizures with solitary cysticercus granuloma Settings: single Indian teaching hospital Intervention: clobazam Comparison: phenytoin | ||||||
| Outcomes | Illustrative comparative risks* (95% CI) | Relative effect | No of Participants | Quality of the evidence | Comments | |
| Assumed risk | Corresponding risk | |||||
| Control | Clobazam versus phenytoin | |||||
| Time on allocated treatment (retention time) | Outcome not reported | Outcome not reported | Outcome not reported | Outcome not reported | Outcome not reported | |
| Retention at 6 months (measured by the number of treatment failures in each group, which was defined as either breakthrough seizure or adverse effects requiring discontinuation or dose modification of study medication) | Study population | RR 1.43 | 48 | ⊕⊕⊝⊝ | ||
| 667 per 1000 | 953 per 1000 (720 to 1267) | |||||
| Seizure freedom at 4 weeks | Outcome not reported | Outcome not reported | Outcome not reported | Outcome not reported | Outcome not reported | |
| Seizure freedom 4‐40 weeks | Outcome not reported | Outcome not reported | Outcome not reported | Outcome not reported | Outcome not reported | |
| 50% responder rate | Outcome not reported | Outcome not reported | Outcome not reported | Outcome not reported | Outcome not reported | |
| Adverse effects requiring withdrawal/discontinuation of study medication | Study population | RR 0.10 | 48 | ⊕⊕⊝⊝ | ||
| 222 per 1000 | 22 per 1000 | |||||
| *The basis for the assumed risk (e.g. the median control group risk across studies) is provided in footnotes. The corresponding risk (and its 95% confidence interval) is based on the assumed risk in the comparison group and the relative effect of the intervention (and its 95% CI). | ||||||
| GRADE Working Group grades of evidence | ||||||
| 1Allocation concealment not stated, which could potentially introduce selection bias. Blinding of participants and personnel was not done in this open‐label study. This can potentially affect assessment of 'adverse effects requiring withdrawal' and hence 'retention time'. Downgraded by 1. | ||||||
Background
This review is an update of a previously published review in the Cochrane Database of Systematic Reviews (Arya 2014).
Description of the condition
Epilepsy is one of the most common disorders of the brain (Engel 2008). It accounts for 1% of the global burden of disease, a figure equivalent to breast cancer in women and lung cancer in men (Murray 1994).
An epileptic seizure is defined as a transient occurrence of signs or symptoms due to abnormal excessive or synchronous neuronal activity in the brain (Fisher 2005). Sometimes, a seizure can be a natural response of the normal brain to transient disturbances in function. Such seizures are referred to as provoked or acute symptomatic seizures. Epilepsy is a chronic condition of the brain characterized by an enduring propensity to generate epileptic seizures, and by the neurobiological, cognitive, psychological, and social consequences of this condition (Fisher 2005).
Worldwide, epilepsy affects 50 million people (Engel 2008). In high‐income countries, the age‐adjusted incidence of epilepsy ranges from 24 to 53 per 100,000 person‐years (Banerjee 2008). Total population studies reporting the incidence of a first diagnosis of unprovoked seizures provide estimates of incidence ranging from 26 to 70 per 100,000 person‐years (Banerjee 2008). It is likely that the incidence of epilepsy may be higher in low‐ and middle‐income countries than in high‐income countries, due to increased occurrence of perinatal insults and neuro‐infections.
Description of the intervention
Clobazam is a benzodiazepine anti‐seizure medication. It has been shown to be an effective anticonvulsant for monotherapy of previously untreated children with focal seizures, with a similar efficacy to phenytoin or carbamazepine. Clobazam is also efficacious when used as an add‐on treatment for refractory focal epilepsy in children and adults (Koeppen 1987; Schmidt 1986), and intermittent clobazam therapy may be useful for the treatment of febrile seizures (Rose 2005). The Canadian Clobazam Cooperative Group performed the largest single study, comprising 877 participants with epilepsy, both children and adults, with multiple types of seizures including atypical absence, myoclonic seizures, Lennox‐Gastaut syndrome, and generalized tonic‐clonic seizures (Canadian Clobazam Cooperative Group 1991). More than half the participants became seizure free or had a greater than 50% reduction in seizure frequency. Clobazam is thought to have fewer side effects than other benzodiazepines at equipotent doses (Schmidt 2008), although development of tolerance in 30% to 50% of people is an important disadvantage.
Clobazam is metabolized by hepatic microsomal enzymes. The main active metabolite is desmethylclobazam, also called norclobazam. Clobazam and its metabolite are slowly eliminated with a half‐life of 20 to 56 hours. Although it is only one‐fifth as potent as the parent compound, because the ratio of plasma levels of desmethylclobazam to those of the parent drug is about 10:1, and because the metabolite also has a longer half‐life, the anticonvulsant property may be more attributable to desmethylclobazam than to clobazam (Schmidt 2008).
How the intervention might work
Gamma amino butyric acid (GABA) is the major inhibitory neurotransmitter in the central nervous system. It binds to at least two classes of receptors, GABA‐A and GABA‐B, which are found on almost all cortical neurons (Macdonald 2002). Benzodiazepines act primarily as anticonvulsants by interacting with GABA‐A receptors at a specific binding site and allosterically modifying the receptor currents to enhance inhibition by increasing the frequency of receptor opening without significantly affecting the mean open time or conductance of the channel. It is now known that the GABA receptor is made up of many different subunits (α, β, γ, δ, ρ) with different subtypes in many combinations. GABA‐A receptors containing the α1 subunit are an important target for benzodiazepines (Rogawski 2004).
The anti‐absence activity of benzodiazepines probably results from their ability to interfere with hypersynchronous activity in the thalamocortical circuitry. More specifically, benzodiazepines are thought to reduce the inhibitory output of the reticular neurons by effects on benzodiazepine‐sensitive α3‐containing GABA‐A receptors (Rogawski 2004). However, some of the clinical effects of benzodiazepines in experimental animals cannot be explained simply by their potentiation of GABA‐activated currents (Schmidt 2008), and benzodiazepines may act on targets other than the GABA‐A receptor. Through unknown mechanisms, benzodiazepines may produce elevations of GABA levels in the cerebrospinal fluid (Löscher 1987). At high concentrations, especially those that may be achieved in the treatment of status epilepticus, benzodiazepines may have significant effects on voltage‐gated sodium and, to a lesser extent, on calcium channels (Schmidt 2008).
Why it is important to do this review
The antiepileptic drug (AED) choices for monotherapy of new‐onset or untreated seizures has a fairly limited evidence base. The updated International League Against Epilepsy monotherapy guidelines has identified Level A evidence, according to their criteria, for only carbamazepine, phenytoin, levetiracetam and zonisamide for focal seizures in adults, and for ethosuximide and valproate in childhood absence epilepsy (Glauser 2013). This rigorous update also highlighted the lack of well‐designed clinical trials and appropriate evidence for monotherapy of several other patient groups with new‐onset or untreated epilepsy, who are candidates for monotherapy with AEDs.
Also, the majority of the conventional and some of the newer AEDs have important adverse effects in a significant proportion of people receiving them (Porter 2007), which precludes their use in certain patient groups. Hence, there is a continued need to assess the efficacy and safety of alternative newer AEDs for monotherapy of new‐onset or untreated epilepsy. A Cochrane Review of clobazam monotherapy would help to define its place in the monotherapy of new‐onset or untreated epilepsy and might help in increasing the number of available choices for treatment of these people.
Objectives
To evaluate the efficacy, effectiveness, tolerability and safety of clobazam as monotherapy in people with new‐onset focal or generalized seizures.
Methods
Criteria for considering studies for this review
Types of studies
-
Randomized controlled trials (RCTs) and quasi‐randomized controlled trials (QRCTs).
-
Studies may be double‐blinded, single‐blinded or unblinded.
Types of participants
-
Adults and children aged more than six months with two or more unprovoked seizures or a single acute symptomatic seizure.
Types of interventions
-
Intervention: clobazam monotherapy for at least three months continuously.
-
Comparator: placebo or any other anti‐seizure drug.
Types of outcome measures
Primary outcomes
Time on allocated treatment (retention time)
This is a combined outcome reflecting both efficacy and tolerability, as treatment may be withdrawn due to continued seizures, side effects or a combination of both. This is an outcome to which the participant makes a contribution, and is the primary outcome measure recommended by the Commission on Antiepileptic Drugs of the International League Against Epilepsy (Commission 1998).
Secondary outcomes
Short‐term effectiveness measure(s)
-
Seizure cessation within eight weeks of starting clobazam
-
A decrease in seizure burden of 50% or more (50% responder rate) within eight weeks of starting clobazam
Long‐term effectiveness measure(s)
-
The proportion of individuals who achieve six, 12 and 24 months' seizure freedom
Tolerability measure(s)
-
Proportion of individuals experiencing adverse events requiring medication withdrawal
-
Proportion of individuals experiencing any adverse events emerging during clobazam monotherapy (specific vigilance for sedation or drowsiness would be kept and data presented in each study would be summarized)
Quality‐of‐life measure(s)
-
Quality‐of‐life outcomes measured on any validated scale (commonly used, validated, health‐related quality‐of‐life scales used in epilepsy include: Quality of Life in Childhood Epilepsy Questionnaire (QOLCE) and Quality of Life in Epilepsy Inventory‐89 and 31 (QOLIE‐89/31))
Tolerance measure(s)
-
Data on the development of anti‐seizure drug tolerance or tachyphylaxis using the study definitions
Search methods for identification of studies
We carried out a comprehensive search to identify all eligible trials regardless of language, year of publication, or status of publication (published in peer‐reviewed journal, conference proceedings, thesis, or unpublished).
Electronic searches
Searches were run for the original review in July 2011 and subsequent searches were run in March 2013, April 2015, January 2017, and March 2018. For the latest update we searched the following databases, with no language restrictions:
-
Cochrane Register of Studies (CRS Web, 19 March 2018), which includes the Cochrane Epilepsy Group Specialized Register and the Cochrane Central Register of Controlled Trials (CENTRAL) using the search strategy outlined in Appendix 1.
-
MEDLINE (Ovid, 1946 to 19 March 2018) using the search strategy set out in Appendix 2.
-
BIOSIS Previews (1969 to 19 March 2018) using the search strategy outlined in Appendix 3.
-
ClinicalTrials.gov (19 March 2018) using the search strategy shown in Appendix 4.
-
World Health Organization International Clinical Trials Registry Platform (ICTRP, 19 March 2018) using the search strategy shown in Appendix 5.
Previously we also searched the Database of Abstracts of Reviews of Effectiveness (DARE) using the search strategy outlined in Appendix 6, but this is now a closed archive, so it has not been searched again.
Searching other resources
We checked the reference lists of identified trials for additional reports of relevant studies.
Data collection and analysis
Selection of studies
Two authors (RA, VA) scanned the results of the search and performed a preliminary screen rejecting publications that were obviously unsuitable and retaining publications in which interventions seemed relevant. Two authors (VA, SK) independently inspected the remaining references that were not rejected and obtained the full text of all possibly relevant studies. Two authors independently applied inclusion and exclusion criteria, resolving disagreements by discussion. No doubts about any trial's eligibility were raised. We scrutinized the trial reports according to dates, location of the trial and interventions, to ensure that multiple publications from the same trial are included only once. We recorded potentially relevant references that were excluded along with the reason for their exclusion.
Data extraction and management
For eligible studies, at least two of the authors (RA, VA, SK, NG) extracted the data using the pre‐designed agreed form, resolving discrepancies through discussion or by consulting the third author. We entered data into Review Manager software (RevMan 2014), and checked them for accuracy. We ensured accuracy by comparing data extracted independently by two of the authors (RA, VA, SK, NG) and resolved any discrepancies by discussion or by consultation with the third author.
Assessment of risk of bias in included studies
Two authors (from RA, VA, SK, NG) independently assessed the methodological quality of each study and risk of bias using The Cochrane Collaboration’s 'Risk of bias' tool (Higgins 2011a). Assessors were not blinded to the authors or source institution. The items included for appraisal were sequence generation for randomization, concealment of allocation, blinding, incomplete outcome data, selective outcome reporting and other potential sources of bias. Each of these factors was categorized as low risk, high risk or unclear risk with a brief overview (Appendix 7).
Measures of treatment effect
We performed statistical analysis using RevMan 5 (RevMan 2014). Since data for each outcome were available from any one study only, we could not perform meta‐analysis.
Dichotomous data
We calculated risk ratios (RRs) with 95% confidence intervals (CI) for dichotomous outcomes.
Continuous data
For continuous variables, in future versions of the review, we will calculate difference in means or standardized mean differences (SMDs) along with 95% CIs. When two or more studies present their data derived from the same instrument of evaluation (with the same units of measurement), we will pool data as a mean difference (MD). Conversely, when primary studies express the same variables through different instruments (and different units of measurement) we will use the SMD.
Dealing with missing data
In future versions of the review, for missing data, we will attempt to contact the authors of original studies to obtain additional data. For all outcomes, we will carry out analyses on an intention‐to‐treat (ITT) basis as far as possible, that is, including all participants randomized in their original groups.
For missing continuous data, we will estimate standard deviations (SDs) from other available data such as standard errors (SEs), or we will impute the data using methods suggested by the Cochrane Handbook for Systematic Reviews of Interventions (Higgins 2011b). We will make no assumptions about loss to follow‐up for continuous data and we will base analyses on those individuals who completed the trial. We will perform ITT analyses where appropriate. We will perform a sensitivity analysis by calculating the treatment effect including and excluding the imputed data to see whether this would alter the outcome of the analysis. We will investigate the effect of drop‐outs and exclusions by conducting 'worst‐case' versus 'best‐case' scenario analyses. If there are any discrepancies in the number randomized and the number analyzed in each treatment group, we will calculate the percentage lost to follow‐up in each group and report the results. If drop‐outs exceed 10% for any trial, we shall assign the worse outcome to those lost to follow‐up for dichotomous outcomes and assess the impact of this in sensitivity analyses with the results of those completing the study. Where it is not possible to obtain missing data, we will record this in the data extraction form and report the information in the 'Risk of bias' table. For included studies, we will note levels of attrition. We will explore the impact of including studies with high levels of missing data in the overall assessment of treatment effect by using sensitivity analysis.
Assessment of heterogeneity
Although not relevant to the current version of the review, in future we will assess heterogeneity between pooled trials using the Chi² test in conjunction with the I² statistic (Higgins 2003), which describes the percentage of the variability in effect estimates that is due to heterogeneity rather than sampling error (Deeks 2011). We will consider a P value of less than 0.10 as statistically significant. If enough trials are identified, we will explore sources of heterogeneity using subgroup analyses. We will display results graphically using forest plots, and present a summary statistic if no major statistical heterogeneity (lack of overlap of confidence intervals on the forest plots) exists. We will consider values of I² of less than 25% to denote low heterogeneity, 50% or greater to be significant heterogeneity and 75% or greater to be substantial and major heterogeneity.
Assessment of reporting biases
As sufficient trials become available in future, we will attempt to assess publication bias by preparing a funnel plot. We will then perform a visual assessment of funnel plot asymmetry. We will perform exploratory analyses to investigate any suggestion of visual asymmetry in the funnel plots. Our searches for trials listed in clinical trial registers and trial protocols should help to avoid publication bias and to assess outcome selection bias. Where necessary, we will contact study authors in an attempt to establish a full data set or obtain reasons for the non‐reporting of certain outcomes.
Data synthesis
We entered quantitative data into RevMan 5 and analyzed the data using Cochrane MetaView (RevMan 2014). Pooled analyses were not feasible for the current version of the review. In future versions, we will use adjusted summary statistics if feasible, otherwise we will use unadjusted results.
-
For time‐to‐event data, we will pool hazard ratios (HR) using the generic inverse variance facility of RevMan 5.
-
For dichotomous outcomes, we will calculate and pool RRs for each study.
-
For continuous outcomes, we will pool MDs between the treatment arms at the end of follow‐up if all trials measured the outcome on the same scale, otherwise we will pool SMDs, as discussed above.
We will use a fixed‐effect meta‐analysis unless significant statistical or clinical heterogeneity are found, in which case we will use a random‐effects analysis if considered appropriate (DerSimonian 1986). If possible, we will synthesize studies making different comparisons using the methods described by Bucher 1997.
We assessed the quality of the body of the evidence using the GRADE approach (Higgins 2011a). Domains that determined the quality of the evidence were:
-
study design;
-
risk of bias;
-
inconsistency of results;
-
indirectness (non‐generalizability);
-
imprecision (insufficient data);
-
other factors (e.g. reporting bias).
We reduced the quality of the evidence by one level for each of the domains that we encountered. We considered all plausible confounding factors and their effects as a reason to reduce any claimed effect and dose‐response gradient. We defined the following levels of evidence.
-
High‐quality evidence: further research is very unlikely to change our confidence in the estimate of effect. There are consistent findings among 75% of RCTs with low risk of bias that are generalizable to the population in question. There are sufficient data, with narrow confidence intervals. There are no known or suspected reporting biases (all of the domains are met).
-
Moderate‐quality evidence: further research is likely to have an important impact on our confidence in the estimate of effect and may change the estimate (one of the domains is not met).
-
Low‐quality evidence: further research is very likely to have an important impact on our confidence in the estimate of effect and is likely to change the estimate (two of the domains are not met).
-
Very low‐quality evidence: we are very uncertain about the estimate (three of the domains are not met).
-
No evidence: no RCTs were identified that measured the outcome.
We also considered a number of factors to place the results into a larger clinical context: temporality, plausibility, strength of association, adverse events, and costs. Not all of these were applicable for the current review, but are likely to be useful as more studies for clobazam monotherapy become available.
Subgroup analysis and investigation of heterogeneity
Considerations of clinical diversity included assessment of differences in study location and setting, participant characteristics including co‐morbidities, characteristics of the trial interventions and of other care provided.
We intended to analyze studies according to differences in the following pre‐planned subgroups.
-
Age (children versus adults)
-
Seizure semiology (focal with or without secondary generalization versus primary generalized)
-
Seizure frequency prior to enrolment in the study
-
Pre‐treatment electroencephalographic (EEG) findings
-
Neuro‐imaging findings
In the present version of review, sufficient data for sub‐group analyses were not available.
Sensitivity analysis
Where possible, we intended to perform sensitivity analyses to explore the effects of various aspects of trial and review methodology, including the effects of missing data and whether allocation was concealed. If sufficient data were available, we intended to conduct sensitivity analyses to determine the impact of excluding studies with lower methodological quality, for example:
-
excluding trials at a high or unclear risk of bias;
-
excluding unpublished studies, these may not have been subjected to the peer review process and may have intrinsic bias issues;
-
excluding industry studies;
-
excluding trials that have not assessed compliance.
'Summary of findings' tables
We used the principles of the GRADE approach to assess the quality of the body of evidence associated with specific outcomes and to construct 'Summary of findings' tables (SoF) (Schünemann 2011). The GRADE approach appraises the quality of a body of evidence based on the extent to which one can be confident that an estimate of effect or association reflects the item being assessed. The quality of a body of evidence considers within‐study risk of bias (methodologic quality), the directness of the evidence, heterogeneity of the data, precision of effect estimates and risk of publication bias.
Results
Description of studies
Results of the search
We identified 291 publications by the search of electronic databases and trial registers. Because of duplication, we removed 89 articles. After review of 202 titles and abstracts by two authors (VA, RA), we considered that 17 studies were potentially eligible for inclusion, out of which 14 were excluded because either they used clobazam only for short‐term intermittent treatment for acute symptomatic seizures (Bajaj 2005; Feely 1982a; Feely 1982b; Feely 1982c; Khosroshahi 2011; RamachandranNair 2005; Rose 2005), or they used clobazam as add‐on therapy instead of monotherapy (Figueroa 1984; Koeppen 1987; Vajda 1985; Yagi 1995; Yamatogi 1997). One study (Feely 1984), was found to be a case series, and was therefore excluded. Another study (Canadian Study Group 1999), was part of a larger multi‐center study on the efficacy of clobazam and analyzed neuropsychological measures in children receiving clobazam verus those receiving standard monotherapy. However, those randomized to receive clobazam also included children who had previously been treated unsuccessfully with carbamazepine or one or more other AEDs. This study was therefore excluded (Characteristics of excluded studies). Three trials (Andrade 2009; Canadian Study Group 1998; Kaushal 2006), with 163 individuals randomized to clobazam monotherapy or other anti‐seizure medication (carbamazepine or phenytoin) monotherapy were analyzed (See Figure 1).
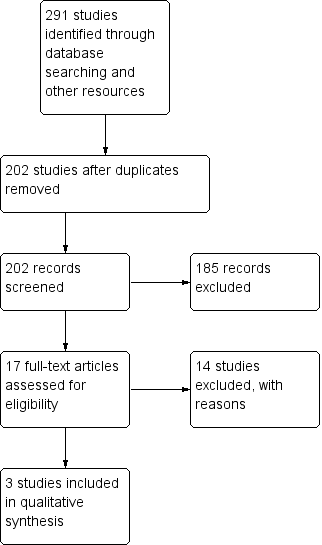
Study flow diagram (results from updated searches)
Included studies
This single‐center, randomized open‐label study compared clobazam versus carbamazepine in children with benign childhood epilepsy with centrotemporal spikes (BCECTS). The outcome measures included the number of participants with more than 50% reduction in seizures, number of participants who were free of seizures in the last nine months, and the average time it took to achieve seizure freedom in participants treated with clobazam versus those treated with carbamazepine. This study also examined academic performance, behavior, adherence to treatment, parents’ degree of satisfaction and side effect profiles.
This multi‐center study aimed to compare the effectiveness of clobazam, carbamazepine and phenytoin monotherapy in children with epilepsy. It had a randomized, double‐blind design with ITT analysis for the primary outcome measure of retention on the study medication for 12 months or discontinuation of the study medication for any reason, including adverse effects or inadequate seizure control. The study had three intervention arms: drug‐naive, previous failure with carbamazepine, and previous failure with other anti‐seizure medications. Only the first arm met the inclusion criteria for this review and was analyzed. This arm compared clobazam with standard treatment (carbamazepine) in drug‐naive participants with epilepsy, for a period of 12 months.
This single‐center, randomized, open‐label study compared clobazam versus phenytoin in adolescents and adults with solitary neurocysticercosis granuloma. The primary outcome measure was number of treatment failures in each group due to breakthrough seizures or adverse events during the first six months after initiation. This study had some methodologic limitations as mentioned in Risk of bias in included studies.
The studies are summarized in Characteristics of included studies.
Excluded studies
The reasons for exclusion are summarized in Characteristics of excluded studies.
Risk of bias in included studies
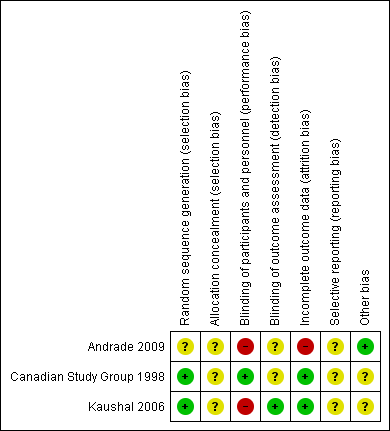
Two of the included studies were adequately randomized, using either the permuted block technique (Canadian Study Group 1998), or a computer‐generated random number list (Kaushal 2006). However, Andrade 2009 did not mention their method of random sequence generation. The review authors' judgements about the risks of bias are summarized in Figure 2 and Figure 3.

Risk of bias graph: review authors' judgements about each risk of bias item presented as percentages across all included studies

Risk of bias summary: review authors' judgements about each risk of bias item for each included study
Allocation
The allocation sequence concealment is not described in any of the studies.
Blinding
Two studies provided information on blinding. One of the included studies was double‐blind and used a 'double dummy' technique (Canadian Study Group 1998), but the other was an open‐label trial (Kaushal 2006). The Canadian Study Group 1998 had two outcome assessors, one of whom was blinded, whereas the blinding of the outcome assessor is not mentioned in Kaushal 2006. This lack of blinding might have affected the assessment of subjective outcomes such as tolerability measures. Andrade 2009 did not provide details of blinding in outcome assessment.
Incomplete outcome data
The risk of attrition bias is assessed to be low, as all of the randomized participants were analyzed in all of the studies that is, the primary analysis was on an ITT basis.
Selective reporting
We could not assess reporting bias as there were no pre‐published protocols available for any of the studies.
Other potential sources of bias
The Canadian Study Group 1998 trial was funded by Hoechst‐Marion‐Roussel Canada, Inc, and the monitoring of data collection and entry was accomplished in this trial by Hoechst‐Marion‐Roussel Canada, Inc. Kaushal 2006 did not mention any sources of funding. However, this study initially estimated a sample size of 270 to detect a 10% difference in the primary outcome measure with a 90% confidence; but, they prematurely terminated the study with an actual sample of only 48 participants, due to relocation of a study investigator. Also in this study, outcome was assessed by the treating physician and a blinded research team member, but they do not mention how they reached a consensus in case of disagreement or discrepancy. Further, they do not report whether and how informed consent was obtained.Andrade 2009 do not mention any funding source. No other sources of bias that could have affected the results were noted.
Effects of interventions
See: Summary of findings for the main comparison Clobazam versus carbamazepine for focal or generalized seizures; Summary of findings 2 Clobazam versus phenytoin for focal or generalized seizures
Retention at 12 months
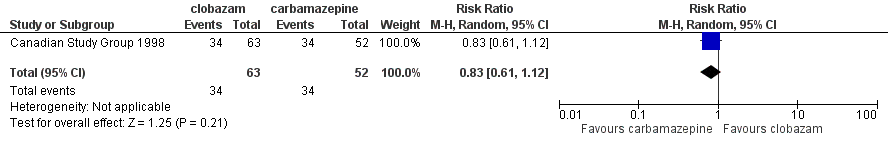
Data on 115 drug‐naive children were available for analysis of this outcome from one study only (Canadian Study Group 1998), in which 63 participants were randomized to clobazam and 52 to carbamazepine respectively. No statistically significant advantage of clobazam over carbamazepine was detected, with a risk ratio (RR) of 0.83, 95% CI (0.61 to 1.12) (Analysis 1.1; Figure 4). No data were available for any subgroup analysis.

Forest plot of comparison: 2 clobazam vs carbamazepine, outcome: 2.1 retention at 12 months
Retention at six months
Data on 48 drug‐naive adolescents and adults with solitary cysticercus granuloma were available for analysis of this outcome from only one study (Kaushal 2006). The number of participants randomized to clobazam and phenytoin arm were 21 and 27 respectively. Twenty out of 21 participants randomized to receive clobazam remained on the study medication for six months, compared to 18 out of 27 in the phenytoin group (RR 1.43, 95% CI 1.08 to 1.90) (Analysis 2.1; Figure 5). No data were available for any subgroup analysis.
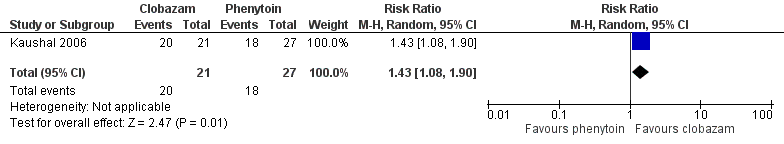
Forest plot of comparison: 1 clobazam versus phenytoin, outcome: 1.1 retention at 6 months
Seizure freedom at specified time intervals
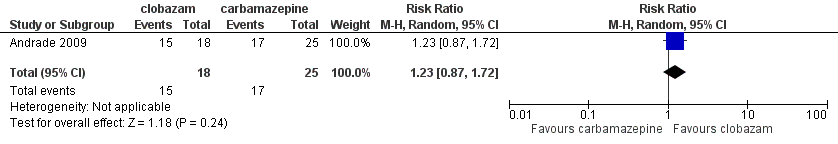
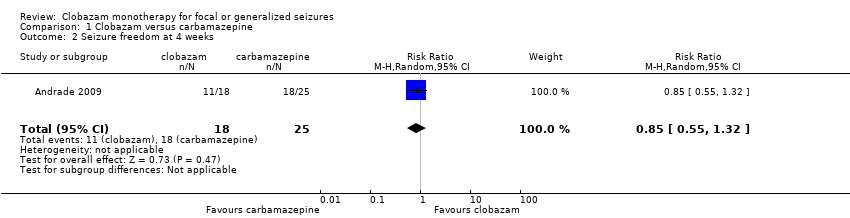
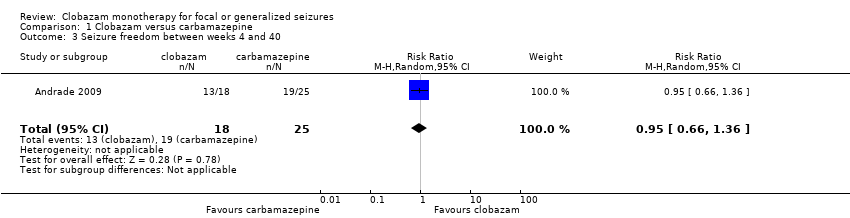
Data on 43 children were available for analysis of this outcome (Andrade 2009). Participants with BCECTS were evaluated for seizure freedom at four weeks, between four and 40 weeks, and during the last nine months of treatment, and no statistically significant differences were identified between those allocated to receive clobazam versus carbamazepine. Eleven out of 18 participants randomized to receive clobazam were seizure free at four weeks, compared to 18/25 in the carbamazepine group (RR 0.85, 95% CI 0.55 to 1.32 Analysis 1.2). Thirteen out of 18 participants on clobazam were seizure free during the four to‐40‐week interval, compared to 19/25 in the carbamazepine group (RR 0.95, 95% CI 0.66 to 1.36 Analysis 1.3). Lastly, 15/18 participants in clobazam group were seizure free during the last nine months of therapy, compared to 17/25 in the carbamazepine group (RR 1.23, 95% CI 0.87 to 1.72 Figure 6).

Forest plot of comparison: 1 clobazam versus carbamazepine, outcome: 1.4 terminal remission at 9 months (seizure free for last 9 months)
50% responder rate at four weeks
Andrade 2009 provided data on 43 children regarding this outcome. There was no statistically significant difference in the proportion of children whose seizure frequency decreased by at least 50% (50% responder rate) at four weeks between the clobazam and carbamazepine groups (Analysis 1.5). Seventeen out of 18 participants randomized to receive clobazam achieved a 50% or greater reduction in seizures at four weeks, compared to 20/25 in the carbamazepine group (RR 1.18, 95% CI 0.94 to 1.48).
Time to achieve seizure freedom
Data on 43 children were available for this outcome (Andrade 2009). The mean time to achieve seizure freedom was 33.3 (± 45) days in participants randomized to clobazam (n = 18), compared to 48.2 (± 72.3) days in those allocated to receive carbamazepine (n = 25).
Adverse effects
Data on adverse effects were provided by two studies.
The first study compared clobazam with phenytoin in 48 adolescents and adults with symptomatic seizures due to solitary cysticercus granuloma (Kaushal 2006). Overall, six out of 27 participants in the phenytoin group discontinued study medication during the study period after experiencing adverse effects, compared to none in the 21 participants in the clobazam group (RR 0.10, 95% CI 0.01 to 1.65) (Analysis 2.3; Figure 6).The reported adverse effects included sedation, skin problems, allergic rash, tiredness, oral‐gingival problems, headache and weight gain (Analysis 2.4). The incidence of these adverse effects was not different between clobazam and phenytoin: sedation (RR 0.96, 95% CI 0.40 to 2.35), skin problems (RR 0.18, 95% CI 0.02 to 1.38), tiredness (RR 0.43, 95% CI 0.1 to 1.91), oral or gingival problems (RR 0.21, 95% CI 0.03 to 1.65), headache (RR 2.57, 95% CI 0.73 to 9.09) and weight gain (RR 11.45, 95% CI 0.65 to 201.6).
The second study compared clobazam with carbamazepine in 43 children with BCECTS (Andrade 2009). Overall, one participant out of 25 in the carbamazepine group discontinued the medication during the study period after experiencing adverse effects, compared to none in the 18 participants in the clobazam group. Reported adverse effects included vertigo, rash, headaches, somnolence/sedation, nausea/vomiting, diarrhea, tremors, and fatigue. The number of participants reporting adverse effects were not different between the clobazam and carbamazepine groups (RR 0.52, 95% CI 0.16 to 1.70, P = 0.26, Analysis 1.6).
Discussion
Summary of main results
Three studies with a total of 206 participants met the inclusion criteria for this review (Andrade 2009; Canadian Study Group 1998; Kaushal 2006). Two of the included trials were adequately randomized, and overall, we judged them to be of low quality (Figure 3). None of the studies provided data for our primary outcome of time on allocated treatment, a clinically meaningful measure combining both efficacy and tolerability. No statistically significant advantage of clobazam over carbamazepine was detected in 115 participants in the Canadian Study Group 1998 trial (RR 0.83, 95% CI 0.61 to 1.12) for retention at 12 months. However, a slight advantage for clobazam over phenytoin (RR 1.43, 95% CI 1.08 to 1.90) was seen in 48 participants with single cysticercus granuloma in the brain for retention at six months (Kaushal 2006).
No significant differences were identified between clobazam and carbamazepine for seizure freedom at four weeks (RR 0.85, 95% CI 0.55 to 1.32), between four and 40 weeks (RR 0.95, 95% CI 0.66 to 1.36), and during the last nine months of treatment (RR 1.23, 95% CI 0.87 to 1.72). Also, no significant differences were noted for clobazam versus carbamazepine in 43 participants with BCECTS in the 50% responder rate (RR 1.18, 95% CI 0.94 to 1.48) at four weeks (Andrade 2009). However, participants randomized to clobazam achieved seizure control sooner than those treated with carbamazepine (Andrade 2009).
In one of the studies, people receiving clobazam were found to be less likely to discontinue it due to adverse effects compared to phenytoin (RR 0.10, 95% CI 0.01 to 1.65, Kaushal 2006). However, the wide confidence interval and potential for bias in the one open‐label study where this outcome could be analyzed, compromise the clinical relevance of this result.
In another study, no difference in the number of participants reporting adverse effects with clobazam or carbamazepine was noted, and the proportion of participants discontinuing treatment due to adverse effects was minimal and comparable between the two groups (Andrade 2009).
Overall completeness and applicability of evidence
An extensive, structured search found three trials fulfilling the inclusion criteria for this review. Overall, the result of this systematic review finds no evidence for the superiority of clobazam monotherapy compared to adequate comparator monotherapy for retention at 12 months, and only slight advantage for retention at six months, and time to achieve seizure freedom, in people with focal or generalized seizures. The analyzed outcomes were based on results from a single study in each case. In the absence of individual participant data, pooled analysis was not possible for the six months' retention outcome. The clinical applicability for 12 months' retention is limited by lack of data for focal versus generalized seizures, an important decision‐making factor in clinical practice. Similarly, the generalizability for six months' retention is not possible, due to a modest effect size and selected population consisting only of participants with solitary brain cysticercus granuloma.The modest advantage seen regarding time to achieve seizure freedom is also difficult to interpret, as far as clinical applicability and generalizability is concerned. This outcome was reported in only participants with BCECTS, and was not substantiated by sustaining seizure freedom over time, which is more important in clinical practice.
Quality of the evidence
The quality of evidence is low due to actual or possible biases in the included studies. None of the studies have described allocation concealment. The Canadian Study Group 1998 trial was funded by a pharmaceutical company, which also monitored data collection and entry. The Kaushal 2006 study was open‐label and certain issues were not addressed including informed consent, resolution of conflict in case of disagreement between two outcome assessors and discrepancy between CONSORT flow diagram and text/table regarding numbers randomized to each arm. The author having access to the study data did not reply, although the corresponding author had promised to do so. The Andrade 2009 study was also open‐label, and did not provide information about randomization and allocation concealment.
Potential biases in the review process
The eligibility for inclusion, data extraction and 'Risk of bias' assessment was carried out by two authors (VA and RA) independently, thereby reducing the chances of bias. No major potential biases in the review process are highlighted.
Agreements and disagreements with other studies or reviews
There are no other systematic reviews analyzing clobazam monotherapy in focal or generalized seizures. However, the International League Against Epilepsy (ILAE) guideline for anti‐epileptic drug monotherapy (Glauser 2006), included the Canadian Study Group 1998 trial and categorized it as a class III study based on their criteria. Since the ILAE guideline analyzed outcomes based on participants' age and seizure type, the Canadian Study Group 1998 trial was considered uninformative as it fails to provide outcome data separately for focal and generalized seizures.

Study flow diagram (results from updated searches)

Risk of bias graph: review authors' judgements about each risk of bias item presented as percentages across all included studies
Risk of bias summary: review authors' judgements about each risk of bias item for each included study
Forest plot of comparison: 2 clobazam vs carbamazepine, outcome: 2.1 retention at 12 months

Forest plot of comparison: 1 clobazam versus phenytoin, outcome: 1.1 retention at 6 months
Forest plot of comparison: 1 clobazam versus carbamazepine, outcome: 1.4 terminal remission at 9 months (seizure free for last 9 months)

Comparison 1 Clobazam versus carbamazepine, Outcome 1 Retention at 12 months.
Comparison 1 Clobazam versus carbamazepine, Outcome 2 Seizure freedom at 4 weeks.
Comparison 1 Clobazam versus carbamazepine, Outcome 3 Seizure freedom between weeks 4 and 40.

Comparison 1 Clobazam versus carbamazepine, Outcome 4 Terminal remission at 9 months (seizure free for last 9 months).

Comparison 1 Clobazam versus carbamazepine, Outcome 5 50% responder rate at 4 weeks.

Comparison 1 Clobazam versus carbamazepine, Outcome 6 Reported adverse effects (number of participants).

Comparison 1 Clobazam versus carbamazepine, Outcome 7 Discontinued study medication due to adverse effects (number of participants).

Comparison 2 Clobazam versus phenytoin, Outcome 1 Retention at 6 months.

Comparison 2 Clobazam versus phenytoin, Outcome 2 Breakthrough seizure(s) during study period.

Comparison 2 Clobazam versus phenytoin, Outcome 3 Discontinued study medication due to adverse effects.

Comparison 2 Clobazam versus phenytoin, Outcome 4 Reported adverse effects.
| Clobazam versus carbamazepine for focal or generalized seizures | ||||||
| Patient or population: people with focal or generalized seizures | ||||||
| Outcomes | Illustrative comparative risks* (95% CI) | Relative effect | No of participants | Quality of the evidence | Comments | |
| Assumed risk | Corresponding risk | |||||
| Carbamazepine | Clobazam | |||||
| Time on allocated treatment (retention time) | Outcome not reported | Outcome not reported | Outcome not reported | Outcome not reported | Outcome not reported | |
| Retention at 12 months | Study population | RR 0.83 (0.61 to 1.12) | 115 | ⊕⊕⊝⊝ | ||
| 654 per 1000 | 543 per 1000 (399 to 732) | |||||
| Seizure freedom at 4 weeks | 720 per 1000 | 611 per 1000 (396 to 950) | RR 0.85 (0.55 to 1.32) | 43 (1 study) | low2,3,4 | |
| Seizure freedom 4‐40 weeks | 760 per 1000 | 722 per 1000 (502 to 1034) | RR 0.95 (0.66 to 1.36) | 43 (1 study) | low2,3,4 | |
| 50% responder rate | 800 per 1000 | 944 per 1000 (752 to 1184) | RR 1.18 (0.94 to 1.48) | 43 (1 study) | low2,3,4 | |
| Adverse effects requiring withdrawal/discontinuation of study medication | Outcome not reported | Outcome not reported | Outcome not reported | Outcome not reported | Outcome not reported | |
| *The basis for the assumed risk (e.g. the median control group risk across studies) is provided in footnotes. The corresponding risk (and its 95% confidence interval) is based on the assumed risk in the comparison group and the relative effect of the intervention (and its 95% CI). | ||||||
| GRADE Working Group grades of evidence | ||||||
| 1Blinding of participants and personnel was not done in this open‐label study. This can potentially affect assessment of this outcome. Downgraded by 1. 4Allocation concealment not stated, which could potentially introduce selection bias. Blinding of participants and personnel was not done in this open‐label study. | ||||||
| Clobazam versus phenytoin for focal or generalized seizures | ||||||
| Patient or population: drug‐naïve people with focal or generalized seizures with solitary cysticercus granuloma Settings: single Indian teaching hospital Intervention: clobazam Comparison: phenytoin | ||||||
| Outcomes | Illustrative comparative risks* (95% CI) | Relative effect | No of Participants | Quality of the evidence | Comments | |
| Assumed risk | Corresponding risk | |||||
| Control | Clobazam versus phenytoin | |||||
| Time on allocated treatment (retention time) | Outcome not reported | Outcome not reported | Outcome not reported | Outcome not reported | Outcome not reported | |
| Retention at 6 months (measured by the number of treatment failures in each group, which was defined as either breakthrough seizure or adverse effects requiring discontinuation or dose modification of study medication) | Study population | RR 1.43 | 48 | ⊕⊕⊝⊝ | ||
| 667 per 1000 | 953 per 1000 (720 to 1267) | |||||
| Seizure freedom at 4 weeks | Outcome not reported | Outcome not reported | Outcome not reported | Outcome not reported | Outcome not reported | |
| Seizure freedom 4‐40 weeks | Outcome not reported | Outcome not reported | Outcome not reported | Outcome not reported | Outcome not reported | |
| 50% responder rate | Outcome not reported | Outcome not reported | Outcome not reported | Outcome not reported | Outcome not reported | |
| Adverse effects requiring withdrawal/discontinuation of study medication | Study population | RR 0.10 | 48 | ⊕⊕⊝⊝ | ||
| 222 per 1000 | 22 per 1000 | |||||
| *The basis for the assumed risk (e.g. the median control group risk across studies) is provided in footnotes. The corresponding risk (and its 95% confidence interval) is based on the assumed risk in the comparison group and the relative effect of the intervention (and its 95% CI). | ||||||
| GRADE Working Group grades of evidence | ||||||
| 1Allocation concealment not stated, which could potentially introduce selection bias. Blinding of participants and personnel was not done in this open‐label study. This can potentially affect assessment of 'adverse effects requiring withdrawal' and hence 'retention time'. Downgraded by 1. | ||||||
| Outcome or subgroup title | No. of studies | No. of participants | Statistical method | Effect size |
| 1 Retention at 12 months Show forest plot | 1 | 115 | Risk Ratio (M‐H, Random, 95% CI) | 0.83 [0.61, 1.12] |
| 2 Seizure freedom at 4 weeks Show forest plot | 1 | 43 | Risk Ratio (M‐H, Random, 95% CI) | 0.85 [0.55, 1.32] |
| 3 Seizure freedom between weeks 4 and 40 Show forest plot | 1 | 43 | Risk Ratio (M‐H, Random, 95% CI) | 0.95 [0.66, 1.36] |
| 4 Terminal remission at 9 months (seizure free for last 9 months) Show forest plot | 1 | 43 | Risk Ratio (M‐H, Random, 95% CI) | 1.23 [0.87, 1.72] |
| 5 50% responder rate at 4 weeks Show forest plot | 1 | 43 | Risk Ratio (M‐H, Random, 95% CI) | 1.18 [0.94, 1.48] |
| 6 Reported adverse effects (number of participants) Show forest plot | 1 | 43 | Risk Ratio (M‐H, Random, 95% CI) | 0.52 [0.16, 1.70] |
| 7 Discontinued study medication due to adverse effects (number of participants) Show forest plot | 1 | 43 | Risk Ratio (M‐H, Random, 95% CI) | 0.46 [0.02, 10.60] |
| Outcome or subgroup title | No. of studies | No. of participants | Statistical method | Effect size |
| 1 Retention at 6 months Show forest plot | 1 | 48 | Risk Ratio (M‐H, Random, 95% CI) | 1.43 [1.08, 1.90] |
| 2 Breakthrough seizure(s) during study period Show forest plot | 1 | 48 | Risk Ratio (M‐H, Random, 95% CI) | 0.43 [0.05, 3.83] |
| 3 Discontinued study medication due to adverse effects Show forest plot | 1 | 48 | Risk Ratio (M‐H, Random, 95% CI) | 0.10 [0.01, 1.65] |
| 4 Reported adverse effects Show forest plot | 1 | 288 | Risk Ratio (M‐H, Random, 95% CI) | 0.82 [0.32, 2.14] |
| 4.1 Sedation | 1 | 48 | Risk Ratio (M‐H, Random, 95% CI) | 0.96 [0.40, 2.35] |
| 4.2 Skin problems including allergic rash | 1 | 48 | Risk Ratio (M‐H, Random, 95% CI) | 0.18 [0.02, 1.38] |
| 4.3 Tiredness | 1 | 48 | Risk Ratio (M‐H, Random, 95% CI) | 0.43 [0.10, 1.91] |
| 4.4 Oral or gingival problems | 1 | 48 | Risk Ratio (M‐H, Random, 95% CI) | 0.21 [0.03, 1.65] |
| 4.5 Headache | 1 | 48 | Risk Ratio (M‐H, Random, 95% CI) | 2.57 [0.73, 9.09] |
| 4.6 Weight gain | 1 | 48 | Risk Ratio (M‐H, Random, 95% CI) | 11.45 [0.65, 201.60] |