Scolaris Content Display Scolaris Content Display

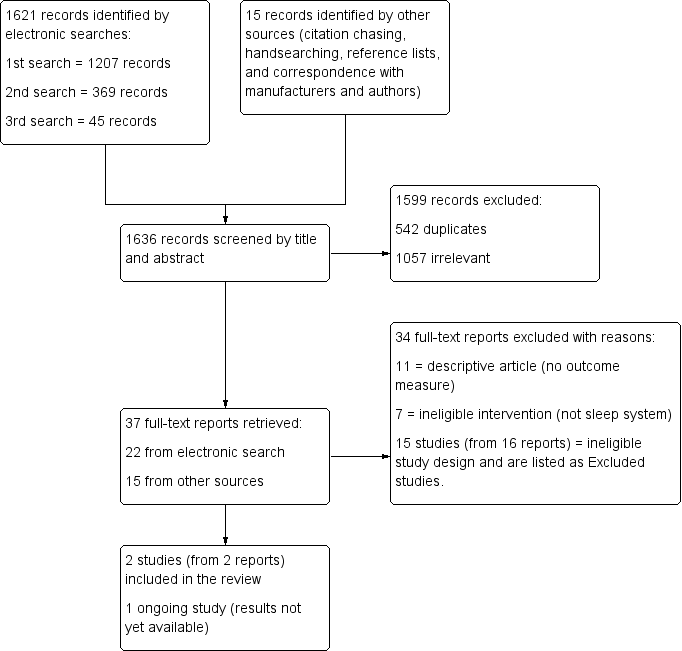
Study flow diagram
Figuras y tablas -
Figure 1

Study flow diagram

Risk of bias summary: Review authors' judgements about each risk of bias item for each included study.
Figuras y tablas -
Figure 2

Risk of bias summary: Review authors' judgements about each risk of bias item for each included study.

Sleeping in a sleep positioning system compared with not sleeping in a sleep positioning system for children with cerebral palsy

Population: Children with cerebral palsy

Settings: United Kingdom (at home or in paediatric research laboratory)

Intervention: Sleeping in sleep positioning system

Comparison: Not sleeping in sleep positioning system

Outcomes

Impact

Number of participants
(studies)

Quality of the evidence
(GRADE)

Reduce hip migration/hip problems

No RCTs measured effect of sleep positioning systems on hip migration/hip problems

Effect on sleep patterns and quality

Limited data. A small number of established users of sleep positioning systems showed no significant difference in sleep quality indicators

21
(2 studies)

⊕⊝⊝⊝
Very low

Effect on quality of life of child and family

No RCTs measured effect of sleep positioning systems on child and family quality of life

Effect on pain

Limited data. A small number of established users of sleep positioning systems showed no significant difference in levels of pain

10

(1 study)

⊕⊝⊝⊝
Very low

Effect on physical functioning

No RCTs measured effect of sleep positioning systems on physical functioning

Adverse effects

No RCTs measured harms or reported adverse events

GRADE Working Group grades of evidence
High quality: Further research is very unlikely to change our confidence in the estimate of effect.
Moderate quality: Further research is likely to have an important impact on our confidence in the estimate of effect and may change the estimate.
Low quality: Further research is very likely to have an important impact on our confidence in the estimate of effect and is likely to change the estimate.
Very low quality: We are very uncertain about the estimate.

GRADE: Grades of Recommendation, Assessment, Development and Evaluation.
RCTs: Randomised controlled trials.

Figuras y tablas -
Table 1. Summary and test statistics for variables of primary outcomes

Outcome

Variable

Definition

Study ID

Number of participants

Sleeping in sleep positioning system

Mean (SD)

Sleeping out of sleep positioning system

Mean (SD)

Mean difference (95% CI)

Paired t‐test

t value

P value

Sleep patterns/sleep quality

Sleep latency

Time (in minutes) to fall asleep

Hill 2009

9*

69.1 (52.6)

32.9 (26.0)

36.2 (‐1.12 to 73.45)

2.24

0.06

Hill 2009

8£

64.1 (54.0)

37.0 (24.5)

27.1 (‐8.76 to 62.89)

1.79

0.12

Underhill 2012

9

68.8 (49.8)

80.1 (48.1)

‐11.3 (‐30.70 to 8.03)

‐1.35

0.21

Sleep efficiency

% of time in bed actually asleep

Hill 2009

9

80.7 (15.4)

83.1 (12.0)

‐2.4 (‐11.77 to 7.04)

‐0.58

0.58

Underhill 2012

10

76.2 (8.3)

73.8 (11.1)

2.4 (‐2.98 to 7.73)

1.00

0.34

Pain

Pain

Paediatric Pain Profile (PPP) scale

(parent‐reported scores)

Underhill 2012

10

11.3 (12.1)

13.0 (14.6)

‐1.7 (‐4.88 to 0.15)

‐1.68

0.13

CI: Confidence intervals; ID: Identifier; SD: Standard Deviation

* Includes one participant who fell asleep before recording started (recorded as zero), as reported by Hill 2009.
£ Calculated without the participant who fell asleep before treatment (excluding zero score) to be comparable to Underhill 2012.
Calculated from data supplied by author; reported as 65.9 in Hill 2009.

Figuras y tablas -
Table 1. Summary and test statistics for variables of primary outcomes
Table 2. Summary statistics for other variables of sleep patterns/quality of sleep

Study

Variable of sleep quality

Number of participants

Sleeping in sleep positioning systems

Mean (SD)

Sleeping out of sleep positioning system

Mean (SD)

Sleeping in sleep positioning system

Median (IQR)

Sleeping out of sleep positioning system

Median (IQR)

Underhill 2012

Total sleep time (in minutes)¹

10

517.1 (54.4)

509.1 (72.5)

511.5 (52.5)

527.5 (117.5)

Hill 2009

Total sleep time (in minutes)

9

349.9 (101.1)

427.7 (55.0)

412.5 (143.5)*

421.0 (89.0)*

Total sleep time that was S1^ (%)

9

2.4 (2.2)

3.2 (2.4)

1.7 (1.1)*

3.6 (3.5)*

Total sleep time that was S4^ (%)

9

33.3 (10.6)

29.0 (10.6)

29.2 (11.3)

28.0 (7.5)

Total sleep time that was S3^ (%)

9

6.4 (1.7)

6.2 (2.4)

6.3 (2.2)

5.5 (3.8)

Total sleep time that was S2^ (%)

9

46.4 (10.0)

50.5 (11.0)

48.7 (11.3)

49.7 (10.8)

REM onset latency (in minutes)

9

159.0 (99.4)

204.3 (122.4)

190.0 (18.0)

187.0 (65.0)

Number of REM cycles

9

3.3 (0.9)

2.9 (1.1)

4.0 (1.0)*

2.0 (2.0)

Total sleep time that was REM^ (%)

9

11.5 (5.1)

11.0 (4.6)

10.7 (1.4)

11.1 (3.9)

Total arousal index

9

11.5 (6.5)

11.4 (5.0)

8.5 (6.0)*

10.8 (8.2)*

Central Apnoea Index (CAI)

9

3.0 (8.0)

4.0 (9.9)

0.4 (0.4)*

0.6 (0.9)*

Respiratory Arousal Index (RAI)

9

2.2 (3.7)

1.5 (2.5)

1.4 (1.9)*

0.6 (1.4)*

Apnoea ‐ Hypopnoea Index (AHI)

9

1.9 (1.8)

0.9 (1.2)

2.6 (3.0)

0.4 (1.5)*

Obstructive Apnoea Index (OAI)

9

0.5 (0.6)

0.4 (0.9)

0.3 (0.8)*

0.1 (0.3)*

% total sleep time with SpO₂ > 95%

9

80.5 (29.0)

77.2 (28.1)

98.0 (19.9)*

87.8 (12.6)*

Average (mean) SpO₂ over total time

9

95.7 (0.9)

96.2 (1.9)

95.0 (1.0)*

97.0 (2.0)*

Minimum SpO₂ (Nidus value)

9

92.7 (1.7)

90.6 (3.0)

92.0 (1.0)*

91.0 (3.0)*

IQR: Interquartile range; REM: Rapid eye movement; SD: Standard deviation; SpO₂: Peripheral capillary oxygen saturation

¹ Originally reported in hours and minutes, here given as minutes to be comparable.

^S1, S2, S3, S4 refer to the different stages of sleep; stages one to four.

All values in this table are calculated from data supplied by study authors. For results from Hill 2009, some discrepancies were found between our calculations and the original publication. These are highlighted with an asterisk (*).

Figuras y tablas -
Table 2. Summary statistics for other variables of sleep patterns/quality of sleep