Evitación versus uso de agentes bloqueadores neuromusculares para mejorar las condiciones durante la intubación traqueal o la laringoscopia directa en adultos y adolescentes
Información
- DOI:
- https://doi.org/10.1002/14651858.CD009237.pub2Copiar DOI

- Base de datos:
-
- Cochrane Database of Systematic Reviews
- Versión publicada:
-
- 17 mayo 2017see what's new
- Tipo:
-
- Intervention
- Etapa:
-
- Review
- Grupo Editorial Cochrane:
-
Grupo Cochrane de Anestesia
- Copyright:
-
- Copyright © 2017 The Cochrane Collaboration. Published by John Wiley & Sons, Ltd.
Cifras del artículo
Altmetric:
Citado por:
Autores
Contributions of authors
Conceiving of the review: LHL, SS, AMM, JW.
Designing the review: LHL, JW, AMM, SS.
Co‐ordinating the review: LHL.
Undertaking manual searches: LHL.
Screening search results: LHL, CD, AN.
Organizing retrieval of papers: LHL, CD, AN.
Screening retrieved papers against inclusion criteria: LHL, CD, AN, CVR, JT.
Appraising the quality of papers: LHL, CD, AN, CVR, JT.
Abstracting data from papers: LHL, CD, AN, CVR, JT.
Writing to authors of papers for additional information: LHL.
Providing additional data about papers: LHL.
Obtaining and screening data on unpublished studies: LHL, AN.
Managing data for the review: LHL, CD, AN.
Entering data into Review Manager (RevMan 5.3): LHL, AN.
Analysing RevMan statistical data: LHL, JW.
Performing other statistical analysis not using RevMan: LHL, JW.
Performing double entry of data: data entered by person one: LHL; data entered by person two: AN.
Interpreting data: LHL, AMM, JW.
Making statistical inferences: LHL, JW.
Writing the review: LHL, CD, AN, CR, JT, SS, AMM, JW.
Securing funding for the review: Copenhagen Trial Unit, Rigshospitalet, Copenhagen, Denmark, and Department of Anaesthesiology, Herlev Hospital, University of Copenhagen, Herlev, Denmark.
Serving as guarantor for the review (one review author): LHL.
Taking responsibility for reading and checking the review before submission: LHL.
Declarations of interest
LHL, AMM, CR, and JW were co‐authors of an observational study entitled "Avoidance of neuromuscular blocking agents may increase the risk of difficult tracheal intubation: a cohort study of 103,812 consecutive adult patients recorded in the Danish Anaesthesia Database" (Lundstrom 2009a).
JW is a member of the task force in the Copenhagen Trial Unit, which develops theory, software, and manuals for trial sequential analysis (TSA).
AMM is a Co‐ordinating Editor for the Cochrane Anaesthesia, Critical and Emergency Care Group.
JT received grants for two studies in 2016 through the Merck Investigator Studies Program. The aims of the two studies were (1) to assess the use of neuromuscular monitoring and the incidence of residual neuromuscular blockade in six Danish anaesthesia departments, and (2) to assess the effect of an e‐learning course in neuromuscular monitoring.
Acknowledgements
We would like to thank Karen Hovhannisyan and Janne Vendt (former and present Cochrane Anaesthesia, Critical and Emergency Care Group Trial Information specialists, respectively) for their valuable help with phrasing of the search strategies.
We would like to thank Andrew Smith (Content Editor); Jing Xie (Statistical Editor); Emmanuel Boselli and Thomas Mencke (Peer Reviewers); and Brian Stafford (Consumer Referee) for help and editorial advice provided during preparation of this systematic review. We would like to thank Julie Wetterslev (cand. scient. soc.) for assistance with Spanish translation.
We would like to thank Andy Smith (Content Editor); Marialena Trivella (Statistical Editor); Rodrigo Cavallazzi, Shahla Siddiqui, and Fred Cheney (Peer Reviewers), and Tracey Lloyd (representative of the ACE consumer panel) for help and editorial advice provided during preparation of the protocol (Lundstrøm 2011a).
Version history
| Published | Title | Stage | Authors | Version |
| 2017 May 17 | Avoidance versus use of neuromuscular blocking agents for improving conditions during tracheal intubation or direct laryngoscopy in adults and adolescents | Review | Lars H Lundstrøm, Christophe HV Duez, Anders K Nørskov, Charlotte V Rosenstock, Jakob L Thomsen, Ann Merete Møller, Søren Strande, Jørn Wetterslev | |
| 2011 Jul 06 | Use versus avoidance of neuromuscular blocking agent for improving conditions during tracheal intubation or direct laryngoscopy in adults and adolescents | Protocol | Lars H Lundstrøm, Søren Strande, Ann Merete Møller, Jørn Wetterslev | |
Differences between protocol and review
We made the following changes to the protocol (Lundstrøm 2011a).
1. Christophe HV Duez, Anders K Nørskov, Charlotte V Rosenstock, and Jakob L Thomsen joined as review authors after publication of the protocol.
2. We considered avoiding NMBA as the intervention, thus we changed the title from "Use versus avoidance of neuromuscular blocking agent for improving conditions during tracheal intubation or direct laryngoscopy in adults and adolescents" to "Avoidance versus use of neuromuscular blocking agent for improving conditions during tracheal intubation or direct laryngoscopy in adults and adolescents".
3. We did not consider stopping early for benefit, harm, or futility on inadequate stopping rules (or no reporting of sample size at all), as risk of bias in the accomplished review was high. In the protocol, we considered this a risk of bias component, but after the 11th Cochrane Symposium in Keystone, Colorado, early stopping was changed from constituting a bias risk to constituting increased risk of random error.
4. We did not consider baseline imbalance or lack of reporting of baseline characteristics as introducing high risk of bias. After the 11th Cochrane Symposium in Keystone, Colorado, baseline imbalance or lack of reporting of baseline characteristics changed from constituting a bias risk to constituting increased risk of random error.
5. We did not report on 'other bias' as suggested in the protocol.
6. In our protocol, we stated, "We will exclude trials using quasi‐randomization and observational studies with regard to benefits, but not harms". In the review, we stated, "We excluded trials using quasi‐randomization as well as observational studies". Thus we did not identify any quasi‐randomized trials and did not include any observational studies examining harms.
7. Under 'Data extraction and management' in the protocol, we stated, "We will include each pair‐wise comparison separately but with shared intervention groups divided out approximately evenly among the comparisons. For example if multiple intervention groups share a common control group the number of patients and the number of events of the control group will be divided equally, thereby the number of subgroups of the control group will match the number of intervention groups (Higgins 2011)" and "We will combine all relevant experimental intervention groups of the trials into a single intervention group, and combined all relevant control intervention groups into a single control group" (Higgins 2011). However, during the review process, we decided to perform only the latter (recommended) method when handling studies with multiple intervention or control groups. Thus, in the review, we have stated the following: "Some trials randomized participants to multiple intervention and/or control groups (more than two groups, as in dose‐finding studies)". In the review, we combined all relevant experimental intervention groups from trials into a single intervention group, and we combined all relevant control intervention groups into a single control group, as recommended (Higgins 2011).
8. As conditions for tracheal intubation were not reported as a continuous outcome in any of the included trials, we did not calculate risk differences or mean differences with 95% confidence intervals.
9. We added two explorative outcomes: (1) a best‐case scenario, whereby dose‐finding studies were represented only by control and intervention groups with the lowest prevalence of difficult intubation; and (2) exclusion of dose‐finding studies.
10. We did not explore selective outcome reporting by comparing publications with their protocols, if the latter were available.
Keywords
MeSH
Medical Subject Headings (MeSH) Keywords
- Confidence Intervals;
- Intubation, Intratracheal [adverse effects, *methods];
- Laryngoscopy [adverse effects, *methods];
- Neuromuscular Blocking Agents [*administration & dosage, adverse effects];
- Neuromuscular Depolarizing Agents [administration & dosage];
- Randomized Controlled Trials as Topic;
- Risk Factors;
- Sensitivity and Specificity;
- Succinylcholine [administration & dosage];
Medical Subject Headings Check Words
Adolescent; Adult; Humans;
PICO
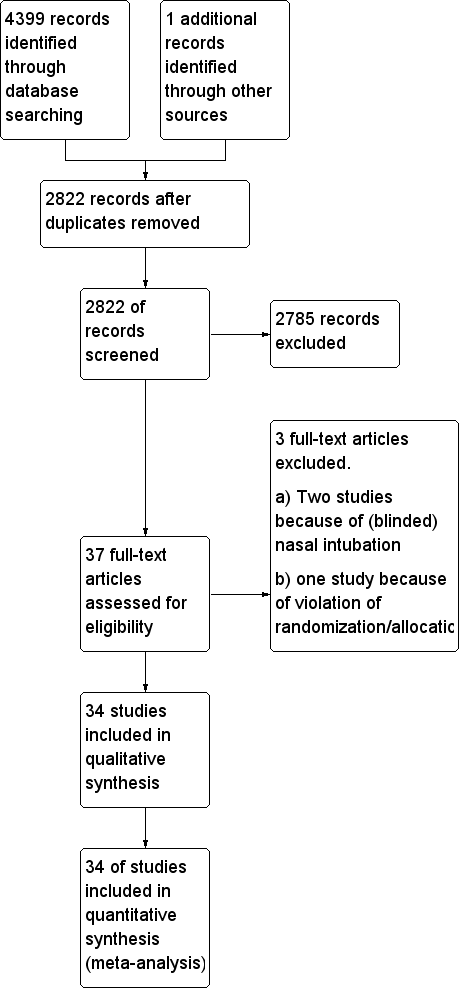
Study flow diagram.
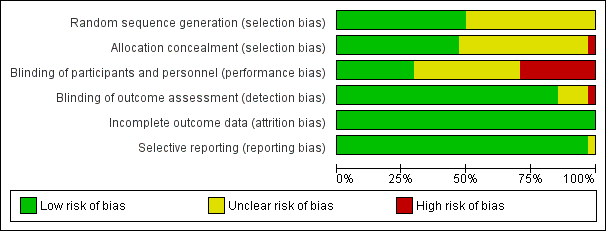
Risk of bias graph: review authors' judgements about each risk of bias item presented as percentages across all included studies.

Funnel plot of comparison: 1 Avoidance vs use of NMBA, outcome: 1.1 Difficult tracheal intubation: low risk of bias vs high or uncertain risk of bias.
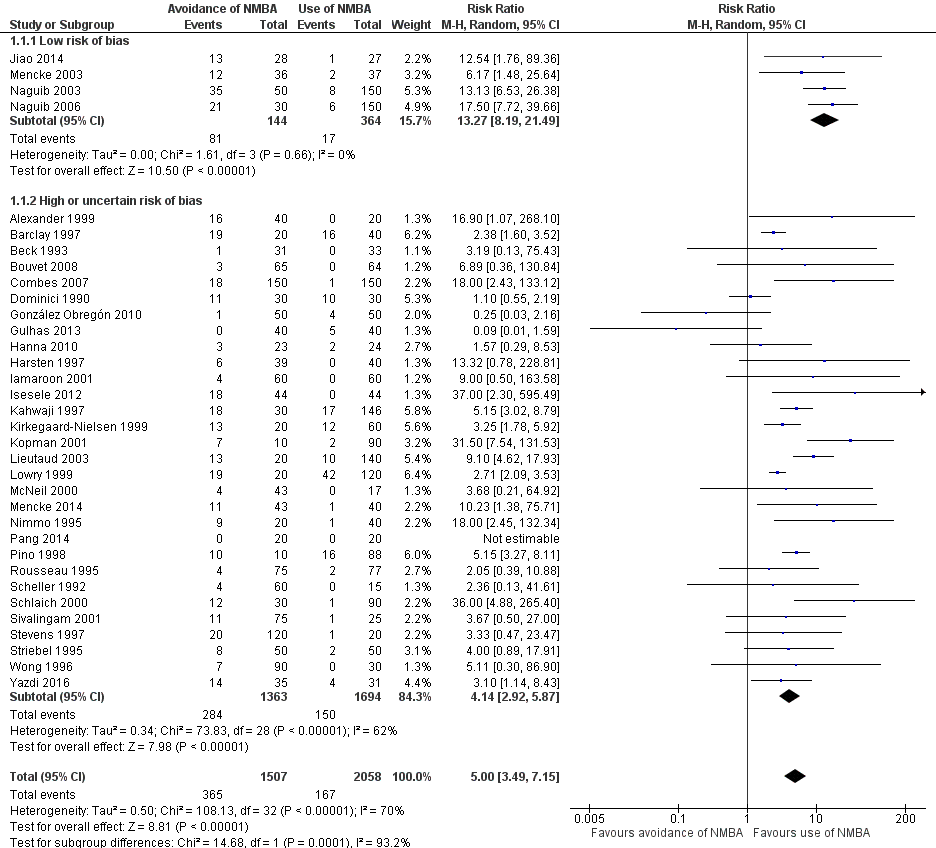

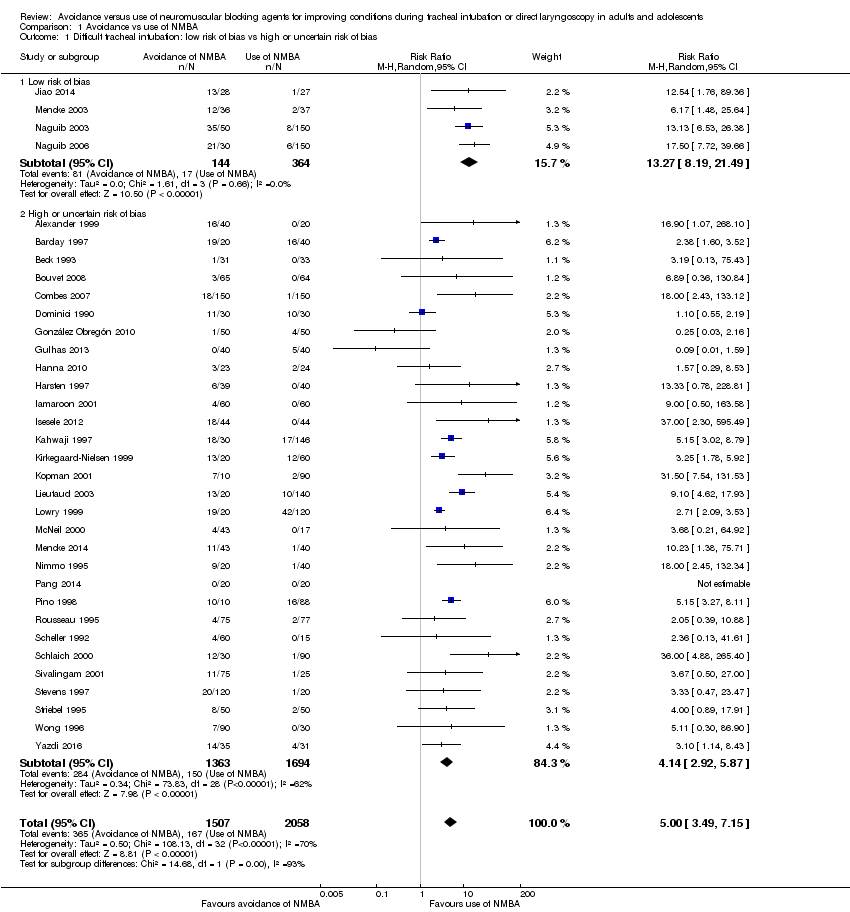
Comparison 1 Avoidance vs use of NMBA, Outcome 1 Difficult tracheal intubation: low risk of bias vs high or uncertain risk of bias.

Comparison 1 Avoidance vs use of NMBA, Outcome 2 Difficult tracheal intubation: depolarizing vs non‐depolarizing NMBA.

Comparison 1 Avoidance vs use of NMBA, Outcome 3 Difficult tracheal intubation: remifentanil vs no remifentanil.
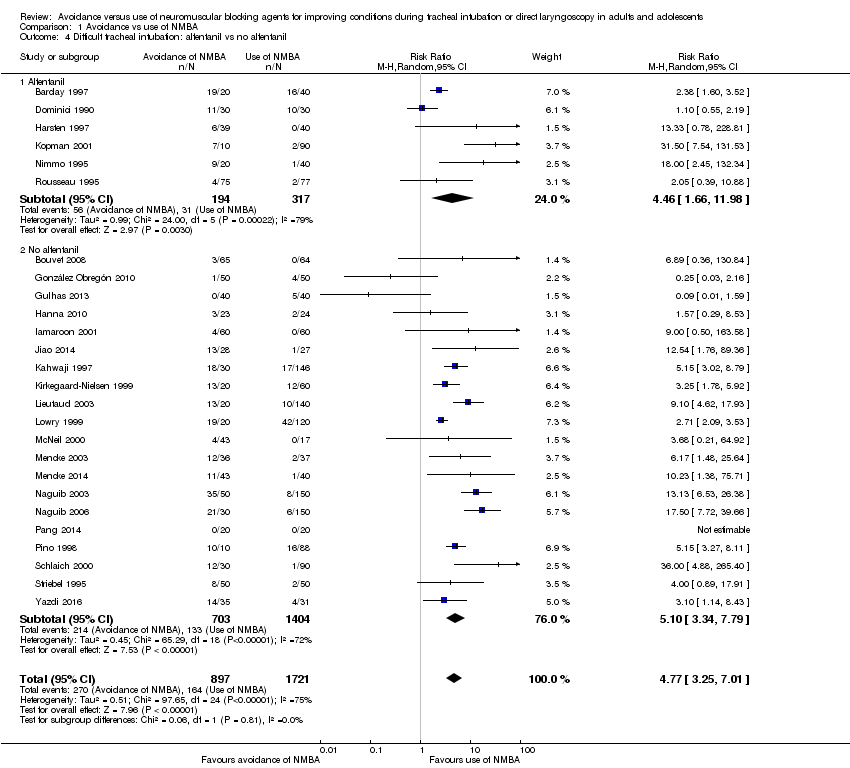
Comparison 1 Avoidance vs use of NMBA, Outcome 4 Difficult tracheal intubation: alfentanil vs no alfentanil.

Comparison 1 Avoidance vs use of NMBA, Outcome 5 Difficult tracheal intubation: local anaesthesia vs no local anaesthesia.

Comparison 1 Avoidance vs use of NMBA, Outcome 6 Difficult tracheal intubation: excluded anticipated DTI vs included anticipated DTI.

Comparison 1 Avoidance vs use of NMBA, Outcome 7 Difficult tracheal intubation: "best‐case scenario".

Comparison 1 Avoidance vs use of NMBA, Outcome 8 Difficult tracheal intubation excluding dose‐finding studies.

Comparison 1 Avoidance vs use of NMBA, Outcome 9 Difficult tracheal intubation: funding from pharmaceutical industry.
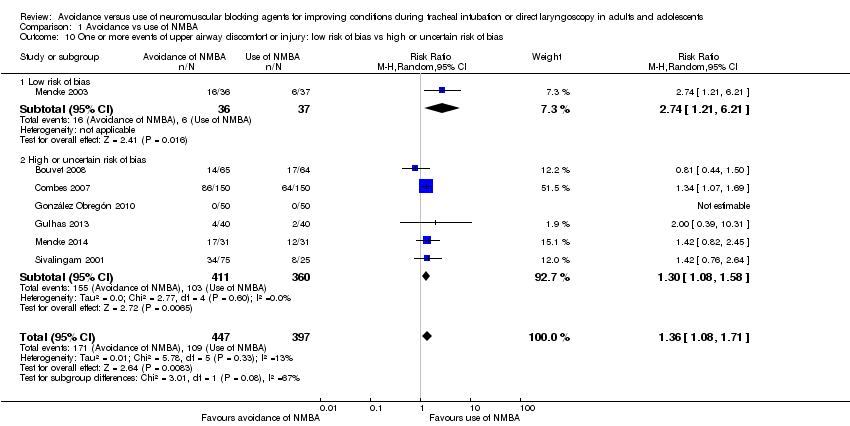
Comparison 1 Avoidance vs use of NMBA, Outcome 10 One or more events of upper airway discomfort or injury: low risk of bias vs high or uncertain risk of bias.
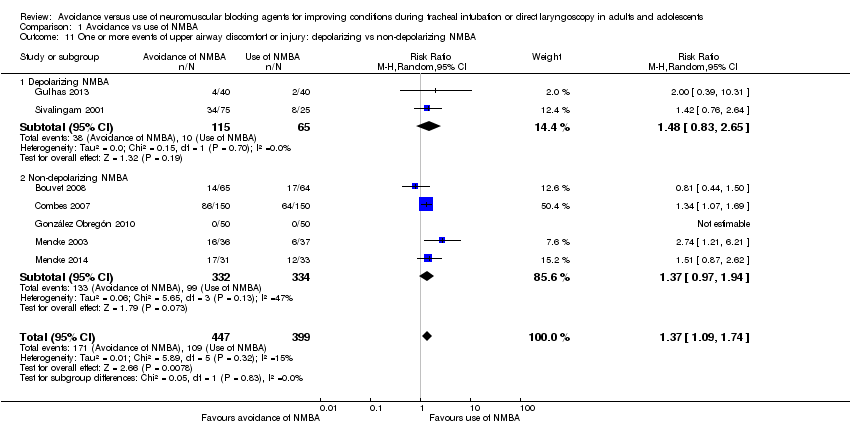
Comparison 1 Avoidance vs use of NMBA, Outcome 11 One or more events of upper airway discomfort or injury: depolarizing vs non‐depolarizing NMBA.
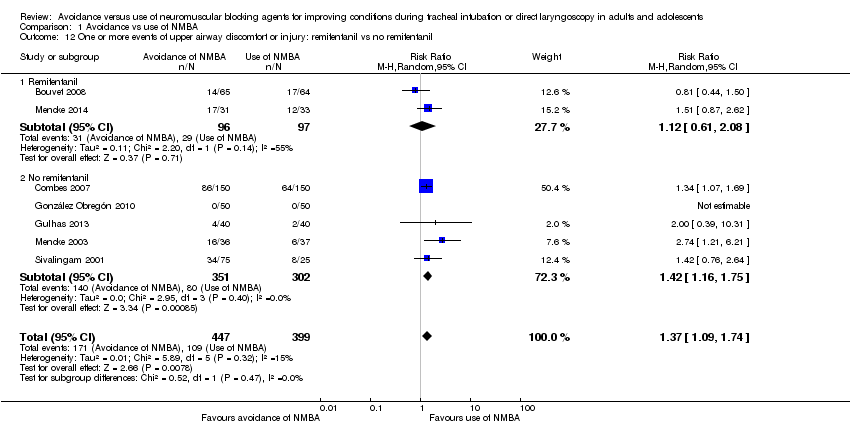
Comparison 1 Avoidance vs use of NMBA, Outcome 12 One or more events of upper airway discomfort or injury: remifentanil vs no remifentanil.
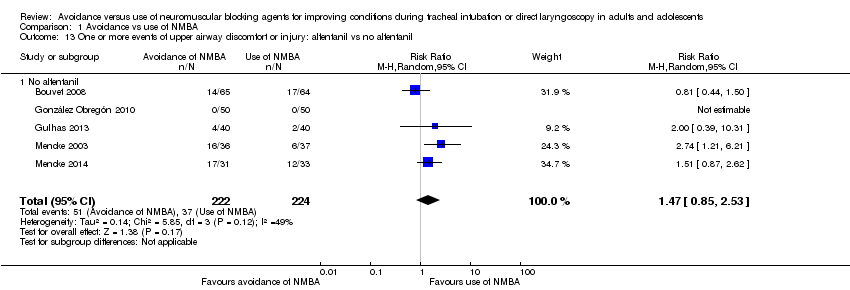
Comparison 1 Avoidance vs use of NMBA, Outcome 13 One or more events of upper airway discomfort or injury: alfentanil vs no alfentanil.
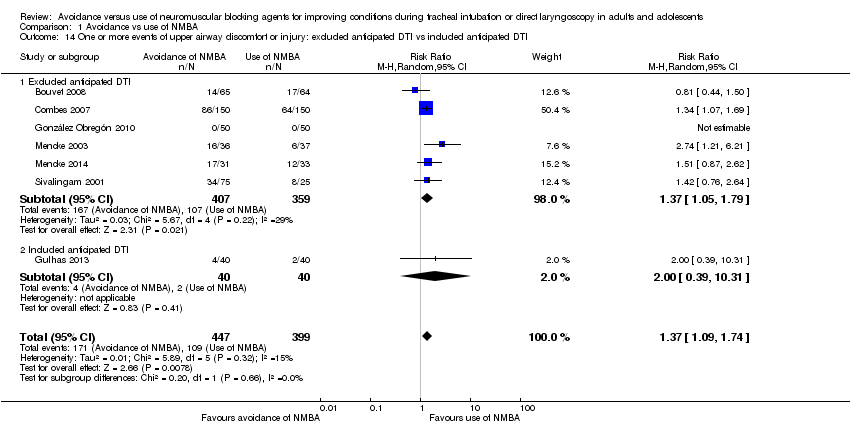
Comparison 1 Avoidance vs use of NMBA, Outcome 14 One or more events of upper airway discomfort or injury: excluded anticipated DTI vs included anticipated DTI.
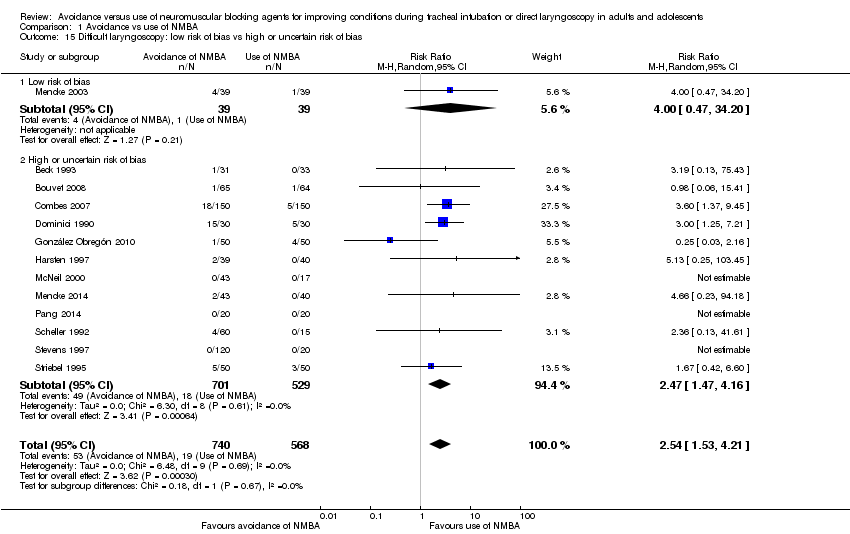
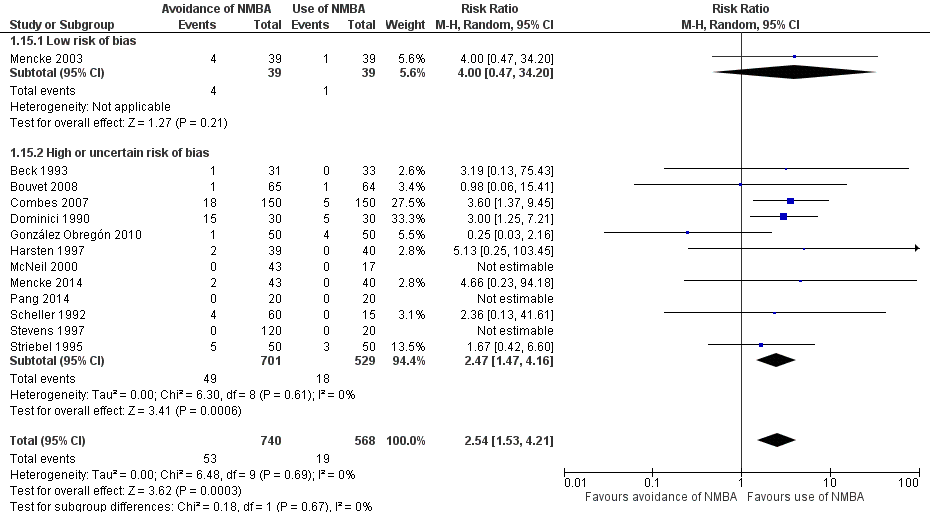
Comparison 1 Avoidance vs use of NMBA, Outcome 15 Difficult laryngoscopy: low risk of bias vs high or uncertain risk of bias.
| Avoidance vs use of neuromuscular blocking agent for improving conditions during tracheal intubation in adults and adolescents | ||||||
| Patient or population: improving conditions during tracheal intubation or direct laryngoscopy in adults and adolescents | ||||||
| Outcomes | Anticipated absolute effects* (95% CI) | Relative effect of avoidance vs use of NMBA | Number of participants | Quality of the evidence | Comments | |
| Assumed risk Risk with use of NMBA | Corresponding risk Risk with avoidance of NMBA | |||||
| Primary outcomes | ||||||
| Difficult tracheal intubation: low risk of bias trials | Study population | RR 13.27 | 508 | ⊕⊕⊕⊝ Moderatea | TSA shows that the required information size of 8195 for a 20% RRR has not been achieved, but the trial sequential monitoring boundary has been crossed and the TSA‐adjusted CI for the RR is 1.85 to 95.04 | |
| 47 per 1000 | 620 per 1000 | |||||
| Difficult tracheal intubation: all trials | Study population | RR 5.00 | 3565 | ⊕⊕⊝⊝ Lowb | TSA shows that the required information size of 44,661 for a 20% RRR has not been achieved, but the trial sequential monitoring boundary has been crossed and the TSA‐adjusted CI for the RR is 1.20 to 20.77. | |
| 81 per 1000 | 406 per 1000 | |||||
| One or more events of upper airway discomfort or injury: low risk of bias trials | Study population | RR 2.74 | 73 | See comments | Because only 1 low risk of bias trial was identified, no quality of evidence assessment was performed | |
| 162 per 1000 | 444 per 1000 | |||||
| One or more events of upper airway discomfort or injury: all trials | Study population | RR 1.37 | 846 | ⊕⊕⊕⊝ Moderatec | TSA shows that the required information size of 1981 for a 20% RRR has not been achieved, but the trial sequential monitoring boundary has been crossed and the TSA‐adjusted CI for the RR is 1.00 to 1.86. | |
| 273 per 1000 | 374 per 1000 | |||||
| Mortality | Not estimated | Not estimated | Not estimated | 0 (34 studies) | Not estimated | |
| Secondary outcomes | ||||||
| Difficult laryngoscopy: low risk of bias trials | Study population | RR 4.00 | 78 | See comments | Because only 1 low risk of bias trial was identified, no quality of evidence assessment was performed | |
| 26 per 1000 | 103 per 1000 | |||||
| Difficult laryngoscopy: all trials | Study population | RR 2.54 | 1308 | ⊕⊕⊝⊝ Lowd | TSA shows that the required information size of 22,911 for a 20% RRR was not achieved, and in no trials were sequential monitoring boundaries crossed. The TSA‐adjusted CI for the RR is 0.27 to 21.75. | |
| 33 per 1000 | 85 per 1000 | |||||
| *The risk in the intervention group (and its 95% confidence interval) is based on assumed risk in the comparison group and the relative effect of the intervention (and its 95% CI) | ||||||
| GRADE Working Group grades of evidence | ||||||
| aDowngraded one level because of indirectness bDowngraded two levels because of indirectness, heterogeneity, and high or uncertain risk of bias cDowngraded one level because of high or uncertain risk of bias dDowngraded two levels because of imprecision and high or uncertain risk of bias | ||||||
| Study ID | NMBA | Country | Language | Randomized | Sex | Age, years | Weight, kg | BMI | ASA class included | Expected difficult airway excluded | Overweight excluded |
| C1: suxamethonium 1 mg/kg | UK | English | 60 | C: 12F/8M I1: 11F/9M I2: 11F/9M | C: 41.7 (17.4) I1: 40.3 (10.6) I2: 44.2 (15.0) | C: 76.3 (15.0) I1: 75.5 (15.1) I2: 76.6 (16.8) | ns | I‐II | yes | ||
| C1: rocuronium 0.1 mg/kg C2: rocuronium 0.13 mg/kg | UK | English | 60 | ns | C1: 30 C2: 29 I1: 27 | C1: 74 C2: 72 I1: 64 | ns | ns | yes | yes | |
| C1: suxamethonium 1 mg/kg | USA | English | 64 | C1: 22F/11M I1: 21F/10M | C1: 34 (11) I1: 35 (11) | C1: 69 (14) I1: 65 (13) | I‐II | ||||
| C1: cisatracurium 0.15 mg/kg | France | English | 130 | C1: 65F I1: 65F | C1: 41.5 (12.9) I1: 40.7 (15.2) | ns | C1: 24.6 (5.4) I1: 23.0 (3.5) | I‐II | yes | ||
| C1: rocuronium 0.6 mg/kg | France | English | 300 | C1: 73F/77M I1: 69F/81M | C1: 41 (18‐70) I1: 43 (18‐66) | C1: 73 (13) I1: 70 (13) | ns | I‐II | yes | yes | |
| C1: suxamethonium 1.5 mg/kg | France | French | 60 | C1: 9F/21M I1: 9F/21M | C1: 48.4 (3.4) I1: 50.1 (2.9) | C1: 62.8 (2.5) I1: 61.6 (2.1) | ns | I‐III | |||
| C1: rocuronium 0.6 mg/kg | Columbia | Spanish | 100 | C1: 33F/17M I1: 33F/17M | C1: 34.7 (11.0) I1: 32.8 (12.3) | ns | ns | I‐II | yes | ||
| C1: succinylcholine 1 mg/kg | Turkey | English | 80 | C1: 19F/21M I1: 22F/18M | C1: 49.6 (8.4) I1: 47.9 (8.7) | C1: 77.3 (13.1) I1: 73.2 (14.4) | ns | I‐II | |||
| C1: rocuronium 0.06 mg/kg + succinylcholine 1.5 mg/kg | USA | English | 50 | C1: 15F/9M I1: 5F/18M | C1: 39.0 (13.3) I1: 43.0 (14.5) | C1: 75.0 (15.0) I1: 81.0 (13.0) | C1: 25.9 (4.6) I1: 26.5 (2.9) | I‐II | yes | ||
| C1: suxamethonium 1 mg/kg | Sweden | English | 80 | C1: 26F/13M I1: 23F/14M | C1: 41.8 (13) I1: 39.5 (14) | ns | ns | I‐II | |||
| C1: suxamethonium 1.5 mg/kg | Thailand | English | 120 | C1: 54F/6M I1: 54F/6M | C1: 40.6 (9.1) I1: 39.7 (9.2) | C1: 55.8 (10.8) I1: 55.1 (9.1) | ns | I‐II | yes | yes | |
| C1: suxamethonium 1.5 mg/kg | Nigeria | English | 96 | C1: 12F/32M I1: 21F/23M | C1: 30.8 (9.0) I1: 32.6 (8.0) | C1. 69.0 (7.4) I1: 68.3 (6.6) | I‐II | yes | |||
| C1: suxamethonium 0.6 mg/kg | China | English | 55 | C1: 27F/0M I1: 28F/0M | C1: 38.4 (10.9) I2: 36.3 (9.9) | C1: 58.1 (7.0) I2: 58.2 (7.9) | ns | I‐II | yes | ||
| C1: ORG 9487 (rapacuronium) 0.5 mg/kg C2: ORG 9487 (rapacuronium) 1.0 mg/kg C3: ORG 9487 (rapacuronium) 1.5 mg/kg C4: ORG 9487 (rapacuronium) 2.0 mg/kg C5: ORG 9487 (rapacuronium) 2.5 mg/kg | USA | English | 181 | C1: 20F/10M C2: 18F/9M C3: 17F/15M C4: 15F/13M C5: 22F/9M I1: 19F/11M | C1: 51.3 C2: 49.6 C3: 52.0 C4: 50.6 C5: 50.2 I1: 52.6 | C1: 67.3 C2: 70.5 C3: 68.6 C4: 71.3 C5: 75.9 I1: 69.7 | ns | I‐III | yes | ||
| C1: rocuronium 0.4 mg/kg C2: rocuronium 0.8 mg/kg C3: rocuronium 1.2 mg/kg | USA | English | 80 | C1: 2F/18M C2: 6F/14M C3: 10F/10M I1: 5F/15M | C1: 39.7 (7.5) C2: 39.5 (14.3) C3: 39.2 (10.5) I1: 39.3 (11.8) | C1: 75.0 (16.9) C2: 78.6 (15.8) C3: 67.4 (14.8) I1: 73.4 (16.6) | ns | I‐II | yes | ||
| C1: rapacuronium 1.0 mg/kg C2: rapacuronium 1.2 mg/kg C3: rocuronium 0.50 mg/kg | USA | English | 100 | ns | range: 18‐65 | ns | range: 17.5‐27.5 | I‐II | yes | ||
| C1: atracurium 0.5 mg/kg C2: atracurium 0.5 mg/kg C3: atracurium 0.5 mg/kg | France | English | 170 | C1: 3F/42M C2: 7F/41M C3: 8F/39M I1: 2F/18M | C1: 52.9 (11.8) C2: 51.3 (12.6) C3: 56.3 (11.9) I1: 50.4 (10.7) | ns | C1: 23.7 (3.2) C2: 23.1 (3.2) C3: 23.6 (3.4) I1: 23.3 (3.9) | I‐II | yes | ||
| C1: rocuronium 0.3 mg/kg C2: rocuronium 0.45 mg/kg C3: rocuronium 0.6 mg/kg C4: rocuronium 0.3 mg/kg C5: rocuronium 0.45 mg/kg C6: rocuronium 0.6 mg/kg | UK | English | 140 | C1: 4F/16M I1: 2F/8M I2: 4F/6M | C1: 29 (11) I1: 29 (11) I2: 30 (9) | C1: 77(16) I1: 72 (12) I2: 73 (15) | ns | I‐II | yes | yes | |
| C1: succinylcholine 1 mg/kg | UK | English | 60 | ns | C1: 44 (15) I1: 39 (11) I2: 40 (13) | C1: 75 (10) I1: 76 (15) I2: 71 (12) | ns | I‐II | yes | yes | |
| C1: atracurium 0.5 mg/kg | Germany | English | 80 | C1: 19F/18M I1: 18F/18M | C1: 47.2 (13.2) I1: 47.7 (14.3) | C1: 77.7 (16) I1: 74.2 (15) | I‐II | yes | yes | ||
| I1: rocuronium 0.45 mg·kg‐1 | Germany | English | 83 | C1: 16F/24M I1: 16F/23M | C1: 50 (16) I1: 48 (17) | C1: 83.8 (16) I1: 79.6 (15) | C1: 28.2 (4.3) I1: 26.5 (3.7) | I‐III | yes | yes | |
| C1: succinylcholine 0.3 mg/kg C2: succinylcholine 0.5 mg/kg C3: succinylcholine 1.0 mg/kg | Saudi Arabia | English | 200 | C1: 25F/25M C2: 23F/27M C3: 28F/22M I1: 23F/27M | C1: 30.9 (28‐34) | C1: 66.6 (64‐70) | ns | I | yes | ||
| C1: succinylcholine 0.3 mg/kg C2: succinylcholine 0.5 mg/kg C3: succinylcholine 1.0 mg/kg C4: succinylcholine 1.5 mg/kg C5: succinylcholine 2.0 mg/kg | Saudi Arabia | English | 180 | C1: 17F13M I1: 19F/11M | C1: 33.5 (8.7) | C1: 67.8 (10.3) | C1: 25.6 (2.8) | I | yes | ||
| C1: suxamethonium 0.25 mg/kg C2: suxamethonium 0.5 mg/kg | USA | English | 60 | C1: 12F/8M C2: 12F/8M I1: 14F/6M | C1: 28.6 (17‐55) C2: 29.0 (16‐53) I1: 27.0 (18‐53) | C1: 66.2 (13.6) C2: 64.4 (11.2) I1: 68.1 (13.6) | ns | I‐II | |||
| C1: cisatracurium 0.1 mg/kg | China | English | 40 | C1: 14F/6M I1: 9F/11M | C1: 45.2 (7.4) I1: 43.3 (6.7) | C1: 63.8 (9.5) I1: 64.6 (7.9) | C1: 23.7 (2.8) I1: 23.3 (3.1) | I‐II | yes | yes | |
| C1: mivacurium 0.25 mg/kg C2: rocuronium 0.45 mg/kg C3: rocuronium 0.6 mg/kg C4: rocuronium 0.9 mg/kg C5: rocuronium 1.2 mg/kg | USA | English | 100 | ns | ns | ns | ns | I‐II | yes | yes | |
| C1: vecuronium 0.08 mg/kg | France | French | 152 | ns | C1: 23 (5) I1: 25 (8) | C1: 71 (10) I1: 71 (11) | ns | I | yes | ||
| C1: d‐tubocurarine 3 mg and succinylcholine 1 mg/kg | USA | English | 75 | C1: 8F/7M I1: 10F/5M I2: 11F/4M I3: 13F/2M I4: 10F/5M | C1: 37 (10) I1: 33 (9) I2: 30 (10) I3: 35 (11) I4: 36 (16) | C1: 77 (20) I1: 65 (11) I2: 66 (15) I3: 66 (12) I4: 68 (16) | ns | I | yes | ||
| C1: rocuronium 0.6 mg/kg C2: rocuronium 0.45 mg/kg C3: rocuronium 0.3 mg/kg | Germany | English | 120 | C1: 13F/17M C2: 13F/17M C3: 14F/16M I1: 14F/16M | C1: 37 (11) C2: 35 (11) C3: 36 (12) I1: 37 (11) | C1: 72 (14) C2: 75 (13) C3: 75 (12) I1: 70 (14) | ns | I‐II | yes | ||
| C1: suxamethonium 1 mg/kg | New Zealand | English | 100 | C1: 7F/18M I1: 9F/16M I2: 8F/17M I3: 10F/15M | C1: 34.3 (14.0) I1: 36.8 (12.6) I2: 29.6 (9.7) I3: 37.7 (12) | C1: 66 (10) I1: 62 (11) I2: 63 (15) I3: 61 (11) | ns | I‐II | yes | ||
| C1: d‐tubocurarine 3 mg and succinylcholine 1 mg/kg | USA | English | 140 | C1: 12F/8M I1: 12F/8M I2: 15F/5M I3: 17F/3M I4: 17F/3M I5: 15F/5M I6: 14F/6M | C1: 35 (9) I1: 38 (12) I2: 34 (11) I3: 37 (10) I4: 34 (9) I5: 33 (11) I6: 37 (14) | C1: 70 (8) I1: 72 (17) I2: 70 (14) I3: 72 (10) I4: 72 (13) I5: 72 (18) I6: 70 (13) | ns | I‐II | yes | yes | |
| C1: vecuronium 1 mg + succinylcholine 1 mg/kg C2: vecuronium 1 mg + succinylcholine 1 mg/kg | Germany | German | 100 | C1: 25F C2: 25F I1: 25F I2: 25F | C1: 47.8 (11.7) C2: 43.8 (9.5) I1: 46.5 (12.7) I2: 46.0 (12.4) | C1: 62.6 (9.4) C2: 68.2 (14) I1: 64.9 (10.1) I2: 70.8 (14.6) | ns | I‐II | |||
| C1: succinylcholine 1 mg/kg | Malaysia | English | 120 | C1: 16F/14M I1: 13F/17M I2: 18F/12M I3: 12F/17M | C1: 35.7 (16) I1: 35.5 (12) I2: 35.4 (13) I3: 35.7 (11) | C1: 60.2 (8.9) I1: 66.0 (13.1) I2: 63.4 (12.9) I3: 60.1 (10.8) | ns | I‐II | yes | ||
| C1: atracurium 0.5 mg/kg | Iran | English | 66 | 69.7% M | 31.6 (13) | ns | ns | I‐II | yes | ||
| ns = not specified; The values in parentheses are standard deviation or range | |||||||||||
| Study ID | NMBA | Randomized/ Analysed | Hypnotic | Opioid | Local anaesthetic | Difficult intubation events/ | Difficult laryngos‐ copy events/ | Upper airway discomfort or injury events/total |
| C1: suxamethonium 1 mg/kg | 60/60 | C1: propofol 2 mg/kg I1: propofol 2 mg/kg I2: propofol 2 mg/kg | C1: none I1: alfentanil 50 μg/kg I2: remifentanil 2 μg/kg | None | C1: 0/20 I1: 3/20 I2: 13/20 | ns | ns | |
| C1: rocuronium 0.1 mg/kg C2: rocuronium 0.3 mg/kg | 60/60 | C1: propofol 2.5 mg/kg C2: propofol 2.5 mg/kg I1: propofol 2.5 mg/kg | C1: alfentanil 10 μg/kg C2: alfentanil 10 μg/kg I1: alfentanil 10 μg/kg | Lidocaine 10 mg IV | C1: 14/20 C2: 2/20 I1: 19/20 | ns | ns | |
| C1: suxamethonium 1 mg/kg | 64/64 | C1: thiopenthal 5 mg/kg I1: propofol 2 mg/mL | C1: none I1: alfentanil 50 μg/kg | None | C1: 0/33 I1: 1/31 | C1: 0/33 I1: 1/31 | ns | |
| C1: cisatracurium 0.15 mg/kg | 130/129 | C1: propofol 2.5 mg/kg I1: propofol 2.5 mg/kg | C1: remifentanil 2 μg/kg I1: remifentanil 2 μg/kg | None | C1: 0/64 I1: 3/65 | C1: 1/64 I1: 1/65 | C1: 17/64 I1: 14/65 | |
| C1: rocuronium 0.6 mg/kg | 300/300 | C1: propofol 2.5 mg/kg I1: propofol 2.5 mg/kg | C1: alfentanil 15 µg/kg I1: alfentanil 40 µg/kg | None | C1: 1/150 I1: 18/150 | C1: 5/150 I1: 18/150 | C1: 64/150 I1: 86/150 | |
| C1: suxamethonium 1.5 mg/kg | 60 | C1: propofol 3 mg/mL I1: propofol 3 mg/mL | C1: alfentanil 7‐10 µg/kg I1: alfentanil 7‐10 µg/kg | Lidocaine (2%): IV + topical Lidocaine 5% | C1: 10/30 I1: 11/30 | C1: 5/30 I1: 15/30 | ns | |
| C1: rocuronium 0.6 mg/kg | 100/100 | C1: propofol 1‐2 mg/kg I1: Sevoflurane 3% + propofol 2 mg/kg | C1: remifentanil 1‐2 μg/kg in 1 min + 0.15 µ/kg/min in1 min I1: remifentanil 0.6 µ/kg/min for 5 min | None | C1: 4/50 I1: 1/50 | C1: 4/50 I1: 1/50 | C1: 0/50 I1: 0/50 | |
| C1: succinylcholine 1 mg/kg | 80/80 | C1: propofol 2 mg/kg I1: propofol 2 mg/kg | C1: remifentanil 1 μg/kg I1: remifentanil 4 μg/kg | None | C1: 5/40 I1: 0/40 | ns | C1: 2/40 I1: 4/40 | |
| C1: rocuronium 0.06 mg/kg + succinylcholine 1.5 mg/kg | 50/47 | C1: propofol 2 mg/kg I1: propofol 2 mg/kg | C1: none I1: remifentanil 4 μg/kg | Lidocaine 0.5 mg/kg IV | C1: 2/24 I1: 3/23 | ns | ns | |
| C1: suxamethonium 1 mg/kg | 80/79 | C1: thiopental 5 mg/kg I1: propofol 2.5 mg/kg | C1: alfentanil 10 μg/kg I1: alfentanil 10 μg/kg | None | C1: 0/40 I1: 6/39 | C1: 0/40 I1: 2/39 | ns | |
| C1: suxamentonium 1.5 mg/kg | 120/120 | C1: thiopenthal 5 mg/kg + (N2O) I1: sevoflurane 8% | C1: fentanyl 1.5 μg/kg I1: fentanyl 1.5 μg/kg | None | C1: 0/60 I1: 4/60 | ns | ns | |
| C1: suxamethonium 1.5 mg/kg | 96/88 | C1: propofol 2.0 mg/kg I1: propofol 2.0 mg/kg | None | C1: none I1: lidocaine IV 1.5 mg/kg | C1: 0/44 I1: 18/44 | ns | ns | |
| C1: suxamethonium 0.6 mg/kg | 55/55 | C1: propofol 2 mg/kg I1: propofol 2 mg/kg | C1: remifentanil 1 μg/kg I1: remifentanil 1.5 μg/kg | None | C1: 1/27 I2: 13/28 | ns | ns | |
| C1: ORG 9487 (rapacuronium) 0.5 mg/kg C2: ORG 9487 (rapacuronium) 1.0 mg/kg C3: ORG 9487 (rapacuronium) 1.5 mg/kg C4: ORG 9487 (rapacuronium) 2.0 mg/kg C5: ORG 9487 (rapacuronium) 2.5 mg/kg | 181/176 | C1: thiopental 3‐6 mg/kg I1: thiopental 3‐6 mg/kg | C1: fentanyl 0.5‐3 μm/kg I1: fentanyl 0.5‐3 μm/kg | None | C1: 9/30 I1: 18/30 | ns | ns | |
| C1: rocuronium 0.4 mg/kg C2: rocuronium 0.8 mg/kg C3: rocuronium 1.2 mg/kg | 80/80 | C1: propofol 2 mg/kg C2: propofol 2 mg/kg C3: propofol 2 mg/kg I1: propofol 2 mg/kg | C1: fentanyl 2 μm/kg C2: fentanyl 2 μm/kg C3: fentanyl 2 μm/kg I1: fentanyl 2 μm/kg | None | C1: 9/20 C2: 2/20 C3: 1/20 I1: 13/20 | ns | ns | |
| C1: rapacuronium 1.0 mg/kg C2: rapacuronium 1.2 mg/kg C3: rocuronium 0.50 mg/kg | 100/100 | C1: propofol 2.0 mg/kg IV C2: propofol 2.0 mg/kg IV C3: propofol 2.0 mg/kg IV I1: propofol 2.0 mg/kg IV | C1: alfentanil 12.5 μg/kg C2: alfentanil 12.5 μg/kg C3: alfentanil 12.5 μg/kg I1: alfentanil 12.5 μg/kg | None | C1: 2/30 C2: 0/30 C3: 0/30 I1: 7/10 | |||
| C1: atracurium 0.5 mg/kg C2: atracurium 0.5 mg/kg C3: atracurium 0.5 mg/kg | 170/160 | C1: propofol 1.5 mg/kg C2: propofol 2.0 mg/kg C3: propofol 2.5 mg/kg I1: propofol 2.5 mg/kg | C1: fentanyl 3 μm/kg C2: fentanyl 3 μm/kg C3: fentanyl 3 μm/kg I1: fentanyl 3 μm/kg | None | C1: 7/47 C2: 1/48 C3: 2/45 I1: 13/20 | ns | ns | |
| C1: rocuronium 0.3 mg/kg C2: rocuronium 0.45 mg/kg C3: rocuronium 0.6 mg/kg C4: rocuronium 0.3 mg/kg C5: rocuronium 0.45 mg/kg C6: rocuronium 0.6 mg/kg | 140/140 | C1: propofol 2‐3 mg/kg C2: propofol 2‐3 mg/kg C3: propofol 2‐3 mg/kg C4: sevoflurane 8% C5: sevoflurane 8% C6: sevoflurane 8% I1: propofol 2‐3 mg/kg I2: sevoflurane 8% | C1: fentanyl 1 μm/kg C2: fentanyl 1 μm/kg C3: fentanyl 1 μm/kg C4: fentanyl 1 μm/kg C5: fentanyl 1 μm/kg C6: fentanyl 1 μm/kg I1: fentanyl 1 μm/kg I2: fentanyl 1 μm/kg | None | C1: 11/20 C2: 4/20 C3: 2/20 C4:14/20 C5: 9/20 C6: 2/20 I1:10/10 I2: 9/10 | ns | ns | |
| C1: succinylcholine 1 mg/kg | 60/60 | C1: propofol 2 mg/kg I1: propofol 2 mg/kg I2: propofol 2 mg/kg | C1: none I1: remifentanil 2 μg/kg I2: remifentanil 4 μg/kg | None | C1: 0/17 I1: 2/23 I2: 2/20 | C1: 0/17 I1: 0/23 I2: 0/20 | ns | |
| C1: atracurium 0.5 mg/kg | 80/73 | C1: propofol 2.5‐3 mg/kg I1: propofol 2.5‐3 mg/kg | C1: fentanyl 2‐3 μg/kg I1: fentanyl 2‐3 μg/kg | None | C1: 2/37 I1: 12/36 | C1: 1/39 I1: 4/39 | C1: 6/37 I1: 16/36 | |
| C1: rocuronium 0.45 mg·kg/kg | 83/83 | C1: propofol 1.5 mg·kg‐1 + sevoflurane 3.0‐3.5 Vol%,8 l·min‐1 in 2‐3 minutes I1: propofol 1.5 mg/kg | C1: remifentanil 0.30 μg/kg/min for 3 minutes I1: remifentanil 0.30 μg/kg/min for 3 minutes | None | C1: 1/40 I1: 11/43 | C1: 0/40 I1: 2/43 | C1: 12/33 I1: 17/31 | |
| C1: succinylcholine 0.3 mg/kg C2: succinylcholine 0.5 mg/kg C3: succinylcholine 1.0 mg/kg | 200/200 | C1: propofol 2 mg/kg C2: propofol 2 mg/kg C3: propofol 2 mg/kg I1: propofol 2 mg/kg | C1: fentanyl 2 μg/kg C2: fentanyl 2 μg/kg C3: fentanyl 2 μg/kg I1: fentanyl 2 μg/kg | None | C1: 4/50 C2: 3/50 C3: 1/50 I1: 15/50 | ns | ns | |
| C1: succinylcholine 0.3 mg/kg C2: succinylcholine 0.5 mg/kg C3: succinylcholine 1.0 mg/kg C4: succinylcholine 1.5 mg/kg C5: succinylcholine 2.0 mg/kg | 180/180 | C1: propofol 2 mg/kg C2: propofol 2 mg/kg C3: propofol 2 mg/kg C4: propofol 2 mg/kg C5: propofol 2 mg/kg I1: propofol 2 mg/kg | C1: fentanyl 2 μm/kg C2: fentanyl 2 μm/kg C3: fentanyl 2 μm/kg C4: fentanyl 2 μm/kg C5: fentanyl 2 μm/kg I1: fentanyl 2 μm/kg | None | C1: 2/30 C2: 2/30 C3: 1/30 C4: 1/30 C5: 0/30 I1: 21/30 | ns | ns | |
| C1: suxamethonium 0.25 mg/kg C2: suxamethonium 0.5 mg/kg | 60/60 | C1: propofol 2.5 mg/kg C2: propofol 2.5 mg/kg I1: Propofol 2.5 mg/kg | C1: alfentanil 15 μg/kg C2: alfentanil 15 μg/kg I1: alfentanil 15 μg/kg | None | C1: 0/20 C2: 1/20 I1: 9/20 | ns | ns | |
| C1: cisatracurium 0.1 mg/kg | 20/20 | C1: propofol target control I1: propofol target control | C1: remifentanil target control I1: remifentanil target control | C1: tetracaine 10 mg/mL I1: tetracaine 10 mg/mL | C1: 0/20 I1: 0/20 | C1: 0/20 I1: 0/20 | ns | |
| C1: mivacurium 0.25 mg/kg C2: rocuronium 0.45 mg/kg C3: rocuronium 0.6 mg/kg C4: rocuronium 0.9 mg/kg C5: rocuronium 1.2 mg/kg | 100/98 | C1: propofol 2 mg/kg C2: propofol 2 mg/kg C3: propofol 2 mg/kg C4: propofol 2 mg/kg C5: propofol 2 mg/kg I1: propofol 2 mg/kg | C1: fentanyl 2 μm/kg C2: fentanyl 2 μm/kg C3: fentanyl 2 μm/kg C4: fentanyl 2 μm/kg C5: fentanyl 2 μm/kg I1: fentanyl 2 μm/kg | None | C1: 2/30 IC2: 9/15 C3: 4/14 C4: 1/14 C5: 0/15 I1: 10/10 | ns | ns | |
| C1: vecuronium 0.08 mg/kg | 152/152 | C1: propofol 2.5 mg/kg I1: propofol 2.5 mg/kg | C1: alfentanil 0.03 mg/kg I1: alfentanil 0.03 mg/kg | C1: none I1: lidocaine 1.5 mg/kg | C1: 2/77 I1: 4/75 | ns | ns | |
| C1: d‐tubocurarine 3 mg and succinylcholine 1 mg/kg | 75/75 | C1: thiamylal 4 mg/kg I1: propofol 2 mg/kg I2: propofol 2 mg/kg I3: propofol 2 mg/kg I4: propofol 2 mg/kg | C1: none I1: alfentanil 30 µg/kg I2: alfentanil 40 µg/kg I3: alfentanil 50 µg/kg I4: alfentanil 60 µg/kg | None | C1: 0/15 I1: 1/15 I2: 1/15 I3: 1/15 I4: 1/15 | C1: 0/15 I1: 1/15 I2: 1/15 I3: 1/15 I4: 1/15 | ns | |
| C1: rocuronium 0.6 mg/kg C2: rocuronium 0.45 mg/kg C3: rocuronium 0.3 mg/kg | 120/120 | C1: propofol 2‐2.5 mg/kg C2: propofol 2‐2.5 mg/kg C3: propofol 2‐2.5 mg/kg I1: propofol 2‐2.5 mg/kg | C1: remifentanil 0.5 µg/kg/min C2: remifentanil 0.5 µg/kg/min IC3: remifentanil 0.5 µg/kg/min I1: remifentanil 0.5 µg/kg/min | None | C1: 0/30 C2: 1/30 C3: 0/30 I1: 12/30 | ns | ns | |
| C1: suxamethonium 1 mg/kg | 100/100 | C1: Sevoflu 7% + N2O60% I1: Sevoflu 7% + N2O60% I2: Sevoflu 7% + N2O60% I3: Sevoflu 7% + N2O60% | C1: alfentanil 10 µg/kg I1: alfentanil 20 µg/kg I2: alfentanil 25 µg/kg I3: alfentanil 30 µg/kg | None | C1: 1/25 I1: 4/25 I2: 5/25 I3: 2/25 | ns | C1: 8/25 I1: 12/25 I2: 13/25 I3: 9/25 | |
| C1: d‐tubocurarine 3 mg and succinylcholine 1 mg/kg | 140/140 | C1: thiopental 4 mg/kg I1: etomidate 0.3 mg/kg I2: etomidate 0.3 mg/kg I3: propofol 2 mg/kg I4: propofol 2 mg/kg I5: thiopental 4 mg/kg I6: thiopental 4 mg/kg | C1: none I1: alfentanil 40 µg/kg I2: alfentanil 40 µg/kg I3: alfentanil 40 µg/kg I4: alfentanil 40 µg/kg I5: alfentanil 40 µg/kg I6: alfentanil 40 µg/kg | C1: none I1: none I2: lidocaine 1 mg/kg I3: none I4: lidocaine 1 mg/kg I5: none I6: lidocaine1 mg/kg | C1: 1/20 I1: 3/20 I2: 1/20 I3: 3/20 I4: 2/20 I5: 8/20 I6: 3/20 | C1: 0/20 I1: 0/20 I2: 0/20 I3: 0/20 I4: 0/20 I5: 0/20 I6: 0/20 | ns | |
| C1: vecuronium 1 mg + succinylcholine 1 mg/kg C2: vecuronium 1 mg + succinylcholine 1 mg/kg | 100/100 | C1: thiopental 5.5 mg/kg C2: propofol 2.2 mg/kg I1: propofol 2.4 mg/kg I2: propofol 2.2 mg/kg | C1: fentanyl 0.1 mg C2: fentanyl 0.1 mg I1: fentanyl 0.1 mg I2: fentanyl 0.2 mg | 2 mL lidocaine 1% IV | C1: 1/25 C2: 1/25 I1: 3/25 I2: 5/25 | C1: 2/25 C2: 1/25 I1: 1/28 I2: 4/25 | ns | |
| C1: succinylcholine 1 mg/kg | 120/120 | C1: propofol 3.0 mg/kg I1: propofol 2.6 mg/kg I2: propofol 2.6 mg/kg I3: propofol 3.1 mg/kg | C1: none I1: alfentanil 15 μg/kg I2: alfentanil 30 μg/kg I3: none | None | C1: 0/30 I1: 1/30 I2: 0/30 I3: 6/30 | ns | ns | |
| C1: atracurium 0.5 mg/kg | 66/66 | C1: propofol 2.5 mg/kg I1: propofol 2.5 mg/kg | C1: none I1: remifentanil 2 μg/kg | None | C1: 4/31 I1: 14/35 | ns | ns | |
| ns = not specified | ||||||||
| Outcome or subgroup title | No. of studies | No. of participants | Statistical method | Effect size |
| 1 Difficult tracheal intubation: low risk of bias vs high or uncertain risk of bias Show forest plot | 34 | 3565 | Risk Ratio (M‐H, Random, 95% CI) | 5.00 [3.49, 7.15] |
| 1.1 Low risk of bias | 4 | 508 | Risk Ratio (M‐H, Random, 95% CI) | 13.27 [8.19, 21.49] |
| 1.2 High or uncertain risk of bias | 30 | 3057 | Risk Ratio (M‐H, Random, 95% CI) | 4.14 [2.92, 5.87] |
| 2 Difficult tracheal intubation: depolarizing vs non‐depolarizing NMBA Show forest plot | 32 | 3413 | Risk Ratio (M‐H, Random, 95% CI) | 5.25 [3.61, 7.63] |
| 2.1 Depolarizing NMBA | 16 | 1540 | Risk Ratio (M‐H, Random, 95% CI) | 5.79 [2.64, 12.72] |
| 2.2 Non‐depolarizing NMBA | 16 | 1873 | Risk Ratio (M‐H, Random, 95% CI) | 4.72 [3.17, 7.02] |
| 3 Difficult tracheal intubation: remifentanil vs no remifentanil Show forest plot | 26 | 3008 | Risk Ratio (M‐H, Random, 95% CI) | 5.64 [3.82, 8.31] |
| 3.1 Remifentanil | 4 | 372 | Risk Ratio (M‐H, Random, 95% CI) | 15.86 [4.43, 56.71] |
| 3.2 No remifentanil | 22 | 2636 | Risk Ratio (M‐H, Random, 95% CI) | 5.23 [3.54, 7.74] |
| 4 Difficult tracheal intubation: alfentanil vs no alfentanil Show forest plot | 26 | 2618 | Risk Ratio (M‐H, Random, 95% CI) | 4.77 [3.25, 7.01] |
| 4.1 Alfentanil | 6 | 511 | Risk Ratio (M‐H, Random, 95% CI) | 4.46 [1.66, 11.98] |
| 4.2 No alfentanil | 20 | 2107 | Risk Ratio (M‐H, Random, 95% CI) | 5.10 [3.34, 7.79] |
| 5 Difficult tracheal intubation: local anaesthesia vs no local anaesthesia Show forest plot | 31 | 3184 | Risk Ratio (M‐H, Random, 95% CI) | 5.04 [3.48, 7.29] |
| 5.1 Local anaesthesia | 5 | 307 | Risk Ratio (M‐H, Random, 95% CI) | 1.90 [1.14, 3.18] |
| 5.2 No local anaesthesia | 26 | 2877 | Risk Ratio (M‐H, Random, 95% CI) | 6.26 [4.15, 9.44] |
| 6 Difficult tracheal intubation: excluded anticipated DTI vs included anticipated DTI Show forest plot | 34 | 3564 | Risk Ratio (M‐H, Random, 95% CI) | 5.00 [3.50, 7.16] |
| 6.1 Exclusion of patients with anticipated difficult intubation | 25 | 2886 | Risk Ratio (M‐H, Random, 95% CI) | 5.32 [3.54, 8.00] |
| 6.2 No exclusion of patients with anticipated difficult intubation | 9 | 678 | Risk Ratio (M‐H, Random, 95% CI) | 4.40 [1.71, 11.29] |
| 7 Difficult tracheal intubation: "best‐case scenario" Show forest plot | 34 | 2410 | Risk Ratio (M‐H, Random, 95% CI) | 5.99 [3.46, 10.38] |
| 8 Difficult tracheal intubation excluding dose‐finding studies Show forest plot | 16 | 1536 | Risk Ratio (M‐H, Random, 95% CI) | 3.40 [1.63, 7.10] |
| 9 Difficult tracheal intubation: funding from pharmaceutical industry Show forest plot | 34 | 3565 | Risk Ratio (M‐H, Random, 95% CI) | 5.00 [3.49, 7.15] |
| 9.1 No funding from pharmaceutical industry | 24 | 2550 | Risk Ratio (M‐H, Random, 95% CI) | 5.33 [3.16, 8.98] |
| 9.2 Funding from pharmaceutical industry | 10 | 1015 | Risk Ratio (M‐H, Random, 95% CI) | 4.10 [2.67, 6.31] |
| 10 One or more events of upper airway discomfort or injury: low risk of bias vs high or uncertain risk of bias Show forest plot | 7 | 844 | Risk Ratio (M‐H, Random, 95% CI) | 1.36 [1.08, 1.71] |
| 10.1 Low risk of bias | 1 | 73 | Risk Ratio (M‐H, Random, 95% CI) | 2.74 [1.21, 6.21] |
| 10.2 High or uncertain risk of bias | 6 | 771 | Risk Ratio (M‐H, Random, 95% CI) | 1.30 [1.08, 1.58] |
| 11 One or more events of upper airway discomfort or injury: depolarizing vs non‐depolarizing NMBA Show forest plot | 7 | 846 | Risk Ratio (M‐H, Random, 95% CI) | 1.37 [1.09, 1.74] |
| 11.1 Depolarizing NMBA | 2 | 180 | Risk Ratio (M‐H, Random, 95% CI) | 1.48 [0.83, 2.65] |
| 11.2 Non‐depolarizing NMBA | 5 | 666 | Risk Ratio (M‐H, Random, 95% CI) | 1.37 [0.97, 1.94] |
| 12 One or more events of upper airway discomfort or injury: remifentanil vs no remifentanil Show forest plot | 7 | 846 | Risk Ratio (M‐H, Random, 95% CI) | 1.37 [1.09, 1.74] |
| 12.1 Remifentanil | 2 | 193 | Risk Ratio (M‐H, Random, 95% CI) | 1.12 [0.61, 2.08] |
| 12.2 No remifentanil | 5 | 653 | Risk Ratio (M‐H, Random, 95% CI) | 1.42 [1.16, 1.75] |
| 13 One or more events of upper airway discomfort or injury: alfentanil vs no alfentanil Show forest plot | 5 | 446 | Risk Ratio (M‐H, Random, 95% CI) | 1.47 [0.85, 2.53] |
| 13.1 No alfentanil | 5 | 446 | Risk Ratio (M‐H, Random, 95% CI) | 1.47 [0.85, 2.53] |
| 14 One or more events of upper airway discomfort or injury: excluded anticipated DTI vs included anticipated DTI Show forest plot | 7 | 846 | Risk Ratio (M‐H, Random, 95% CI) | 1.37 [1.09, 1.74] |
| 14.1 Excluded anticipated DTI | 6 | 766 | Risk Ratio (M‐H, Random, 95% CI) | 1.37 [1.05, 1.79] |
| 14.2 Included anticipated DTI | 1 | 80 | Risk Ratio (M‐H, Random, 95% CI) | 2.0 [0.39, 10.31] |
| 15 Difficult laryngoscopy: low risk of bias vs high or uncertain risk of bias Show forest plot | 13 | 1308 | Risk Ratio (M‐H, Random, 95% CI) | 2.54 [1.53, 4.21] |
| 15.1 Low risk of bias | 1 | 78 | Risk Ratio (M‐H, Random, 95% CI) | 4.0 [0.47, 34.20] |
| 15.2 High or uncertain risk of bias | 12 | 1230 | Risk Ratio (M‐H, Random, 95% CI) | 2.47 [1.47, 4.16] |