Evitación versus uso de agentes bloqueadores neuromusculares para mejorar las condiciones durante la intubación traqueal o la laringoscopia directa en adultos y adolescentes
Appendices
Appendix 1. Cormack and Lehane classification
Difficult laryngoscopy
Cormack and Lehane (Cormack 1984) classification
Grade 1: full view of the glottis.
Grade 2: partial view of the glottis or arytenoids.
Grade 3: only epiglottis visible.
Grade 4: neither glottis nor epiglottis visible.
Laryngoscopy grade 3 and 4 define a difficult laryngoscopy.
Modified Cormack and Lehane (Yentis 1998) classification
Grade 1: full view of the glottis.
Grade 2a: partial view of the glottis.
Grade 2b: arytenoids or posterior part of the vocal cords only just visible.
Grade 3: only epiglottis visible.
Grade 4: neither glottis nor epiglottis visible.
Laryngoscopy grades 2b, 3, and 4 define a difficult laryngoscopy.
Appendix 2. CENTRAL (the Cochrane Library) search strategy
#1 MeSH descriptor: [Neuromuscular Blocking Agents] explode all trees
#2 MeSH descriptor: [Muscle Relaxants, Central] explode all trees
#3 (suxameton or rapacuronium or mivacurium or atracurium or doxacurium or cisatracurium or vecuronium or rocuronium or pancuronium or tubocurarine or gallamine or pipecuronium):ti,ab)
#4 #1 or #2 or #3
#5 MeSH descriptor: [Laryngoscopy] explode all trees
#6 MeSH descriptor: [Intubation, Intratracheal] explode all trees
#7 (difficult near (intubat* or laryngoscopy or airway))
#8 (Intubation near (score or scale))
#9 Cormack or Lehane
#10 ((tracheal near intub*) or airway or laryngoscopy):ti
#11 #5 or #6 or #7 or #8 or #9 or #10
#12 #4 and #11
Appendix 3. MEDLINE (Ovid SP) search strategy
1 exp Neuromuscular Blocking Agents/ or Muscle Relaxants, Central/ or (suxamethonium or rapacuronium or mivacurium or atracurium or doxacurium or cisatracurium or vecuronium or rocuronium or pancuronium or tubocurarine or gallamine or pipecuronium).ti,ab.
2 Laryngoscopy/ or Intubation, Intratracheal/ or (difficult adj3 (intubat* or laryngoscopy or airway)).mp. or ((Intubation adj3 (score or scale)) or (Cormack or Lehane)).mp. or ((tracheal adj3 intub*) or airway or laryngoscopy).ti.
3 1 and 2
4 ((randomized controlled trial or controlled clinical trial).pt. or randomized.ab. or placebo.ab. or drug therapy.fs. or randomly.ab. or trial.ab. or groups.ab.) not (animals not (humans and animals)).sh.
5 3 and 4
Appendix 4. Embase (Ovid SP) search strategy
1. exp neuromuscular blocking agent/ or central muscle relaxant/ or (suxameton or rapacuronium or mivacurium or atracurium or doxacurium or cisatracurium or vecuronium or rocuronium or pancuronium or tubocurarine or gallamine or pipecuronium).ti,ab.
2. laryngoscopy/ or endotracheal intubation/ or (difficult adj3 (intubat* or laryngoscopy or airway)).mp. or ((Intubation adj3 (score or scale)) or (Cormack or Lehane)).mp. or ((tracheal adj3 intub*) or airway or laryngoscopy).ti.
3. 1 and 2
4. (placebo.sh. or controlled study.ab. or random*.ti,ab. or trial*.ti,ab. or ((singl* or doubl* or trebl* or tripl*) adj3 (blind* or mask*)).ti,ab.) not (animals not (humans and animals)).sh.
5. 3 and 4
Appendix 5. BIOSIS Citation Index
#1 TS=Neuromuscular Blocking or TS=Muscle Relaxant* or TS=(suxameton or rapacuronium or mivacurium or atracurium or doxacurium or cisatracurium or vecuronium or rocuronium or pancuronium or tubocurarine or gallamine or pipecuronium)
#2 TS=(Cormack or Lehane) or TS=(difficult SAME (intubat* or laryngoscopy or airway)) or TS=(Intubation SAME (score or scale)) or TI=((tracheal and intub*) or airway or laryngoscopy)
#3 #2 AND #1
#4 TS=(random* or (controlled SAME (study or trial*)) or prospective or placebo or multicenter) or TS=((mask* or blind*) SAME (single or double or triple or treble))
#5 #3 and #4
Appendix 6. CINAHL (EBSCO) search strategy
S1 ((MH "Neuromuscular Blocking Agents") OR (MH "Muscle Relaxants, Central") ) OR AB ( suxameton or rapacuronium or mivacurium or atracurium or doxacurium or cisatracurium or vecuronium or rocuronium or pancuronium or tubocurarine or gallamine or pipecuronium)
S2 ((MH "Laryngoscopy") OR (MH "Intubation, Intratracheal")) OR ((difficult and (intubat* or laryngoscopy or airway))) OR ( (Intubation and (score or scale))) OR (Cormack or Lehane) OR TI ((tracheal and intub*) or airway or laryngoscopy)
S3 S2 and S1
Appendix 7. LILACS (BIREME) serach strategy
((Neuromuscular Blocking Agent$) or Muscle Relaxant$ or (suxameton or rapacuronium or mivacurium or atracurium or doxacurium or cisatracurium or vecuronium or rocuronium or pancuronium or tubocurarine or gallamine or pipecuronium)) and ((Cormack or Lehane) or (difficult and (intubate$ or laryngoscopy or airway)) or (Intubation and (score or scale)) or ((tracheal and intub$) or airway or laryngoscopy))
Appendix 8. Data extraction form
Study selection, quality assessment, and data extraction form
| First study author | Journal/Conference proceedings, etc. | Year |
|
|
|
|
Study eligibility
| RCT | Relevant participants | Relevant interventions | Relevant outcomes |
|
Yes/No/Unclear |
Yes/No/Unclear |
Yes/No/Unclear |
Yes/No*/Unclear
|
Issue relates to selective reporting when study authors may have taken measurements for particular outcomes, but not reported these within the paper(s). Review authors should contact trialists for information on possible non‐reported outcomes and reasons for exclusion from publication. Study should be listed in ‘Studies awaiting assessment’ until clarified. If no clarification is received after three attempts, study should then be excluded.
| Do not proceed if any of the above answers are ‘No’. If study is to be included in ‘Excluded studies’ section of the review, record below the information to be inserted into the ‘Table of excluded studies’. |
|
|
|
Freehand space for comments on study design and treatment: |
References to trial
Check other references identified in searches. If further references to this trial are available, link the papers now and list below. All references to a trial should be linked under one Study ID in RevMan.
| Code each paper | Study author(s) | Journal/Conference proceedings, etc. | Year |
| A | The paper listed above |
|
|
| B | Further papers |
|
|
| C |
|
|
|
| D |
|
|
|
| E |
|
|
|
Participants and trial characteristics
| Participant characteristics | |
| Covariate | Further details |
| Age (mean, median, range, etc.) |
|
| Sex of participants (numbers/%, etc.) |
|
| BMI (mean, median, range, etc.) |
|
Trial characteristics
Methodological quality
| Random sequence generation | |
| State here method used to generate random sequence and reasons for grading | Grade (circle) |
|
| Low risk of bias (random) |
| High risk of bias (e.g. alternate) | |
| Unclear | |
| Allocation concealment Process used to prevent foreknowledge of group assignment in an RCT, which should be seen as distinct from blinding | |
| State here method used to conceal allocation and reasons for grading | Grade (circle) |
|
| Low risk of bias |
| High risk of bias | |
| Unclear | |
| Blinding |
| |
| Person responsible for participant care | Low risk/High risk/Unclear risk |
|
| Participant | Low risk/High risk/Unclear risk |
|
| Outcome assessor | Low risk/High risk/Unclear risk |
|
| Other (please specify) | Low risk/High risk/Unclear risk |
|
| Incomplete outcome data |
| |
| Low risk, if numbers and reasons for dropouts and withdrawals in the intervention groups were described, or if it was specified that no dropouts or withdrawals occurred | Yes/No |
|
| High risk, if numbers or reasons for dropouts and withdrawals were not described | Yes/No |
|
| Unclear, if the report gave the impression that no dropouts or withdrawals had occurred, but did not specifically state this | Yes/No |
|
| Selective reporting |
| |
| Low risk, if predefined or clinically relevant and reasonably expected outcomes are reported | Yes/No |
|
| High risk, if one or more clinically relevant and reasonably expected outcomes were not reported; data on these outcomes were likely to have been recorded | Yes/No |
|
| Unclear, if not all predefined or clinically relevant and reasonably expected outcomes are reported, or if they are not reported fully, or if it is unclear whether data on these outcomes were recorded | Yes/No |
|
| Baseline imbalance |
| |
| Low risk, if no baseline imbalance in important characteristics is evident | Yes/No |
|
| High risk, if a baseline imbalance is due to chance or is due to imbalanced exclusion after randomization | Yes/No |
|
| Unclear, if baseline characteristics were not reported | Yes/No |
|
| Early stopping |
| |
| Low risk, if sample size calculation was reported and the trial was not stopped, or if the trial was stopped early by formal stopping rules at a point when the likelihood of observing an extreme intervention effect due to chance was low | Yes/No |
|
| High risk, if the trial was stopped early owing to informal stopping rules, or if the trial was stopped early by a formal stopping rule at a point when the likelihood of observing an extreme intervention effect due to chance was high | Yes/No |
|
| Unclear, if sample size calculation was not reported and it is not clear whether the trial was stopped early | Yes/No |
|
| Other bias |
| |
| Low risk of bias, if the trial appears to be free of other components that could put it at risk of bias | Yes/No |
|
| High risk of bias, if other factors in the trial could put it at risk of bias (e.g. ’for‐profit’ involvement, authors have conducted trials on the same topic) | Yes/No |
|
| Unclear, if the trial may or may not be free of other components that could put it at risk of bias | Yes/No |
|
| Modified intention‐to‐treat A modified intention‐to‐treat analysis is one in which all participants in a trial are operated and analysed according to the intervention to which they were allocated, whether or not they received it |
|
|
| All participants entering trial after surgery |
| |
| 15% or fewer excluded |
|
|
| More than 15% excluded |
|
|
| Not analysed as modified ‘intention‐to‐treat’ |
|
|
| Unclear |
|
|
|
|
|
|
Were withdrawals described? Yes ? No ? Not clear ?
Discuss if appropriate
| Trial characteristics | |
|
| Further details |
| Single‐centre/Multi‐centre |
|
| Country/Countries |
|
| How was participant eligibility defined?
|
|
| How many participants were randomized? |
|
| Number of intervention groups/number of control groups |
|
| Number of participants in each intervention group/Number of participants in each control group |
|
| Number of participants who received intended intervention (per‐protocol population) |
|
| Number of participants who were analysed |
|
| Type of outcome measure (DTI/DL?)
|
|
| NMBA: type and dose? |
|
| Hypnotic: type and dose |
|
| Opioid: type and dose |
|
| Local anaesthetic: type and dose |
|
| Other |
|
* If cross‐over design, please refer to the Cochrane Editorial Office for further advice on how to analyse these data
Other design characteristics of the trial
1. Mallampati score (predicts DTI/DL Yes/No??)
2. Thyromental distance (predicts DTI/DL Yes/No??) or (cm)
3. Neck extension (predicts DTI/DL Yes/No??) or (degrees)
4. Mouth opening/Interincisor gap (predicts DTI/DL Yes/No??) or (cm)
5. Mandible subluxation (predicts DTI/DL Yes/No??)
6. Time from induction to start of tracheal intubation (seconds)
Data extraction
| Outcomes | Available for the trial |
| 1.1 Difficult tracheal intubation | Yes/No |
| 1.2 Overall mortality. We will use the maximal follow‐up data from each trial | Yes/No |
| 1.3. One or more events of upper airway discomfort/injury (e.g. sore throat, hoarseness, vocal cord lesion, minor pharyngeal injury) | Yes/No |
| 2.1. One or more major serious events: gastric aspiration, brain and heart injuries (e.g. caused by anoxia, hypotension, bradycardia/tachycardia during tracheal intubation) | Yes/No |
| 2.2 Difficult laryngoscopy | Yes/No |
| For continuous data | |||||||
|
Code of paper |
Outcomes (rename)
|
Unit of measurement | Intervention group | Control group | Details if outcome described only in text | ||
| n | Mean (SD) | n | Mean (SD) |
| |||
| A | 1.1 Difficulty of tracheal intubation | Score |
|
|
|
|
|
| For dichotomous data | |||
| Code of paper | Outcomes | Intervention group E/N E = number of events N = number of participants | Control group E/N E = number of events N = number of participants |
| A | 1.1 Difficult tracheal intubation |
|
|
|
| 1.2 Overall mortality. We will use the maximal follow‐up data from each trial |
|
|
|
| 1.3. One or more events of upper airway discomfort/injury (e.g. sore throat, hoarseness, vocal cord lesion, minor pharyngeal injury) |
|
|
|
| 2.1. One or more major serious events: gastric aspiration, brain and heart injuries (e.g. caused by anoxia, hypotension, bradycardia/tachycardia during tracheal intubation) |
|
|
| 2.2 Difficult laryngoscopy | |||
| Other information that you believe is relevant to the results Indicate if any data were obtained from the primary author; if results were estimated from graphs, etc. or were calculated by using a formula (this should be stated and the formula given). In general, if results not reported in paper(s) are obtained, this should be made clear here to be cited in the review | ||
|
|
|
|
| Mallampati score | Predicts DTI/DL (numbers/% of participants) | |
| Thyromental distance | Predicts DTI/DL (numbers/% of participants) | cm (mean, median, range, etc.) |
| Neck extension | Predicts DTI/DL (numbers/% of participants) | degrees (mean, median, range, etc.) |
| Mouth opening/Interincisor gap | Predicts DTI/DL (numbers/% of participants) | cm (mean, median, range, etc.) |
| Mandible subluxation | Predicts DTI/DL (numbers/% of participants) | |
| Time from induction to start of tracheal intubation | seconds (mean, median, range, etc.) | |
|
| ||
| Freehand space for writing actions such as contact with study authors and changes |
References to other trials
| Did this report include any references to published reports of potentially eligible trials not already identified for this review? | ||
| First study author | Journal/Conference | Year of publication |
|
|
|
|
| Did this report include any references to unpublished data from potentially eligible trials not already identified for this review? If yes, list contact names and details | ||
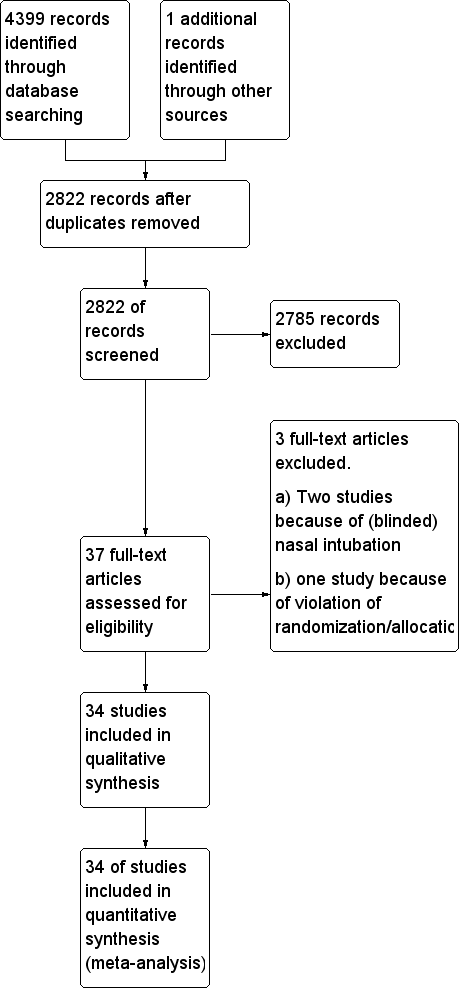
Study flow diagram.
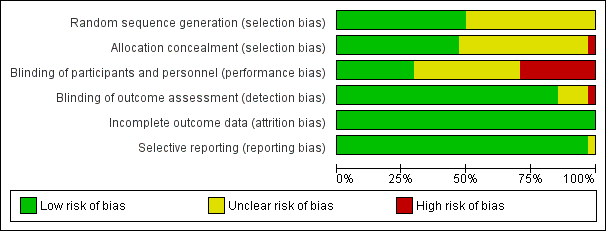
Risk of bias graph: review authors' judgements about each risk of bias item presented as percentages across all included studies.

Funnel plot of comparison: 1 Avoidance vs use of NMBA, outcome: 1.1 Difficult tracheal intubation: low risk of bias vs high or uncertain risk of bias.
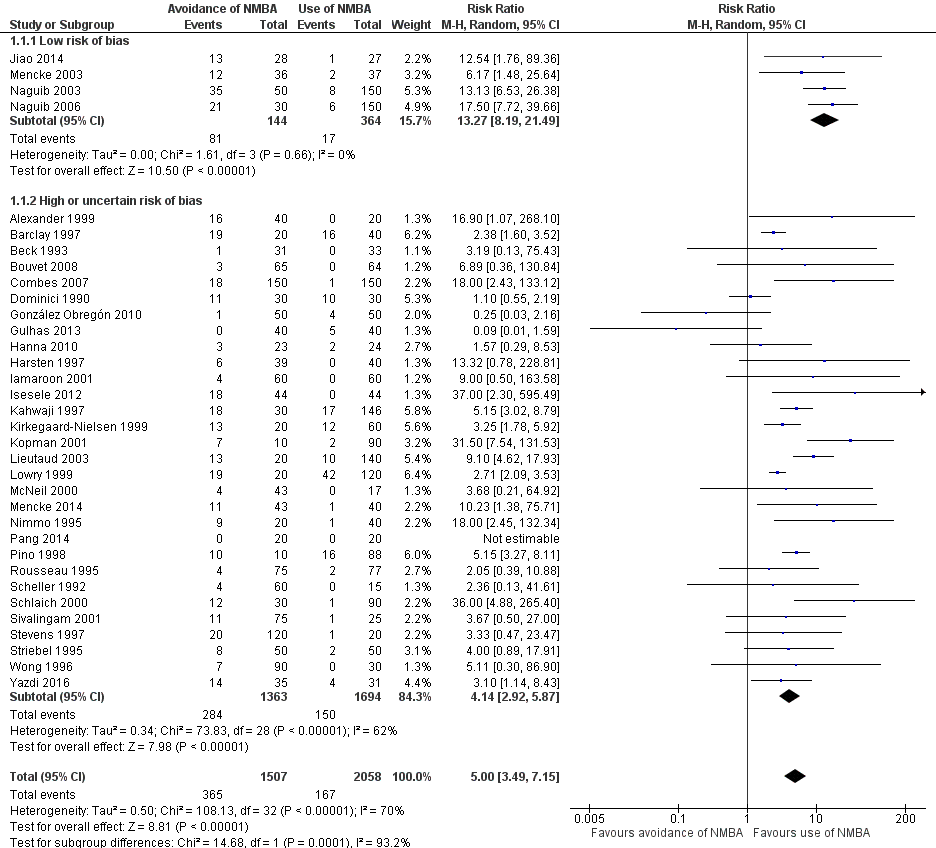

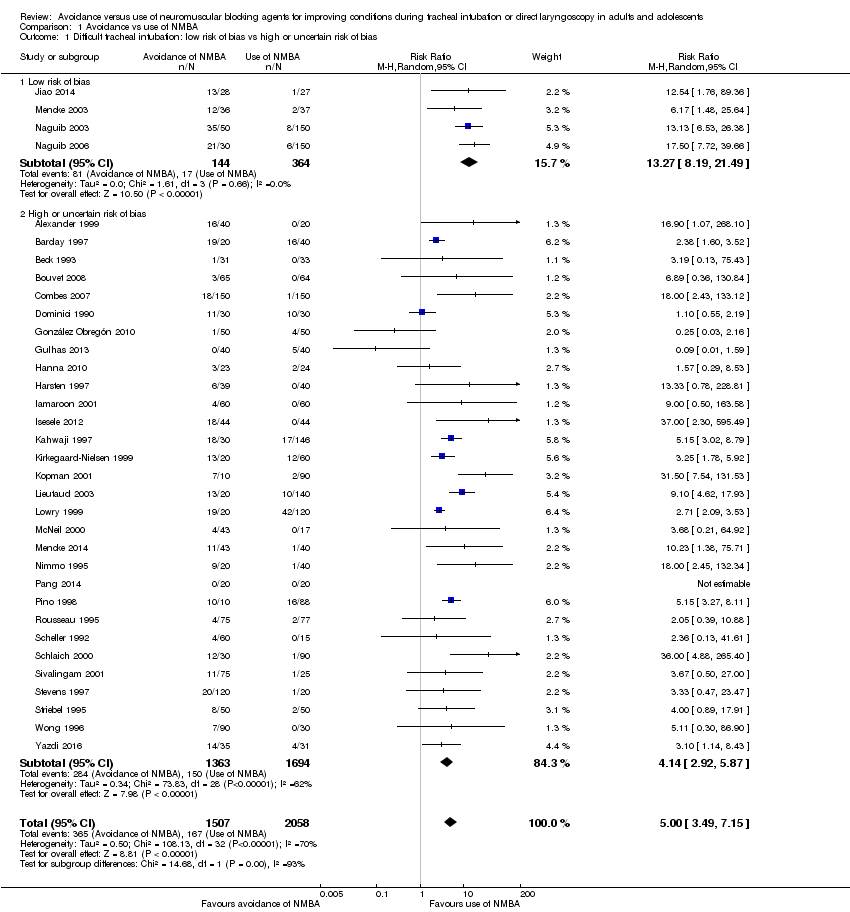
Comparison 1 Avoidance vs use of NMBA, Outcome 1 Difficult tracheal intubation: low risk of bias vs high or uncertain risk of bias.

Comparison 1 Avoidance vs use of NMBA, Outcome 2 Difficult tracheal intubation: depolarizing vs non‐depolarizing NMBA.

Comparison 1 Avoidance vs use of NMBA, Outcome 3 Difficult tracheal intubation: remifentanil vs no remifentanil.
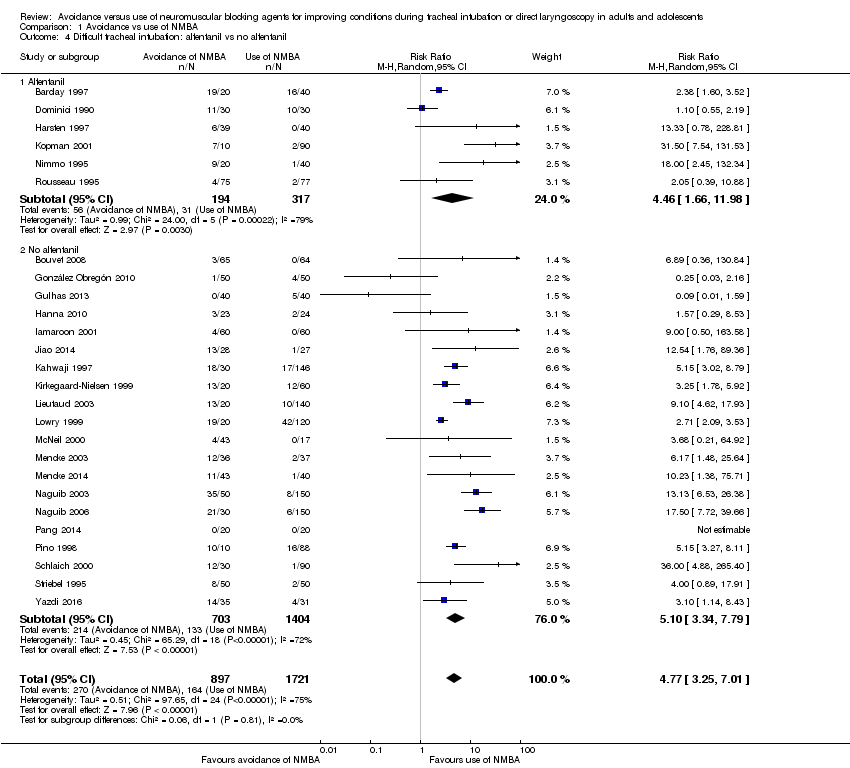
Comparison 1 Avoidance vs use of NMBA, Outcome 4 Difficult tracheal intubation: alfentanil vs no alfentanil.

Comparison 1 Avoidance vs use of NMBA, Outcome 5 Difficult tracheal intubation: local anaesthesia vs no local anaesthesia.

Comparison 1 Avoidance vs use of NMBA, Outcome 6 Difficult tracheal intubation: excluded anticipated DTI vs included anticipated DTI.

Comparison 1 Avoidance vs use of NMBA, Outcome 7 Difficult tracheal intubation: "best‐case scenario".

Comparison 1 Avoidance vs use of NMBA, Outcome 8 Difficult tracheal intubation excluding dose‐finding studies.

Comparison 1 Avoidance vs use of NMBA, Outcome 9 Difficult tracheal intubation: funding from pharmaceutical industry.
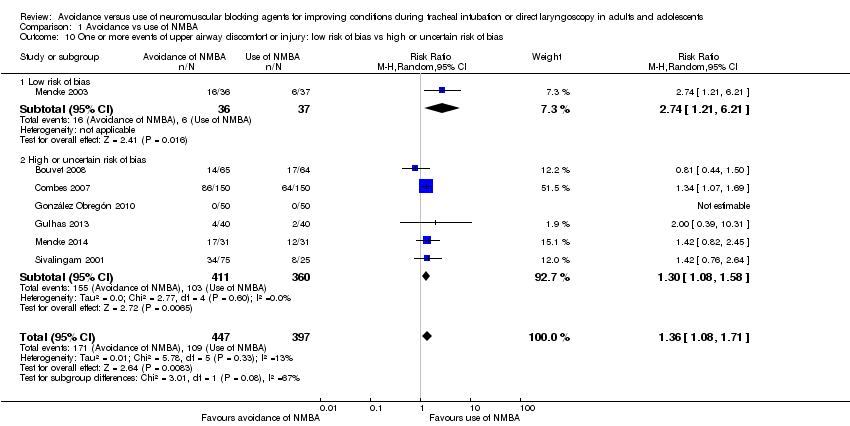
Comparison 1 Avoidance vs use of NMBA, Outcome 10 One or more events of upper airway discomfort or injury: low risk of bias vs high or uncertain risk of bias.
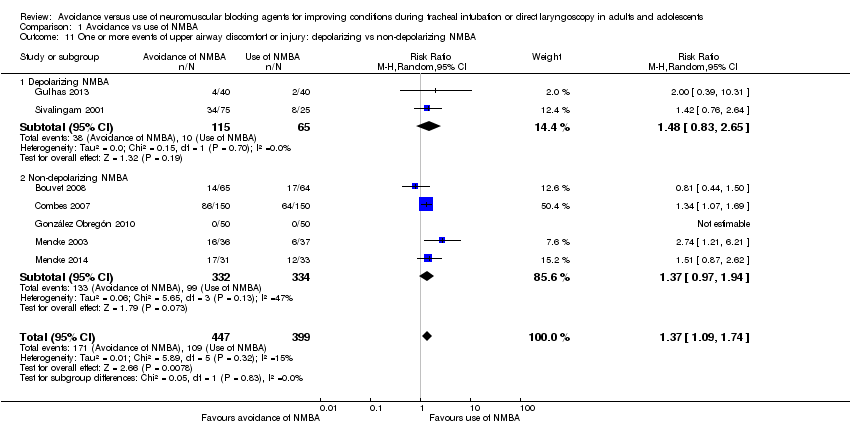
Comparison 1 Avoidance vs use of NMBA, Outcome 11 One or more events of upper airway discomfort or injury: depolarizing vs non‐depolarizing NMBA.
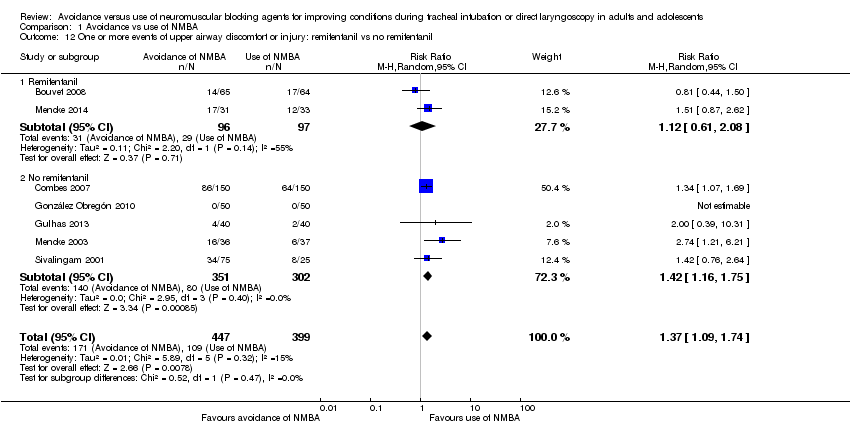
Comparison 1 Avoidance vs use of NMBA, Outcome 12 One or more events of upper airway discomfort or injury: remifentanil vs no remifentanil.
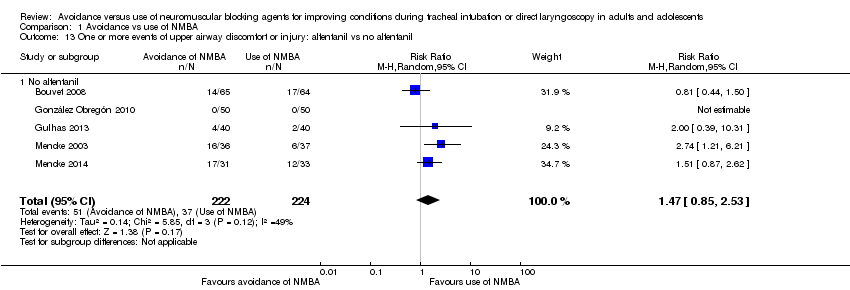
Comparison 1 Avoidance vs use of NMBA, Outcome 13 One or more events of upper airway discomfort or injury: alfentanil vs no alfentanil.
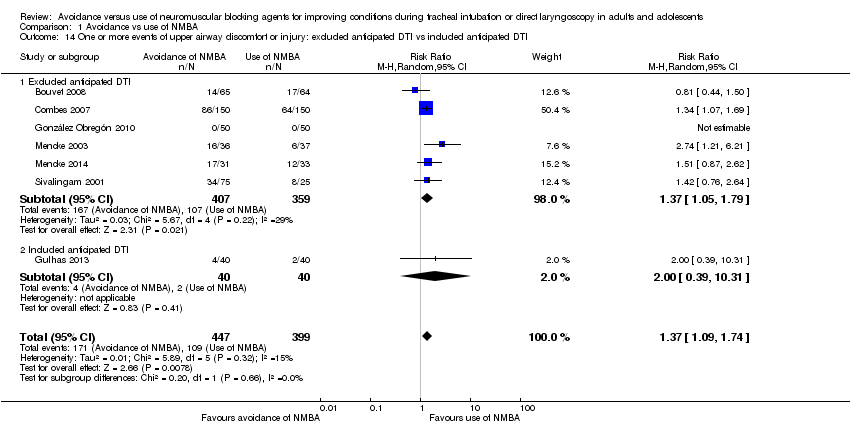
Comparison 1 Avoidance vs use of NMBA, Outcome 14 One or more events of upper airway discomfort or injury: excluded anticipated DTI vs included anticipated DTI.
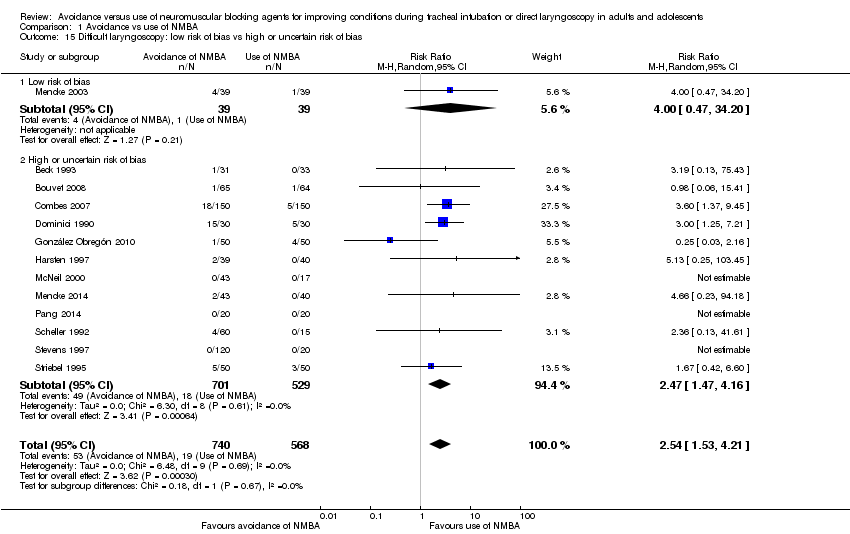
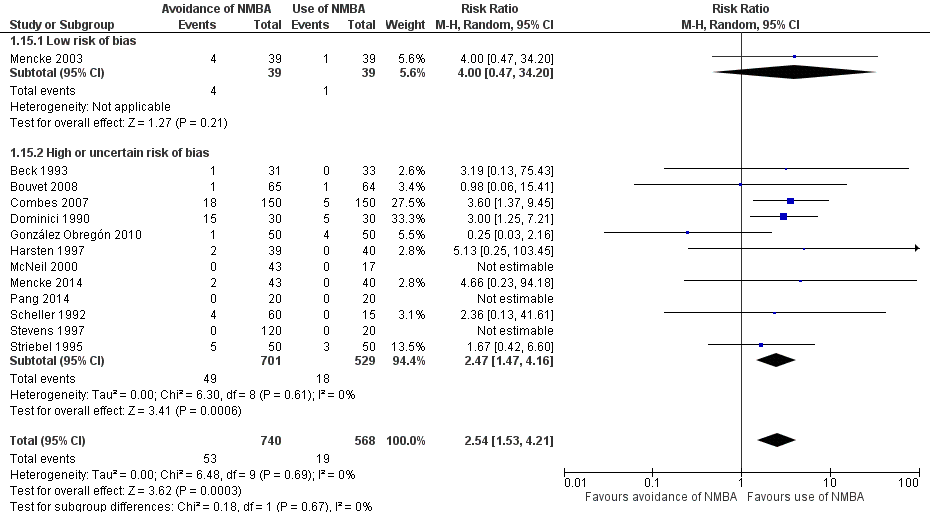
Comparison 1 Avoidance vs use of NMBA, Outcome 15 Difficult laryngoscopy: low risk of bias vs high or uncertain risk of bias.
| Avoidance vs use of neuromuscular blocking agent for improving conditions during tracheal intubation in adults and adolescents | ||||||
| Patient or population: improving conditions during tracheal intubation or direct laryngoscopy in adults and adolescents | ||||||
| Outcomes | Anticipated absolute effects* (95% CI) | Relative effect of avoidance vs use of NMBA | Number of participants | Quality of the evidence | Comments | |
| Assumed risk Risk with use of NMBA | Corresponding risk Risk with avoidance of NMBA | |||||
| Primary outcomes | ||||||
| Difficult tracheal intubation: low risk of bias trials | Study population | RR 13.27 | 508 | ⊕⊕⊕⊝ Moderatea | TSA shows that the required information size of 8195 for a 20% RRR has not been achieved, but the trial sequential monitoring boundary has been crossed and the TSA‐adjusted CI for the RR is 1.85 to 95.04 | |
| 47 per 1000 | 620 per 1000 | |||||
| Difficult tracheal intubation: all trials | Study population | RR 5.00 | 3565 | ⊕⊕⊝⊝ Lowb | TSA shows that the required information size of 44,661 for a 20% RRR has not been achieved, but the trial sequential monitoring boundary has been crossed and the TSA‐adjusted CI for the RR is 1.20 to 20.77. | |
| 81 per 1000 | 406 per 1000 | |||||
| One or more events of upper airway discomfort or injury: low risk of bias trials | Study population | RR 2.74 | 73 | See comments | Because only 1 low risk of bias trial was identified, no quality of evidence assessment was performed | |
| 162 per 1000 | 444 per 1000 | |||||
| One or more events of upper airway discomfort or injury: all trials | Study population | RR 1.37 | 846 | ⊕⊕⊕⊝ Moderatec | TSA shows that the required information size of 1981 for a 20% RRR has not been achieved, but the trial sequential monitoring boundary has been crossed and the TSA‐adjusted CI for the RR is 1.00 to 1.86. | |
| 273 per 1000 | 374 per 1000 | |||||
| Mortality | Not estimated | Not estimated | Not estimated | 0 (34 studies) | Not estimated | |
| Secondary outcomes | ||||||
| Difficult laryngoscopy: low risk of bias trials | Study population | RR 4.00 | 78 | See comments | Because only 1 low risk of bias trial was identified, no quality of evidence assessment was performed | |
| 26 per 1000 | 103 per 1000 | |||||
| Difficult laryngoscopy: all trials | Study population | RR 2.54 | 1308 | ⊕⊕⊝⊝ Lowd | TSA shows that the required information size of 22,911 for a 20% RRR was not achieved, and in no trials were sequential monitoring boundaries crossed. The TSA‐adjusted CI for the RR is 0.27 to 21.75. | |
| 33 per 1000 | 85 per 1000 | |||||
| *The risk in the intervention group (and its 95% confidence interval) is based on assumed risk in the comparison group and the relative effect of the intervention (and its 95% CI) | ||||||
| GRADE Working Group grades of evidence | ||||||
| aDowngraded one level because of indirectness bDowngraded two levels because of indirectness, heterogeneity, and high or uncertain risk of bias cDowngraded one level because of high or uncertain risk of bias dDowngraded two levels because of imprecision and high or uncertain risk of bias | ||||||
| Study ID | NMBA | Country | Language | Randomized | Sex | Age, years | Weight, kg | BMI | ASA class included | Expected difficult airway excluded | Overweight excluded |
| C1: suxamethonium 1 mg/kg | UK | English | 60 | C: 12F/8M I1: 11F/9M I2: 11F/9M | C: 41.7 (17.4) I1: 40.3 (10.6) I2: 44.2 (15.0) | C: 76.3 (15.0) I1: 75.5 (15.1) I2: 76.6 (16.8) | ns | I‐II | yes | ||
| C1: rocuronium 0.1 mg/kg C2: rocuronium 0.13 mg/kg | UK | English | 60 | ns | C1: 30 C2: 29 I1: 27 | C1: 74 C2: 72 I1: 64 | ns | ns | yes | yes | |
| C1: suxamethonium 1 mg/kg | USA | English | 64 | C1: 22F/11M I1: 21F/10M | C1: 34 (11) I1: 35 (11) | C1: 69 (14) I1: 65 (13) | I‐II | ||||
| C1: cisatracurium 0.15 mg/kg | France | English | 130 | C1: 65F I1: 65F | C1: 41.5 (12.9) I1: 40.7 (15.2) | ns | C1: 24.6 (5.4) I1: 23.0 (3.5) | I‐II | yes | ||
| C1: rocuronium 0.6 mg/kg | France | English | 300 | C1: 73F/77M I1: 69F/81M | C1: 41 (18‐70) I1: 43 (18‐66) | C1: 73 (13) I1: 70 (13) | ns | I‐II | yes | yes | |
| C1: suxamethonium 1.5 mg/kg | France | French | 60 | C1: 9F/21M I1: 9F/21M | C1: 48.4 (3.4) I1: 50.1 (2.9) | C1: 62.8 (2.5) I1: 61.6 (2.1) | ns | I‐III | |||
| C1: rocuronium 0.6 mg/kg | Columbia | Spanish | 100 | C1: 33F/17M I1: 33F/17M | C1: 34.7 (11.0) I1: 32.8 (12.3) | ns | ns | I‐II | yes | ||
| C1: succinylcholine 1 mg/kg | Turkey | English | 80 | C1: 19F/21M I1: 22F/18M | C1: 49.6 (8.4) I1: 47.9 (8.7) | C1: 77.3 (13.1) I1: 73.2 (14.4) | ns | I‐II | |||
| C1: rocuronium 0.06 mg/kg + succinylcholine 1.5 mg/kg | USA | English | 50 | C1: 15F/9M I1: 5F/18M | C1: 39.0 (13.3) I1: 43.0 (14.5) | C1: 75.0 (15.0) I1: 81.0 (13.0) | C1: 25.9 (4.6) I1: 26.5 (2.9) | I‐II | yes | ||
| C1: suxamethonium 1 mg/kg | Sweden | English | 80 | C1: 26F/13M I1: 23F/14M | C1: 41.8 (13) I1: 39.5 (14) | ns | ns | I‐II | |||
| C1: suxamethonium 1.5 mg/kg | Thailand | English | 120 | C1: 54F/6M I1: 54F/6M | C1: 40.6 (9.1) I1: 39.7 (9.2) | C1: 55.8 (10.8) I1: 55.1 (9.1) | ns | I‐II | yes | yes | |
| C1: suxamethonium 1.5 mg/kg | Nigeria | English | 96 | C1: 12F/32M I1: 21F/23M | C1: 30.8 (9.0) I1: 32.6 (8.0) | C1. 69.0 (7.4) I1: 68.3 (6.6) | I‐II | yes | |||
| C1: suxamethonium 0.6 mg/kg | China | English | 55 | C1: 27F/0M I1: 28F/0M | C1: 38.4 (10.9) I2: 36.3 (9.9) | C1: 58.1 (7.0) I2: 58.2 (7.9) | ns | I‐II | yes | ||
| C1: ORG 9487 (rapacuronium) 0.5 mg/kg C2: ORG 9487 (rapacuronium) 1.0 mg/kg C3: ORG 9487 (rapacuronium) 1.5 mg/kg C4: ORG 9487 (rapacuronium) 2.0 mg/kg C5: ORG 9487 (rapacuronium) 2.5 mg/kg | USA | English | 181 | C1: 20F/10M C2: 18F/9M C3: 17F/15M C4: 15F/13M C5: 22F/9M I1: 19F/11M | C1: 51.3 C2: 49.6 C3: 52.0 C4: 50.6 C5: 50.2 I1: 52.6 | C1: 67.3 C2: 70.5 C3: 68.6 C4: 71.3 C5: 75.9 I1: 69.7 | ns | I‐III | yes | ||
| C1: rocuronium 0.4 mg/kg C2: rocuronium 0.8 mg/kg C3: rocuronium 1.2 mg/kg | USA | English | 80 | C1: 2F/18M C2: 6F/14M C3: 10F/10M I1: 5F/15M | C1: 39.7 (7.5) C2: 39.5 (14.3) C3: 39.2 (10.5) I1: 39.3 (11.8) | C1: 75.0 (16.9) C2: 78.6 (15.8) C3: 67.4 (14.8) I1: 73.4 (16.6) | ns | I‐II | yes | ||
| C1: rapacuronium 1.0 mg/kg C2: rapacuronium 1.2 mg/kg C3: rocuronium 0.50 mg/kg | USA | English | 100 | ns | range: 18‐65 | ns | range: 17.5‐27.5 | I‐II | yes | ||
| C1: atracurium 0.5 mg/kg C2: atracurium 0.5 mg/kg C3: atracurium 0.5 mg/kg | France | English | 170 | C1: 3F/42M C2: 7F/41M C3: 8F/39M I1: 2F/18M | C1: 52.9 (11.8) C2: 51.3 (12.6) C3: 56.3 (11.9) I1: 50.4 (10.7) | ns | C1: 23.7 (3.2) C2: 23.1 (3.2) C3: 23.6 (3.4) I1: 23.3 (3.9) | I‐II | yes | ||
| C1: rocuronium 0.3 mg/kg C2: rocuronium 0.45 mg/kg C3: rocuronium 0.6 mg/kg C4: rocuronium 0.3 mg/kg C5: rocuronium 0.45 mg/kg C6: rocuronium 0.6 mg/kg | UK | English | 140 | C1: 4F/16M I1: 2F/8M I2: 4F/6M | C1: 29 (11) I1: 29 (11) I2: 30 (9) | C1: 77(16) I1: 72 (12) I2: 73 (15) | ns | I‐II | yes | yes | |
| C1: succinylcholine 1 mg/kg | UK | English | 60 | ns | C1: 44 (15) I1: 39 (11) I2: 40 (13) | C1: 75 (10) I1: 76 (15) I2: 71 (12) | ns | I‐II | yes | yes | |
| C1: atracurium 0.5 mg/kg | Germany | English | 80 | C1: 19F/18M I1: 18F/18M | C1: 47.2 (13.2) I1: 47.7 (14.3) | C1: 77.7 (16) I1: 74.2 (15) | I‐II | yes | yes | ||
| I1: rocuronium 0.45 mg·kg‐1 | Germany | English | 83 | C1: 16F/24M I1: 16F/23M | C1: 50 (16) I1: 48 (17) | C1: 83.8 (16) I1: 79.6 (15) | C1: 28.2 (4.3) I1: 26.5 (3.7) | I‐III | yes | yes | |
| C1: succinylcholine 0.3 mg/kg C2: succinylcholine 0.5 mg/kg C3: succinylcholine 1.0 mg/kg | Saudi Arabia | English | 200 | C1: 25F/25M C2: 23F/27M C3: 28F/22M I1: 23F/27M | C1: 30.9 (28‐34) | C1: 66.6 (64‐70) | ns | I | yes | ||
| C1: succinylcholine 0.3 mg/kg C2: succinylcholine 0.5 mg/kg C3: succinylcholine 1.0 mg/kg C4: succinylcholine 1.5 mg/kg C5: succinylcholine 2.0 mg/kg | Saudi Arabia | English | 180 | C1: 17F13M I1: 19F/11M | C1: 33.5 (8.7) | C1: 67.8 (10.3) | C1: 25.6 (2.8) | I | yes | ||
| C1: suxamethonium 0.25 mg/kg C2: suxamethonium 0.5 mg/kg | USA | English | 60 | C1: 12F/8M C2: 12F/8M I1: 14F/6M | C1: 28.6 (17‐55) C2: 29.0 (16‐53) I1: 27.0 (18‐53) | C1: 66.2 (13.6) C2: 64.4 (11.2) I1: 68.1 (13.6) | ns | I‐II | |||
| C1: cisatracurium 0.1 mg/kg | China | English | 40 | C1: 14F/6M I1: 9F/11M | C1: 45.2 (7.4) I1: 43.3 (6.7) | C1: 63.8 (9.5) I1: 64.6 (7.9) | C1: 23.7 (2.8) I1: 23.3 (3.1) | I‐II | yes | yes | |
| C1: mivacurium 0.25 mg/kg C2: rocuronium 0.45 mg/kg C3: rocuronium 0.6 mg/kg C4: rocuronium 0.9 mg/kg C5: rocuronium 1.2 mg/kg | USA | English | 100 | ns | ns | ns | ns | I‐II | yes | yes | |
| C1: vecuronium 0.08 mg/kg | France | French | 152 | ns | C1: 23 (5) I1: 25 (8) | C1: 71 (10) I1: 71 (11) | ns | I | yes | ||
| C1: d‐tubocurarine 3 mg and succinylcholine 1 mg/kg | USA | English | 75 | C1: 8F/7M I1: 10F/5M I2: 11F/4M I3: 13F/2M I4: 10F/5M | C1: 37 (10) I1: 33 (9) I2: 30 (10) I3: 35 (11) I4: 36 (16) | C1: 77 (20) I1: 65 (11) I2: 66 (15) I3: 66 (12) I4: 68 (16) | ns | I | yes | ||
| C1: rocuronium 0.6 mg/kg C2: rocuronium 0.45 mg/kg C3: rocuronium 0.3 mg/kg | Germany | English | 120 | C1: 13F/17M C2: 13F/17M C3: 14F/16M I1: 14F/16M | C1: 37 (11) C2: 35 (11) C3: 36 (12) I1: 37 (11) | C1: 72 (14) C2: 75 (13) C3: 75 (12) I1: 70 (14) | ns | I‐II | yes | ||
| C1: suxamethonium 1 mg/kg | New Zealand | English | 100 | C1: 7F/18M I1: 9F/16M I2: 8F/17M I3: 10F/15M | C1: 34.3 (14.0) I1: 36.8 (12.6) I2: 29.6 (9.7) I3: 37.7 (12) | C1: 66 (10) I1: 62 (11) I2: 63 (15) I3: 61 (11) | ns | I‐II | yes | ||
| C1: d‐tubocurarine 3 mg and succinylcholine 1 mg/kg | USA | English | 140 | C1: 12F/8M I1: 12F/8M I2: 15F/5M I3: 17F/3M I4: 17F/3M I5: 15F/5M I6: 14F/6M | C1: 35 (9) I1: 38 (12) I2: 34 (11) I3: 37 (10) I4: 34 (9) I5: 33 (11) I6: 37 (14) | C1: 70 (8) I1: 72 (17) I2: 70 (14) I3: 72 (10) I4: 72 (13) I5: 72 (18) I6: 70 (13) | ns | I‐II | yes | yes | |
| C1: vecuronium 1 mg + succinylcholine 1 mg/kg C2: vecuronium 1 mg + succinylcholine 1 mg/kg | Germany | German | 100 | C1: 25F C2: 25F I1: 25F I2: 25F | C1: 47.8 (11.7) C2: 43.8 (9.5) I1: 46.5 (12.7) I2: 46.0 (12.4) | C1: 62.6 (9.4) C2: 68.2 (14) I1: 64.9 (10.1) I2: 70.8 (14.6) | ns | I‐II | |||
| C1: succinylcholine 1 mg/kg | Malaysia | English | 120 | C1: 16F/14M I1: 13F/17M I2: 18F/12M I3: 12F/17M | C1: 35.7 (16) I1: 35.5 (12) I2: 35.4 (13) I3: 35.7 (11) | C1: 60.2 (8.9) I1: 66.0 (13.1) I2: 63.4 (12.9) I3: 60.1 (10.8) | ns | I‐II | yes | ||
| C1: atracurium 0.5 mg/kg | Iran | English | 66 | 69.7% M | 31.6 (13) | ns | ns | I‐II | yes | ||
| ns = not specified; The values in parentheses are standard deviation or range | |||||||||||
| Study ID | NMBA | Randomized/ Analysed | Hypnotic | Opioid | Local anaesthetic | Difficult intubation events/ | Difficult laryngos‐ copy events/ | Upper airway discomfort or injury events/total |
| C1: suxamethonium 1 mg/kg | 60/60 | C1: propofol 2 mg/kg I1: propofol 2 mg/kg I2: propofol 2 mg/kg | C1: none I1: alfentanil 50 μg/kg I2: remifentanil 2 μg/kg | None | C1: 0/20 I1: 3/20 I2: 13/20 | ns | ns | |
| C1: rocuronium 0.1 mg/kg C2: rocuronium 0.3 mg/kg | 60/60 | C1: propofol 2.5 mg/kg C2: propofol 2.5 mg/kg I1: propofol 2.5 mg/kg | C1: alfentanil 10 μg/kg C2: alfentanil 10 μg/kg I1: alfentanil 10 μg/kg | Lidocaine 10 mg IV | C1: 14/20 C2: 2/20 I1: 19/20 | ns | ns | |
| C1: suxamethonium 1 mg/kg | 64/64 | C1: thiopenthal 5 mg/kg I1: propofol 2 mg/mL | C1: none I1: alfentanil 50 μg/kg | None | C1: 0/33 I1: 1/31 | C1: 0/33 I1: 1/31 | ns | |
| C1: cisatracurium 0.15 mg/kg | 130/129 | C1: propofol 2.5 mg/kg I1: propofol 2.5 mg/kg | C1: remifentanil 2 μg/kg I1: remifentanil 2 μg/kg | None | C1: 0/64 I1: 3/65 | C1: 1/64 I1: 1/65 | C1: 17/64 I1: 14/65 | |
| C1: rocuronium 0.6 mg/kg | 300/300 | C1: propofol 2.5 mg/kg I1: propofol 2.5 mg/kg | C1: alfentanil 15 µg/kg I1: alfentanil 40 µg/kg | None | C1: 1/150 I1: 18/150 | C1: 5/150 I1: 18/150 | C1: 64/150 I1: 86/150 | |
| C1: suxamethonium 1.5 mg/kg | 60 | C1: propofol 3 mg/mL I1: propofol 3 mg/mL | C1: alfentanil 7‐10 µg/kg I1: alfentanil 7‐10 µg/kg | Lidocaine (2%): IV + topical Lidocaine 5% | C1: 10/30 I1: 11/30 | C1: 5/30 I1: 15/30 | ns | |
| C1: rocuronium 0.6 mg/kg | 100/100 | C1: propofol 1‐2 mg/kg I1: Sevoflurane 3% + propofol 2 mg/kg | C1: remifentanil 1‐2 μg/kg in 1 min + 0.15 µ/kg/min in1 min I1: remifentanil 0.6 µ/kg/min for 5 min | None | C1: 4/50 I1: 1/50 | C1: 4/50 I1: 1/50 | C1: 0/50 I1: 0/50 | |
| C1: succinylcholine 1 mg/kg | 80/80 | C1: propofol 2 mg/kg I1: propofol 2 mg/kg | C1: remifentanil 1 μg/kg I1: remifentanil 4 μg/kg | None | C1: 5/40 I1: 0/40 | ns | C1: 2/40 I1: 4/40 | |
| C1: rocuronium 0.06 mg/kg + succinylcholine 1.5 mg/kg | 50/47 | C1: propofol 2 mg/kg I1: propofol 2 mg/kg | C1: none I1: remifentanil 4 μg/kg | Lidocaine 0.5 mg/kg IV | C1: 2/24 I1: 3/23 | ns | ns | |
| C1: suxamethonium 1 mg/kg | 80/79 | C1: thiopental 5 mg/kg I1: propofol 2.5 mg/kg | C1: alfentanil 10 μg/kg I1: alfentanil 10 μg/kg | None | C1: 0/40 I1: 6/39 | C1: 0/40 I1: 2/39 | ns | |
| C1: suxamentonium 1.5 mg/kg | 120/120 | C1: thiopenthal 5 mg/kg + (N2O) I1: sevoflurane 8% | C1: fentanyl 1.5 μg/kg I1: fentanyl 1.5 μg/kg | None | C1: 0/60 I1: 4/60 | ns | ns | |
| C1: suxamethonium 1.5 mg/kg | 96/88 | C1: propofol 2.0 mg/kg I1: propofol 2.0 mg/kg | None | C1: none I1: lidocaine IV 1.5 mg/kg | C1: 0/44 I1: 18/44 | ns | ns | |
| C1: suxamethonium 0.6 mg/kg | 55/55 | C1: propofol 2 mg/kg I1: propofol 2 mg/kg | C1: remifentanil 1 μg/kg I1: remifentanil 1.5 μg/kg | None | C1: 1/27 I2: 13/28 | ns | ns | |
| C1: ORG 9487 (rapacuronium) 0.5 mg/kg C2: ORG 9487 (rapacuronium) 1.0 mg/kg C3: ORG 9487 (rapacuronium) 1.5 mg/kg C4: ORG 9487 (rapacuronium) 2.0 mg/kg C5: ORG 9487 (rapacuronium) 2.5 mg/kg | 181/176 | C1: thiopental 3‐6 mg/kg I1: thiopental 3‐6 mg/kg | C1: fentanyl 0.5‐3 μm/kg I1: fentanyl 0.5‐3 μm/kg | None | C1: 9/30 I1: 18/30 | ns | ns | |
| C1: rocuronium 0.4 mg/kg C2: rocuronium 0.8 mg/kg C3: rocuronium 1.2 mg/kg | 80/80 | C1: propofol 2 mg/kg C2: propofol 2 mg/kg C3: propofol 2 mg/kg I1: propofol 2 mg/kg | C1: fentanyl 2 μm/kg C2: fentanyl 2 μm/kg C3: fentanyl 2 μm/kg I1: fentanyl 2 μm/kg | None | C1: 9/20 C2: 2/20 C3: 1/20 I1: 13/20 | ns | ns | |
| C1: rapacuronium 1.0 mg/kg C2: rapacuronium 1.2 mg/kg C3: rocuronium 0.50 mg/kg | 100/100 | C1: propofol 2.0 mg/kg IV C2: propofol 2.0 mg/kg IV C3: propofol 2.0 mg/kg IV I1: propofol 2.0 mg/kg IV | C1: alfentanil 12.5 μg/kg C2: alfentanil 12.5 μg/kg C3: alfentanil 12.5 μg/kg I1: alfentanil 12.5 μg/kg | None | C1: 2/30 C2: 0/30 C3: 0/30 I1: 7/10 | |||
| C1: atracurium 0.5 mg/kg C2: atracurium 0.5 mg/kg C3: atracurium 0.5 mg/kg | 170/160 | C1: propofol 1.5 mg/kg C2: propofol 2.0 mg/kg C3: propofol 2.5 mg/kg I1: propofol 2.5 mg/kg | C1: fentanyl 3 μm/kg C2: fentanyl 3 μm/kg C3: fentanyl 3 μm/kg I1: fentanyl 3 μm/kg | None | C1: 7/47 C2: 1/48 C3: 2/45 I1: 13/20 | ns | ns | |
| C1: rocuronium 0.3 mg/kg C2: rocuronium 0.45 mg/kg C3: rocuronium 0.6 mg/kg C4: rocuronium 0.3 mg/kg C5: rocuronium 0.45 mg/kg C6: rocuronium 0.6 mg/kg | 140/140 | C1: propofol 2‐3 mg/kg C2: propofol 2‐3 mg/kg C3: propofol 2‐3 mg/kg C4: sevoflurane 8% C5: sevoflurane 8% C6: sevoflurane 8% I1: propofol 2‐3 mg/kg I2: sevoflurane 8% | C1: fentanyl 1 μm/kg C2: fentanyl 1 μm/kg C3: fentanyl 1 μm/kg C4: fentanyl 1 μm/kg C5: fentanyl 1 μm/kg C6: fentanyl 1 μm/kg I1: fentanyl 1 μm/kg I2: fentanyl 1 μm/kg | None | C1: 11/20 C2: 4/20 C3: 2/20 C4:14/20 C5: 9/20 C6: 2/20 I1:10/10 I2: 9/10 | ns | ns | |
| C1: succinylcholine 1 mg/kg | 60/60 | C1: propofol 2 mg/kg I1: propofol 2 mg/kg I2: propofol 2 mg/kg | C1: none I1: remifentanil 2 μg/kg I2: remifentanil 4 μg/kg | None | C1: 0/17 I1: 2/23 I2: 2/20 | C1: 0/17 I1: 0/23 I2: 0/20 | ns | |
| C1: atracurium 0.5 mg/kg | 80/73 | C1: propofol 2.5‐3 mg/kg I1: propofol 2.5‐3 mg/kg | C1: fentanyl 2‐3 μg/kg I1: fentanyl 2‐3 μg/kg | None | C1: 2/37 I1: 12/36 | C1: 1/39 I1: 4/39 | C1: 6/37 I1: 16/36 | |
| C1: rocuronium 0.45 mg·kg/kg | 83/83 | C1: propofol 1.5 mg·kg‐1 + sevoflurane 3.0‐3.5 Vol%,8 l·min‐1 in 2‐3 minutes I1: propofol 1.5 mg/kg | C1: remifentanil 0.30 μg/kg/min for 3 minutes I1: remifentanil 0.30 μg/kg/min for 3 minutes | None | C1: 1/40 I1: 11/43 | C1: 0/40 I1: 2/43 | C1: 12/33 I1: 17/31 | |
| C1: succinylcholine 0.3 mg/kg C2: succinylcholine 0.5 mg/kg C3: succinylcholine 1.0 mg/kg | 200/200 | C1: propofol 2 mg/kg C2: propofol 2 mg/kg C3: propofol 2 mg/kg I1: propofol 2 mg/kg | C1: fentanyl 2 μg/kg C2: fentanyl 2 μg/kg C3: fentanyl 2 μg/kg I1: fentanyl 2 μg/kg | None | C1: 4/50 C2: 3/50 C3: 1/50 I1: 15/50 | ns | ns | |
| C1: succinylcholine 0.3 mg/kg C2: succinylcholine 0.5 mg/kg C3: succinylcholine 1.0 mg/kg C4: succinylcholine 1.5 mg/kg C5: succinylcholine 2.0 mg/kg | 180/180 | C1: propofol 2 mg/kg C2: propofol 2 mg/kg C3: propofol 2 mg/kg C4: propofol 2 mg/kg C5: propofol 2 mg/kg I1: propofol 2 mg/kg | C1: fentanyl 2 μm/kg C2: fentanyl 2 μm/kg C3: fentanyl 2 μm/kg C4: fentanyl 2 μm/kg C5: fentanyl 2 μm/kg I1: fentanyl 2 μm/kg | None | C1: 2/30 C2: 2/30 C3: 1/30 C4: 1/30 C5: 0/30 I1: 21/30 | ns | ns | |
| C1: suxamethonium 0.25 mg/kg C2: suxamethonium 0.5 mg/kg | 60/60 | C1: propofol 2.5 mg/kg C2: propofol 2.5 mg/kg I1: Propofol 2.5 mg/kg | C1: alfentanil 15 μg/kg C2: alfentanil 15 μg/kg I1: alfentanil 15 μg/kg | None | C1: 0/20 C2: 1/20 I1: 9/20 | ns | ns | |
| C1: cisatracurium 0.1 mg/kg | 20/20 | C1: propofol target control I1: propofol target control | C1: remifentanil target control I1: remifentanil target control | C1: tetracaine 10 mg/mL I1: tetracaine 10 mg/mL | C1: 0/20 I1: 0/20 | C1: 0/20 I1: 0/20 | ns | |
| C1: mivacurium 0.25 mg/kg C2: rocuronium 0.45 mg/kg C3: rocuronium 0.6 mg/kg C4: rocuronium 0.9 mg/kg C5: rocuronium 1.2 mg/kg | 100/98 | C1: propofol 2 mg/kg C2: propofol 2 mg/kg C3: propofol 2 mg/kg C4: propofol 2 mg/kg C5: propofol 2 mg/kg I1: propofol 2 mg/kg | C1: fentanyl 2 μm/kg C2: fentanyl 2 μm/kg C3: fentanyl 2 μm/kg C4: fentanyl 2 μm/kg C5: fentanyl 2 μm/kg I1: fentanyl 2 μm/kg | None | C1: 2/30 IC2: 9/15 C3: 4/14 C4: 1/14 C5: 0/15 I1: 10/10 | ns | ns | |
| C1: vecuronium 0.08 mg/kg | 152/152 | C1: propofol 2.5 mg/kg I1: propofol 2.5 mg/kg | C1: alfentanil 0.03 mg/kg I1: alfentanil 0.03 mg/kg | C1: none I1: lidocaine 1.5 mg/kg | C1: 2/77 I1: 4/75 | ns | ns | |
| C1: d‐tubocurarine 3 mg and succinylcholine 1 mg/kg | 75/75 | C1: thiamylal 4 mg/kg I1: propofol 2 mg/kg I2: propofol 2 mg/kg I3: propofol 2 mg/kg I4: propofol 2 mg/kg | C1: none I1: alfentanil 30 µg/kg I2: alfentanil 40 µg/kg I3: alfentanil 50 µg/kg I4: alfentanil 60 µg/kg | None | C1: 0/15 I1: 1/15 I2: 1/15 I3: 1/15 I4: 1/15 | C1: 0/15 I1: 1/15 I2: 1/15 I3: 1/15 I4: 1/15 | ns | |
| C1: rocuronium 0.6 mg/kg C2: rocuronium 0.45 mg/kg C3: rocuronium 0.3 mg/kg | 120/120 | C1: propofol 2‐2.5 mg/kg C2: propofol 2‐2.5 mg/kg C3: propofol 2‐2.5 mg/kg I1: propofol 2‐2.5 mg/kg | C1: remifentanil 0.5 µg/kg/min C2: remifentanil 0.5 µg/kg/min IC3: remifentanil 0.5 µg/kg/min I1: remifentanil 0.5 µg/kg/min | None | C1: 0/30 C2: 1/30 C3: 0/30 I1: 12/30 | ns | ns | |
| C1: suxamethonium 1 mg/kg | 100/100 | C1: Sevoflu 7% + N2O60% I1: Sevoflu 7% + N2O60% I2: Sevoflu 7% + N2O60% I3: Sevoflu 7% + N2O60% | C1: alfentanil 10 µg/kg I1: alfentanil 20 µg/kg I2: alfentanil 25 µg/kg I3: alfentanil 30 µg/kg | None | C1: 1/25 I1: 4/25 I2: 5/25 I3: 2/25 | ns | C1: 8/25 I1: 12/25 I2: 13/25 I3: 9/25 | |
| C1: d‐tubocurarine 3 mg and succinylcholine 1 mg/kg | 140/140 | C1: thiopental 4 mg/kg I1: etomidate 0.3 mg/kg I2: etomidate 0.3 mg/kg I3: propofol 2 mg/kg I4: propofol 2 mg/kg I5: thiopental 4 mg/kg I6: thiopental 4 mg/kg | C1: none I1: alfentanil 40 µg/kg I2: alfentanil 40 µg/kg I3: alfentanil 40 µg/kg I4: alfentanil 40 µg/kg I5: alfentanil 40 µg/kg I6: alfentanil 40 µg/kg | C1: none I1: none I2: lidocaine 1 mg/kg I3: none I4: lidocaine 1 mg/kg I5: none I6: lidocaine1 mg/kg | C1: 1/20 I1: 3/20 I2: 1/20 I3: 3/20 I4: 2/20 I5: 8/20 I6: 3/20 | C1: 0/20 I1: 0/20 I2: 0/20 I3: 0/20 I4: 0/20 I5: 0/20 I6: 0/20 | ns | |
| C1: vecuronium 1 mg + succinylcholine 1 mg/kg C2: vecuronium 1 mg + succinylcholine 1 mg/kg | 100/100 | C1: thiopental 5.5 mg/kg C2: propofol 2.2 mg/kg I1: propofol 2.4 mg/kg I2: propofol 2.2 mg/kg | C1: fentanyl 0.1 mg C2: fentanyl 0.1 mg I1: fentanyl 0.1 mg I2: fentanyl 0.2 mg | 2 mL lidocaine 1% IV | C1: 1/25 C2: 1/25 I1: 3/25 I2: 5/25 | C1: 2/25 C2: 1/25 I1: 1/28 I2: 4/25 | ns | |
| C1: succinylcholine 1 mg/kg | 120/120 | C1: propofol 3.0 mg/kg I1: propofol 2.6 mg/kg I2: propofol 2.6 mg/kg I3: propofol 3.1 mg/kg | C1: none I1: alfentanil 15 μg/kg I2: alfentanil 30 μg/kg I3: none | None | C1: 0/30 I1: 1/30 I2: 0/30 I3: 6/30 | ns | ns | |
| C1: atracurium 0.5 mg/kg | 66/66 | C1: propofol 2.5 mg/kg I1: propofol 2.5 mg/kg | C1: none I1: remifentanil 2 μg/kg | None | C1: 4/31 I1: 14/35 | ns | ns | |
| ns = not specified | ||||||||
| Outcome or subgroup title | No. of studies | No. of participants | Statistical method | Effect size |
| 1 Difficult tracheal intubation: low risk of bias vs high or uncertain risk of bias Show forest plot | 34 | 3565 | Risk Ratio (M‐H, Random, 95% CI) | 5.00 [3.49, 7.15] |
| 1.1 Low risk of bias | 4 | 508 | Risk Ratio (M‐H, Random, 95% CI) | 13.27 [8.19, 21.49] |
| 1.2 High or uncertain risk of bias | 30 | 3057 | Risk Ratio (M‐H, Random, 95% CI) | 4.14 [2.92, 5.87] |
| 2 Difficult tracheal intubation: depolarizing vs non‐depolarizing NMBA Show forest plot | 32 | 3413 | Risk Ratio (M‐H, Random, 95% CI) | 5.25 [3.61, 7.63] |
| 2.1 Depolarizing NMBA | 16 | 1540 | Risk Ratio (M‐H, Random, 95% CI) | 5.79 [2.64, 12.72] |
| 2.2 Non‐depolarizing NMBA | 16 | 1873 | Risk Ratio (M‐H, Random, 95% CI) | 4.72 [3.17, 7.02] |
| 3 Difficult tracheal intubation: remifentanil vs no remifentanil Show forest plot | 26 | 3008 | Risk Ratio (M‐H, Random, 95% CI) | 5.64 [3.82, 8.31] |
| 3.1 Remifentanil | 4 | 372 | Risk Ratio (M‐H, Random, 95% CI) | 15.86 [4.43, 56.71] |
| 3.2 No remifentanil | 22 | 2636 | Risk Ratio (M‐H, Random, 95% CI) | 5.23 [3.54, 7.74] |
| 4 Difficult tracheal intubation: alfentanil vs no alfentanil Show forest plot | 26 | 2618 | Risk Ratio (M‐H, Random, 95% CI) | 4.77 [3.25, 7.01] |
| 4.1 Alfentanil | 6 | 511 | Risk Ratio (M‐H, Random, 95% CI) | 4.46 [1.66, 11.98] |
| 4.2 No alfentanil | 20 | 2107 | Risk Ratio (M‐H, Random, 95% CI) | 5.10 [3.34, 7.79] |
| 5 Difficult tracheal intubation: local anaesthesia vs no local anaesthesia Show forest plot | 31 | 3184 | Risk Ratio (M‐H, Random, 95% CI) | 5.04 [3.48, 7.29] |
| 5.1 Local anaesthesia | 5 | 307 | Risk Ratio (M‐H, Random, 95% CI) | 1.90 [1.14, 3.18] |
| 5.2 No local anaesthesia | 26 | 2877 | Risk Ratio (M‐H, Random, 95% CI) | 6.26 [4.15, 9.44] |
| 6 Difficult tracheal intubation: excluded anticipated DTI vs included anticipated DTI Show forest plot | 34 | 3564 | Risk Ratio (M‐H, Random, 95% CI) | 5.00 [3.50, 7.16] |
| 6.1 Exclusion of patients with anticipated difficult intubation | 25 | 2886 | Risk Ratio (M‐H, Random, 95% CI) | 5.32 [3.54, 8.00] |
| 6.2 No exclusion of patients with anticipated difficult intubation | 9 | 678 | Risk Ratio (M‐H, Random, 95% CI) | 4.40 [1.71, 11.29] |
| 7 Difficult tracheal intubation: "best‐case scenario" Show forest plot | 34 | 2410 | Risk Ratio (M‐H, Random, 95% CI) | 5.99 [3.46, 10.38] |
| 8 Difficult tracheal intubation excluding dose‐finding studies Show forest plot | 16 | 1536 | Risk Ratio (M‐H, Random, 95% CI) | 3.40 [1.63, 7.10] |
| 9 Difficult tracheal intubation: funding from pharmaceutical industry Show forest plot | 34 | 3565 | Risk Ratio (M‐H, Random, 95% CI) | 5.00 [3.49, 7.15] |
| 9.1 No funding from pharmaceutical industry | 24 | 2550 | Risk Ratio (M‐H, Random, 95% CI) | 5.33 [3.16, 8.98] |
| 9.2 Funding from pharmaceutical industry | 10 | 1015 | Risk Ratio (M‐H, Random, 95% CI) | 4.10 [2.67, 6.31] |
| 10 One or more events of upper airway discomfort or injury: low risk of bias vs high or uncertain risk of bias Show forest plot | 7 | 844 | Risk Ratio (M‐H, Random, 95% CI) | 1.36 [1.08, 1.71] |
| 10.1 Low risk of bias | 1 | 73 | Risk Ratio (M‐H, Random, 95% CI) | 2.74 [1.21, 6.21] |
| 10.2 High or uncertain risk of bias | 6 | 771 | Risk Ratio (M‐H, Random, 95% CI) | 1.30 [1.08, 1.58] |
| 11 One or more events of upper airway discomfort or injury: depolarizing vs non‐depolarizing NMBA Show forest plot | 7 | 846 | Risk Ratio (M‐H, Random, 95% CI) | 1.37 [1.09, 1.74] |
| 11.1 Depolarizing NMBA | 2 | 180 | Risk Ratio (M‐H, Random, 95% CI) | 1.48 [0.83, 2.65] |
| 11.2 Non‐depolarizing NMBA | 5 | 666 | Risk Ratio (M‐H, Random, 95% CI) | 1.37 [0.97, 1.94] |
| 12 One or more events of upper airway discomfort or injury: remifentanil vs no remifentanil Show forest plot | 7 | 846 | Risk Ratio (M‐H, Random, 95% CI) | 1.37 [1.09, 1.74] |
| 12.1 Remifentanil | 2 | 193 | Risk Ratio (M‐H, Random, 95% CI) | 1.12 [0.61, 2.08] |
| 12.2 No remifentanil | 5 | 653 | Risk Ratio (M‐H, Random, 95% CI) | 1.42 [1.16, 1.75] |
| 13 One or more events of upper airway discomfort or injury: alfentanil vs no alfentanil Show forest plot | 5 | 446 | Risk Ratio (M‐H, Random, 95% CI) | 1.47 [0.85, 2.53] |
| 13.1 No alfentanil | 5 | 446 | Risk Ratio (M‐H, Random, 95% CI) | 1.47 [0.85, 2.53] |
| 14 One or more events of upper airway discomfort or injury: excluded anticipated DTI vs included anticipated DTI Show forest plot | 7 | 846 | Risk Ratio (M‐H, Random, 95% CI) | 1.37 [1.09, 1.74] |
| 14.1 Excluded anticipated DTI | 6 | 766 | Risk Ratio (M‐H, Random, 95% CI) | 1.37 [1.05, 1.79] |
| 14.2 Included anticipated DTI | 1 | 80 | Risk Ratio (M‐H, Random, 95% CI) | 2.0 [0.39, 10.31] |
| 15 Difficult laryngoscopy: low risk of bias vs high or uncertain risk of bias Show forest plot | 13 | 1308 | Risk Ratio (M‐H, Random, 95% CI) | 2.54 [1.53, 4.21] |
| 15.1 Low risk of bias | 1 | 78 | Risk Ratio (M‐H, Random, 95% CI) | 4.0 [0.47, 34.20] |
| 15.2 High or uncertain risk of bias | 12 | 1230 | Risk Ratio (M‐H, Random, 95% CI) | 2.47 [1.47, 4.16] |