Farmacoterapia para el deterioro cognitivo crónico en el traumatismo craneoencefálico
Información
- DOI:
- https://doi.org/10.1002/14651858.CD009221.pub2Copiar DOI

- Base de datos:
-
- Cochrane Database of Systematic Reviews
- Versión publicada:
-
- 01 diciembre 2015see what's new
- Tipo:
-
- Intervention
- Etapa:
-
- Review
- Grupo Editorial Cochrane:
-
Grupo Cochrane de Demencia y trastornos cognitivos
- Copyright:
-
- Copyright © 2015 The Cochrane Collaboration. Published by John Wiley & Sons, Ltd.
Cifras del artículo
Altmetric:
Citado por:
Autores
Contributions of authors
NP has written the protocol and conducted the initial search. The authors NP and DD examined the search results for relevant reports and all authors agreed on the final inclusion list. All authors extracted data, contributed to writing and agreed on the final version of this review.
Sources of support
Internal sources
-
No sources of support supplied
External sources
-
NIHR, UK.
This review was supported by the National Institute for Health Research, via Cochrane Infrastructure funding to the Cochrane Dementia and Cognitive Improvement group. The views and opinions expressed therein are those of the authors and do not necessarily reflect those of the Systematic Reviews Programme, NIHR, NHS or the Department of Health
Declarations of interest
Dominic Dougall ‐ None known
Norman Poole ‐ None known
Niruj Agrawal ‐ None known
Acknowledgements
We would like to thank Sue Marcus for providing editorial support and Anna Noel‐Storr for conducting the initial and updated searches.
Version history
| Published | Title | Stage | Authors | Version |
| 2015 Dec 01 | Pharmacotherapy for chronic cognitive impairment in traumatic brain injury | Review | Dominic Dougall, Norman Poole, Niruj Agrawal | |
| 2011 Jul 06 | Pharmacotherapy for chronic cognitive impairment in traumatic brain injury | Protocol | Norman Poole, Dominic Dougall, Niruj Agrawal | |
Differences between protocol and review
We rated quality of evidence using the GRADE approach, which was not planned at the protocol stage.
We did not report treatment effects in terms of numbers needed to treat for an additional beneficial outcome (NNTB) as the available data was not suitable to calculate NNTBs.
The planned meta‐analysis was not possible due to insufficient data for synthesis, including no assessment of reporting bias, heterogeneity or sensitivity analyses. Sections where substantial changes were made between the protocol and the review were: unit of analyses issues; assessment of heterogeneity; assessment of reporting bias; data synthesis; subgroup analysis and investigation of heterogeneity; and sensitivity analyses. For future updates of this review, the sections are detailed in Appendix 3, Methods for future updates.
We included a study investigating a research chemical (Johansson 2012), rather than the plan to include widely available pharmacological agents, due to the small number of studies otherwise meeting inclusion criteria. Similarly, we also included a study including participants aged 16 and over (Jha 2008), rather than limiting inclusion to only studies including adults aged 18 and over.
Keywords
MeSH
Medical Subject Headings (MeSH) Keywords
- Atomoxetine Hydrochloride [therapeutic use];
- Benzhydryl Compounds [therapeutic use];
- Brain Injuries [*complications];
- Chronic Disease;
- Cognition [drug effects];
- Cognition Disorders [*drug therapy, etiology];
- Modafinil;
- Nootropic Agents [*therapeutic use];
- Piperidines [therapeutic use];
- Randomized Controlled Trials as Topic;
- Rivastigmine [therapeutic use];
Medical Subject Headings Check Words
Adolescent; Adult; Aged; Humans; Middle Aged;
PICO

Study flow diagram.

Risk of bias summary: review authors' judgements about each risk of bias item for each included study.
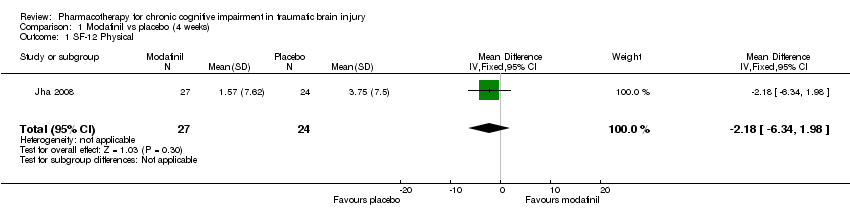
Comparison 1 Modafinil vs placebo (4 weeks), Outcome 1 SF‐12 Physical.

Comparison 1 Modafinil vs placebo (4 weeks), Outcome 2 SF‐12 Mental.

Comparison 1 Modafinil vs placebo (4 weeks), Outcome 3 ImPACT verbal memory composite.
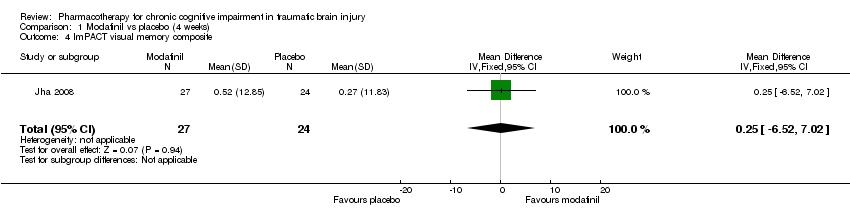
Comparison 1 Modafinil vs placebo (4 weeks), Outcome 4 ImPACT visual memory composite.

Comparison 1 Modafinil vs placebo (4 weeks), Outcome 5 ImPACT visual motor speed composite.
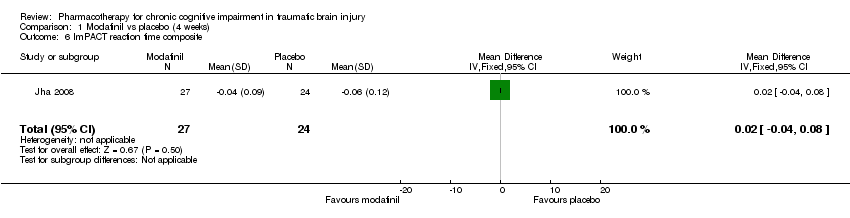
Comparison 1 Modafinil vs placebo (4 weeks), Outcome 6 ImPACT reaction time composite.

Comparison 1 Modafinil vs placebo (4 weeks), Outcome 7 CCPT‐II No. of omissions.
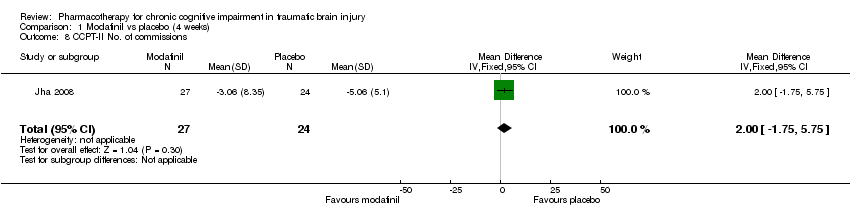
Comparison 1 Modafinil vs placebo (4 weeks), Outcome 8 CCPT‐II No. of commissions.

Comparison 2 Modafinil vs placebo (10 weeks), Outcome 1 SF‐12 Physical.

Comparison 2 Modafinil vs placebo (10 weeks), Outcome 2 SF‐12 Mental.

Comparison 2 Modafinil vs placebo (10 weeks), Outcome 3 ImPACT verbal memory composite.
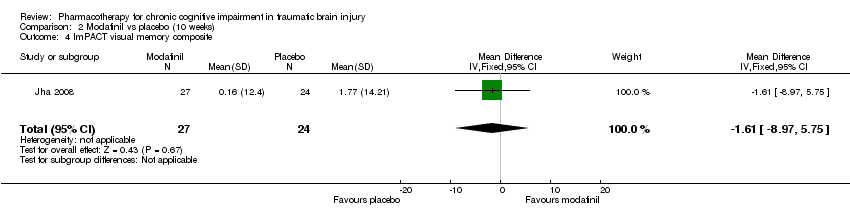
Comparison 2 Modafinil vs placebo (10 weeks), Outcome 4 ImPACT visual memory composite.

Comparison 2 Modafinil vs placebo (10 weeks), Outcome 5 ImPACT visual motor speed composite.

Comparison 2 Modafinil vs placebo (10 weeks), Outcome 6 ImPACT reaction time composite .
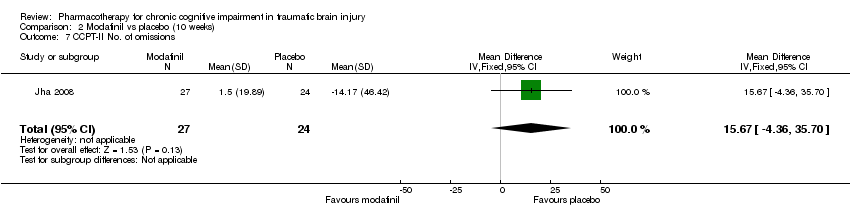
Comparison 2 Modafinil vs placebo (10 weeks), Outcome 7 CCPT‐II No. of omissions.

Comparison 2 Modafinil vs placebo (10 weeks), Outcome 8 CCPT‐II No. of commissions.
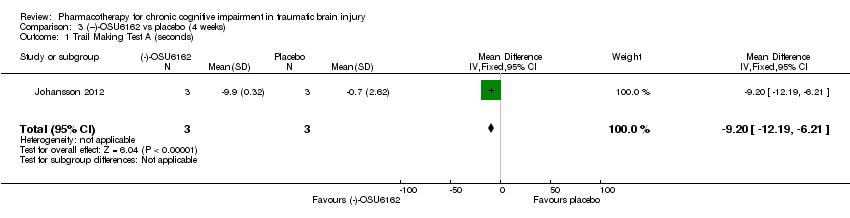
Comparison 3 (−)‐OSU6162 vs placebo (4 weeks), Outcome 1 Trail Making Test A (seconds).

Comparison 3 (−)‐OSU6162 vs placebo (4 weeks), Outcome 2 Trail Making Test B (seconds).
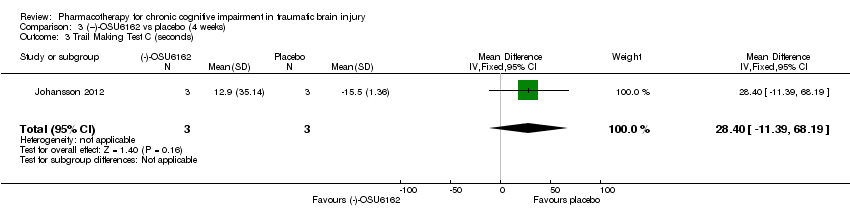
Comparison 3 (−)‐OSU6162 vs placebo (4 weeks), Outcome 3 Trail Making Test C (seconds).

Comparison 3 (−)‐OSU6162 vs placebo (4 weeks), Outcome 4 Trail Making Test D (seconds).

Comparison 3 (−)‐OSU6162 vs placebo (4 weeks), Outcome 5 WAIS‐III Digit Symbol Coding.

Comparison 3 (−)‐OSU6162 vs placebo (4 weeks), Outcome 6 WAIS‐III Digit‐Span.

Comparison 3 (−)‐OSU6162 vs placebo (4 weeks), Outcome 7 FAS Verbal Fluency (total words).
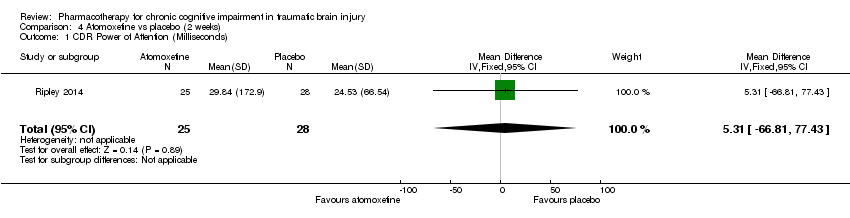
Comparison 4 Atomoxetine vs placebo (2 weeks), Outcome 1 CDR Power of Attention (Milliseconds).
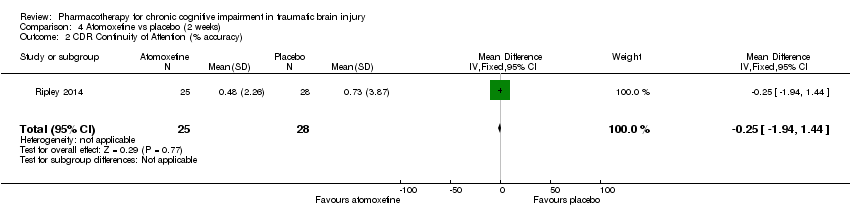
Comparison 4 Atomoxetine vs placebo (2 weeks), Outcome 2 CDR Continuity of Attention (% accuracy).

Comparison 4 Atomoxetine vs placebo (2 weeks), Outcome 3 CDR Efficiency (COA/POA, % accuracy/millisecond).
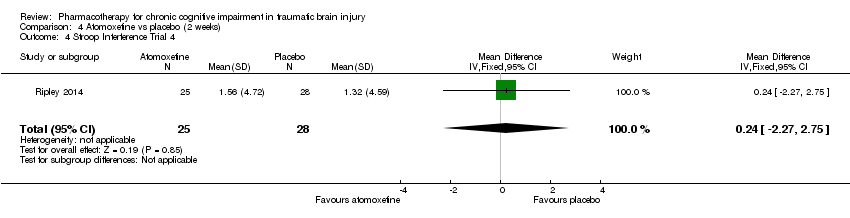
Comparison 4 Atomoxetine vs placebo (2 weeks), Outcome 4 Stroop Interference Trial 4.

Comparison 4 Atomoxetine vs placebo (2 weeks), Outcome 5 Adult ADHD Self‐Report Scale (ASRS‐v1.1.).

Comparison 5 Rivastigmine vs placebo (12 weeks), Outcome 1 HVLT‐total word recall.
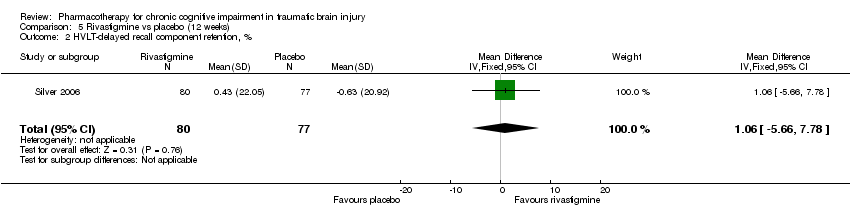
Comparison 5 Rivastigmine vs placebo (12 weeks), Outcome 2 HVLT‐delayed recall component retention, %.

Comparison 5 Rivastigmine vs placebo (12 weeks), Outcome 3 HVLT–recognition discriminant index.

Comparison 5 Rivastigmine vs placebo (12 weeks), Outcome 4 CANTAB RVIP’A.

Comparison 5 Rivastigmine vs placebo (12 weeks), Outcome 5 CANTAB–SWM, total errors.

Comparison 5 Rivastigmine vs placebo (12 weeks), Outcome 6 CANTAB RVIP, mean latency, ms.

Comparison 5 Rivastigmine vs placebo (12 weeks), Outcome 7 CANTAB‐RT, simple reaction time, ms.

Comparison 5 Rivastigmine vs placebo (12 weeks), Outcome 8 CANTAB‐PAL, total errors.
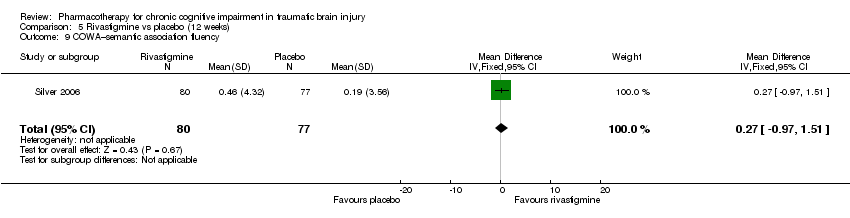
Comparison 5 Rivastigmine vs placebo (12 weeks), Outcome 9 COWA–semantic association fluency.
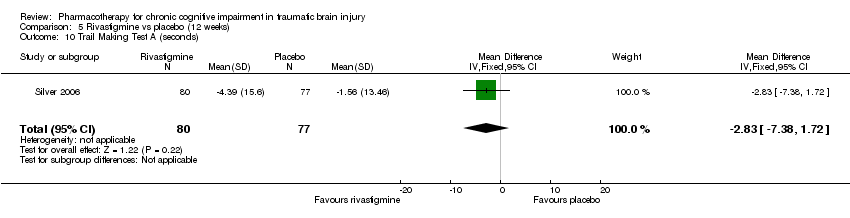
Comparison 5 Rivastigmine vs placebo (12 weeks), Outcome 10 Trail Making Test A (seconds).
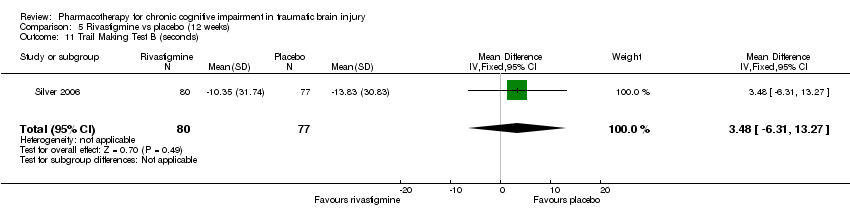
Comparison 5 Rivastigmine vs placebo (12 weeks), Outcome 11 Trail Making Test B (seconds).

Comparison 5 Rivastigmine vs placebo (12 weeks), Outcome 12 WAIS‐III‐DS scaled score.

Comparison 6 Acceptability of treatment, Outcome 1 Modafinil vs placebo.

Comparison 6 Acceptability of treatment, Outcome 2 Rivastigmine vs placebo.

Comparison 6 Acceptability of treatment, Outcome 3 (‐)‐OSU6162 vs placebo.

Comparison 6 Acceptability of treatment, Outcome 4 Atomoxetine vs placebo.

Comparison 7 Modafinil vs placebo adverse events, Outcome 1 Dizziness.

Comparison 7 Modafinil vs placebo adverse events, Outcome 2 Dysgeusia.

Comparison 7 Modafinil vs placebo adverse events, Outcome 3 Dyspepsia.

Comparison 7 Modafinil vs placebo adverse events, Outcome 4 Fatigue.

Comparison 7 Modafinil vs placebo adverse events, Outcome 5 Insomnia.

Comparison 7 Modafinil vs placebo adverse events, Outcome 6 Memory impairment.
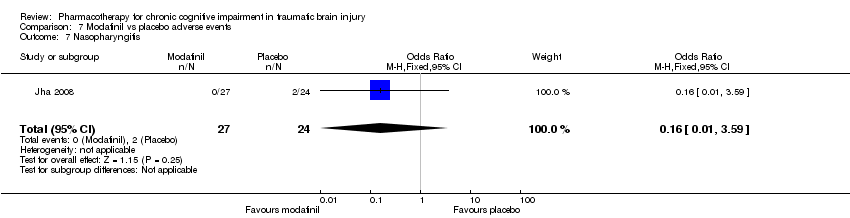
Comparison 7 Modafinil vs placebo adverse events, Outcome 7 Nasopharyngitis.

Comparison 7 Modafinil vs placebo adverse events, Outcome 8 Nausea.

Comparison 7 Modafinil vs placebo adverse events, Outcome 9 Weight loss.
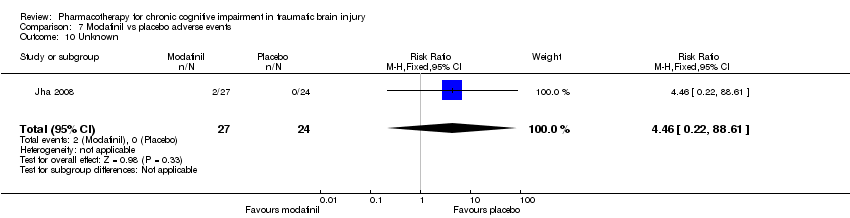
Comparison 7 Modafinil vs placebo adverse events, Outcome 10 Unknown.

Comparison 8 (−)‐OSU6162 vs placebo adverse events, Outcome 1 Nausea.
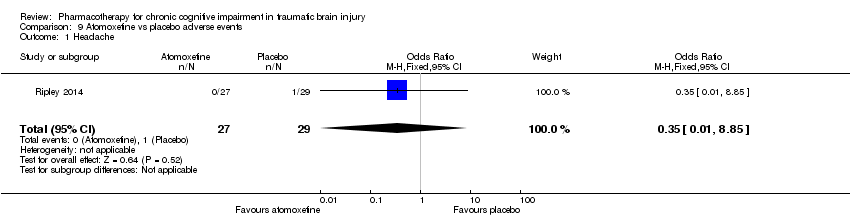
Comparison 9 Atomoxetine vs placebo adverse events, Outcome 1 Headache.
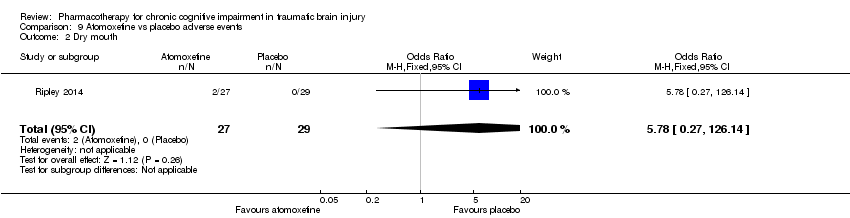
Comparison 9 Atomoxetine vs placebo adverse events, Outcome 2 Dry mouth.

Comparison 9 Atomoxetine vs placebo adverse events, Outcome 3 Globus pharyngeus.

Comparison 9 Atomoxetine vs placebo adverse events, Outcome 4 Hypertension.

Comparison 9 Atomoxetine vs placebo adverse events, Outcome 5 Insomnia.

Comparison 9 Atomoxetine vs placebo adverse events, Outcome 6 Irritable bowl.

Comparison 9 Atomoxetine vs placebo adverse events, Outcome 7 Loss of appetite.

Comparison 9 Atomoxetine vs placebo adverse events, Outcome 8 Nasal congestion.

Comparison 9 Atomoxetine vs placebo adverse events, Outcome 9 Shoulder pain.
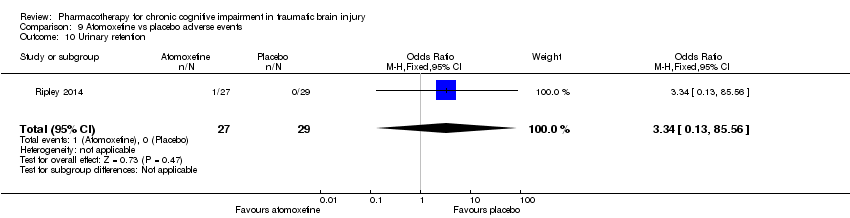
Comparison 9 Atomoxetine vs placebo adverse events, Outcome 10 Urinary retention.

Comparison 10 Rivastigmine vs placebo adverse events, Outcome 1 Anxiety.

Comparison 10 Rivastigmine vs placebo adverse events, Outcome 2 Arthralgia.
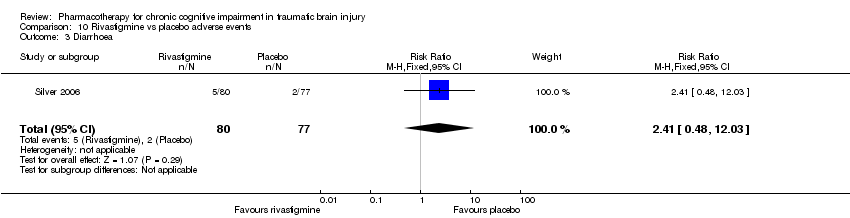
Comparison 10 Rivastigmine vs placebo adverse events, Outcome 3 Diarrhoea.

Comparison 10 Rivastigmine vs placebo adverse events, Outcome 4 Dizziness.

Comparison 10 Rivastigmine vs placebo adverse events, Outcome 5 Headache.

Comparison 10 Rivastigmine vs placebo adverse events, Outcome 6 Nausea.

Comparison 10 Rivastigmine vs placebo adverse events, Outcome 7 Upper respiratory tract infection.
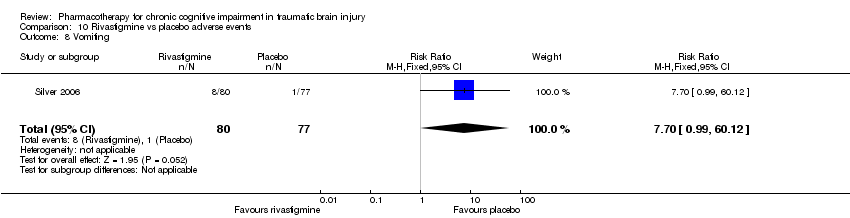
Comparison 10 Rivastigmine vs placebo adverse events, Outcome 8 Vomiting.
| Modafanil, (−)‐OSU6162, atomoxetine or rivastigmine compared to placebo for chronic cognitive impairment in traumatic brain injury | |||||
| Patient or population: Participants with chronic cognitive impairment in traumatic brain injury | |||||
| Outcomes | Effect of drug treatment for people with cognitive impairment in traumatic brain injury | Relative effect | No of Participants | Quality of the evidence | Comments |
| Cognitive performance on psychometric tests | The majority of sub‐tests showed no difference between treatment and placebo. Superiority over placebo was shown in one measure in Silver 2006 and several measures in Johansson 2012 and Johansson 2015. However, interpretation of these findings are cautioned. | See comment. | 274 (4 studies) | ⊕⊝⊝⊝ very low1,2,3 | Data synthesis was not possible due to the heterogeneity of studies. |
| Clinical global improvement | A single study reported no difference between treatment and placebo. | See comment. | 51 (1 study) | ⊕⊕⊝⊝ low1,3 | Data synthesis was not possible as only one study reported a measure on clinical global improvement. |
| Acceptability | No differences between treatment and placebo were found. | See comment. | 274(4 studies) | ⊕⊝⊝⊝ very low1,2,3 | Data synthesis was not possible due to the heterogeneity of studies. |
| Safety | More nausea was reported in participants receiving rivastigmine than placebo (Silver 2006). No other differences were found. | See comment. | 274 (4 studies) | ⊕⊝⊝⊝ very low1,2,3 | Data synthesis was not possible due to the heterogeneity of studies. |
| Mortality | No deaths were reported by any study. | Not estimable. | 274 (4 studies) | ‐ | |
| GRADE Working Group grades of evidence | |||||
| 1 downgraded one level due to serious indirectness, as two of four studies did not investigate cognitive impairment as a primary outcome 2 downgraded one level due to serious inconsistency, due to wide variance of point estimates. 3 downgraded one level due to serious imprecision, as the total population size was less than 400. | |||||
| Outcome or subgroup title | No. of studies | No. of participants | Statistical method | Effect size |
| 1 SF‐12 Physical Show forest plot | 1 | 51 | Mean Difference (IV, Fixed, 95% CI) | ‐2.18 [‐6.34, 1.98] |
| 2 SF‐12 Mental Show forest plot | 1 | 51 | Mean Difference (IV, Fixed, 95% CI) | 1.95 [‐2.84, 6.74] |
| 3 ImPACT verbal memory composite Show forest plot | 1 | 51 | Mean Difference (IV, Fixed, 95% CI) | 1.42 [‐4.42, 7.26] |
| 4 ImPACT visual memory composite Show forest plot | 1 | 51 | Mean Difference (IV, Fixed, 95% CI) | 0.25 [‐6.52, 7.02] |
| 5 ImPACT visual motor speed composite Show forest plot | 1 | 51 | Mean Difference (IV, Fixed, 95% CI) | ‐3.45 [‐6.48, ‐0.42] |
| 6 ImPACT reaction time composite Show forest plot | 1 | 51 | Mean Difference (IV, Fixed, 95% CI) | 0.02 [‐0.04, 0.08] |
| 7 CCPT‐II No. of omissions Show forest plot | 1 | 51 | Mean Difference (IV, Fixed, 95% CI) | 16.57 [‐3.59, 36.73] |
| 8 CCPT‐II No. of commissions Show forest plot | 1 | 51 | Mean Difference (IV, Fixed, 95% CI) | 2.00 [‐1.75, 5.75] |
| Outcome or subgroup title | No. of studies | No. of participants | Statistical method | Effect size |
| 1 SF‐12 Physical Show forest plot | 1 | 51 | Mean Difference (IV, Fixed, 95% CI) | ‐0.53 [‐5.46, 4.40] |
| 2 SF‐12 Mental Show forest plot | 1 | 51 | Mean Difference (IV, Fixed, 95% CI) | 0.41 [‐4.28, 5.10] |
| 3 ImPACT verbal memory composite Show forest plot | 1 | 51 | Mean Difference (IV, Fixed, 95% CI) | 4.11 [‐1.37, 9.59] |
| 4 ImPACT visual memory composite Show forest plot | 1 | 51 | Mean Difference (IV, Fixed, 95% CI) | ‐1.61 [‐8.97, 5.75] |
| 5 ImPACT visual motor speed composite Show forest plot | 1 | 51 | Mean Difference (IV, Fixed, 95% CI) | ‐1.44 [‐4.61, 1.73] |
| 6 ImPACT reaction time composite Show forest plot | 1 | 51 | Mean Difference (IV, Fixed, 95% CI) | ‐0.03 [‐0.08, 0.02] |
| 7 CCPT‐II No. of omissions Show forest plot | 1 | 51 | Mean Difference (IV, Fixed, 95% CI) | 15.67 [‐4.36, 35.70] |
| 8 CCPT‐II No. of commissions Show forest plot | 1 | 51 | Mean Difference (IV, Fixed, 95% CI) | 2.96 [‐0.47, 6.39] |
| Outcome or subgroup title | No. of studies | No. of participants | Statistical method | Effect size |
| 1 Trail Making Test A (seconds) Show forest plot | 1 | 6 | Mean Difference (IV, Fixed, 95% CI) | ‐9.20 [‐12.19, ‐6.21] |
| 2 Trail Making Test B (seconds) Show forest plot | 1 | 6 | Mean Difference (IV, Fixed, 95% CI) | ‐6.20 [‐7.81, ‐4.59] |
| 3 Trail Making Test C (seconds) Show forest plot | 1 | 6 | Mean Difference (IV, Fixed, 95% CI) | 28.4 [‐11.39, 68.19] |
| 4 Trail Making Test D (seconds) Show forest plot | 1 | 6 | Mean Difference (IV, Fixed, 95% CI) | 53.5 [36.76, 70.24] |
| 5 WAIS‐III Digit Symbol Coding Show forest plot | 1 | 6 | Mean Difference (IV, Fixed, 95% CI) | 8.6 [6.47, 10.73] |
| 6 WAIS‐III Digit‐Span Show forest plot | 1 | 6 | Mean Difference (IV, Fixed, 95% CI) | 1.30 [‐5.17, 7.77] |
| 7 FAS Verbal Fluency (total words) Show forest plot | 1 | 6 | Mean Difference (IV, Fixed, 95% CI) | ‐10.63 [‐27.30, 6.04] |
| Outcome or subgroup title | No. of studies | No. of participants | Statistical method | Effect size |
| 1 CDR Power of Attention (Milliseconds) Show forest plot | 1 | 53 | Mean Difference (IV, Fixed, 95% CI) | 5.31 [‐66.81, 77.43] |
| 2 CDR Continuity of Attention (% accuracy) Show forest plot | 1 | 53 | Mean Difference (IV, Fixed, 95% CI) | ‐0.25 [‐1.94, 1.44] |
| 3 CDR Efficiency (COA/POA, % accuracy/millisecond) Show forest plot | 1 | 53 | Mean Difference (IV, Fixed, 95% CI) | 0.76 [‐3.10, 4.62] |
| 4 Stroop Interference Trial 4 Show forest plot | 1 | 53 | Mean Difference (IV, Fixed, 95% CI) | 0.24 [‐2.27, 2.75] |
| 5 Adult ADHD Self‐Report Scale (ASRS‐v1.1.) Show forest plot | 1 | 53 | Mean Difference (IV, Fixed, 95% CI) | ‐1.19 [‐5.63, 3.25] |
| Outcome or subgroup title | No. of studies | No. of participants | Statistical method | Effect size |
| 1 HVLT‐total word recall Show forest plot | 1 | 157 | Mean Difference (IV, Fixed, 95% CI) | 0.21 [‐1.14, 1.56] |
| 2 HVLT‐delayed recall component retention, % Show forest plot | 1 | 157 | Mean Difference (IV, Fixed, 95% CI) | 1.06 [‐5.66, 7.78] |
| 3 HVLT–recognition discriminant index Show forest plot | 1 | 157 | Mean Difference (IV, Fixed, 95% CI) | ‐0.06 [‐0.78, 0.66] |
| 4 CANTAB RVIP’A Show forest plot | 1 | 157 | Mean Difference (IV, Fixed, 95% CI) | ‐0.01 [‐0.03, 0.00] |
| 5 CANTAB–SWM, total errors Show forest plot | 1 | 157 | Mean Difference (IV, Fixed, 95% CI) | 1.05 [‐5.85, 7.95] |
| 6 CANTAB RVIP, mean latency, ms Show forest plot | 1 | 157 | Mean Difference (IV, Fixed, 95% CI) | ‐44.54 [‐88.62, ‐0.46] |
| 7 CANTAB‐RT, simple reaction time, ms Show forest plot | 1 | 157 | Mean Difference (IV, Fixed, 95% CI) | ‐19.81 [‐59.23, 19.61] |
| 8 CANTAB‐PAL, total errors Show forest plot | 1 | 157 | Mean Difference (IV, Fixed, 95% CI) | ‐3.16 [‐10.75, 4.43] |
| 9 COWA–semantic association fluency Show forest plot | 1 | 157 | Mean Difference (IV, Fixed, 95% CI) | 0.27 [‐0.97, 1.51] |
| 10 Trail Making Test A (seconds) Show forest plot | 1 | 157 | Mean Difference (IV, Fixed, 95% CI) | ‐2.83 [‐7.38, 1.72] |
| 11 Trail Making Test B (seconds) Show forest plot | 1 | 157 | Mean Difference (IV, Fixed, 95% CI) | 3.48 [‐6.31, 13.27] |
| 12 WAIS‐III‐DS scaled score Show forest plot | 1 | 157 | Mean Difference (IV, Fixed, 95% CI) | 0.22 [‐0.33, 0.77] |
| Outcome or subgroup title | No. of studies | No. of participants | Statistical method | Effect size |
| 1 Modafinil vs placebo Show forest plot | 1 | 51 | Risk Ratio (M‐H, Fixed, 95% CI) | 4.46 [0.22, 88.61] |
| 2 Rivastigmine vs placebo Show forest plot | 1 | 157 | Risk Ratio (M‐H, Fixed, 95% CI) | 0.74 [0.35, 1.59] |
| 3 (‐)‐OSU6162 vs placebo Show forest plot | 1 | 6 | Odds Ratio (M‐H, Fixed, 95% CI) | 0.0 [0.0, 0.0] |
| 4 Atomoxetine vs placebo Show forest plot | 1 | 56 | Odds Ratio (M‐H, Fixed, 95% CI) | 0.0 [0.0, 0.0] |
| Outcome or subgroup title | No. of studies | No. of participants | Statistical method | Effect size |
| 1 Dizziness Show forest plot | 1 | 51 | Risk Ratio (M‐H, Fixed, 95% CI) | 3.56 [0.43, 29.66] |
| 2 Dysgeusia Show forest plot | 1 | 51 | Risk Ratio (M‐H, Fixed, 95% CI) | 4.46 [0.22, 88.61] |
| 3 Dyspepsia Show forest plot | 1 | 51 | Risk Ratio (M‐H, Fixed, 95% CI) | 4.46 [0.22, 88.61] |
| 4 Fatigue Show forest plot | 1 | 51 | Risk Ratio (M‐H, Fixed, 95% CI) | 4.44 [0.56, 35.41] |
| 5 Insomnia Show forest plot | 1 | 51 | Risk Ratio (M‐H, Fixed, 95% CI) | 2.67 [0.59, 11.99] |
| 6 Memory impairment Show forest plot | 1 | 51 | Risk Ratio (M‐H, Fixed, 95% CI) | 4.46 [0.22, 88.61] |
| 7 Nasopharyngitis Show forest plot | 1 | 51 | Odds Ratio (M‐H, Fixed, 95% CI) | 0.16 [0.01, 3.59] |
| 8 Nausea Show forest plot | 1 | 51 | Risk Ratio (M‐H, Fixed, 95% CI) | 2.67 [0.30, 23.96] |
| 9 Weight loss Show forest plot | 1 | 51 | Risk Ratio (M‐H, Fixed, 95% CI) | 4.46 [0.22, 88.61] |
| 10 Unknown Show forest plot | 1 | 51 | Risk Ratio (M‐H, Fixed, 95% CI) | 4.46 [0.22, 88.61] |
| Outcome or subgroup title | No. of studies | No. of participants | Statistical method | Effect size |
| 1 Nausea Show forest plot | 1 | 6 | Odds Ratio (M‐H, Fixed, 95% CI) | 0.24 [0.01, 8.62] |
| Outcome or subgroup title | No. of studies | No. of participants | Statistical method | Effect size |
| 1 Headache Show forest plot | 1 | 56 | Odds Ratio (M‐H, Fixed, 95% CI) | 0.35 [0.01, 8.85] |
| 2 Dry mouth Show forest plot | 1 | 56 | Odds Ratio (M‐H, Fixed, 95% CI) | 5.78 [0.27, 126.14] |
| 3 Globus pharyngeus Show forest plot | 1 | 56 | Odds Ratio (M‐H, Fixed, 95% CI) | 3.34 [0.13, 85.56] |
| 4 Hypertension Show forest plot | 1 | 56 | Odds Ratio (M‐H, Fixed, 95% CI) | 3.34 [0.13, 85.56] |
| 5 Insomnia Show forest plot | 1 | 56 | Odds Ratio (M‐H, Fixed, 95% CI) | 5.78 [0.27, 126.14] |
| 6 Irritable bowl Show forest plot | 1 | 56 | Odds Ratio (M‐H, Fixed, 95% CI) | 3.34 [0.13, 85.56] |
| 7 Loss of appetite Show forest plot | 1 | 56 | Odds Ratio (M‐H, Fixed, 95% CI) | 3.34 [0.13, 85.56] |
| 8 Nasal congestion Show forest plot | 1 | 56 | Odds Ratio (M‐H, Fixed, 95% CI) | 3.34 [0.13, 85.56] |
| 9 Shoulder pain Show forest plot | 1 | 56 | Odds Ratio (M‐H, Fixed, 95% CI) | 3.34 [0.13, 85.56] |
| 10 Urinary retention Show forest plot | 1 | 56 | Odds Ratio (M‐H, Fixed, 95% CI) | 3.34 [0.13, 85.56] |
| Outcome or subgroup title | No. of studies | No. of participants | Statistical method | Effect size |
| 1 Anxiety Show forest plot | 1 | 157 | Risk Ratio (M‐H, Fixed, 95% CI) | 8.67 [0.47, 158.32] |
| 2 Arthralgia Show forest plot | 1 | 157 | Risk Ratio (M‐H, Fixed, 95% CI) | 1.93 [0.36, 10.21] |
| 3 Diarrhoea Show forest plot | 1 | 157 | Risk Ratio (M‐H, Fixed, 95% CI) | 2.41 [0.48, 12.03] |
| 4 Dizziness Show forest plot | 1 | 157 | Risk Ratio (M‐H, Fixed, 95% CI) | 7.7 [0.99, 60.12] |
| 5 Headache Show forest plot | 1 | 157 | Risk Ratio (M‐H, Fixed, 95% CI) | 0.86 [0.35, 2.10] |
| 6 Nausea Show forest plot | 1 | 157 | Risk Ratio (M‐H, Fixed, 95% CI) | 3.05 [1.29, 7.22] |
| 7 Upper respiratory tract infection Show forest plot | 1 | 157 | Risk Ratio (M‐H, Fixed, 95% CI) | 2.17 [0.70, 6.74] |
| 8 Vomiting Show forest plot | 1 | 157 | Risk Ratio (M‐H, Fixed, 95% CI) | 7.7 [0.99, 60.12] |