Ne‐farmakološke intervencije za kroničnu bol u osoba s ozljedom kralježničke moždine
Referencias
References to studies included in this review
References to studies excluded from this review
References to studies awaiting assessment
References to ongoing studies
Additional references
Characteristics of studies
Characteristics of included studies [ordered by study ID]
| Methods | Cross‐over trial | |
| Participants | N (intervention/control): 30 (15/15) Type of SCI: paraplegic and tetraplegic. Lesion level was cervical in 9 participants, thoracic in 16 and lumbar in 5 Type of pain: chronic neuropathic, nerve root entrapment, visceral, musculoskeletal pain or pain of unknown origin (no definition of chronicity) Additional pain treatment: reduction and (if possible) cease of other analgesic, anxiolytic or antidepressive medication Age (years) mean/SD (range): not indicated Gender (male/female): not indicated Country of study: UK Setting: residential educational centre | |
| Interventions | Experimental group: non‐invasive transcranial electrostimulation (tCET) Control group: sham tCET Duration of intervention: 53 minutes, twice daily on 4 successive days | |
| Outcomes | Pain: McGill Pain Questionnaire (SF‐MPQ) present pain index subscale, based on 6‐point VAS scale (range 0‐5) with 10 cm width (no anchors stated) Anxiety: State Trait Anxiety Inventory (STAI) Depression: Beck Depression Index (BDI) Measurement time points: before first intervention and after each session Follow‐up measures: none | |
| Notes | During the second cross‐over intervention period, it was decided that all participants should receive active treatment. Data from this study period were disregarded. Data from the first study period were included as if originating from a parallel‐group trial | |
| Risk of bias | ||
| Bias | Authors' judgement | Support for judgement |
| Random sequence generation (selection bias) | Low risk | Participants could choose their devices, which had an identical look; this was considered equivalent to drawing lots from an urn |
| Allocation concealment (selection bias) | Low risk | Was assumed because of randomisation methods used |
| Blinding of participants and personnel (performance bias) | Low risk | Quote: "The devices were numbered for identification but neither the administrators nor the recipients of the treatment could distinguish between the devices" |
| Blinding of outcome assessment (detection bias) | Low risk | Quote: "The questionnaires were collated and forwarded to professional statisticians, Priority Search, Sheffield, UK, who analyzed the data after the first and second arm[s] of the study, unaware as to which group received tCET and which received sham treatment" |
| Incomplete outcome data (attrition bias) | Low risk | 3 participants dropped out for reasons not related to study participation |
| Selective reporting (reporting bias) | High risk | Pain score values were not provided for all measurement time points |
| Other bias | Low risk | No other bias was observed |
| Methods | Parallel‐group randomised controlled trial, referred to as pilot study | |
| Participants | N (intervention/control): 42, of those 35 with SCI (16/19) Type of SCI: tetraplegic or paraplegic with ASIA criteria C6 or lower Type of pain: shoulder pain (no definition of chronicity) Additional pain treatment: not indicated Age (years) mean/SD (range): 35/8 (range not indicated) Gender (male/female): 35/7 Country of study: USA Setting: outpatient clinic | |
| Interventions | Experimental group: home‐based exercise programme including 2 static stretching exercises and 3 strengthening exercises for posterior shoulder muscles, twice‐daily stretching, once‐daily strengthening. Control group: no treatment Duration of intervention: 6 months | |
| Outcomes | Pain: Wheelchair User's Shoulder Pain Index (WUSPI), measures pain intensity during performance of daily living with 15 items, using VAS 10 cm with anchors "no pain" to "worst pain ever experienced" (score range 0‐150) Measurement time points: before intervention and every 2 months during 6‐month period Follow‐up measures: none | |
| Notes | Study author provided data on the SCI subgroup upon request. | |
| Risk of bias | ||
| Bias | Authors' judgement | Support for judgement |
| Random sequence generation (selection bias) | Unclear risk | Not specified |
| Allocation concealment (selection bias) | Unclear risk | Not specified |
| Blinding of participants and personnel (performance bias) | High risk | Blinding was not possible because of the nature of the experimental intervention |
| Blinding of outcome assessment (detection bias) | Unclear risk | Not specified |
| Incomplete outcome data (attrition bias) | Low risk | 7 participants dropped out for reasons not related to the study intervention |
| Selective reporting (reporting bias) | Low risk | Study author provided data on the SCI subgroup upon request |
| Other bias | High risk | Important baseline difference in pain scores between intervention and control groups |
| Methods | Parallel‐group randomised controlled trial | |
| Participants | N (intervention/control): 12 randomly assigned, 11 analysed (6/5) Type of SCI: traumatic SCI; 2 participants with complete, 9 with incomplete lesions, lesion level between T4 and T12 Type of pain: chronic central pain, minimum duration of 12 months Additional pain treatment: Participants were instructed not to change usual dosage throughout the experiment and follow‐up periods Age (years) mean/SD (range): 54/6 (44‐60) Gender (male/female): 7/4 Country of study: Israel Setting: outpatient clinic of rehabilitation centre at general hospital | |
| Interventions | Experimental group: repetitive transcranial magnetic stimulation (rTMS) of the motor cortex. 500 trains were delivered at a frequency of 5 Hz for 10 seconds with 30 second intertrain interval Control group: sham rTMS Duration of intervention: 10 daily sessions, each lasting 15‐30 minutes | |
| Outcomes | Chronic pain intensity: VAS with 11‐point scale (range 0‐10), anchors "no pain" to "the most intense pain sensation imaginable" Chronic pain experience: McGill Pain Questionnaire (MPQ) Depression: Beck Depression Inventory (BDI) Measurement time points: VAS: before each session, then every 5 minutes during session and immediately thereafter Pain threshold: before first and after 5th and 10th sessions MPQ: before first session, then after 5th and 10th sessions and between 2 and 6 weeks after last intervention BDI: before first and after 10th session and between 2 and 6 weeks after last intervention | |
| Notes | ||
| Risk of bias | ||
| Bias | Authors' judgement | Support for judgement |
| Random sequence generation (selection bias) | Unclear risk | Not specified |
| Allocation concealment (selection bias) | Unclear risk | Not specified |
| Blinding of participants and personnel (performance bias) | Low risk | Quote: "The patients as well as the person conducting the outcome measurements were blind to the type of treatment received" |
| Blinding of outcome assessment (detection bias) | Low risk | Quote: "The patients as well as the person conducting the outcome measurements were blind to the type of treatment received" |
| Incomplete outcome data (attrition bias) | Low risk | No missing outcome data indicated, one dropout due to reason not related to study |
| Selective reporting (reporting bias) | Low risk | Outcomes listed in Results and Methods sections are identical |
| Other bias | High risk | Important baseline difference in pain scores between intervention and control groups |
| Methods | Factorial randomised controlled trial | |
| Participants | N (intervention/control): 40 (20 neuropathic pain/20 musculoskeletal pain) Type of SCI: C4 and below (range C4‐L3, most common was C5). 42% of participants had complete sensory loss, 35% complete motor and sensory loss Type of pain: neuropathic and musculoskeletal pain (average duration in participants was 9.35 years, SD 9) Additional pain treatment: no Age (years) mean/SD (range): 46/14.7 (range not indicated) Gender (male/female): 35/5 Country of study: USA Setting: inpatient and outpatient spinal cord unit | |
| Interventions | Participants were allocated to 1 of 4 groups:
TENS was a continuous square wave pulse stimulation delivered at 100 pulses per second and individual adaption for each participant such that a painless paraesthesia was produced. A positive/neutral treatment expectation was created by showing a short instructional video to participants with a script of positive/neutral content Duration of intervention: 1 session of 30 minutes | |
| Outcomes | Pain: Descriptor Differentiation Scale (DDS) of pain intensity and pain unpleasantness Measurement time points: baseline, during intervention after 10 and 20 minutes, immediately after intervention (baseline + 30 minutes) and 30 minutes after treatment (baseline + 1 hour) Follow‐up measures: 30 minutes after treatment | |
| Notes |
| |
| Risk of bias | ||
| Bias | Authors' judgement | Support for judgement |
| Random sequence generation (selection bias) | Low risk | Computer generated (personal communication by author) |
| Allocation concealment (selection bias) | Unclear risk | Not indicated |
| Blinding of participants and personnel (performance bias) | High risk | Double blinding was not successful according to the trial report |
| Blinding of outcome assessment (detection bias) | Low risk | Quote: "The research assistant, who had the most contact with each subject, also could not predict TENS or expectancy condition" |
| Incomplete outcome data (attrition bias) | Low risk | No missing outcome data indicated |
| Selective reporting (reporting bias) | Low risk | Outcomes listed in Results and Methods sections are identical |
| Other bias | Low risk | No other bias was observed |
| Methods | Parallel‐group randomised clinical trial | |
| Participants | N (intervention/control): 24 enrolled; 18 completed study and data were analysed (9/9) Type of SCI: 8 with tetraplegia and 16 with paraplegia, lesion level between C6 and T12 Type of pain: chronic musculoskeletal shoulder pain for longer than 3 months Additional pain treatment: no additional medication prescribed during study duration, weekly log for usual intake of medication Age (years) mean/SD (range): 43.5/11.1 (28‐69) (for final sample of 18 participants: 45.1/11.4 (no range stated)) Gender (male/female): 18/6; for final sample: 14/4 Country of study: USA Setting: outpatient clinic of rehabilitation hospital | |
| Interventions | Experimental group: acupuncture with 6 local and 2 distal points in sessions lasting 20‐30 minutes Second intervention group: Trager treatment (specific type of manual therapy) with sessions lasting approximately 45 minutes Duration of intervention: 10 sessions over 5 weeks | |
| Outcomes | Pain: Wheelchair User's Shoulder Pain Index (WUSPI),15‐item self‐report questionnaire, total index score 0‐150 NRS for average, most severe and least severe shoulder pain (11‐point scale ranging from 0‐10 with anchors "no pain" to "worst pain ever experienced"); 6‐point verbal rating scale (VRS) with anchors "much worse" to "cured/pain free" ("no change" in middle of scale) for change in pain (not included in meta‐analysis) Weekly log of activity, medication intake and pain Measurement time points: WUSPI and NRS weekly, VRS at baseline and after follow‐up period Follow‐up measures: 5 weeks after end of intervention | |
| Notes |
| |
| Risk of bias | ||
| Bias | Authors' judgement | Support for judgement |
| Random sequence generation (selection bias) | Low risk | Quote: "All subjects completing the baseline were randomised consecutively by the investigators by using blocked randomisation into either an acupuncture or a Trager treatment group. Subjects with a prior history of acupuncture or Trager were randomised separately by means of a coin toss" |
| Allocation concealment (selection bias) | Unclear risk | Not specified |
| Blinding of participants and personnel (performance bias) | High risk | Not possible because of the type of intervention. Quote: "Neither subjects nor practitioners were blinded to the treatments they received or performed, respectively" |
| Blinding of outcome assessment (detection bias) | Low risk | Quote: "Only evaluators were blinded to treatment group assignment" |
| Incomplete outcome data (attrition bias) | Low risk | Quote: "Four subjects withdrew during the first week of the baseline period, before treatment group randomization (1 for medical reasons; 3 for personal reasons). Two additional subjects withdrew during the treatment period because of unrelated medical conditions" |
| Selective reporting (reporting bias) | Low risk | Outcomes listed in Results and Methods sections are identical |
| Other bias | Low risk | No other bias was observed |
| Methods | Parallel‐group randomised clinical trial | |
| Participants | N (intervention/control): 23 included; 17 analysed (8/9) Type of SCI: 8 with tetraplegia, 15 with paraplegia Type of pain: chronic musculoskeletal shoulder pain for longer than 3 months Additional pain treatment: Participants were instructed to document intake in weekly diaries Age (years) mean/SD (range): 39.9/10.3 (21‐65) Gender (male/female): 18/5 Country of study: USA Setting: outpatient clinic at a clinical research centre | |
| Interventions | Experimental group: acupuncture Control group: sham acupuncture Duration of intervention: 10 sessions over 5 weeks (range 5‐8 weeks) | |
| Outcomes | Pain: Wheelchair User's Shoulder Pain Index (WUSPI) Numerical rating scale (NRS) measuring average shoulder pain intensity on a 11‐point scale (range 0‐10) with anchors "no pain" to "worst pain ever experienced" Measurement time points: weekly assessment during baseline period (4 weeks), treatment period (5 weeks) and follow‐up period (5 weeks) Follow‐up measures: during 5 weeks | |
| Notes |
| |
| Risk of bias | ||
| Bias | Authors' judgement | Support for judgement |
| Random sequence generation (selection bias) | Unclear risk | Not specified how block randomisation was done |
| Allocation concealment (selection bias) | Unclear risk | Not specified |
| Blinding of participants and personnel (performance bias) | High risk | Participants were blinded but risk of bias due to impossibility of blinding acupuncturist |
| Blinding of outcome assessment (detection bias) | Low risk | Quote: "All participants and the principal investigator were blinded as to group assignment. In an effort to maintain the blind, participants were asked to not discuss details about their treatment experience with other participants or the principal investigator" |
| Incomplete outcome data (attrition bias) | Low risk | Data for 1 (NRS) of 2 pain scores were missing for only 1 participant. Risk of resulting bias was deemed low |
| Selective reporting (reporting bias) | Low risk | Outcomes listed in Results and Methods sections are identical |
| Other bias | Low risk | No other bias was observed |
| Methods | Parallel‐group randomised controlled trial | |
| Participants | N (intervention/control): 17 (11/6) Type of SCI: traumatic SCI, Frankel score A‐D Type of pain: stable chronic neuropathic pain for at least 3 preceding months Additional pain treatment: standard medication (any changes were recorded) Age (years) mean/SD (range): 35.7/13.3 (range not indicated) Gender (male/female): 14/3 Country of study: Brazil Setting: pain clinic | |
| Interventions | Experimental group: transcranial direct current stimulation (tDCS) with a constant current of 2 mA intensity (subthreshold intensity) Control group: sham tDCS Duration of intervention: 20 minutes during 5 consecutive days | |
| Outcomes | Pain: 11‐point (0‐10) VAS for pain during preceding 24 hours with anchors "no pain" to "worst pain possible" Depression: Beck Depression Index (BDI) Anxiety: VAS with range 0‐10 and anchors "no anxiety" to "worst anxiety ever" Measurement time points: at baseline, before and after each session and once during follow‐up period Follow‐up measures: 16 days | |
| Notes | Block randomisation with ratio of 2:1 (intervention to control) | |
| Risk of bias | ||
| Bias | Authors' judgement | Support for judgement |
| Random sequence generation (selection bias) | Low risk | Order of study entrance and block randomisation using previous computer‐generated randomisation list |
| Allocation concealment (selection bias) | Unclear risk | Not indicated |
| Blinding of participants and personnel (performance bias) | Low risk | Study was labelled as double blinded |
| Blinding of outcome assessment (detection bias) | Low risk | Quote: "A blinded evaluator rated the pain using the visual analogue scale for pain, Clinician Global Impression and Patient Global Assessment" |
| Incomplete outcome data (attrition bias) | Low risk | Authors performed ITT analysis |
| Selective reporting (reporting bias) | Low risk | Study author provided additional data upon request |
| Other bias | Low risk | No other bias was observed |
| Methods | Parallel‐group randomised controlled trial | |
| Participants | N (intervention/control): 61 (31/30) Type of SCI: tetraplegia and paraplegia of traumatic and non‐traumatic aetiology, with complete and incomplete lesions Type of pain: chronic neuropathic pain for at least 6 months Additional pain treatment: standard medication Age (years) mean/SD (range): 58.8/11.4 (range not stated) Gender (male/female): 39/22 Country of study: Netherlands Setting: 4 SCI rehabilitation centres | |
| Interventions | Experimental group: programme comprising educational, cognitive and behavioural elements targeted at coping with chronic pain Control group: waiting list Duration of intervention: 10 sessions of 3 hours over 10 weeks, 'comeback session' after 3 weeks | |
| Outcomes | Pain: Chronic Pain Grade (CPG) questionnaire and intensity of average pain, worst pain and current pain on 11‐point NRS, no anchors defined Depression and anxiety: Hospital Anxiety and Depression Scale (HADS): a 14‐item self‐report measure with 2 scales for anxiety and depression, each scoring 0‐21, anchors not stated Quality of life: Life Satisfaction Questionnaire (LiSat‐9) Measurement time points: at baseline, at end of programme (3 months) and at 6 months Follow‐up measures: 3 months after last session of programme | |
| Notes | ||
| Risk of bias | ||
| Bias | Authors' judgement | Support for judgement |
| Random sequence generation (selection bias) | Low risk | Website for randomisation (personal communication by author) |
| Allocation concealment (selection bias) | Low risk | Website for randomisation (personal communication by author) |
| Blinding of participants and personnel (performance bias) | High risk | Blinding of participants and personnel was not possible |
| Blinding of outcome assessment (detection bias) | Unclear risk | Not specified |
| Incomplete outcome data (attrition bias) | Low risk | Data analysed according to ITT principle |
| Selective reporting (reporting bias) | Low risk | Outcomes reported according to study protocol |
| Other bias | High risk | Despite proper randomisation, important baseline difference in scores for participation in activities |
| Methods | Parallel‐group randomised controlled trial with matched design (2 exercise: 1 control) | |
| Participants | N (intervention/control): 34 (21/13) Type of SCI: tetraplegia and paraplegia with ASIA classification A‐D, 1‐24 years after trauma Type of pain: not indicated Additional pain treatment: no Age (years) mean/SD (range): only range reported: 19‐65 years Gender (male/female): 23/11 Country of study: Canada Setting: outpatient centre for health promotion and rehabilitation | |
| Interventions | Experimental group: exercise training (and bimonthly education session) Control group: waiting list Duration of intervention: twice‐weekly training for 90‐120 minutes during 9 months | |
| Outcomes | Pain: 2 SF‐36 items on pain experience and interference with normal work in the past 4 weeks, with 6 response options from "non/not at all" to "very severe pain/extremely" Stress: Perceived Stress Scale (PSS) with 14 items and 6‐point frequency scale with anchors "all of the time" and "none of the time" Depression: Centre of Epidemiological Studies Depression Scale (CES‐D) with 4‐point Likert scale, score range 0‐60 Quality of life: 11‐item perceived quality of life scale (PQOL) with 4 additional items Measurement time points: baseline and after 3, 6 and 9 months Follow‐up measures: none | |
| Notes |
| |
| Risk of bias | ||
| Bias | Authors' judgement | Support for judgement |
| Random sequence generation (selection bias) | Unclear risk | Not indicated |
| Allocation concealment (selection bias) | High risk | Participants were matched before randomisation (ratio 2 active: 1 control) according to age, years post‐SCI and mortality risk |
| Blinding of participants and personnel (performance bias) | High risk | Not possible because of type of intervention |
| Blinding of outcome assessment (detection bias) | High risk | No blinding of outcome assessors (personal communication from authors) |
| Incomplete outcome data (attrition bias) | High risk | Analyses did not account for dropouts |
| Selective reporting (reporting bias) | Low risk | Outcomes listed in Results and Methods sections are identical |
| Other bias | Low risk | No other bias was observed |
| Methods | Parallel‐group randomised controlled trial (ratio 2 exercise:1 control) | |
| Participants | N (intervention/control): 37 (23/14) Type of SCI: spinal cord injury for 6 months or longer Type of pain: daily bothersome chronic pain (no definition of chronicity); 17 participants had neuropathic and 20 had non‐neuropathic pain Additional pain treatment: regular medication Age (years) mean/SD (range): 49.5/not indicated (19‐70) Gender (male/female): 28/9 Country of study: USA Setting: not indicated | |
| Interventions | Experimental group: self‐hypnosis Control group: electromyography biofeedback relaxation training Duration of intervention: 10 sessions with variable frequency from daily to weekly (depending on preferences of participants) | |
| Outcomes | Pain: NRS for average daily pain and current pain intensity using 11‐point scale (score 0‐10) anchored "no pain" to "most intense pain sensation imaginable"; modified Brief Pain Inventory (BPI) Depression: Center for Epidemiology Studies Depression Scale (CES‐D) Measurement time points: pretreatment and post‐treatment and at end of follow‐up Follow‐up measures: 3 months | |
| Notes | Participants had been recruited earlier for another prior pain study | |
| Risk of bias | ||
| Bias | Authors' judgement | Support for judgement |
| Random sequence generation (selection bias) | Low risk | Computer‐generated random sequence |
| Allocation concealment (selection bias) | Low risk | Allocation was concealed (personal communication by authors) |
| Blinding of participants and personnel (performance bias) | High risk | Not possible because of types of interventions |
| Blinding of outcome assessment (detection bias) | Low risk | Outcome assessor was blinded (personal communication by study authors) |
| Incomplete outcome data (attrition bias) | Low risk | All outcome data reported |
| Selective reporting (reporting bias) | Low risk | Outcomes listed in Results and Methods sections are identical and match study protocol |
| Other bias | High risk | Important baseline differences in pain scores between intervention and control groups |
| Methods | Cross‐over trial | |
| Participants | N (intervention/control): 13; of those, 11 analysed; each participant received both rTMS and sham rTMS Type of SCI: 6 with paraplegia and 5 with tetraplegia; 6 with motor incomplete and 5 with motor complete SCI Type of pain: chronic neuropathic pain for at least 15 months Additional pain treatment: Participants were instructed not to change their usual pain medication Age (years) mean/SD (range): 54.8/13.7 years (33 to 75) Gender (male/female): 6/5 Country of study: South Korea Setting: outpatient clinic of university hospital | |
| Interventions | Experimental group: rTMS (20 trains of 10 Hz stimulation during 5 seconds with 55 second interval) Control group: sham rTMS Duration of intervention: daily on 5 consecutive days, real and sham rTMS were separated by a 12‐week "wash‐out period" | |
| Outcomes | Pain: 11‐point NRS (range 0‐10) for average and worst pain during the preceding 24 hours, anchored "no pain sensation" to "most intense pain sensation imaginable" Brief Pain Inventory (BPI) (not included in meta‐analysis) Measurement time points: before, immediately after 3rd and 5th sessions; then 1, 3, 5 and 7 weeks after last intervention Follow‐up measures: 7 weeks | |
| Notes | ||
| Risk of bias | ||
| Bias | Authors' judgement | Support for judgement |
| Random sequence generation (selection bias) | Unclear risk | Allocation code mentioned but no additional information about randomisation method Quote: "The real and sham rTMS stimulations were separated by 12 weeks and performed in a random order according to the prepared allocation code" Comment: less critical in cross‐over design |
| Allocation concealment (selection bias) | Unclear risk | Not indicated but deemed less critical in cross‐over study |
| Blinding of participants and personnel (performance bias) | Low risk | Quote: "(...) the investigator who applied the stimulation coil to the participants was not involved in the recruitment or evaluation of the participants" |
| Blinding of outcome assessment (detection bias) | Low risk | Quote: "To ensure that the study was performed double‐blind, 1 researcher applied the magnetic stimulation and a different researcher collected the clinical data; the latter researcher was not aware of the type of rTMS (real or sham) that had been used for each patient" |
| Incomplete outcome data (attrition bias) | Low risk | No dropouts during intervention period |
| Selective reporting (reporting bias) | Low risk | Data are reported comprehensively |
| Other bias | Low risk | No other bias was observed |
| Methods | Cross‐over trial | |
| Participants | N (intervention/control): 19. Each participant received both repetitive transcranial magnetic cortical stimulation (rTMS) and sham rTMS Type of SCI: cervical level, aetiology: ischaemic, traumatic, surgical, post‐traumatic cervical syringomyelia. Information was provided in only 1 of 3 publications (Lefaucheur 2006) Type of pain: chronic intractable unilateral neurogenic pain for 1‐7 years Additional pain treatment: standard individual treatment Age (years) mean/SD (range): mean/SD not indicated (range 34‐72) Gender (male/female): 15/4 Country of study: France Setting: not indicated | |
| Interventions | Experimental group: rTMS, 20 trains of 6 seconds with 54 second interval at 10 Hz or a single train of 20 minutes at 1 Hz Control group: sham rTMS Duration of intervention: 2 or 3 sessions of 20 minutes each; sessions were separated by at least 3 weeks | |
| Outcomes | Pain level: VAS with range 0‐10, relative change in pain level before versus after session Measurement time points: pre‐treatment and post‐treatment Follow‐up measures: none | |
| Notes | Data on participants from 3 studies by same group were combined (Lefaucheur 2004,Lefaucheur 2006; Lefaucheur 2008). For detailed information about individual studies, see Characteristics of studies awaiting classification (Lefaucheur 2004, 2006 and 2008) | |
| Risk of bias | ||
| Bias | Authors' judgement | Support for judgement |
| Random sequence generation (selection bias) | Unclear risk | Quote: “one of the following two protocols was applied in a random order” |
| Allocation concealment (selection bias) | Unclear risk | Not indicated |
| Blinding of participants and personnel (performance bias) | Low risk | Participants were not informed that a sham intervention was being provided |
| Blinding of outcome assessment (detection bias) | Unclear risk | Not indicated |
| Incomplete outcome data (attrition bias) | Low risk | No information about dropouts. Likelihood of dropout during 2 intervention periods was deemed low |
| Selective reporting (reporting bias) | Unclear risk | Outcome data were reported clearly and comprehensively. 2 of the 3 publications did not include information about adverse events |
| Other bias | High risk | Multiple publications of some outcome data are not made transparent in publications but were disclosed upon request |
| Methods | Parallel‐group randomised controlled trial | |
| Participants | N (intervention/control)= 80 (40/40) Type of SCI: all with paraplegia, 64 had motor complete lesions (ASIA A or B) Type of pain: chronic shoulder pain. Average pain duration in participants was 66 months Additional pain treatment: not indicated Age (years) mean/SD: 45.0/11.2 (range not indicated) Gender male/female: 57/23 Country of study: USA Setting: outpatient clinic of rehabilitation centre | |
| Interventions | Experimental group: home‐based exercise programme to optimise movement, consisting of shoulder strengthening and stretching exercises, along with recommendations on how to optimise the movement technique of transfers, raises and wheelchair propulsions Control group: viewing of a 1‐hour educational video (as minimal intervention) Duration of intervention: exercise programme 3 times a week over 12 weeks | |
| Outcomes | Pain: VAS for shoulder pain (0‐10 cm), anchors not indicated; Wheelchair User's Shoulder Pain Index (WUSPI) total score 150 Measurement time points: All participants were evaluated before and after the 12‐week intervention, and 4 weeks after the end of the intervention Follow‐up measures: 4 weeks | |
| Notes |
| |
| Risk of bias | ||
| Bias | Authors' judgement | Support for judgement |
| Random sequence generation (selection bias) | Low risk | Computer‐generated randomisation list |
| Allocation concealment (selection bias) | Low risk | Allocation was concealed until the time of intervention assignment |
| Blinding of participants and personnel (performance bias) | High risk | Not possible because of type of study intervention |
| Blinding of outcome assessment (detection bias) | Low risk | All participants were assessed by a blinded evaluator before and after the 12‐week intervention and 4 weeks after the end of the intervention (week 16) |
| Incomplete outcome data (attrition bias) | Low risk | Complete case analysis and intention‐to‐treat (ITT) analysis for all randomly assigned participants |
| Selective reporting (reporting bias) | Low risk | VAS scores for change between post‐intervention and follow‐up were not reported (for ITT analysis, all data were used) |
| Other bias | Unclear risk | Participants were free to continue exercises during follow‐up phase (possible source of bias) |
| Methods | Factorial randomised controlled trial | |
| Participants | N (intervention/control): 40, of those 39 analysed in 4 groups (N = 10, 10, 9, 10) Type of SCI: lesion level C4‐T12, ASIA classification A and B, 1‐31 years post‐SCI Type of pain: chronic neuropathic pain with pain intensity of 4 or higher on NRS 0‐10 for at least 6 months Additional pain treatment: Publication lists individual pain medication for each participant Age (years) mean/SD (range): 45/15.5 (21‐66) Gender (male/female): 30/9 Country of study: Spain Setting: rehabilitation centre | |
| Interventions | 4 study groups:
Duration of intervention: 10 sessions of 20 minutes each during 2 weeks | |
| Outcomes | Pain: NRS (0‐10) for average pain intensity in previous 24 hours with anchors "no pain" to "unbearable pain" Brief Pain Inventory (BPI) interference subscale, score range 0‐10 with anchors "no interference" to "complete interference" (not included in meta‐analysis) Anxiety: NRS anxiety scale range 0‐10 with anchors "no anxiety" to "worst anxiety" Adverse effects: open‐ended question Measurement time points: baseline; days 14, 24 and 38; and after 12 weeks Follow‐up measures: 12 weeks | |
| Notes |
| |
| Risk of bias | ||
| Bias | Authors' judgement | Support for judgement |
| Random sequence generation (selection bias) | Low risk | Quote: "We used a computer‐generated list as randomization strategy" |
| Allocation concealment (selection bias) | Unclear risk | Not specified |
| Blinding of participants and personnel (performance bias) | Low risk | Quotes: "A second researcher, who applied the interventions, remained blind to the findings of the clinical evaluation. Assignment of the patients to the treatment interventions was random, and patients remained blinded to their treatment condition and the specific hypotheses of the study" "At the end of the treatment sessions none of the patients could tell whether they had undergone real or sham transcranial DCS, even when explicitly asked" |
| Blinding of outcome assessment (detection bias) | Low risk | Quote: "The same researcher, who was blind to the treatment interventions, performed all clinical evaluations" |
| Incomplete outcome data (attrition bias) | Low risk | Dropouts unrelated to study |
| Selective reporting (reporting bias) | Low risk | Study author provided missing data upon request |
| Other bias | Low risk | No other bias was observed |
| Methods | Parallel‐group randomised controlled trial | |
| Participants | N (intervention/control): 40 enrolled, 38 analysed (18/20) Type of SCI: ASIA A‐C classification: 16 with paraplegia (6 active/10 sham) and 8 with tetraplegia (4 active/4 sham); ASIA D classification: 14 (8 active/6 sham); 33 with traumatic aetiology (15 active/18 sham) and 5 non‐traumatic (3 active/2 sham). Delay since SCI between 6 months and 60 years Type of pain: chronic musculoskeletal or neuropathic pain (12 in active/11 in sham group), musculoskeletal pain (6 in active/9 in sham group), duration of at least 3 months Additional pain treatment: not indicated Age (years) mean/SD (range): experimental group: 56.0/8.3; control group: 56.6/10.9; overall range: 38‐82 years (not indicated for study groups) Gender (male/female): 40/0 Country of study: USA Setting: medical centre, SCI care line | |
| Interventions | Experimental group: cranial electrotherapy stimulation (CES) with 100 µA (subthreshold) Control group: sham CES Duration of intervention: 1 hour during consecutive 21 days | |
| Outcomes | Pain: NRS (scale 0‐10) for daily pain with anchors "no pain" to "pain as bad as you can imagine" Brief Pain Inventory (BPI) modified for persons with disabilities, pain intensity subscale (0‐10) with anchors "no pain" to "pain as bad as you can imagine," participants rated pain "at its worst in the past 24 hours", "at its least in the past 24 hours", "on average" and "right now" (not included in meta‐analysis) Interference of pain with QOL: modified BPI scale 0‐10 with anchors "does not interfere" to "interferes completely" Measurement time points: daily pre‐intervention and post‐intervention Follow‐up measures: not indicated | |
| Notes |
| |
| Risk of bias | ||
| Bias | Authors' judgement | Support for judgement |
| Random sequence generation (selection bias) | Unclear risk | Not indicated |
| Allocation concealment (selection bias) | Unclear risk | Not indicated |
| Blinding of participants and personnel (performance bias) | Low risk | Quotes: "Participants were unable to determine whether they were receiving active or sham CES, since the amount of electrical stimulation was set at a subthreshold level and could not be changed by the participants." "The investigators, research assistant (RA), and participants were blinded to treatment type until the end of the initial phase" |
| Blinding of outcome assessment (detection bias) | Low risk | Investigators were blinded until the end of the initial phase |
| Incomplete outcome data (attrition bias) | Unclear risk | No information about 2 dropouts. Likelihood that data on dropouts would change results was deemed low |
| Selective reporting (reporting bias) | Low risk | Outcomes listed in Results and Methods sections are identical |
| Other bias | Low risk | No other bias was observed |
| Methods | Parallel‐group randomised controlled trial | |
| Participants | N (intervention/control): 105 (46/59) Type of SCI: complete and incomplete tetraplegia or paraplegia Type of pain: chronic neuropathic pain at or below lesion level for at least 6 months with intensity of 5 or higher on 10‐point NRS Additional pain treatment: not indicated Age (years) mean/SD (range): active group: 52.1/10.5 (27‐79), sham group: 52.5/11.7 (26‐80) Gender (male/female): 90/15 (intervention 38, control 52 male) Country of study: USA Setting: outpatient clinics at 4 rehabilitation centres; device was applied at home | |
| Interventions | Experimental group: cranial electrotherapy stimulation (CES) of 100 microamperes subsensation Control group: sham CES Duration of intervention: 1 hour daily during 21 days | |
| Outcomes | Pain: Pain Intensity and Pain Interference Subscales of Brief Pain Inventory (BPI) adapted for persons with disability Pain subscale of SF‐36; Paroxysmal, Deep, and Surface Pain subscales of the Pain Quality Assessment Scale (PQAS); pain beliefs and pain coping (Maladaptive and Adaptive Coping) subscales of the Two‐Item Measures of Pain Beliefs and Coping Strategies (not included in meta‐analysis) Quality of life: Short Form Health Survey (SF‐12) Anxiety: Short‐Form State‐Trait Anxiety Inventory (SF‐STAI‐6) Depression: 10‐item short form of the Center for Epidemiologic Studies‐Depression Scale (CES‐D‐10) Measurement time points: pre‐intervention and post‐intervention Follow‐up measures: none | |
| Notes |
| |
| Risk of bias | ||
| Bias | Authors' judgement | Support for judgement |
| Random sequence generation (selection bias) | Low risk | Quote: "Randomization was achieved by selecting a device from a box initially containing equal numbers of active and sham devices" |
| Allocation concealment (selection bias) | Low risk | Concealment ensured by allocation method |
| Blinding of participants and personnel (performance bias) | Low risk | Quote: "The equipment was set up for a double‐blind study by the manufacturer such that the participants could not differentiate active from sham CES devices" |
| Blinding of outcome assessment (detection bias) | Low risk | Quote: "Research staff members who interacted with the participants (e.g. recruited and trained participants, administered questionnaires, followed up by telephone) did not know which devices were sham and which were active" |
| Incomplete outcome data (attrition bias) | High risk | Analyses did not account for dropouts |
| Selective reporting (reporting bias) | Low risk | Outcomes listed in Results and Methods sections are identical |
| Other bias | High risk | Baseline imbalance in 3 of 4 pain outcome measures (BPI pain interference subscale, 36‐item short‐form health survey (SF‐36) pain subscale, 2‐item measures of pain beliefs and coping strategies maladaptive coping subscale)) and in 3 outcome measures on anxiety and depression (SF‐12 mental component summary, CES‐D‐10 and SF‐STAI‐6) |
Characteristics of excluded studies [ordered by study ID]
| Study | Reason for exclusion |
| No proper randomisation (personal communication by study author) | |
| Study on pain in acute phase after SCI | |
| Follow‐up publication of study by Hicks et al (2003). Study report provides data from participants who agreed to continue with the study intervention as well as additional follow‐up measurements and no additional randomisation | |
| Quasi‐experimental study | |
| Included only 1 participant with SCI | |
| Did not focus on treatment for chronic pain | |
| No proper randomisation. Quote: "Due to the low number of volunteers, it was not possible to carry out 2 parallel groups of treatment regimens, making randomisation impossible" | |
| No proper randomisation. Quote: "Every other patient enrolled was assigned to start with HF TENS" | |
| Controlled study without randomisation | |
| Retrospective case series | |
| No proper randomisation (treatment allocation by geographical location of residence) | |
| No proper randomisation (treatment allocation according to admission time) |
Characteristics of studies awaiting assessment [ordered by study ID]
| Methods | Randomised controlled trial |
| Participants | N (intervention/control): 40/40 Type of SCI: C2‐T12 spinal cord injury, classified as AIS grades C and D Type of pain: not indicated |
| Interventions | Experimental group: Lokomat Control group: overground therapy for walking Duration of intervention: 40 sessions during 8 weeks |
| Outcomes | Pain: visual analogue scale (VAS) (0‐10) |
| Notes | Will be considered in next update |
| Methods | Experimental study |
| Participants | N (intervention/control): 13/17/16 Type of SCI: traumatic SCI, 33 participants with complete SCI (ASIA level A), 14 with incomplete SCI (ASIA level B, C, D) Type of pain: 21 with pure neuropathic pain and 26 with both nociceptive and neuropathic pain Additional pain treatment: All participants were treated with antidepressants Gender (male/female): 39/7 Country of study: Italy Setting: inpatient spinal cord unit |
| Interventions | 3 experimental groups: osteopathic treatment, pharmacological treatment and pharmacological and osteopathic treatment |
| Outcomes | Pain: 11‐point verbal numerical scale (VNS), range 0‐10, anchors "absence of pain" to "worst possible pain experienced" |
| Notes | Will be considered in next update |
| Methods | Pilot single‐centre study, randomised cross‐over trial |
| Participants | N (intervention/control): 20/20 Type of SCI: 33 participants with tetraplegia, 7 with paraplegia Type of pain: any level of pain Age (years) mean/SD (range): 40.24/13.8 Gender (male/female): 33/7 Country of study: USA Setting: free‐standing, not‐for‐profit, comprehensive rehabilitation centre specialising in SCI rehabilitation |
| Interventions | Experimental group: broad compression massage (BCM) Control group: light contact touch (LCT) Duration of intervention: six 20‐minute treatment sessions over 2 weeks |
| Outcomes | Pain: Brief Pain Inventory Short Form (BPI‐SF), modified to assess symptoms in the last 24 hours |
| Notes | Will be considered in next update |
| Methods | Experimental study with randomly assigned sham interventions |
| Participants | Among others, 2 people with spinal cord lesion |
| Interventions | Repetitive transcranial magnetic stimulation (rTMS) |
| Outcomes | Visual analogue scale (VAS) and short form of McGill Pain Questionnaire (SF‐MPQ) |
| Notes | Unclear whether randomly assigned (study authors did not respond to our requests), possible overlap with Saitoh 2007a |
| Methods | Randomised cross‐over study |
| Participants | N (intervention/control): 16 participants Type of SCI: complete or incomplete motor SCI, 12 paraplegia, 4 tetraplegia Type of pain: chronic neuropathic pain (for at least 3 months) |
| Interventions | Experimental group: repetitive transcranial magnetic cortical stimulation (rTMS), 10 Hz (total of 2000 stimuli) in random order over the hand or leg Control group: sham rTMS |
| Outcomes | Pain: 11‐point NRS (range 0‐10) with anchors 0 = no pain sensation to 10 = the worst possible pain |
| Notes | Will be considered with next update |
| Methods | Cross‐over trial |
| Participants | N (intervention/control): total study size 60, of those 12 with SCI Type of SCI: not indicated Type of pain: chronic intractable unilateral lower limb pain of neurogenic aetiology (no definition of chronicity) Additional pain treatment: not indicated Age (years) mean/SD (range): 53.5/12.0 (34‐72) Gender (male/female): 9/3 Country of study: France Setting: not indicated |
| Interventions | Experimental group: repetitive transcranial magnetic cortical stimulation (rTMS), 10 Hz over hand motor cortex (20 trains over 5 seconds with 55 second intertrain interval) Control group: sham rTMS Duration of intervention: 1 session of 20 minutes per week, interventions separated by at least 3 weeks |
| Outcomes | Pain: 11‐point VAS (range 0‐10), relative change in pain level pre/post each session (no anchors stated) Measurement time points: pre‐treatment and post‐treatment Follow‐up measures: no |
| Notes | Study author provided individual data for SCI subgroup upon request |
| Methods | Cross‐over trial |
| Participants | N (intervention/control): total study size 22, of those 4 with SCI Type of SCI: cervical level, aetiology: ischaemic, traumatic, surgical, post‐traumatic cervical syringomyelia Type of pain: chronic intractable unilateral lower limb pain of neurogenic aetiology for 4‐7 years Additional pain treatment: individual standard treatment Age (years) mean/SD (range): 63/7.8 (range 48‐72) Gender (male/female): 2/2 Country of study: France Setting: not indicated |
| Interventions | Experimental group: repetitive transcranial magnetic cortical stimulation (rTMS), 10 Hz (20 trains during 6 seconds with 54 second intertrain interval) or a single train during 20 minutes at 1 Hz and 90% of rTMS using an active coil (1200 pulses) Control group: sham rTMS Duration of intervention: 3 sessions of 20 minutes separated by at least 3 weeks |
| Outcomes | Pain: 11‐point VAS (range 0‐10), relative change in pain level pre/post each session Measurement time points: pre‐treatment and post‐treatment Follow‐up measures: no |
| Notes | Data on 3 of the 4 SCI participants were already used in previous publication (Lefaucheur 2004) |
| Methods | Cross‐over trial |
| Participants | N (intervention/control): total study size 46, of those 10 with SCI Type of SCI: not indicated Type of pain: chronic drug‐resistant unilateral neuropathic pain in at least the hand for at least 1 year Additional pain treatment: not indicated Age (years) mean/SD (range): 54/11.8 (range 34‐72) Gender (male/female): 9/1 Country of study: France Setting: not indicated |
| Interventions | Experimental group: repetitive transcranial magnetic cortical stimulation (rTMS), 10 Hz (20 trains during 6 seconds with 54 second intertrain interval) or a single train of 20 minutes in duration at 1 Hz and 90% of rTMS over the motor cortex using an active coil (1200 pulses) Control group: sham rTMS Duration of intervention: 3 sessions of 20 minutes separated by at least 3 weeks |
| Outcomes | Pain: 11‐point VAS 0‐10, relative change in pain level pre/post each session Measurement time points: pre‐treatment and post‐treatment Follow‐up measures: no |
| Notes | Data on 4 of the 10 SCI participants were already used in previous publication (Lefaucheur 2004) |
| Methods | Pilot randomised study |
| Participants | Wheelchair rugby athletes |
| Interventions | 2 types of respiratory resistance training |
| Outcomes | SF‐36 v2 item 'Bodily pain,' health‐related QOL was a secondary study outcome |
| Notes | Will be considered with next update |
| Methods | Experimental study |
| Participants | N (intervention/control): 20/20 Type of SCI: paraplegia (spinal cord lesions at thoracic level) Type of pain: severe painful spasticity of lower extremities Age (years) mean/SD (range): 27.6/7.8 in group with Pourpre technique and 27.1/8.3 with Bischof II technique Gender (male/female): 29/11 Country of study: Israel and Russia Setting: in‐hospital spinal care unit |
| Interventions | 2 experimental groups using different surgical treatments for painful spasticity (longitudinal T‐myelotomy by Bischof II technique or Pourpre technique) |
| Outcomes | Pain: McGill Short Questionnaire Spasticity: muscle tone and muscle spasm according to Ashworth and spasm frequency scales |
| Notes | Unclear whether randomised (study authors did not respond to our requests) |
| Methods | Randomised controlled trial |
| Participants | N (intervention/control): 8/7 Type of SCI: level C6 or lower; 2 or more years' duration Type of pain: musculoskeletal pain in shoulder girdle region Age (years) mean/SD (range): 38.1/not indicated (23‐56) Gender (male/female): 12/3 Country of study: USA Setting: university hospital |
| Interventions | Experimental group: EMG biofeedback and exercise Control group: exercise |
| Outcomes | Pain: WUSPI |
| Notes | Will be considered in next update |
| Methods | |
| Participants | |
| Interventions | |
| Outcomes | |
| Notes | To be considered in next update |
| Methods | Experimental study |
| Participants | Patients with intractable deafferentation pain; 2 with spinal cord lesions |
| Interventions | Repetitive transcranial magnetic stimulation (rTMS) |
| Outcomes | Visual analogue scale (VAS) and short form of McGill Pain Questionnaire (SF‐MPQ) |
| Notes | Unclear whether randomised (authors did not respond to our requests), possible overlap with Saitoh 2007a |
| Methods | Experimental study with randomly assigned sham interventions |
| Participants | Patients with intractable deafferentation pain; 2 with spinal cord lesions |
| Interventions | Repetitive transcranial magnetic stimulation (rTMS) |
| Outcomes | Pain measured on a visual analogue scale (VAS) |
| Notes | Unclear whether randomised (study authors did not respond to our requests), possible overlap with Hirayama 2006 |
| Methods | Randomised cross‐over design |
| Participants | N (intervention/control): 10 Type of SCI: thoracic SCI Type of pain: neuropathic pain for longer than 6 months Age (years) mean/SD (range): 56.1/14.9 Gender (male/female): 8/2 Country of study: Australia |
| Interventions | Experimental group: transcranial direct current stimulation (tDCS) with a constant current of 2 mA intensity Control group: sham tDCS Duration of intervention: 20 minutes over 5 consecutive days |
| Outcomes | Pain: Neuropathic Pain Scale (NPS) (item 9) using an 11‐point numerical rating scale (0 = not unpleasant; 10 = the most unpleasant sensation imaginable, ‘‘intolerable’’) Depression: Beck Depression Index (BDI) |
| Notes | Will be considered with next update |
| Methods | |
| Participants | |
| Interventions | |
| Outcomes | |
| Notes | To be considered in next update |
| Methods | |
| Participants | |
| Interventions | |
| Outcomes | |
| Notes | To be considered in the next update |
Characteristics of ongoing studies [ordered by study ID]
| Trial name or title | Acupuncture Treatment to Reduce Burning Pain in Spinal Cord Injury (APSCI) |
| Methods | Randomised controlled trial |
| Participants | People with traumatic SCI (adult onset) and burning pain below SCI level |
| Interventions | Acupuncture with electrical stimulation (electroacupuncture); sham acupuncture |
| Outcomes | Primary: improvement in burning pain; secondary: improvement in quality of life measurements |
| Starting date | September 2007 |
| Contact information | Linda M Rapson, Toronto Rehabilitation Institute, Lyndhurst Centre, Canada |
| Notes |
| Trial name or title | Efficacy of Telephone‐Delivered Cognitive Behavioral Therapy for Chronic Pain |
| Methods | Randomised controlled trial |
| Participants | People with AMP, MS or SCI with pain of at least 6 months' duration, average pain intensity in the past month greater than 3 on a 0‐10 numerical rating scale |
| Interventions | Behavioural intervention: telephone‐delivered intervention |
| Outcomes | Primary: average pain intensity in the past week |
| Starting date | September 2009 |
| Contact information | Dawn M. Ehde, University of Washington, USA |
| Notes |
| Trial name or title | Effect of Positive Guided Imagery on Patients With in or Below‐Level Chronic Pain Related to Spinal Cord Injury |
| Methods | Randomised controlled trial |
| Participants | People with traumatic and non‐traumatic SCI with chronic pain in or below the level of injury |
| Interventions | Intervention 1: behavioural: pleasant guided imagery Intervention 2: behavioural: pain diary |
| Outcomes | Primary: pain intensity, as measured by NRS and BPIQ Secondary: BDI, BAI and SF‐36 |
| Starting date | October 2008 |
| Contact information | Gunnar Leivseth, Norwegian University of Science and Technology, Trondheim, Norway |
| Notes |
| Trial name or title | Effects of Automated Treadmill Training and Lower Extremity Strength Training on Walking‐related and Other Outcomes in Subjects With Chronic Incomplete Spinal Cord Injury |
| Methods | Randomised controlled trial |
| Participants | People with chronic incomplete spinal cord injury |
| Interventions | Device: Lokomat (driven gait orthosis) training sessions of 45 minutes, 4 times/week, during 4 weeks Other: strength training sesions of 45 minutes, 4 times/week, during 4 weeks |
| Outcomes | Secondary outcome: VAS pain |
| Starting date | July 2009 |
| Contact information | H. van Hedel, Rehabilitation Center Affoltern am Albis, University Children's Hospital Zurich, Switzerland |
| Notes |
| Trial name or title | Investigation of the Mechanisms of Transcranial Direct Current Stimulation of Motor Cortex for the Treatment of Chronic Pain in Spinal Cord Injury |
| Methods | Randomised controlled trial |
| Participants | People with traumatic spinal cord injury (complete or incomplete) and stable chronic pain for at least the 3 preceding months with score higher or equal to 4 cm (0 cm = 'no pain' and 10 cm = 'worst possible pain') on the visual analogue scale (VAS) |
| Interventions | 10 sessions of active or sham tDCS |
| Outcomes | Changes in pain between baseline, 2 weeks of treatment and 2 weeks of follow‐up |
| Starting date | April 2010 |
| Contact information | Felipe Fregni, Spaulding Rehabilitation Hospital, Boston, USA |
| Notes |
| Trial name or title | SCIPA Full‐On: Intensive Exercise Program After Spinal Cord Injury |
| Methods | Randomised controlled trial |
| Participants | People with complete or incomplete spinal cord injury between C6 and T12 |
| Interventions | Combination of body weight–supported treadmill training (BWSTT), cycling assisted with functional electrical stimulation (FES) and exercise of trunk and upper and lower extremities |
| Outcomes | Not specified. Quote: "To determine the relative effectiveness of a comprehensive exercise program compared to a generic upper body strength and fitness training program on neurological improvement" |
| Starting date | December 2010 |
| Contact information | Mary Galea, University of Melbourne, Australia |
| Notes |
Data and analyses
| Outcome or subgroup title | No. of studies | No. of participants | Statistical method | Effect size |
| 1 VAS or NRS 0‐10 (short‐term outcome) Show forest plot | 2 | 57 | Mean Difference (IV, Random, 95% CI) | ‐1.90 [‐3.48, ‐0.33] |
| Analysis 1.1  Comparison 1 Transcranial direct current stimulation (tDCS) versus sham tDCS, Outcome 1 VAS or NRS 0‐10 (short‐term outcome). | ||||
| 2 VAS anxiety 0‐10 (short‐term outcome) Show forest plot | 1 | Mean Difference (IV, Random, 95% CI) | Subtotals only | |
| Analysis 1.2  Comparison 1 Transcranial direct current stimulation (tDCS) versus sham tDCS, Outcome 2 VAS anxiety 0‐10 (short‐term outcome). | ||||
| 3 VAS or NRS 0‐10 (mid‐term outcome) Show forest plot | 2 | 57 | Mean Difference (IV, Random, 95% CI) | ‐1.87 [‐3.30, ‐0.45] |
| Analysis 1.3  Comparison 1 Transcranial direct current stimulation (tDCS) versus sham tDCS, Outcome 3 VAS or NRS 0‐10 (mid‐term outcome). | ||||
| 4 VAS anxiety 0‐10 (mid‐term outcome) Show forest plot | 1 | Mean Difference (IV, Random, 95% CI) | Subtotals only | |
| Analysis 1.4  Comparison 1 Transcranial direct current stimulation (tDCS) versus sham tDCS, Outcome 4 VAS anxiety 0‐10 (mid‐term outcome). | ||||
| 5 NRS 0‐10 (long‐term outcome) Show forest plot | 1 | 39 | Mean Difference (IV, Fixed, 95% CI) | ‐0.73 [‐1.82, 0.35] |
| Analysis 1.5  Comparison 1 Transcranial direct current stimulation (tDCS) versus sham tDCS, Outcome 5 NRS 0‐10 (long‐term outcome). | ||||
| Outcome or subgroup title | No. of studies | No. of participants | Statistical method | Effect size |
| 1 NRS 0‐10 (short‐term outcome) Show forest plot | 3 | Mean Difference (IV, Random, 95% CI) | Totals not selected | |
| Analysis 2.1 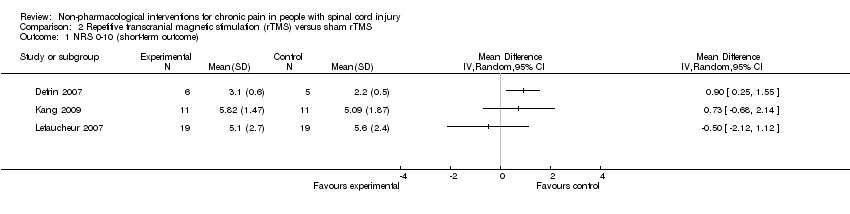 Comparison 2 Repetitive transcranial magnetic stimulation (rTMS) versus sham rTMS, Outcome 1 NRS 0‐10 (short‐term outcome). | ||||
| 2 BPI (short‐term outcome) Show forest plot | 1 | Mean Difference (IV, Random, 95% CI) | Subtotals only | |
| Analysis 2.2  Comparison 2 Repetitive transcranial magnetic stimulation (rTMS) versus sham rTMS, Outcome 2 BPI (short‐term outcome). | ||||
| 3 BDI (short‐term outcome) Show forest plot | 1 | Mean Difference (IV, Random, 95% CI) | Subtotals only | |
| Analysis 2.3  Comparison 2 Repetitive transcranial magnetic stimulation (rTMS) versus sham rTMS, Outcome 3 BDI (short‐term outcome). | ||||
| 4 NRS 0‐10 (mid‐term outcome) Show forest plot | 1 | Mean Difference (IV, Random, 95% CI) | Subtotals only | |
| Analysis 2.4  Comparison 2 Repetitive transcranial magnetic stimulation (rTMS) versus sham rTMS, Outcome 4 NRS 0‐10 (mid‐term outcome). | ||||
| 5 BPI (mid‐term outcome) Show forest plot | 1 | Mean Difference (IV, Random, 95% CI) | Subtotals only | |
| Analysis 2.5  Comparison 2 Repetitive transcranial magnetic stimulation (rTMS) versus sham rTMS, Outcome 5 BPI (mid‐term outcome). | ||||
| 6 BDI (mid‐term outcome) Show forest plot | 1 | Mean Difference (IV, Random, 95% CI) | Subtotals only | |
| Analysis 2.6  Comparison 2 Repetitive transcranial magnetic stimulation (rTMS) versus sham rTMS, Outcome 6 BDI (mid‐term outcome). | ||||
| 7 NRS 0‐10 (long‐term outcome) Show forest plot | 1 | Mean Difference (IV, Random, 95% CI) | Subtotals only | |
| Analysis 2.7  Comparison 2 Repetitive transcranial magnetic stimulation (rTMS) versus sham rTMS, Outcome 7 NRS 0‐10 (long‐term outcome). | ||||
| 8 BPI (long‐term outcome) Show forest plot | 1 | Mean Difference (IV, Random, 95% CI) | Subtotals only | |
| Analysis 2.8  Comparison 2 Repetitive transcranial magnetic stimulation (rTMS) versus sham rTMS, Outcome 8 BPI (long‐term outcome). | ||||
| Outcome or subgroup title | No. of studies | No. of participants | Statistical method | Effect size |
| 1 Short‐term outcome NRS/BPI pain intensity subscale Show forest plot | 2 | 138 | Std. Mean Difference (IV, Fixed, 95% CI) | 0.06 [‐0.28, 0.39] |
| Analysis 3.1  Comparison 3 Cranial electrotherapy stimulation (CES) versus sham CES, Outcome 1 Short‐term outcome NRS/BPI pain intensity subscale. | ||||
| 2 Sensitivity analysis NRS 0‐10 (short‐term outcomes) Show forest plot | 1 | Mean Difference (IV, Random, 95% CI) | Subtotals only | |
| Analysis 3.2  Comparison 3 Cranial electrotherapy stimulation (CES) versus sham CES, Outcome 2 Sensitivity analysis NRS 0‐10 (short‐term outcomes). | ||||
| Outcome or subgroup title | No. of studies | No. of participants | Statistical method | Effect size |
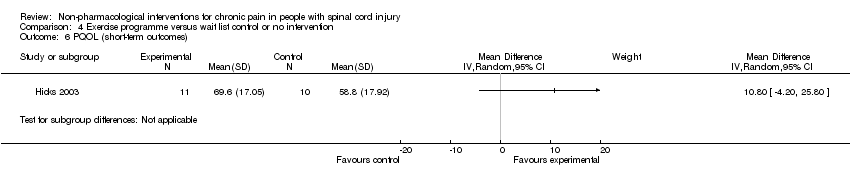
| 1 WUSPI (short‐term outcomes) Show forest plot | 1 | Mean Difference (IV, Random, 95% CI) | Subtotals only | |
| Analysis 4.1 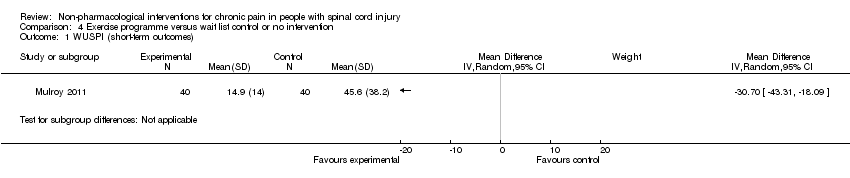 Comparison 4 Exercise programme versus wait list control or no intervention, Outcome 1 WUSPI (short‐term outcomes). | ||||
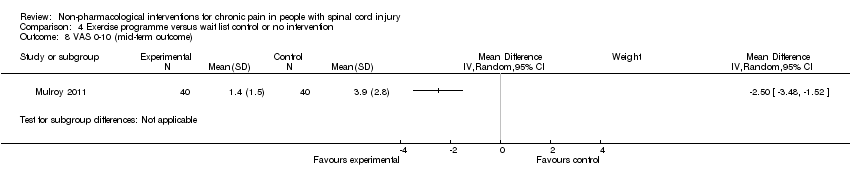
| 2 VAS 0‐10 (short‐term outcomes) Show forest plot | 1 | Mean Difference (IV, Random, 95% CI) | Subtotals only | |
| Analysis 4.2  Comparison 4 Exercise programme versus wait list control or no intervention, Outcome 2 VAS 0‐10 (short‐term outcomes). | ||||
| 3 SF‐36 (short‐term outcomes) Show forest plot | 1 | Mean Difference (IV, Random, 95% CI) | Subtotals only | |
| Analysis 4.3  Comparison 4 Exercise programme versus wait list control or no intervention, Outcome 3 SF‐36 (short‐term outcomes). | ||||
| 4 CES‐D (short‐term outcomes) Show forest plot | 1 | Mean Difference (IV, Random, 95% CI) | Subtotals only | |
| Analysis 4.4  Comparison 4 Exercise programme versus wait list control or no intervention, Outcome 4 CES‐D (short‐term outcomes). | ||||
| 5 SQOL (short‐term outcomes) Show forest plot | 1 | Mean Difference (IV, Random, 95% CI) | Subtotals only | |
| Analysis 4.5  Comparison 4 Exercise programme versus wait list control or no intervention, Outcome 5 SQOL (short‐term outcomes). | ||||
| 6 PQOL (short‐term outcomes) Show forest plot | 1 | Mean Difference (IV, Random, 95% CI) | Subtotals only | |
| Analysis 4.6  Comparison 4 Exercise programme versus wait list control or no intervention, Outcome 6 PQOL (short‐term outcomes). | ||||
| 7 WUSPI (mid‐term outcome) Show forest plot | 1 | Mean Difference (IV, Random, 95% CI) | Subtotals only | |
| Analysis 4.7  Comparison 4 Exercise programme versus wait list control or no intervention, Outcome 7 WUSPI (mid‐term outcome). | ||||
| 8 VAS 0‐10 (mid‐term outcome) Show forest plot | 1 | Mean Difference (IV, Random, 95% CI) | Subtotals only | |
| Analysis 4.8  Comparison 4 Exercise programme versus wait list control or no intervention, Outcome 8 VAS 0‐10 (mid‐term outcome). | ||||
| 9 SQOL (mid‐term outcome) Show forest plot | 1 | Mean Difference (IV, Random, 95% CI) | Subtotals only | |
| Analysis 4.9  Comparison 4 Exercise programme versus wait list control or no intervention, Outcome 9 SQOL (mid‐term outcome). | ||||
| 10 SF‐36 and VAS (short‐term outcomes, standardised mean difference) Show forest plot | 2 | Std. Mean Difference (IV, Fixed, 95% CI) | Totals not selected | |
| Analysis 4.10  Comparison 4 Exercise programme versus wait list control or no intervention, Outcome 10 SF‐36 and VAS (short‐term outcomes, standardised mean difference). | ||||
| 11 WUSPI and VAS (short‐term outcomes, standardised mean difference) Show forest plot | 2 | Std. Mean Difference (IV, Fixed, 95% CI) | Totals not selected | |
| Analysis 4.11  Comparison 4 Exercise programme versus wait list control or no intervention, Outcome 11 WUSPI and VAS (short‐term outcomes, standardised mean difference). | ||||
| Outcome or subgroup title | No. of studies | No. of participants | Statistical method | Effect size |
| 1 WUSPI (short‐term outcome) Show forest plot | 2 | Mean Difference (IV, Fixed, 95% CI) | Totals not selected | |
| Analysis 5.1  Comparison 5 Acupuncture versus sham acupuncture and Trager treatment intervention, Outcome 1 WUSPI (short‐term outcome). | ||||
| 2 WUSPI (mid‐term outcome) Show forest plot | 2 | Mean Difference (IV, Fixed, 95% CI) | Totals not selected | |
| Analysis 5.2  Comparison 5 Acupuncture versus sham acupuncture and Trager treatment intervention, Outcome 2 WUSPI (mid‐term outcome). | ||||
| 3 NRS 0‐10 (short‐term outcome) Show forest plot | 1 | Mean Difference (IV, Random, 95% CI) | Subtotals only | |
| Analysis 5.3  Comparison 5 Acupuncture versus sham acupuncture and Trager treatment intervention, Outcome 3 NRS 0‐10 (short‐term outcome). | ||||
| 4 NRS 0‐10 (mid‐term outcome) Show forest plot | 1 | Mean Difference (IV, Random, 95% CI) | Subtotals only | |
| Analysis 5.4  Comparison 5 Acupuncture versus sham acupuncture and Trager treatment intervention, Outcome 4 NRS 0‐10 (mid‐term outcome). | ||||
| Outcome or subgroup title | No. of studies | No. of participants | Statistical method | Effect size |
| 1 DDS neurogenic pain intensity (short‐term outcomes) Show forest plot | 1 | Mean Difference (IV, Fixed, 95% CI) | Totals not selected | |
| Analysis 6.1  Comparison 6 Transcutaneous electrical nerve stimulation (TENS) versus sham TENS, Outcome 1 DDS neurogenic pain intensity (short‐term outcomes). | ||||
| 1.1 Neutral expectation | 1 | Mean Difference (IV, Fixed, 95% CI) | 0.0 [0.0, 0.0] | |
| 1.2 Positive expectation | 1 | Mean Difference (IV, Fixed, 95% CI) | 0.0 [0.0, 0.0] | |
| 2 DDS musculoskeletal pain intensity (short‐term outcomes) Show forest plot | 1 | Mean Difference (IV, Fixed, 95% CI) | Totals not selected | |
| Analysis 6.2  Comparison 6 Transcutaneous electrical nerve stimulation (TENS) versus sham TENS, Outcome 2 DDS musculoskeletal pain intensity (short‐term outcomes). | ||||
| 2.1 Neutral expectation | 1 | Mean Difference (IV, Fixed, 95% CI) | 0.0 [0.0, 0.0] | |
| 2.2 Positive expectation | 1 | Mean Difference (IV, Fixed, 95% CI) | 0.0 [0.0, 0.0] | |
| Outcome or subgroup title | No. of studies | No. of participants | Statistical method | Effect size |
| 1 CPG, pain Intensity (short‐term outcomes) Show forest plot | 1 | Mean Difference (IV, Random, 95% CI) | Subtotals only | |
| Analysis 7.1  Comparison 7 Multi‐disciplinary cognitive‐behavioural programme versus wait list control, Outcome 1 CPG, pain Intensity (short‐term outcomes). | ||||
| 2 CPG, pain‐related disability (short‐term outcomes) Show forest plot | 1 | Mean Difference (IV, Random, 95% CI) | Subtotals only | |
| Analysis 7.2  Comparison 7 Multi‐disciplinary cognitive‐behavioural programme versus wait list control, Outcome 2 CPG, pain‐related disability (short‐term outcomes). | ||||
| 3 HADS, anxiety (short‐term outcomes) Show forest plot | 1 | Mean Difference (IV, Random, 95% CI) | Subtotals only | |
| Analysis 7.3  Comparison 7 Multi‐disciplinary cognitive‐behavioural programme versus wait list control, Outcome 3 HADS, anxiety (short‐term outcomes). | ||||
| 4 CPG, pain intensity (long‐term outcomes) Show forest plot | 1 | Mean Difference (IV, Random, 95% CI) | Subtotals only | |
| Analysis 7.4  Comparison 7 Multi‐disciplinary cognitive‐behavioural programme versus wait list control, Outcome 4 CPG, pain intensity (long‐term outcomes). | ||||
| 5 CPG, pain‐related disability (long‐term outcomes) Show forest plot | 1 | Mean Difference (IV, Random, 95% CI) | Subtotals only | |
| Analysis 7.5 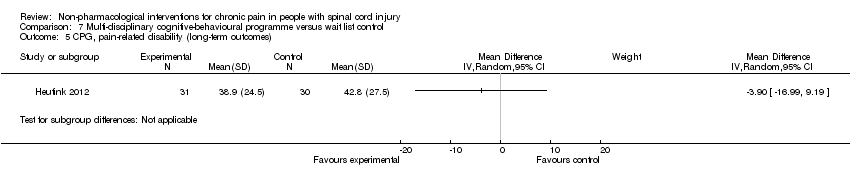 Comparison 7 Multi‐disciplinary cognitive‐behavioural programme versus wait list control, Outcome 5 CPG, pain‐related disability (long‐term outcomes). | ||||
| 6 HADS, anxiety (long‐term outcomes) Show forest plot | 1 | Mean Difference (IV, Random, 95% CI) | Subtotals only | |
| Analysis 7.6  Comparison 7 Multi‐disciplinary cognitive‐behavioural programme versus wait list control, Outcome 6 HADS, anxiety (long‐term outcomes). | ||||

Study flow diagram for search run in March 2011.

Main characteristics of included studies.

Risk of bias summary: review authors' judgements about each risk of bias item for each included study.
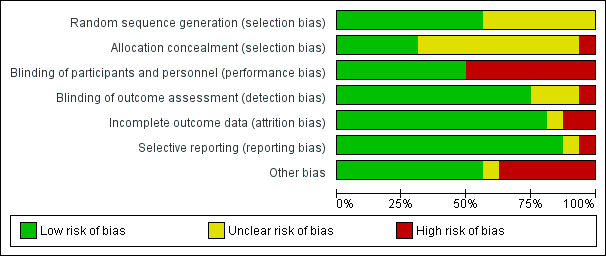
Risk of bias graph: review authors' judgements about each risk of bias item presented as percentages across all included studies.
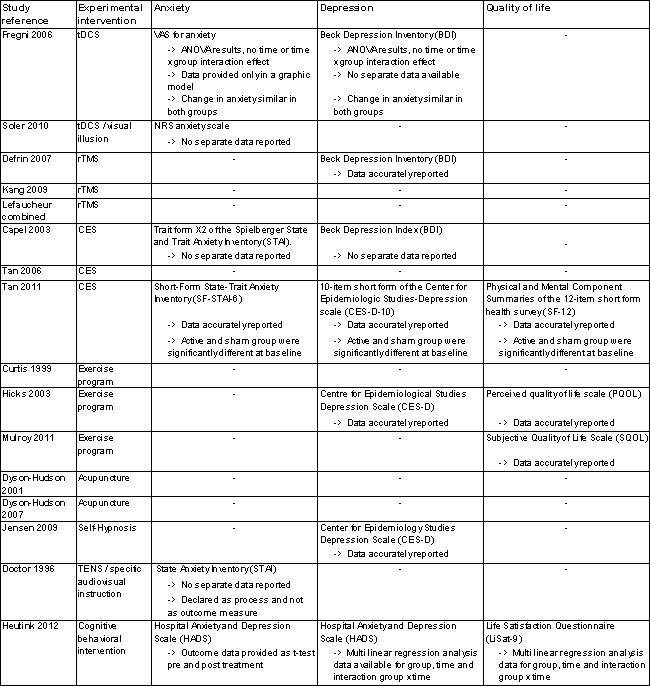
Secondary outcome measures.
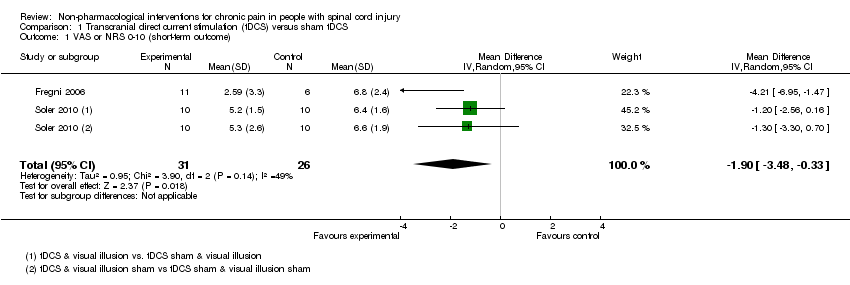
Comparison 1 Transcranial direct current stimulation (tDCS) versus sham tDCS, Outcome 1 VAS or NRS 0‐10 (short‐term outcome).

Comparison 1 Transcranial direct current stimulation (tDCS) versus sham tDCS, Outcome 2 VAS anxiety 0‐10 (short‐term outcome).
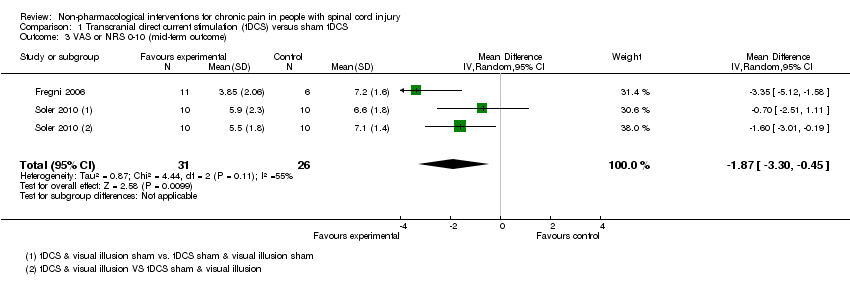
Comparison 1 Transcranial direct current stimulation (tDCS) versus sham tDCS, Outcome 3 VAS or NRS 0‐10 (mid‐term outcome).

Comparison 1 Transcranial direct current stimulation (tDCS) versus sham tDCS, Outcome 4 VAS anxiety 0‐10 (mid‐term outcome).

Comparison 1 Transcranial direct current stimulation (tDCS) versus sham tDCS, Outcome 5 NRS 0‐10 (long‐term outcome).

Comparison 2 Repetitive transcranial magnetic stimulation (rTMS) versus sham rTMS, Outcome 1 NRS 0‐10 (short‐term outcome).
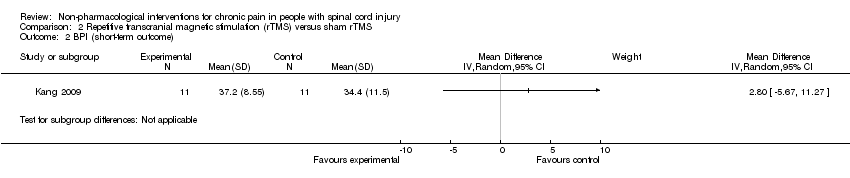
Comparison 2 Repetitive transcranial magnetic stimulation (rTMS) versus sham rTMS, Outcome 2 BPI (short‐term outcome).

Comparison 2 Repetitive transcranial magnetic stimulation (rTMS) versus sham rTMS, Outcome 3 BDI (short‐term outcome).

Comparison 2 Repetitive transcranial magnetic stimulation (rTMS) versus sham rTMS, Outcome 4 NRS 0‐10 (mid‐term outcome).

Comparison 2 Repetitive transcranial magnetic stimulation (rTMS) versus sham rTMS, Outcome 5 BPI (mid‐term outcome).

Comparison 2 Repetitive transcranial magnetic stimulation (rTMS) versus sham rTMS, Outcome 6 BDI (mid‐term outcome).

Comparison 2 Repetitive transcranial magnetic stimulation (rTMS) versus sham rTMS, Outcome 7 NRS 0‐10 (long‐term outcome).

Comparison 2 Repetitive transcranial magnetic stimulation (rTMS) versus sham rTMS, Outcome 8 BPI (long‐term outcome).
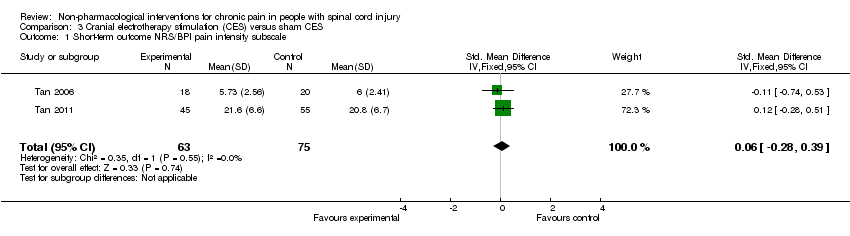
Comparison 3 Cranial electrotherapy stimulation (CES) versus sham CES, Outcome 1 Short‐term outcome NRS/BPI pain intensity subscale.

Comparison 3 Cranial electrotherapy stimulation (CES) versus sham CES, Outcome 2 Sensitivity analysis NRS 0‐10 (short‐term outcomes).

Comparison 4 Exercise programme versus wait list control or no intervention, Outcome 1 WUSPI (short‐term outcomes).

Comparison 4 Exercise programme versus wait list control or no intervention, Outcome 2 VAS 0‐10 (short‐term outcomes).

Comparison 4 Exercise programme versus wait list control or no intervention, Outcome 3 SF‐36 (short‐term outcomes).

Comparison 4 Exercise programme versus wait list control or no intervention, Outcome 4 CES‐D (short‐term outcomes).

Comparison 4 Exercise programme versus wait list control or no intervention, Outcome 5 SQOL (short‐term outcomes).
Comparison 4 Exercise programme versus wait list control or no intervention, Outcome 6 PQOL (short‐term outcomes).

Comparison 4 Exercise programme versus wait list control or no intervention, Outcome 7 WUSPI (mid‐term outcome).
Comparison 4 Exercise programme versus wait list control or no intervention, Outcome 8 VAS 0‐10 (mid‐term outcome).

Comparison 4 Exercise programme versus wait list control or no intervention, Outcome 9 SQOL (mid‐term outcome).
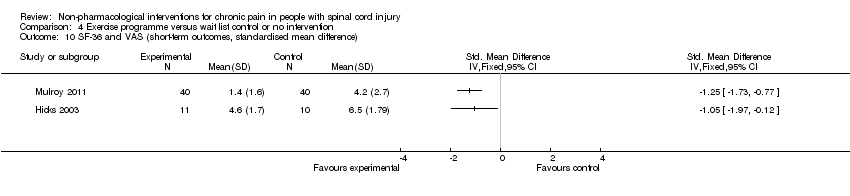
Comparison 4 Exercise programme versus wait list control or no intervention, Outcome 10 SF‐36 and VAS (short‐term outcomes, standardised mean difference).

Comparison 4 Exercise programme versus wait list control or no intervention, Outcome 11 WUSPI and VAS (short‐term outcomes, standardised mean difference).
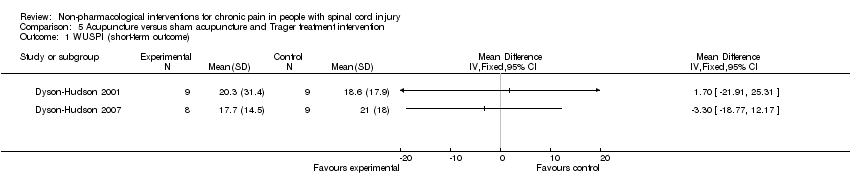
Comparison 5 Acupuncture versus sham acupuncture and Trager treatment intervention, Outcome 1 WUSPI (short‐term outcome).

Comparison 5 Acupuncture versus sham acupuncture and Trager treatment intervention, Outcome 2 WUSPI (mid‐term outcome).
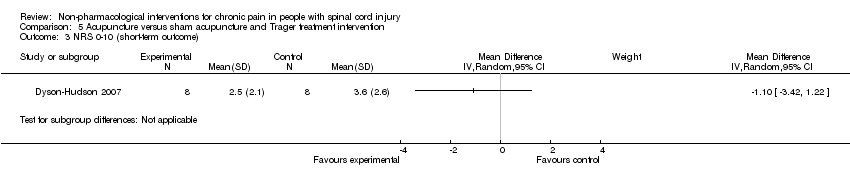
Comparison 5 Acupuncture versus sham acupuncture and Trager treatment intervention, Outcome 3 NRS 0‐10 (short‐term outcome).

Comparison 5 Acupuncture versus sham acupuncture and Trager treatment intervention, Outcome 4 NRS 0‐10 (mid‐term outcome).

Comparison 6 Transcutaneous electrical nerve stimulation (TENS) versus sham TENS, Outcome 1 DDS neurogenic pain intensity (short‐term outcomes).

Comparison 6 Transcutaneous electrical nerve stimulation (TENS) versus sham TENS, Outcome 2 DDS musculoskeletal pain intensity (short‐term outcomes).

Comparison 7 Multi‐disciplinary cognitive‐behavioural programme versus wait list control, Outcome 1 CPG, pain Intensity (short‐term outcomes).

Comparison 7 Multi‐disciplinary cognitive‐behavioural programme versus wait list control, Outcome 2 CPG, pain‐related disability (short‐term outcomes).

Comparison 7 Multi‐disciplinary cognitive‐behavioural programme versus wait list control, Outcome 3 HADS, anxiety (short‐term outcomes).

Comparison 7 Multi‐disciplinary cognitive‐behavioural programme versus wait list control, Outcome 4 CPG, pain intensity (long‐term outcomes).

Comparison 7 Multi‐disciplinary cognitive‐behavioural programme versus wait list control, Outcome 5 CPG, pain‐related disability (long‐term outcomes).

Comparison 7 Multi‐disciplinary cognitive‐behavioural programme versus wait list control, Outcome 6 HADS, anxiety (long‐term outcomes).
| Outcome or subgroup title | No. of studies | No. of participants | Statistical method | Effect size |
| 1 VAS or NRS 0‐10 (short‐term outcome) Show forest plot | 2 | 57 | Mean Difference (IV, Random, 95% CI) | ‐1.90 [‐3.48, ‐0.33] |
| 2 VAS anxiety 0‐10 (short‐term outcome) Show forest plot | 1 | Mean Difference (IV, Random, 95% CI) | Subtotals only | |
| 3 VAS or NRS 0‐10 (mid‐term outcome) Show forest plot | 2 | 57 | Mean Difference (IV, Random, 95% CI) | ‐1.87 [‐3.30, ‐0.45] |
| 4 VAS anxiety 0‐10 (mid‐term outcome) Show forest plot | 1 | Mean Difference (IV, Random, 95% CI) | Subtotals only | |
| 5 NRS 0‐10 (long‐term outcome) Show forest plot | 1 | 39 | Mean Difference (IV, Fixed, 95% CI) | ‐0.73 [‐1.82, 0.35] |
| Outcome or subgroup title | No. of studies | No. of participants | Statistical method | Effect size |
| 1 NRS 0‐10 (short‐term outcome) Show forest plot | 3 | Mean Difference (IV, Random, 95% CI) | Totals not selected | |
| 2 BPI (short‐term outcome) Show forest plot | 1 | Mean Difference (IV, Random, 95% CI) | Subtotals only | |
| 3 BDI (short‐term outcome) Show forest plot | 1 | Mean Difference (IV, Random, 95% CI) | Subtotals only | |
| 4 NRS 0‐10 (mid‐term outcome) Show forest plot | 1 | Mean Difference (IV, Random, 95% CI) | Subtotals only | |
| 5 BPI (mid‐term outcome) Show forest plot | 1 | Mean Difference (IV, Random, 95% CI) | Subtotals only | |
| 6 BDI (mid‐term outcome) Show forest plot | 1 | Mean Difference (IV, Random, 95% CI) | Subtotals only | |
| 7 NRS 0‐10 (long‐term outcome) Show forest plot | 1 | Mean Difference (IV, Random, 95% CI) | Subtotals only | |
| 8 BPI (long‐term outcome) Show forest plot | 1 | Mean Difference (IV, Random, 95% CI) | Subtotals only | |
| Outcome or subgroup title | No. of studies | No. of participants | Statistical method | Effect size |
| 1 Short‐term outcome NRS/BPI pain intensity subscale Show forest plot | 2 | 138 | Std. Mean Difference (IV, Fixed, 95% CI) | 0.06 [‐0.28, 0.39] |
| 2 Sensitivity analysis NRS 0‐10 (short‐term outcomes) Show forest plot | 1 | Mean Difference (IV, Random, 95% CI) | Subtotals only | |
| Outcome or subgroup title | No. of studies | No. of participants | Statistical method | Effect size |
| 1 WUSPI (short‐term outcomes) Show forest plot | 1 | Mean Difference (IV, Random, 95% CI) | Subtotals only | |
| 2 VAS 0‐10 (short‐term outcomes) Show forest plot | 1 | Mean Difference (IV, Random, 95% CI) | Subtotals only | |
| 3 SF‐36 (short‐term outcomes) Show forest plot | 1 | Mean Difference (IV, Random, 95% CI) | Subtotals only | |
| 4 CES‐D (short‐term outcomes) Show forest plot | 1 | Mean Difference (IV, Random, 95% CI) | Subtotals only | |
| 5 SQOL (short‐term outcomes) Show forest plot | 1 | Mean Difference (IV, Random, 95% CI) | Subtotals only | |
| 6 PQOL (short‐term outcomes) Show forest plot | 1 | Mean Difference (IV, Random, 95% CI) | Subtotals only | |
| 7 WUSPI (mid‐term outcome) Show forest plot | 1 | Mean Difference (IV, Random, 95% CI) | Subtotals only | |
| 8 VAS 0‐10 (mid‐term outcome) Show forest plot | 1 | Mean Difference (IV, Random, 95% CI) | Subtotals only | |
| 9 SQOL (mid‐term outcome) Show forest plot | 1 | Mean Difference (IV, Random, 95% CI) | Subtotals only | |
| 10 SF‐36 and VAS (short‐term outcomes, standardised mean difference) Show forest plot | 2 | Std. Mean Difference (IV, Fixed, 95% CI) | Totals not selected | |
| 11 WUSPI and VAS (short‐term outcomes, standardised mean difference) Show forest plot | 2 | Std. Mean Difference (IV, Fixed, 95% CI) | Totals not selected | |
| Outcome or subgroup title | No. of studies | No. of participants | Statistical method | Effect size |
| 1 WUSPI (short‐term outcome) Show forest plot | 2 | Mean Difference (IV, Fixed, 95% CI) | Totals not selected | |
| 2 WUSPI (mid‐term outcome) Show forest plot | 2 | Mean Difference (IV, Fixed, 95% CI) | Totals not selected | |
| 3 NRS 0‐10 (short‐term outcome) Show forest plot | 1 | Mean Difference (IV, Random, 95% CI) | Subtotals only | |
| 4 NRS 0‐10 (mid‐term outcome) Show forest plot | 1 | Mean Difference (IV, Random, 95% CI) | Subtotals only | |
| Outcome or subgroup title | No. of studies | No. of participants | Statistical method | Effect size |
| 1 DDS neurogenic pain intensity (short‐term outcomes) Show forest plot | 1 | Mean Difference (IV, Fixed, 95% CI) | Totals not selected | |
| 1.1 Neutral expectation | 1 | Mean Difference (IV, Fixed, 95% CI) | 0.0 [0.0, 0.0] | |
| 1.2 Positive expectation | 1 | Mean Difference (IV, Fixed, 95% CI) | 0.0 [0.0, 0.0] | |
| 2 DDS musculoskeletal pain intensity (short‐term outcomes) Show forest plot | 1 | Mean Difference (IV, Fixed, 95% CI) | Totals not selected | |
| 2.1 Neutral expectation | 1 | Mean Difference (IV, Fixed, 95% CI) | 0.0 [0.0, 0.0] | |
| 2.2 Positive expectation | 1 | Mean Difference (IV, Fixed, 95% CI) | 0.0 [0.0, 0.0] | |
| Outcome or subgroup title | No. of studies | No. of participants | Statistical method | Effect size |
| 1 CPG, pain Intensity (short‐term outcomes) Show forest plot | 1 | Mean Difference (IV, Random, 95% CI) | Subtotals only | |
| 2 CPG, pain‐related disability (short‐term outcomes) Show forest plot | 1 | Mean Difference (IV, Random, 95% CI) | Subtotals only | |
| 3 HADS, anxiety (short‐term outcomes) Show forest plot | 1 | Mean Difference (IV, Random, 95% CI) | Subtotals only | |
| 4 CPG, pain intensity (long‐term outcomes) Show forest plot | 1 | Mean Difference (IV, Random, 95% CI) | Subtotals only | |
| 5 CPG, pain‐related disability (long‐term outcomes) Show forest plot | 1 | Mean Difference (IV, Random, 95% CI) | Subtotals only | |
| 6 HADS, anxiety (long‐term outcomes) Show forest plot | 1 | Mean Difference (IV, Random, 95% CI) | Subtotals only | |