Ne‐farmakološke intervencije za kroničnu bol u osoba s ozljedom kralježničke moždine
Appendices
Appendix 1. Search strategies
Cochrane Injuries Group Specialised Register
1.(spine or spinal or vertebrae) AND (fracture* or wound* or trauma* or injur* or damag*)
2.(“spinal cord”) AND (contusion or laceration or transaction or trauma or ischemia)
3.(“central cord” OR “central spinal cord”) AND syndrome
4.paraplegi* or quadriplegi* or tetraplegi*
5.1 or 2 or 3 or 4
6.Pain or neuropath* or nocicept*
7.5 and 6
Cochrane Central Register of Controlled Trials
#1MeSH descriptor Spinal Cord Injuries explode all trees
#2MeSH descriptor Spinal Cord Ischemia explode all trees
#3MeSH descriptor Central Cord Syndrome explode all trees
#4myelopathy near3 (traumatic or post‐traumatic)
#5(spine or spinal or vertebrae) near3 (fracture* or wound* or trauma* or injur* or damag*)
#6(spinal cord) near3 (contusion or laceration or transaction or trauma or ischemia)
#7central cord injury syndrome
#8central spinal cord syndrome
#9MeSH descriptor Spinal Cord explode all trees
#10SCI:ti
#11SCI:ab
#12paraplegi* or quadriplegi* or tetraplegi*
#13(#1 OR #2 OR #3 OR #4 OR #5 OR #6 OR #7 OR #8 OR #9 OR #10 OR #11 OR #12)
#14Pain or neuropath* or nocicept*
#15(#13 AND #14)
MEDLINE (OvidSP)
1.exp Spinal Cord Injuries/
2.exp Spinal Cord Ischemia/
3.exp Central Cord Syndrome/
4.(myelopathy adj3 (traumatic or post‐traumatic)).ab,ti.
5.((spine or spinal or vertebrae) adj3 (fracture* or wound* or trauma* or injur* or damag*)).ab,ti.
6.(spinal cord adj3 (contusion or laceration or transaction or trauma or ischemia)).ab,ti.
7.central cord injury syndrome.ab,ti.
8.central spinal cord syndrome.ab,ti.
9.exp Cervical Vertebrae/in [Injuries]
10.exp Spinal Cord/in [Injuries]
11.SCI.ab,ti.
12.exp Paraplegia/
13.exp Quadriplegia/
8.(paraplegi* or quadriplegi* or tetraplegi*).ab,ti.
14.or/1‐14
15.exp Pain/
16.exp Pain, Intractable/
17.exp Pain Measurement/
18.exp Pain Threshold/
19.exp Nociceptors/
20.(pain adj5 (refer* or refractory or intractable or receptor* or nocicept* or muskuloskeletal or chronic or intens* or threshold* or shoulder* or abdominal* or back or neuropath*)).ab,ti.
21.((nocicept* adj3 neuron*) or pain*).ti.
22.16 or 17 or 18 or 19 or 20 or 21 or 22
23.15 and 23
24.randomi?ed.ab,ti.
25.randomized controlled trial.pt.
26.controlled clinical trial.pt.
27.placebo.ab.
28.clinical trials as topic.sh.
29.randomly.ab.
30.trial.ti.
31.25 or 26 or 27 or 28 or 29 or 30 or 31
32.(animals not (humans and animals)).sh.
33.32 not 33
34.24 and 34
Embase (OvidSP)
1.exp spinal cord injury/
2.exp central cord syndrome/
3.exp cervical spine injury/
4.exp cervical spinal cord injury/
5.exp Spinal Cord Ischemia/
6.(myelopathy adj3 (traumatic or post‐traumatic)).ab,ti.
7.((spine or spinal or vertebrae) adj3 (fracture* or wound* or trauma* or injur* or damag*)).ab,ti.
8.(spinal cord adj3 (contusion or laceration or transaction or trauma or ischemia)).ab,ti.
9.central cord injury syndrome.ab,ti.
10.central spinal cord syndrome.ab,ti.
11.exp Spinal Cord/
12.exp INJURY/
13.11 and 12
14.SCI.ab,ti.
15.exp Paraplegia/
16.exp SPASTIC PARAPLEGIA/
17.exp Quadriplegia/
18.(paraplegi* or quadriplegi* or tetraplegi*).ab,ti.
19.1 or 2 or 3 or 4 or 5 or 6 or 7 or 8 or 9 or 10 or 13 or 14 or 15 or 16 or 17 or 18
20.exp Pain/
21.exp intractable pain/
22.exp pain assessment/
23.exp pain threshold/
24.exp nociceptive receptor/
25.exp neuropathic pain/
26.(pain adj5 (refer* or refractory or intractable or receptor* or nocicept* or muskuloskeletal or chronic or intens* or threshold* or shoulder* or abdominal* or back or neuropath*)).ab,ti.
27.((nocicept* adj3 neuron*) or pain*).ti.
28.20 or 21 or 22 or 23 or 24 or 25 or 26 or 27
29.19 and 28
30.exp Randomized Controlled Trial/
31.exp controlled clinical trial/
32.randomi?ed.ab,ti.
33.placebo.ab.
34.*Clinical Trial/
35.randomly.ab.
36.trial.ti.
37.30 or 31 or 32 or 33 or 34 or 35 or 36
38.exp animal/ not (exp human/ and exp animal/)
39.37 not 38
40.29 and 39
ISI Web of Science: Science Citation Index‐Expanded; Social Sciences Citation Index; Conference Proceedings Citation Index‐Science; Conference Proceedings Citation Index‐Social Sciences & Humanities
#1Topic=((spine or spinal or vertebrae) same (fracture* or wound* or trauma* or injur* or damag*)) OR Topic=((spinal cord) same (contusion or laceration or transaction or trauma or ischemia)) OR Topic=((central cord OR central spinal cord) same (syndrome)) OR Topic=(paraplegi* or quadriplegi* or tetraplegi*)
#2Topic=(Pain or neuropath* or nocicept*)
#3#1 and #2
#4Topic=((singl* OR doubl* OR trebl* OR tripl*) SAME (blind* OR mask*))
#5Topic=(randomised OR randomized OR randomly OR random order OR random sequence OR random allocation OR randomly allocated OR at random OR randomized controlled trial) OR Topic=(controlled clinical trial OR controlled trial OR clinical trial OR placebo)
#6#4 and #5
#7Topic=(human*)
#8#6 and #7
#9#3 and #8
CINAHL Plus (EBSCO)
1.Spinal cord
2.SCI
3.Paraplegia
4.Tetraplegia
5.Quadriplegia
6.(paraplegi* or quadriplegi* or tetraplegi*)
7.spinal cord and laceration
8.spinal cord and transaction
9.spinal cord and trauma
10.spinal cord trauma
11.spinal cord and ischemia
12.Spinal Cord Ischemia
13.spinal cord injur
14.Central Cord Syndrome
15.((spine or spinal) and (fracture or wound or trauma or injur or damage or lesion))
16.(myelopathy and (traumatic or post‐traumatic))
17.(spinal cord) and (contusion or laceration or transaction or trauma or ischemia))
18.myelopathy and traumatic
19.traumatic myelopathy
20.post‐traumatic myelopathy
21.myelopathy and post‐traumatic
22.spine or spinal and fracture
23.spinal fracture
24.spine or spinal and wound
25.spine or spinal and trauma
26.spine or spinal and injur
27.spine or spinal and damage
28.spine or spinal and lesion
29.spinal cord and contusion
30.spinal cord and laceration
31.central cord injury syndrome
32.central spinal cord syndrome
33.Cervical Vertebrae Injur
34.S1 or S2 or S3 or S4 or S5 or S6 or S7 or S8 or S9 or S10 or S11 or S12 or S13 or S14 or S15 or S16 or S17 or S18 or S19 or S20 or S21 or S22 or S23 or S24 or S25 or S26 or S27 or S28 or S29 or S30 or S31 or S32 or S33 or S34
35.Pain
36. Pain and Intractable
37.Pain Measurement
38.Pain Threshold
39.nocicept* pain
40.(pain and (refer* or refractory or intractable or receptor* or nocicept* or muskuloskeletal or chronic or intens* or threshold* or shoulder* or abdominal* or back or neuropath*))
41.nocicept* and neuron* or pain
42.Nociceptors
43.S35 or S36 or S37 or S38 or S39 or S40 or S41 or S42
44.34 and 43
45. Search limited using Randomized Controlled Trial OR CLINICAL TRIAL
WHO International Clinical Trials Registry Platform (ICTRP)
Spinal cord injury = 209
Spinal cord inj* pain = 18
Spinal cord inj* and pain = 28
Parapleg* pain =0
Tetrapleg* pain = 0
Tetraplegia pain =0
Spinal cord inj* and RCT =0
Spinal cord injury and randomized control trial =0
Spinal cord injury and pain = 39
AMED
(((FT=spinal cord injur? AND FT=pain ) OR TI=spinal cord injur? "AND" pain ) OR (CT D "pain AND spinal cord injur"? OR UT="pain AND spinal cord injur"? OR IT="pain AND spinal cord injur"? OR SH="pain AND spinal cord injur"?)) AND pps=human)))

Study flow diagram for search run in March 2011.

Main characteristics of included studies.

Risk of bias summary: review authors' judgements about each risk of bias item for each included study.
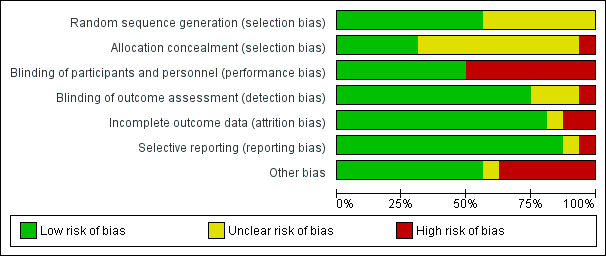
Risk of bias graph: review authors' judgements about each risk of bias item presented as percentages across all included studies.
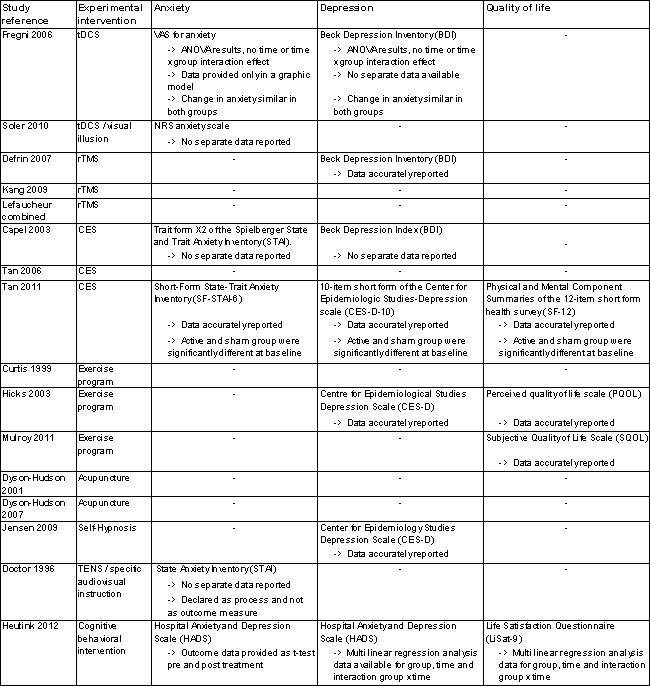
Secondary outcome measures.
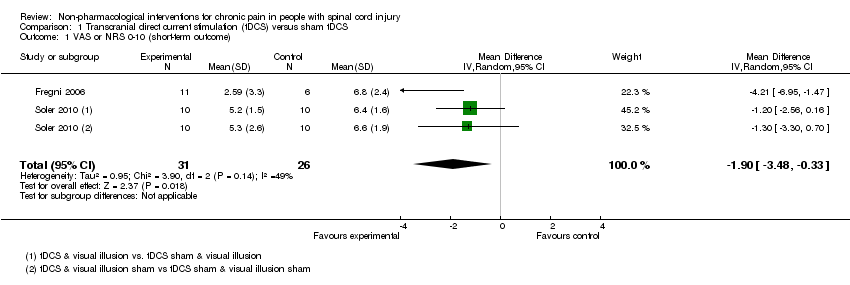
Comparison 1 Transcranial direct current stimulation (tDCS) versus sham tDCS, Outcome 1 VAS or NRS 0‐10 (short‐term outcome).

Comparison 1 Transcranial direct current stimulation (tDCS) versus sham tDCS, Outcome 2 VAS anxiety 0‐10 (short‐term outcome).
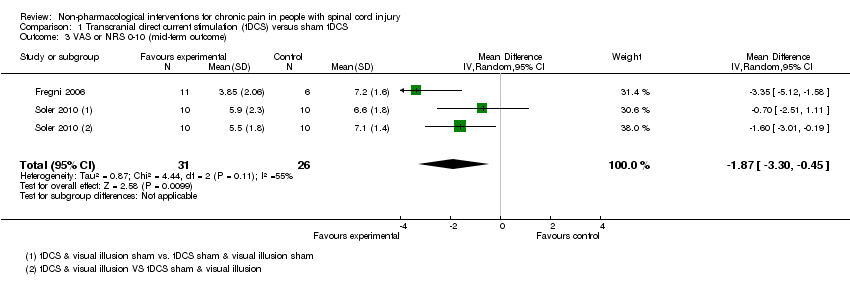
Comparison 1 Transcranial direct current stimulation (tDCS) versus sham tDCS, Outcome 3 VAS or NRS 0‐10 (mid‐term outcome).

Comparison 1 Transcranial direct current stimulation (tDCS) versus sham tDCS, Outcome 4 VAS anxiety 0‐10 (mid‐term outcome).

Comparison 1 Transcranial direct current stimulation (tDCS) versus sham tDCS, Outcome 5 NRS 0‐10 (long‐term outcome).

Comparison 2 Repetitive transcranial magnetic stimulation (rTMS) versus sham rTMS, Outcome 1 NRS 0‐10 (short‐term outcome).
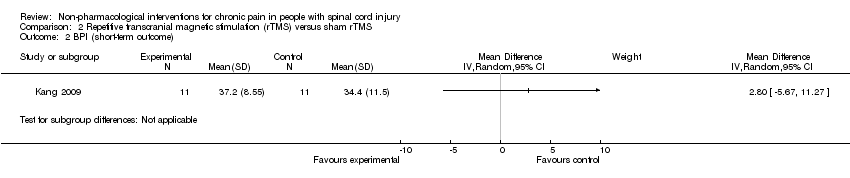
Comparison 2 Repetitive transcranial magnetic stimulation (rTMS) versus sham rTMS, Outcome 2 BPI (short‐term outcome).

Comparison 2 Repetitive transcranial magnetic stimulation (rTMS) versus sham rTMS, Outcome 3 BDI (short‐term outcome).

Comparison 2 Repetitive transcranial magnetic stimulation (rTMS) versus sham rTMS, Outcome 4 NRS 0‐10 (mid‐term outcome).

Comparison 2 Repetitive transcranial magnetic stimulation (rTMS) versus sham rTMS, Outcome 5 BPI (mid‐term outcome).

Comparison 2 Repetitive transcranial magnetic stimulation (rTMS) versus sham rTMS, Outcome 6 BDI (mid‐term outcome).

Comparison 2 Repetitive transcranial magnetic stimulation (rTMS) versus sham rTMS, Outcome 7 NRS 0‐10 (long‐term outcome).

Comparison 2 Repetitive transcranial magnetic stimulation (rTMS) versus sham rTMS, Outcome 8 BPI (long‐term outcome).
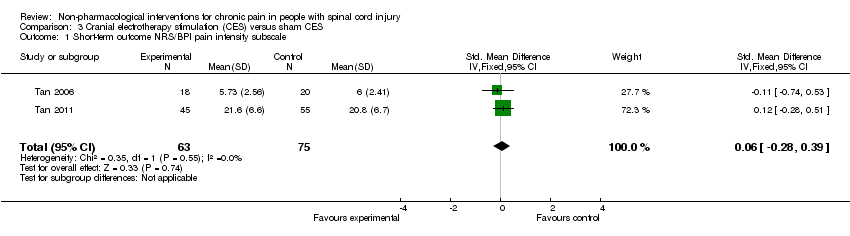
Comparison 3 Cranial electrotherapy stimulation (CES) versus sham CES, Outcome 1 Short‐term outcome NRS/BPI pain intensity subscale.

Comparison 3 Cranial electrotherapy stimulation (CES) versus sham CES, Outcome 2 Sensitivity analysis NRS 0‐10 (short‐term outcomes).
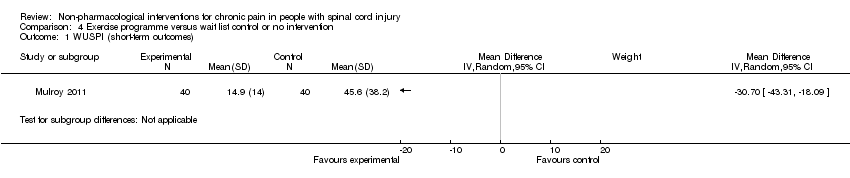
Comparison 4 Exercise programme versus wait list control or no intervention, Outcome 1 WUSPI (short‐term outcomes).

Comparison 4 Exercise programme versus wait list control or no intervention, Outcome 2 VAS 0‐10 (short‐term outcomes).

Comparison 4 Exercise programme versus wait list control or no intervention, Outcome 3 SF‐36 (short‐term outcomes).

Comparison 4 Exercise programme versus wait list control or no intervention, Outcome 4 CES‐D (short‐term outcomes).

Comparison 4 Exercise programme versus wait list control or no intervention, Outcome 5 SQOL (short‐term outcomes).
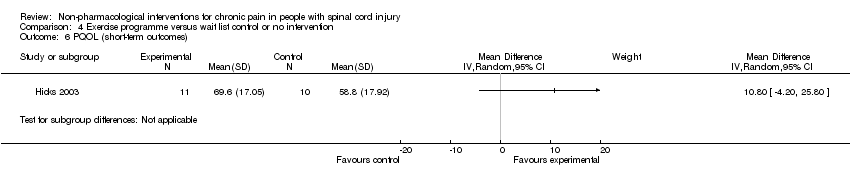
Comparison 4 Exercise programme versus wait list control or no intervention, Outcome 6 PQOL (short‐term outcomes).

Comparison 4 Exercise programme versus wait list control or no intervention, Outcome 7 WUSPI (mid‐term outcome).
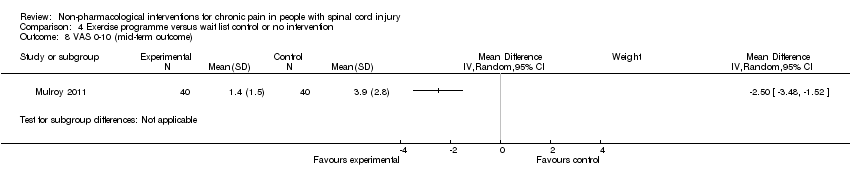
Comparison 4 Exercise programme versus wait list control or no intervention, Outcome 8 VAS 0‐10 (mid‐term outcome).

Comparison 4 Exercise programme versus wait list control or no intervention, Outcome 9 SQOL (mid‐term outcome).
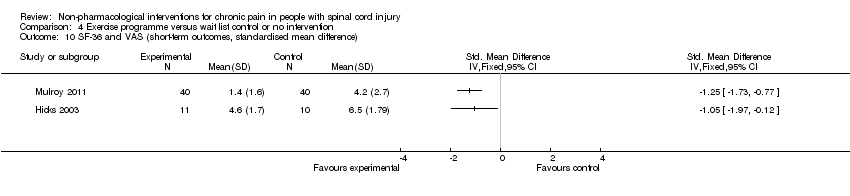
Comparison 4 Exercise programme versus wait list control or no intervention, Outcome 10 SF‐36 and VAS (short‐term outcomes, standardised mean difference).

Comparison 4 Exercise programme versus wait list control or no intervention, Outcome 11 WUSPI and VAS (short‐term outcomes, standardised mean difference).
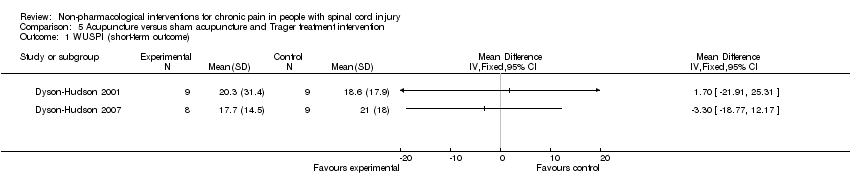
Comparison 5 Acupuncture versus sham acupuncture and Trager treatment intervention, Outcome 1 WUSPI (short‐term outcome).

Comparison 5 Acupuncture versus sham acupuncture and Trager treatment intervention, Outcome 2 WUSPI (mid‐term outcome).
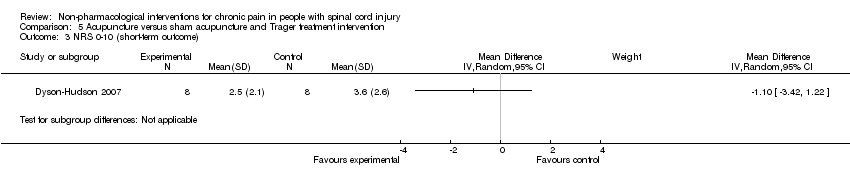
Comparison 5 Acupuncture versus sham acupuncture and Trager treatment intervention, Outcome 3 NRS 0‐10 (short‐term outcome).

Comparison 5 Acupuncture versus sham acupuncture and Trager treatment intervention, Outcome 4 NRS 0‐10 (mid‐term outcome).

Comparison 6 Transcutaneous electrical nerve stimulation (TENS) versus sham TENS, Outcome 1 DDS neurogenic pain intensity (short‐term outcomes).

Comparison 6 Transcutaneous electrical nerve stimulation (TENS) versus sham TENS, Outcome 2 DDS musculoskeletal pain intensity (short‐term outcomes).
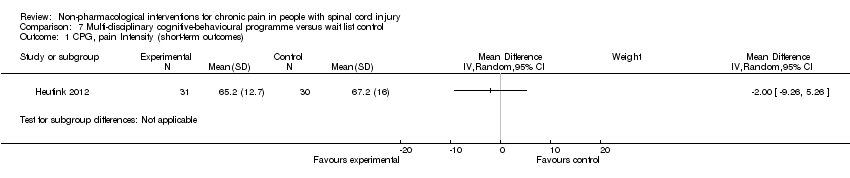
Comparison 7 Multi‐disciplinary cognitive‐behavioural programme versus wait list control, Outcome 1 CPG, pain Intensity (short‐term outcomes).

Comparison 7 Multi‐disciplinary cognitive‐behavioural programme versus wait list control, Outcome 2 CPG, pain‐related disability (short‐term outcomes).

Comparison 7 Multi‐disciplinary cognitive‐behavioural programme versus wait list control, Outcome 3 HADS, anxiety (short‐term outcomes).

Comparison 7 Multi‐disciplinary cognitive‐behavioural programme versus wait list control, Outcome 4 CPG, pain intensity (long‐term outcomes).

Comparison 7 Multi‐disciplinary cognitive‐behavioural programme versus wait list control, Outcome 5 CPG, pain‐related disability (long‐term outcomes).

Comparison 7 Multi‐disciplinary cognitive‐behavioural programme versus wait list control, Outcome 6 HADS, anxiety (long‐term outcomes).
| Outcome or subgroup title | No. of studies | No. of participants | Statistical method | Effect size |
| 1 VAS or NRS 0‐10 (short‐term outcome) Show forest plot | 2 | 57 | Mean Difference (IV, Random, 95% CI) | ‐1.90 [‐3.48, ‐0.33] |
| 2 VAS anxiety 0‐10 (short‐term outcome) Show forest plot | 1 | Mean Difference (IV, Random, 95% CI) | Subtotals only | |
| 3 VAS or NRS 0‐10 (mid‐term outcome) Show forest plot | 2 | 57 | Mean Difference (IV, Random, 95% CI) | ‐1.87 [‐3.30, ‐0.45] |
| 4 VAS anxiety 0‐10 (mid‐term outcome) Show forest plot | 1 | Mean Difference (IV, Random, 95% CI) | Subtotals only | |
| 5 NRS 0‐10 (long‐term outcome) Show forest plot | 1 | 39 | Mean Difference (IV, Fixed, 95% CI) | ‐0.73 [‐1.82, 0.35] |
| Outcome or subgroup title | No. of studies | No. of participants | Statistical method | Effect size |
| 1 NRS 0‐10 (short‐term outcome) Show forest plot | 3 | Mean Difference (IV, Random, 95% CI) | Totals not selected | |
| 2 BPI (short‐term outcome) Show forest plot | 1 | Mean Difference (IV, Random, 95% CI) | Subtotals only | |
| 3 BDI (short‐term outcome) Show forest plot | 1 | Mean Difference (IV, Random, 95% CI) | Subtotals only | |
| 4 NRS 0‐10 (mid‐term outcome) Show forest plot | 1 | Mean Difference (IV, Random, 95% CI) | Subtotals only | |
| 5 BPI (mid‐term outcome) Show forest plot | 1 | Mean Difference (IV, Random, 95% CI) | Subtotals only | |
| 6 BDI (mid‐term outcome) Show forest plot | 1 | Mean Difference (IV, Random, 95% CI) | Subtotals only | |
| 7 NRS 0‐10 (long‐term outcome) Show forest plot | 1 | Mean Difference (IV, Random, 95% CI) | Subtotals only | |
| 8 BPI (long‐term outcome) Show forest plot | 1 | Mean Difference (IV, Random, 95% CI) | Subtotals only | |
| Outcome or subgroup title | No. of studies | No. of participants | Statistical method | Effect size |
| 1 Short‐term outcome NRS/BPI pain intensity subscale Show forest plot | 2 | 138 | Std. Mean Difference (IV, Fixed, 95% CI) | 0.06 [‐0.28, 0.39] |
| 2 Sensitivity analysis NRS 0‐10 (short‐term outcomes) Show forest plot | 1 | Mean Difference (IV, Random, 95% CI) | Subtotals only | |
| Outcome or subgroup title | No. of studies | No. of participants | Statistical method | Effect size |
| 1 WUSPI (short‐term outcomes) Show forest plot | 1 | Mean Difference (IV, Random, 95% CI) | Subtotals only | |
| 2 VAS 0‐10 (short‐term outcomes) Show forest plot | 1 | Mean Difference (IV, Random, 95% CI) | Subtotals only | |
| 3 SF‐36 (short‐term outcomes) Show forest plot | 1 | Mean Difference (IV, Random, 95% CI) | Subtotals only | |
| 4 CES‐D (short‐term outcomes) Show forest plot | 1 | Mean Difference (IV, Random, 95% CI) | Subtotals only | |
| 5 SQOL (short‐term outcomes) Show forest plot | 1 | Mean Difference (IV, Random, 95% CI) | Subtotals only | |
| 6 PQOL (short‐term outcomes) Show forest plot | 1 | Mean Difference (IV, Random, 95% CI) | Subtotals only | |
| 7 WUSPI (mid‐term outcome) Show forest plot | 1 | Mean Difference (IV, Random, 95% CI) | Subtotals only | |
| 8 VAS 0‐10 (mid‐term outcome) Show forest plot | 1 | Mean Difference (IV, Random, 95% CI) | Subtotals only | |
| 9 SQOL (mid‐term outcome) Show forest plot | 1 | Mean Difference (IV, Random, 95% CI) | Subtotals only | |
| 10 SF‐36 and VAS (short‐term outcomes, standardised mean difference) Show forest plot | 2 | Std. Mean Difference (IV, Fixed, 95% CI) | Totals not selected | |
| 11 WUSPI and VAS (short‐term outcomes, standardised mean difference) Show forest plot | 2 | Std. Mean Difference (IV, Fixed, 95% CI) | Totals not selected | |
| Outcome or subgroup title | No. of studies | No. of participants | Statistical method | Effect size |
| 1 WUSPI (short‐term outcome) Show forest plot | 2 | Mean Difference (IV, Fixed, 95% CI) | Totals not selected | |
| 2 WUSPI (mid‐term outcome) Show forest plot | 2 | Mean Difference (IV, Fixed, 95% CI) | Totals not selected | |
| 3 NRS 0‐10 (short‐term outcome) Show forest plot | 1 | Mean Difference (IV, Random, 95% CI) | Subtotals only | |
| 4 NRS 0‐10 (mid‐term outcome) Show forest plot | 1 | Mean Difference (IV, Random, 95% CI) | Subtotals only | |
| Outcome or subgroup title | No. of studies | No. of participants | Statistical method | Effect size |
| 1 DDS neurogenic pain intensity (short‐term outcomes) Show forest plot | 1 | Mean Difference (IV, Fixed, 95% CI) | Totals not selected | |
| 1.1 Neutral expectation | 1 | Mean Difference (IV, Fixed, 95% CI) | 0.0 [0.0, 0.0] | |
| 1.2 Positive expectation | 1 | Mean Difference (IV, Fixed, 95% CI) | 0.0 [0.0, 0.0] | |
| 2 DDS musculoskeletal pain intensity (short‐term outcomes) Show forest plot | 1 | Mean Difference (IV, Fixed, 95% CI) | Totals not selected | |
| 2.1 Neutral expectation | 1 | Mean Difference (IV, Fixed, 95% CI) | 0.0 [0.0, 0.0] | |
| 2.2 Positive expectation | 1 | Mean Difference (IV, Fixed, 95% CI) | 0.0 [0.0, 0.0] | |
| Outcome or subgroup title | No. of studies | No. of participants | Statistical method | Effect size |
| 1 CPG, pain Intensity (short‐term outcomes) Show forest plot | 1 | Mean Difference (IV, Random, 95% CI) | Subtotals only | |
| 2 CPG, pain‐related disability (short‐term outcomes) Show forest plot | 1 | Mean Difference (IV, Random, 95% CI) | Subtotals only | |
| 3 HADS, anxiety (short‐term outcomes) Show forest plot | 1 | Mean Difference (IV, Random, 95% CI) | Subtotals only | |
| 4 CPG, pain intensity (long‐term outcomes) Show forest plot | 1 | Mean Difference (IV, Random, 95% CI) | Subtotals only | |
| 5 CPG, pain‐related disability (long‐term outcomes) Show forest plot | 1 | Mean Difference (IV, Random, 95% CI) | Subtotals only | |
| 6 HADS, anxiety (long‐term outcomes) Show forest plot | 1 | Mean Difference (IV, Random, 95% CI) | Subtotals only | |