Sulphonylurea monotherapy for patients with type 2 diabetes mellitus
Referencias
References to studies included in this review
References to studies excluded from this review
Additional references
Characteristics of studies
Characteristics of included studies [ordered by study ID]
Ir a:
| Methods | PARALLEL RANDOMISED CONTROLLED CLINICAL TRIAL DOUBLE‐BLIND/OPEN‐LABEL: blinding not described, but we assume open‐label INTERVENTIONS USED IN TRIALS: Sulphonylurea: glibenclamide Control: repaglinide | |
| Participants | INCLUSION CRITERIA:
EXCLUSION CRITERIA:
DIAGNOSTIC CRITERIA: NR NUMBER OF PATIENTS WITH PREVIOUS CARDIOVASCULAR DISEASE: Sulphonylurea: NR Control: NR NUMBER OF PATIENTS TREATED WITH ASPIRIN/ANTIHYPERTENSIVES/LIPID‐LOWERING: Sulphonylurea: NR Control: NR | |
| Interventions | NUMBER OF STUDY CENTRES: NR COUNTRY/LOCATION: Italy SETTING: outpatients TREATMENT BEFORE STUDY: diet and exercise TITRATION PERIOD: titrated during trial GLYCAEMIC TARGET: NR | |
| Outcomes | OUTCOME(S) (as stated in the protocol/registered trial documents): HbA1c, FPG, postprandial glucose, cognition score, adverse events, hypoglycaemic episodes, Homeostasis Model of Assessment ‐ Insulin Resistance, blood pressure, biochemical variables, carotid ultrasound, depression | |
| Study details | RUN‐IN PERIOD: NR DURATION OF INTERVENTION: 12 months + 3 weeks DURATION OF FOLLOW‐UP: 12 months + 3 weeks STUDY TERMINATED BEFORE REGULAR END: no | |
| Publication details | LANGUAGE OF PUBLICATION: English COMMERCIAL FUNDING/NON‐COMMERCIAL FUNDING: NR PUBLICATION STATUS: peer‐reviewed journal | |
| Stated aim of study | Quote: "We tested the hypothesis that an elevated PPG instability could be associated with both global cognitive functioning as well as executive and attention functioning neuropsychological tests." | |
| Notes | ||
| Risk of bias | ||
| Bias | Authors' judgement | Support for judgement |
| Random sequence generation (selection bias) | Unclear risk | Quote: "After patient referral to our offices, participants who accepted to enroll in the study were randomly assigned to undergo monotherapy with repaglinide (initially started with 1 mg twice a day) or glibenclamide therapy (also known as glyburide in the United States and Canada; initially started with 2.5 mg twice a day)." |
| Allocation concealment (selection bias) | Unclear risk | NR |
| Blinding of participants and personnel (performance bias) | High risk | Blinding not described, but we assume open‐label |
| Blinding of outcome assessment (detection bias) | Unclear risk | Quote: "All MRI evaluations were made by physicians not involved in the study and blind toward the study design." Blinding of participants for the other outcomes are not described |
| Incomplete outcome data (attrition bias) | Low risk | Loss to follow‐up adequately described |
| Selective reporting (reporting bias) | Unclear risk | No trial protocol or design article available |
| Academic bias | Low risk | Primary author's first publication on the interventions |
| Sponsor bias | Unclear risk | Funding not reported |
| Trials according to risk of bias | Unclear risk | Adequate sequence generation and allocation concealment, inadequate blinding |
| Methods | PARALLEL RANDOMISED CONTROLLED CLINICAL TRIAL DOUBLE‐BLIND/OPEN‐LABEL: double‐blind INTERVENTIONS USED IN TRIALS: Sulphonylurea: glibenclamide Control 1: rosiglitazone Control 2: metformin | |
| Participants | INCLUSION CRITERIA:
EXCLUSION CRITERIA:
DIAGNOSTIC CRITERIA: NR NUMBER OF PATIENTS WITH PREVIOUS CARDIOVASCULAR DISEASE: Sulphonylurea: 247 Control 1: 231 Control 2: 269 NUMBER OF PATIENTS TREATED WITH ASPIRIN/ANTIHYPERTENSIVES/LIPID‐LOWERING: Sulphonylurea: NR/753/370 Control 1: NR/744/378 Control 2: NR/737/377 | |
| Interventions | NUMBER OF STUDY CENTRES: 488 COUNTRY/LOCATION: North America, Europe and Canada SETTING: outpatients TREATMENT BEFORE STUDY: lifestyle interventions TITRATION PERIOD: titrated during trial GLYCAEMIC TARGET: FPG below 140 mg/dl (7.8 mmol/L) | |
| Outcomes | OUTCOME(S) (as stated in the protocol/registered trial documents): time to monotherapy failure, glycaemic control, islet beta‐cell function, insulin sensitivity, progression of microalbuminuria, fibrinolytic markers, cardiovascular risk factors, renal function, health status, quality of life and safety parameters | |
| Study details | RUN‐IN PERIOD: 4 weeks DURATION OF INTERVENTION: 4 years DURATION OF FOLLOW‐UP: 4 years STUDY TERMINATED BEFORE REGULAR END: no | |
| Publication details | LANGUAGE OF PUBLICATION: English COMMERCIAL FUNDING PUBLICATION STATUS: peer‐reviewed journal | |
| Stated aim of study | Quote: "Our goal was to evaluate, in patients recently diagnosed with type 2 diabetes (<3 years), the long term efficacy of monotherapy with rosiglitazone on glycemic control and on the progression of pathophysiological abnormalities associated with type 2 diabetes as compared with metformin or glyburide monotherapy." | |
| Notes | ||
| Risk of bias | ||
| Bias | Authors' judgement | Support for judgement |
| Random sequence generation (selection bias) | Low risk | Quote: "Randomization was performed centrally and was concealed and stratified according to the sex of the patients in blocks of six." |
| Allocation concealment (selection bias) | Low risk | Quote: "Randomization was performed centrally and was concealed and stratified according to the sex of the patients in blocks of six." |
| Blinding of participants and personnel (performance bias) | Low risk | Quote: "All study medication will be supplied in capsules of identical size and color, and all patients will take the same number of capsules each day." |
| Blinding of outcome assessment (detection bias) | Low risk | Quote: "A central laboratory will be used during the study. Samples will be collected and transferred under appropriate conditions to the central laboratory." |
| Incomplete outcome data (attrition bias) | Low risk | All loss to follow‐up adequately described |
| Selective reporting (reporting bias) | Low risk | All predefined primary and secondary outcomes in the protocol are assessed |
| Academic bias | Low risk | Primary author's first publication on the interventions |
| Sponsor bias | High risk | Received funding from pharmaceutical industry |
| Trials according to risk of bias | Low risk | Adequate sequence generation, allocation concealment and blinding |
| Methods | PARALLEL RANDOMISED CONTROLLED CLINICAL TRIAL DOUBLE‐BLIND/OPEN‐LABEL: double‐blind INTERVENTIONS USED IN TRIALS: Sulphonylurea: glibenclamide Control: repaglinide | |
| Participants | INCLUSION CRITERIA:
EXCLUSION CRITERIA: NR DIAGNOSTIC CRITERIA: NR NUMBER OF PATIENTS WITH PREVIOUS CARDIOVASCULAR DISEASE: Sulphonylurea: NR Control: NR NUMBER OF PATIENTS TREATED WITH ASPIRIN/ANTIHYPERTENSIVES/LIPID‐LOWERING: Sulphonylurea: NR Control: NR | |
| Interventions | NUMBER OF STUDY CENTRES: 26 COUNTRY/LOCATION: United Kingdom SETTING: outpatients TREATMENT BEFORE STUDY: diet and/or sulphonylurea TITRATION PERIOD: 6 to 8 weeks GLYCAEMIC TARGET: NR | |
| Outcomes | OUTCOME(S) (as stated in the protocol/registered trial documents): HbA1c, FPG, hypoglycaemia, adverse events, lipid metabolism and beta‐cell status | |
| Study details | RUN‐IN PERIOD: NR DURATION OF INTERVENTION: 12 months + 6 to 8 weeks DURATION OF FOLLOW‐UP: 12 months + 6 to 8 weeks + 3 months STUDY TERMINATED BEFORE REGULAR END: no | |
| Publication details | LANGUAGE OF PUBLICATION: not published, but the synopsis describing the trial is in English. Trial identified through approval letter of the US Food and Drug Administration (FDA 2000) COMMERCIAL FUNDING PUBLICATION STATUS: unpublished | |
| Stated aim of study | Quote: "..to assess and compare the effect of repaglinide and glibenclamide on glycaemic control as measured by HbA1c and fasting plasma glucose (FPG) when administered to Type 2 diabetic patients for 12 months." | |
| Notes | ||
| Risk of bias | ||
| Bias | Authors' judgement | Support for judgement |
| Random sequence generation (selection bias) | Unclear risk | Quote: "The patients were randomized to a treatment group in a 2:1 ratio of repaglinide and glibenclamide." |
| Allocation concealment (selection bias) | Unclear risk | NR |
| Blinding of participants and personnel (performance bias) | Low risk | Quote: "Placebo: used to double‐blind the trial; encapsulated tablets, orally" |
| Blinding of outcome assessment (detection bias) | Low risk | We assume the outcome assessors were blinded due to a double‐blind design |
| Incomplete outcome data (attrition bias) | Low risk | All loss to follow‐up clearly described |
| Selective reporting (reporting bias) | Low risk | Primary and secondary outcomes assessed as predefined |
| Academic bias | High risk | The data for the trial are provided from Novo Nordisk |
| Sponsor bias | High risk | Sponsored by pharmaceutical company |
| Trials according to risk of bias | Unclear risk | Unclear randomisation and allocation concealment, adequate blinding |
| Methods | PARALLEL RANDOMISED CONTROLLED CLINICAL TRIAL DOUBLE‐BLIND/OPEN‐LABEL: double‐blind INTERVENTIONS USED IN TRIALS: Sulphonylurea: gliclazide Control: repaglinide | |
| Participants | INCLUSION CRITERIA:
EXCLUSION CRITERIA: NR DIAGNOSTIC CRITERIA: NR NUMBER OF PATIENTS WITH PREVIOUS CARDIOVASCULAR DISEASE: Sulphonylurea: NR Control: NR NUMBER OF PATIENTS TREATED WITH ASPIRIN/ANTIHYPERTENSIVES/LIPID‐LOWERING: Sulphonylurea: NR Control: NR | |
| Interventions | NUMBER OF STUDY CENTRES: 41 COUNTRY/LOCATION: Belgium, France and Italy SETTING: outpatients TREATMENT BEFORE STUDY: diet and/or sulphonylurea TITRATION PERIOD: 6 to 8 weeks GLYCAEMIC TARGET: NR | |
| Outcomes | OUTCOME(S) (as stated in the protocol/registered trial documents): HbA1c, FPG, hypoglycaemia, adverse events, lipid metabolism and beta‐cell status | |
| Study details | RUN‐IN PERIOD: NR DURATION OF INTERVENTION: 12 months + 6 to 8 weeks DURATION OF FOLLOW‐UP: 12 months + 6 to 8 weeks STUDY TERMINATED BEFORE REGULAR END: no | |
| Publication details | LANGUAGE OF PUBLICATION: not published, but the synopsis describing the trial is in English. Trial identified through approval letter of the US Food and Drug Administration (FDA 2000) COMMERCIAL FUNDING PUBLICATION STATUS: unpublished | |
| Stated aim of study | Quote: "..to assess and compare the effect of repaglinide and gliclazide on glycaemic control as measured by HbA1c and fasting plasma glucose (FPG) when administered to Type 2 diabetic patients for 12 months." | |
| Notes | ||
| Risk of bias | ||
| Bias | Authors' judgement | Support for judgement |
| Random sequence generation (selection bias) | Unclear risk | Quote: "The patients were randomized to a treatment group in a 2:1 ratio of repaglinide and gliclazide." |
| Allocation concealment (selection bias) | Unclear risk | NR |
| Blinding of participants and personnel (performance bias) | Low risk | Quote: "Placebo: used to double‐blind the trial; encapsulated tablets, orally" |
| Blinding of outcome assessment (detection bias) | Low risk | We assume the outcome assessors were blinded due to a double‐blind design |
| Incomplete outcome data (attrition bias) | Low risk | All loss to follow‐up clearly described |
| Selective reporting (reporting bias) | Low risk | Primary and secondary outcomes assessed as predefined |
| Academic bias | High risk | The data for the trial are provided from Novo Nordisk |
| Sponsor bias | High risk | Sponsored by pharmaceutical company |
| Trials according to risk of bias | Unclear risk | Unclear randomisation and allocation concealment, adequate blinding |
| Methods | PARALLEL RANDOMISED CONTROLLED CLINICAL TRIAL DOUBLE‐BLIND/OPEN‐LABEL: open‐label INTERVENTIONS USED IN TRIALS: Sulphonylurea: glibenclamide Control: insulin | |
| Participants | INCLUSION CRITERIA:
EXCLUSION CRITERIA:
DIAGNOSTIC CRITERIA: NR NUMBER OF PATIENTS WITH PREVIOUS CARDIOVASCULAR DISEASE: Sulphonylurea: NR Control: NR NUMBER OF PATIENTS TREATED WITH ASPIRIN/ANTIHYPERTENSIVES/LIPID‐LOWERING: Sulphonylurea: NR/2/2 Control: NR/1/1 | |
| Interventions | NUMBER OF STUDY CENTRES: 6 COUNTRY/LOCATION: Sweden SETTING: outpatients TREATMENT BEFORE STUDY: diet TITRATION PERIOD: titrated, but time period not reported GLYCAEMIC TARGET: HbA1c levels within target level, that is below or equal to 1% above the upper normal level of HbA1c of 6.2% | |
| Outcomes | OUTCOME(S) (as stated in the protocol/registered trial documents): retinopathy, quality of life, biochemical variables, effect on beta‐cell function | |
| Study details | RUN‐IN PERIOD: none DURATION OF INTERVENTION: 6 years DURATION OF FOLLOW‐UP: 6 years STUDY TERMINATED BEFORE REGULAR END: no | |
| Publication details | LANGUAGE OF PUBLICATION: English COMMERCIAL FUNDING/NON‐COMMERCIAL FUNDING PUBLICATION STATUS: peer‐reviewed journal | |
| Stated aim of study | Quote: "To compare effects of early insulin vs. glibenclamide treatment on beta‐cell function, metabolic control and quality of life (QL) in recently diagnosed patients with type 2 diabetes." | |
| Notes | Data for participants on antihypertensives are the number on angiotensin converting enzyme inhibitor or angiotensinogen receptor blocker | |
| Risk of bias | ||
| Bias | Authors' judgement | Support for judgement |
| Random sequence generation (selection bias) | Unclear risk | Quote: "Patients were randomized to monotherapy with glibenclamide or insulin." |
| Allocation concealment (selection bias) | Unclear risk | NR |
| Blinding of participants and personnel (performance bias) | High risk | Open‐label design |
| Blinding of outcome assessment (detection bias) | High risk | Open‐label design, we assume not blinded |
| Incomplete outcome data (attrition bias) | Low risk | Drop‐outs clearly described |
| Selective reporting (reporting bias) | Unclear risk | No trial protocol or design article available |
| Academic bias | Low risk | Primary author's first publication on the interventions. This trial is published in 3 publications |
| Sponsor bias | High risk | Received funding from pharmaceutical industry |
| Trials according to risk of bias | Unclear risk | Unclear sequence generation, allocation concealment, inadequate blinding |
| Methods | PARALLEL RANDOMISED CONTROLLED CLINICAL TRIAL DOUBLE‐BLIND/OPEN‐LABEL: double‐blind INTERVENTIONS USED IN TRIALS: Sulphonylurea: glipizide Control: rosiglitazone | |
| Participants | INCLUSION CRITERIA:
EXCLUSION CRITERIA:
DIAGNOSTIC CRITERIA: diagnosed with T2DM, established diagnosis of T2DM based on ADA, WHO or local national guidelines NUMBER OF PATIENTS WITH PREVIOUS CARDIOVASCULAR DISEASE: Sulphonylurea: 339 Control: 333 NUMBER OF PATIENTS TREATED WITH ASPIRIN/ANTIHYPERTENSIVES/LIPID‐LOWERING: Sulphonylurea: 279/238/262 Control: 280/237/248 | |
| Interventions | NUMBER OF STUDY CENTRES: 92 COUNTRY/LOCATION: 19 (Asia, Europe, North America, South America) SETTING: outpatients TREATMENT BEFORE STUDY: diet or oral antidiabetics TITRATION PERIOD: 12 weeks GLYCAEMIC TARGET: HbA1c < 7% (target mean daily glucose < 126 mg/dl (7.0 mmol/L)) | |
| Outcomes | OUTCOME(S) (as stated in the protocol/registered trial documents): per cent atheroma volume, intravascular ultrasound efficacy parameters include change in normalised total atheroma volume and change in atheroma volume within the most diseased 10 mm sub‐segment, change from baseline in vessel volume, change in biochemical variables, major adverse cardiovascular events (cardiovascular and non‐cardiovascular death, non‐fatal myocardial infarction and stroke, coronary revascularisation, and hospitalisation for recurrent myocardial ischaemia) and new or worsening heart failure | |
| Study details | RUN‐IN PERIOD: NR DURATION OF INTERVENTION: 18.6 months DURATION OF FOLLOW‐UP: 18.6 months STUDY TERMINATED BEFORE REGULAR END: no | |
| Publication details | LANGUAGE OF PUBLICATION: English COMMERCIAL FUNDING PUBLICATION STATUS: peer‐reviewed journal | |
| Stated aim of study | Quote: "The aim of the APPROACH (Assessment on the Prevention of Progression by Rosiglitazone on Atherosclerosis in diabetes patients with Cardiovascular History) trial is to compare the glucose‐independent effects of the thiazolidinedione rosiglitazone with the sulfonylurea glipizide on the progression of coronary atherosclerosis, as measured by IVUS, in participants with T2DM and coronary artery disease." | |
| Notes | Number for antihypertensive treatment is the number of participants with ACE‐inhibitor or angiotensin receptor blocker treatment. Number for lipid‐lowering treatment is the number of participants on statins. All prior oral antidiabetic medications are down titrated by 50% at randomisation and discontinued after 1 month as double‐blind study medications were up titrated | |
| Risk of bias | ||
| Bias | Authors' judgement | Support for judgement |
| Random sequence generation (selection bias) | Low risk | Quote: "Participants are randomized in a 1:1 ratio to rosiglitazone or glipizide treatment using an automated voice‐response system." |
| Allocation concealment (selection bias) | Low risk | Quote: "Participants are randomized in a 1:1 ratio to rosiglitazone or glipizide treatment using an automated voice‐response system." |
| Blinding of participants and personnel (performance bias) | Low risk | Quote: "Participants, study personnel, and core laboratory staff are blinded to treatment assignment." |
| Blinding of outcome assessment (detection bias) | Low risk | Quote: "Participants, study personnel, and core laboratory staff are blinded to treatment assignment." |
| Incomplete outcome data (attrition bias) | Low risk | All loss to follow‐up described |
| Selective reporting (reporting bias) | Low risk | All primary and secondary outcomes described in protocol and assessed |
| Academic bias | Low risk | Primary author's first publication on the interventions |
| Sponsor bias | High risk | Received funding from the pharmaceutical industry |
| Trials according to risk of bias | Low risk | Adequate sequence generation, allocation concealment and blinding |
| Methods | PARALLEL RANDOMISED CONTROLLED CLINICAL TRIAL DOUBLE‐BLIND/OPEN‐LABEL: double‐blind INTERVENTIONS USED IN TRIALS: Sulphonylurea 1: glibenclamide Sulphonylurea 2: glipizide Control: placebo | |
| Participants | INCLUSION CRITERIA:
EXCLUSION CRITERIA:
DIAGNOSTIC CRITERIA: without insulin for > 1 year after diabetes diagnosis NUMBER OF PATIENTS WITH PREVIOUS CARDIOVASCULAR DISEASE: Sulphonylurea: NR Control: NR NUMBER OF PATIENTS TREATED WITH ASPIRIN/ANTIHYPERTENSIVES/LIPID‐LOWERING: Sulphonylurea: NR Control: NR | |
| Interventions | NUMBER OF STUDY CENTRES: 1 COUNTRY/LOCATION: Norway SETTING: outpatients TREATMENT BEFORE STUDY: diet TITRATION PERIOD: titrated during trial to achieve target GLYCAEMIC TARGET: FBG < 8 mmol/L and HbA1c < 7.5% without hypoglycaemia | |
| Outcomes | OUTCOME(S) (as stated in the protocol/registered trial documents): glycaemic control, insulin secretion and biochemical variables | |
| Study details | RUN‐IN PERIOD: 3 to 6 months DURATION OF INTERVENTION: 15 months DURATION OF FOLLOW‐UP: 15 months STUDY TERMINATED BEFORE REGULAR END: no | |
| Publication details | LANGUAGE OF PUBLICATION: English COMMERCIAL FUNDING/NON‐COMMERCIAL FUNDING PUBLICATION STATUS: peer‐reviewed journal | |
| Stated aim of study | Quote: "The aim of the study was to assess and compare the long‐term (15 months) effects of moderate doses of glipizide and glyburide on glycaemic control and insulin secretion in a randomized placebo‐controlled double‐blind fashion." | |
| Notes | ||
| Risk of bias | ||
| Bias | Authors' judgement | Support for judgement |
| Random sequence generation (selection bias) | Low risk | Quote: "…they were subjected to a stratified randomisation procedure…" Through correspondence it was clarified that the randomisation was done manually by drawing numbers |
| Allocation concealment (selection bias) | Low risk | Through correspondence it was clarified that the concealment was made with opaque envelopes |
| Blinding of participants and personnel (performance bias) | Low risk | Quote: "All tablets looked identical and contained either 1.75 mg glyburide, 2.5 mg glipizide, or placebo." |
| Blinding of outcome assessment (detection bias) | High risk | Through correspondence it was clarified that the outcome assessors were not blinded |
| Incomplete outcome data (attrition bias) | Low risk | Loss to follow‐up adequately described |
| Selective reporting (reporting bias) | Low risk | Primary and secondary outcomes not clearly defined in the publication. However, the list of priority of outcomes was not corrected from the answer we received by correspondence |
| Academic bias | Low risk | Primary author's first publication on the interventions |
| Sponsor bias | High risk | Received funding from pharmaceutical industry |
| Trials according to risk of bias | Unclear risk | Adequate sequence generation, allocation concealment and blinding of participants, inadequate blinding of outcome assessors |
| Methods | PARALLEL RANDOMISED CONTROLLED CLINICAL TRIAL DOUBLE‐BLIND/OPEN‐LABEL: open‐label INTERVENTIONS USED IN TRIALS: Sulphonylurea: glibenclamide Control: insulin | |
| Participants | INCLUSION CRITERIA:
EXCLUSION CRITERIA:
DIAGNOSTIC CRITERIA: WHO NUMBER OF PATIENTS WITH PREVIOUS CARDIOVASCULAR DISEASE: Sulphonylurea: NR Control: NR NUMBER OF PATIENTS TREATED WITH ASPIRIN/ANTIHYPERTENSIVES/LIPID‐LOWERING: Sulphonylurea: NR/4NR Control: NR/5/NR | |
| Interventions | NUMBER OF STUDY CENTRES: NR COUNTRY/LOCATION: Norway SETTING: outpatients TREATMENT BEFORE STUDY: NR TITRATION PERIOD: titrated during trial GLYCAEMIC TARGET: FBG < 7 mmol/L and a postprandial blood glucose < 10 mmol/L | |
| Outcomes | OUTCOME(S) (as stated in the protocol/registered trial documents): retinopathy, nephropathy, macrovascular disease, metabolic profile | |
| Study details | RUN‐IN PERIOD: at least 3 months DURATION OF INTERVENTION: 42 months DURATION OF FOLLOW‐UP: 42 months STUDY TERMINATED BEFORE REGULAR END: yes. Planned duration of the trial was 5 years, but as almost all participants in the sulphonylurea group ended up on insulin the trial was stopped | |
| Publication details | LANGUAGE OF PUBLICATION: English COMMERCIAL FUNDING/NON‐COMMERCIAL FUNDING PUBLICATION STATUS: peer‐reviewed journal | |
| Stated aim of study | Quote: "In our study, our aim was to investigate the long‐term effects of insulin versus SU therapy in type 2 diabetic subjects on glycaemic control, insulin resistance, microalbuminuria and levels of Lp(a) lipoprotein, triglycerides (TG), total‐ and HDL cholesterol, and diastolic and systolic blood pressure." | |
| Notes | Number treated with antihypertensives is the number of participants prescribed ACE‐inhibitors | |
| Risk of bias | ||
| Bias | Authors' judgement | Support for judgement |
| Random sequence generation (selection bias) | Unclear risk | Quote: ".., they were randomly assigned to treatment…." |
| Allocation concealment (selection bias) | Unclear risk | NR |
| Blinding of participants and personnel (performance bias) | High risk | Open‐label design |
| Blinding of outcome assessment (detection bias) | High risk | We assume not blinded |
| Incomplete outcome data (attrition bias) | Unclear risk | Loss to follow‐up and their reasons not clearly described |
| Selective reporting (reporting bias) | High risk | Do not report primary outcome |
| Academic bias | Low risk | Primary author's first publication on the interventions. Have previously published trials with glibenclamide, but with other comparators (Birkeland 1994) |
| Sponsor bias | High risk | Received funding from pharmaceutical industry |
| Trials according to risk of bias | Unclear risk | Unclear sequence generation and allocation concealment, inadequate blinding |
| Methods | PARALLEL RANDOMISED CONTROLLED CLINICAL TRIAL DOUBLE‐BLIND/OPEN‐LABEL: open‐label INTERVENTIONS USED IN TRIALS: Sulphonylurea: glipizide Control: metformin | |
| Participants | INCLUSION CRITERIA:
EXCLUSION CRITERIA: NR DIAGNOSTIC CRITERIA: NUMBER OF PATIENTS WITH PREVIOUS CARDIOVASCULAR DISEASE: Sulphonylurea: NR Control: NR NUMBER OF PATIENTS TREATED WITH ASPIRIN/ANTIHYPERTENSIVES/LIPID‐LOWERING: Sulphonylurea: 0/3/NR Control: 0/4/NR | |
| Interventions | NUMBER OF STUDY CENTRES: NR COUNTRY/LOCATION: United Kingdom SETTING: outpatients TREATMENT BEFORE STUDY: diet TITRATION PERIOD: up to 6 weeks GLYCAEMIC TARGET: FPG < 8 mmol/L (but more than 4) | |
| Outcomes | OUTCOME(S) (as stated in the protocol/registered trial documents): glycaemic control, body weight, serum lipids, blood lactate and urinary albumin excretion | |
| Study details | RUN‐IN PERIOD: 2 weeks DURATION OF INTERVENTION: 12 months DURATION OF FOLLOW‐UP: 12 months STUDY TERMINATED BEFORE REGULAR END: no | |
| Publication details | LANGUAGE OF PUBLICATION: English COMMERCIAL FUNDING/NON‐COMMERCIAL FUNDING: NR PUBLICATION STATUS: peer‐reviewed journal | |
| Stated aim of study | Quote: "This present study is a long term comparison of metformin and the second generation sulphonylurea, glipizide in diet failed type 2 diabetes subjects, unstratified for weight, assessing glycaemic control, body weight, serum lipids, blood lactate and urinary albumin excretion over a 12 month period." | |
| Notes | ||
| Risk of bias | ||
| Bias | Authors' judgement | Support for judgement |
| Random sequence generation (selection bias) | Unclear risk | Quote: "…subjects were randomised in blocks of four (11) to receive…" |
| Allocation concealment (selection bias) | Unclear risk | NR |
| Blinding of participants and personnel (performance bias) | High risk | Open‐label design |
| Blinding of outcome assessment (detection bias) | High risk | Open‐label design |
| Incomplete outcome data (attrition bias) | Low risk | No participants lost to follow‐up |
| Selective reporting (reporting bias) | Unclear risk | No trial protocol or design article available |
| Academic bias | Low risk | Primary author's first publication on the interventions |
| Sponsor bias | Unclear risk | Funding not reported |
| Trials according to risk of bias | Unclear risk | Unclear sequence generation and allocation concealment, inadequate blinding |
| Methods | PARALLEL RANDOMISED CONTROLLED CLINICAL TRIAL DOUBLE‐BLIND/OPEN‐LABEL: double‐blind INTERVENTIONS USED IN TRIALS: Sulphonylurea: gliclazide Control: pioglitazone | |
| Participants | INCLUSION CRITERIA:
EXCLUSION CRITERIA:
DIAGNOSTIC CRITERIA: NR NUMBER OF PATIENTS WITH PREVIOUS CARDIOVASCULAR DISEASE: Sulphonylurea: NR Control: NR NUMBER OF PATIENTS TREATED WITH ASPIRIN/ANTIHYPERTENSIVES/LIPID‐LOWERING: Sulphonylurea: NR Control: NR | |
| Interventions | NUMBER OF STUDY CENTRES: 209 COUNTRY/LOCATION: Europe, Australia, Canada, South Africa and Israel SETTING: outpatients TREATMENT BEFORE STUDY: diet TITRATION PERIOD: 16 weeks GLYCAEMIC TARGET: HbA1c < 8% | |
| Outcomes | OUTCOME(S) (as stated in the protocol/registered trial documents): HbA1c, FPG, insulin, lipids | |
| Study details | RUN‐IN PERIOD: none DURATION OF INTERVENTION: 52 weeks DURATION OF FOLLOW‐UP: 52 weeks STUDY TERMINATED BEFORE REGULAR END: no | |
| Publication details | LANGUAGE OF PUBLICATION: English COMMERCIAL FUNDING/NON‐COMMERCIAL FUNDING PUBLICATION STATUS: peer‐reviewed journal | |
| Stated aim of study | Quote: "This study compared the effects of pioglitazone and gliclazide on metabolic control in drug‐naïve patients with Type 2 diabetes mellitus." | |
| Notes | This trial is the first 52 weeks of Tan 2005 (Tan 2005) | |
| Risk of bias | ||
| Bias | Authors' judgement | Support for judgement |
| Random sequence generation (selection bias) | Unclear risk | Quote: "Patients were randomized in…." |
| Allocation concealment (selection bias) | Unclear risk | NR |
| Blinding of participants and personnel (performance bias) | Low risk | Quote: "…, double‐dummy, double‐blind,...." |
| Blinding of outcome assessment (detection bias) | Low risk | We assume they were blinded |
| Incomplete outcome data (attrition bias) | Unclear risk | Some of the participants were randomised, but not included in the analysis: 8 participants were not treated; 12 participants had unreliable data. It is not described to which group they originally were randomised to |
| Selective reporting (reporting bias) | Unclear risk | No protocol or design article available |
| Academic bias | Low risk | Primary author has not previously conducted trials comparing the same interventions |
| Sponsor bias | High risk | Received funding from pharmaceutical company |
| Trials according to risk of bias | Unclear risk | Unclear sequence generation and allocation concealment, adequate blinding |
| Methods | PARALLEL RANDOMISED CONTROLLED CLINICAL TRIAL DOUBLE‐BLIND/OPEN‐LABEL: open‐label INTERVENTIONS USED IN TRIALS: Sulphonylurea: gliclazide Control: metformin | |
| Participants | INCLUSION CRITERIA:
EXCLUSION CRITERIA: other medication DIAGNOSTIC CRITERIA: NR NUMBER OF PATIENTS WITH PREVIOUS CARDIOVASCULAR DISEASE: Sulphonylurea: NR Control: NR NUMBER OF PATIENTS TREATED WITH ASPIRIN/ANTIHYPERTENSIVES/LIPID‐LOWERING: Sulphonylurea: 0/0/0 Control: 0/0/0 | |
| Interventions | NUMBER OF STUDY CENTRES: 1 COUNTRY/LOCATION: NR SETTING: outpatients TREATMENT BEFORE STUDY: no antidiabetic intervention TITRATION PERIOD: NR GLYCAEMIC TARGET: not clear, but HbA1c < 8% is specified as the normal range | |
| Outcomes | OUTCOME(S) (as stated in the protocol/registered trial documents): platelet density profiles, intraplatelet nucleotides, intraplatelet nucleotides, intraplatelet β‐thromboglobulin, plasma β triglyceride levels, intraplatelet cyclic AMP levels, platelet release reaction, platelet thromboxane B2 production and plasma fibrinogen levels | |
| Study details | RUN‐IN PERIOD: 3 to 6 weeks DURATION OF INTERVENTION: 6 months DURATION OF FOLLOW‐UP: 6 months STUDY TERMINATED BEFORE REGULAR END: no | |
| Publication details | LANGUAGE OF PUBLICATION: English COMMERCIAL FUNDING PUBLICATION STATUS: peer‐reviewed journal | |
| Stated aim of study | Quote: "In this study we investigated the changes in platelet density profiles, intraplatelet nucleotides, intraplatelet nucleotides, intraplatelet β‐thromboglobulin (β), plasma βTG levels, intraplatelet cyclic AMP (cAMP) levels, platelet release reaction, platelet thromboxane (TX)B2 production and plasma fibrinogen levels in 24 newly diagnosed non‐insulin‐dependent diabetic patients." | |
| Notes | The group of 12 comparable aged controls are not included in the analysis | |
| Risk of bias | ||
| Bias | Authors' judgement | Support for judgement |
| Random sequence generation (selection bias) | Unclear risk | Quote: "..,and were therefore randomized into either metformin (Glucophage) or gliclazide (Diamicron) treatment groups, .." |
| Allocation concealment (selection bias) | Unclear risk | NR |
| Blinding of participants and personnel (performance bias) | High risk | Open‐label design |
| Blinding of outcome assessment (detection bias) | High risk | Open‐label design, we assume not blinded |
| Incomplete outcome data (attrition bias) | Unclear risk | Small study, no drop‐outs reported |
| Selective reporting (reporting bias) | Unclear risk | No trial protocol or design article available |
| Academic bias | Low risk | Primary author's first publication on the interventions |
| Sponsor bias | High risk | Received funding from pharmaceutical industry |
| Trials according to risk of bias | Unclear risk | Unclear sequence generation and allocation concealment, inadequate blinding |
| Methods | PARALLEL RANDOMISED CONTROLLED CLINICAL TRIAL DOUBLE‐BLIND/OPEN‐LABEL: double‐blind INTERVENTIONS USED IN TRIALS: Sulphonylurea: tolbutamide Control 1: acarbose Control 2: placebo | |
| Participants | INCLUSION CRITERIA:
EXCLUSION CRITERIA:
DIAGNOSTIC CRITERIA: NR NUMBER OF PATIENTS WITH PREVIOUS CARDIOVASCULAR DISEASE: Sulphonylurea: 0 Control 1: 0 Control 2: 0 NUMBER OF PATIENTS TREATED WITH ASPIRIN/ANTIHYPERTENSIVES/LIPID‐LOWERING: Sulphonylurea: 0 Control 1: 0 Control 2: 0 | |
| Interventions | NUMBER OF STUDY CENTRES: NR COUNTRY/LOCATION: USA SETTING: outpatients TREATMENT BEFORE STUDY: diet. Patients on sulphonylurea or insulin therapy had these medications discontinued at least 4 weeks prior to enrolment TITRATION PERIOD: titrated during trial GLYCAEMIC TARGET: 1 hour postprandial plasma glucose level < 200 mg/dl | |
| Outcomes | OUTCOME(S) (as stated in the protocol/registered trial documents): change in HbA1c, full‐meal test tolerance, adverse events (including hypoglycaemia), blood lipids, change in HbA1c from each scheduled visit | |
| Study details | RUN‐IN PERIOD: 6 weeks DURATION OF INTERVENTION: 24 weeks DURATION OF FOLLOW‐UP: 30 weeks STUDY TERMINATED BEFORE REGULAR END: no | |
| Publication details | LANGUAGE OF PUBLICATION: English COMMERCIAL FUNDING PUBLICATION STATUS: peer‐reviewed journal | |
| Stated aim of study | Quote: "This multicenter, double‐blind study compared the long‐term efficacy and safety of treatment with placebo, acarbose alone, tolbutamide alone, and acarbose combined with tolbutamide in NIDDM patients treated with a standard diabetic diet." | |
| Notes | The intervention group combining tolbutamide with acarbose is not included in the analyses | |
| Risk of bias | ||
| Bias | Authors' judgement | Support for judgement |
| Random sequence generation (selection bias) | Unclear risk | Quote: "…, patients were stratified based on fasting glucose level (stratum I ≤1200 mg/dL versus stratum II > 200 mg/dL) and randomized to receive 24 weeks of treatment with acarbose, tolbutamide, acarbose‐plus‐tolbutamide, or placebo." |
| Allocation concealment (selection bias) | Unclear risk | NR |
| Blinding of participants and personnel (performance bias) | Unclear risk | Quote: "...was followed by a double‐blind treatment for 24 weeks..." Method of blinding not described |
| Blinding of outcome assessment (detection bias) | Unclear risk | NR |
| Incomplete outcome data (attrition bias) | Low risk | Loss to follow‐up adequately described |
| Selective reporting (reporting bias) | Unclear risk | No trial protocol or design article available |
| Academic bias | Low risk | Primary author's first publication on the interventions |
| Sponsor bias | High risk | Received funding from pharmaceutical industry |
| Trials according to risk of bias | Unclear risk | Unclear sequence generation, allocation concealment and blinding |
| Methods | PARALLEL RANDOMISED CONTROLLED CLINICAL TRIAL DOUBLE‐BLIND/OPEN‐LABEL: blinding not described, but we assume open‐label INTERVENTIONS USED IN TRIALS: Sulphonylurea: tolbutamide Comparator: metformin | |
| Participants | INCLUSION CRITERIA:
EXCLUSION CRITERIA: NR DIAGNOSTIC CRITERIA: NR NUMBER OF PATIENTS WITH PREVIOUS CARDIOVASCULAR DISEASE: Sulphonylurea: NR Comparator: NR NUMBER OF PATIENTS TREATED WITH ASPIRIN/ANTIHYPERTENSIVES/LIPID‐LOWERING: Sulphonylurea: NR Comparator: NR | |
| Interventions | NUMBER OF STUDY CENTRES: NR COUNTRY/LOCATION: Ireland SETTING: outpatients TREATMENT BEFORE STUDY: diet TITRATION PERIOD: NR GLYCAEMIC TARGET: NR | |
| Outcomes | OUTCOME(S) (as stated in the protocol/registered trial documents): plasma glucose, fasting lipids and dietary adherence | |
| Study details | RUN‐IN PERIOD: NR DURATION OF INTERVENTION: 1 year DURATION OF FOLLOW‐UP: 1 year STUDY TERMINATED BEFORE REGULAR END: NR | |
| Publication details | LANGUAGE OF PUBLICATION: English COMMERCIAL FUNDING/NON‐COMMERCIAL FUNDING: NR PUBLICATION STATUS: abstract in peer‐reviewed journal | |
| Stated aim of study | Quote: "This study compares the effect of tolbutamide and metformin on plasma glucose and fasting lipids in the management of NIDDM with persistent severe hypoglycaemia despite good dietary adherence." | |
| Notes | It was not possible to find any address of a corresponding author | |
| Risk of bias | ||
| Bias | Authors' judgement | Support for judgement |
| Random sequence generation (selection bias) | Unclear risk | Quote: "…, were randomized to treatment with…." |
| Allocation concealment (selection bias) | Unclear risk | NR |
| Blinding of participants and personnel (performance bias) | Unclear risk | NR |
| Blinding of outcome assessment (detection bias) | Unclear risk | NR |
| Incomplete outcome data (attrition bias) | Unclear risk | NR |
| Selective reporting (reporting bias) | Unclear risk | No trial protocol or design article available |
| Academic bias | Low risk | Primary author's first publication on the interventions |
| Sponsor bias | Unclear risk | Funding not reported |
| Trials according to risk of bias | Unclear risk | Unclear sequence generation, allocation concealment and blinding |
| Methods | PARALLEL RANDOMISED CONTROLLED CLINICAL TRIAL DOUBLE‐BLIND/OPEN‐LABEL: double‐blind INTERVENTIONS USED IN TRIALS: Sulphonylurea: glibenclamide Control: metformin | |
| Participants | INCLUSION CRITERIA:
EXCLUSION CRITERIA:
DIAGNOSTIC CRITERIA: The diagnosis of T2DM was based on clinical history and the finding of a fasting plasma glucose concentration above 140 mg per decilitre (7.8 mmol per litre) on 2 occasions NUMBER OF PATIENTS WITH PREVIOUS CARDIOVASCULAR DISEASE: Sulphonylurea: NR Control: NR NUMBER OF PATIENTS TREATED WITH ASPIRIN/ANTIHYPERTENSIVES/LIPID‐LOWERING: Sulphonylurea: NR Control: NR | |
| Interventions | NUMBER OF STUDY CENTRES: NR, but multicentre COUNTRY/LOCATION: USA SETTING: outpatients TREATMENT BEFORE STUDY: NR TITRATION PERIOD: 5 weeks GLYCAEMIC TARGET: FPG < 140 mg per decilitre | |
| Outcomes | OUTCOME(S) (as stated in the protocol/registered trial documents): ‐ | |
| Study details | RUN‐IN PERIOD: 5 weeks DURATION OF INTERVENTION: 29 weeks DURATION OF FOLLOW‐UP: 29 weeks STUDY TERMINATED BEFORE REGULAR END: no | |
| Publication details | LANGUAGE OF PUBLICATION: English COMMERCIAL FUNDING PUBLICATION STATUS: peer‐reviewed journal | |
| Stated aim of study | Quote: "This report describes the results of two randomized, placebo‐controlled, multicenter trials in which moderately obese patients with NIDDM whose diabetes was poorly controlled with diet alone or with diet plus a sulfonylurea drug were treated with metformin for 29 weeks." | |
| Notes | The intervention group with glibenclamide plus metformin combination therapy is not included | |
| Risk of bias | ||
| Bias | Authors' judgement | Support for judgement |
| Random sequence generation (selection bias) | Unclear risk | Quote: "....patients were randomly assigned to treatment with........" |
| Allocation concealment (selection bias) | Unclear risk | NR |
| Blinding of participants and personnel (performance bias) | Unclear risk | The trial is described as double‐blind, but the method of blinding not described |
| Blinding of outcome assessment (detection bias) | Unclear risk | NR |
| Incomplete outcome data (attrition bias) | Unclear risk | Reasons for withdrawals are not sufficient |
| Selective reporting (reporting bias) | Unclear risk | No trial protocol or design article available |
| Academic bias | Low risk | Primary author's first publication on the interventions |
| Sponsor bias | High risk | Received funding from pharmaceutical industry |
| Trials according to risk of bias | Unclear risk | Unclear sequence generation, allocation concealment and blinding |
| Methods | PARALLEL RANDOMISED CONTROLLED CLINICAL TRIAL DOUBLE‐BLIND/OPEN‐LABEL: double‐blind INTERVENTIONS USED IN TRIALS: Sulphonylurea: glibenclamide Control: xiaoyoasan jiajian | |
| Participants | INCLUSION CRITERIA: T2DM EXCLUSION CRITERIA: NR DIAGNOSTIC CRITERIA: NR NUMBER OF PATIENTS WITH PREVIOUS CARDIOVASCULAR DISEASE: Sulphonylurea: NR Control: NR NUMBER OF PATIENTS TREATED WITH ASPIRIN/ANTIHYPERTENSIVES/LIPID‐LOWERING: Sulphonylurea: NR Control: NR | |
| Interventions | NUMBER OF STUDY CENTRES: 1 COUNTRY/LOCATION: China SETTING: NR TREATMENT BEFORE STUDY: NR TITRATION PERIOD: NR GLYCAEMIC TARGET: NR | |
| Outcomes | OUTCOME(S) (as stated in the protocol/registered trial documents): FBG, 2‐hour post‐prandial blood glucose and HbA1c | |
| Study details | RUN‐IN PERIOD: NR DURATION OF INTERVENTION: 6 months DURATION OF FOLLOW‐UP: 6 months STUDY TERMINATED BEFORE REGULAR END: NR | |
| Publication details | LANGUAGE OF PUBLICATION: Chinese COMMERCIAL FUNDING/NON‐COMMERCIAL FUNDING PUBLICATION STATUS: peer‐reviewed journal | |
| Stated aim of study | According to Chinese extractor, NR | |
| Notes | Extracted by a Chinese collaborator | |
| Risk of bias | ||
| Bias | Authors' judgement | Support for judgement |
| Random sequence generation (selection bias) | Unclear risk | Is a randomised clinical trial. Generation of sequence generation not described. |
| Allocation concealment (selection bias) | Unclear risk | NR |
| Blinding of participants and personnel (performance bias) | Unclear risk | Double‐blind, but method not described |
| Blinding of outcome assessment (detection bias) | Unclear risk | NR |
| Incomplete outcome data (attrition bias) | Unclear risk | NR |
| Selective reporting (reporting bias) | Unclear risk | No trial protocol or design article available |
| Academic bias | Low risk | Primary author's first publication on the interventions |
| Sponsor bias | Unclear risk | Funding not reported |
| Trials according to risk of bias | Unclear risk | Unclear sequence generation, allocation concealment and blinding |
| Methods | PARALLEL RANDOMISED CONTROLLED CLINICAL TRIAL DOUBLE‐BLIND/OPEN‐LABEL: double‐blind INTERVENTIONS USED IN TRIALS: Sulphonylurea: glimepiride Control: repaglinide | |
| Participants | INCLUSION CRITERIA:
EXCLUSION CRITERIA: NR DIAGNOSTIC CRITERIA: ADA criteria NUMBER OF PATIENTS WITH PREVIOUS CARDIOVASCULAR DISEASE: Sulphonylurea: NR Control: NR NUMBER OF PATIENTS TREATED WITH ASPIRIN/ANTIHYPERTENSIVES/LIPID‐LOWERING: Sulphonylurea: NR/0/0 Control: NR/0/0 | |
| Interventions | NUMBER OF STUDY CENTRES: 1 COUNTRY/LOCATION: Italy SETTING: outpatients TREATMENT BEFORE STUDY: treatment‐naive TITRATION PERIOD: 8 weeks GLYCAEMIC TARGET: FPG < 120 mg/dl; postprandial plasma glucose < 160 mg/dl 2 hours after meal; HbA1c < 7% | |
| Outcomes | OUTCOME(S) (as stated in the protocol/registered trial documents): glycaemic control, lipoprotein (a), plasminogen activator inhibitor‐1, homocysteine, biochemical variables, blood pressure | |
| Study details | RUN‐IN PERIOD: 4 weeks DURATION OF INTERVENTION: 14 months DURATION OF FOLLOW‐UP: 14 months STUDY TERMINATED BEFORE REGULAR END: no | |
| Publication details | LANGUAGE OF PUBLICATION: English COMMERCIAL FUNDING/NON‐COMMERCIAL FUNDING PUBLICATION STATUS: peer‐reviewed journal | |
| Stated aim of study | Quote: "The present study was designed to compare the effects of repaglinide and glimepiride on measures of glycemic control in patients with type 2 diabetes and to determine whether these agents have differing effects on levels of Lp(a), PAl‐l, and Hcy" | |
| Notes | ||
| Risk of bias | ||
| Bias | Authors' judgement | Support for judgement |
| Random sequence generation (selection bias) | Unclear risk | Quote: "Randomization codes were prepared by a statistician and placed in envelopes; the statistician subsequently carried out randomization by drawing the envelopes." |
| Allocation concealment (selection bias) | Low risk | Quote: "Randomization codes were prepared by a statistician and placed in envelopes; the statistician subsequently carried out randomization by drawing the envelopes." |
| Blinding of participants and personnel (performance bias) | Low risk | Quote: "..., blinding of the investigators and patients was maintained through the use of identical numbered bottles prepared by the hospital pharmacy." |
| Blinding of outcome assessment (detection bias) | Low risk | We assume blinded |
| Incomplete outcome data (attrition bias) | Low risk | Sufficient description of patients lost to follow‐up |
| Selective reporting (reporting bias) | Unclear risk | No trial protocol or design article available |
| Academic bias | Low risk | Not published trials investigating the same interventions (in monotherapy) previously |
| Sponsor bias | Unclear risk | Funding not reported |
| Trials according to risk of bias | Unclear risk | Unclear sequence generation, adequate allocation concealment and blinding |
| Methods | PARALLEL RANDOMISED CONTROLLED CLINICAL TRIAL DOUBLE‐BLIND/OPEN‐LABEL: open‐label INTERVENTIONS USED IN TRIALS: Sulphonylurea: glimepiride Control: metformin | |
| Participants | INCLUSION CRITERIA:
EXCLUSION CRITERIA:
DIAGNOSTIC CRITERIA: ADA criteria NUMBER OF PATIENTS WITH PREVIOUS CARDIOVASCULAR DISEASE: Sulphonylurea: NR Control: NR NUMBER OF PATIENTS TREATED WITH ASPIRIN/ANTIHYPERTENSIVES/LIPID‐LOWERING: Sulphonylurea: NR/0/0 Control: NR/0/0 | |
| Interventions | NUMBER OF STUDY CENTRES: 3 COUNTRY/LOCATION: Italy SETTING: outpatients TREATMENT BEFORE STUDY: NR TITRATION PERIOD: 8 weeks GLYCAEMIC TARGET: FPG < 120 mg/dl; postprandial plasma glucose < 160 mg/dl 2 hours after meal | |
| Outcomes | OUTCOME(S) (as stated in the protocol/registered trial documents): extra glycaemic parameters, specifically those associated with cardiovascular risk. Glycaemic efficacy | |
| Study details | RUN‐IN PERIOD: NR DURATION OF INTERVENTION: 12 months (+ 8 weeks titration period) DURATION OF FOLLOW‐UP: 12 months (+ 8 weeks titration period) STUDY TERMINATED BEFORE REGULAR END: no | |
| Publication details | LANGUAGE OF PUBLICATION: English COMMERCIAL FUNDING/NON‐COMMERCIAL FUNDING PUBLICATION STATUS: peer‐reviewed journal | |
| Stated aim of study | Quote: "The aim of the study was to compare the metabolic effects of glimepiride and metformin in patients with T2DM." | |
| Notes | ||
| Risk of bias | ||
| Bias | Authors' judgement | Support for judgement |
| Random sequence generation (selection bias) | Unclear risk | Quote: "...,randomised,.." |
| Allocation concealment (selection bias) | Unclear risk | NR |
| Blinding of participants and personnel (performance bias) | High risk | Open‐label design |
| Blinding of outcome assessment (detection bias) | High risk | Open‐label design |
| Incomplete outcome data (attrition bias) | Low risk | Sufficient description of patients lost to follow‐up |
| Selective reporting (reporting bias) | Unclear risk | No trial protocol or design article available |
| Academic bias | Low risk | Not published trials investigating the same interventions (in monotherapy) previously |
| Sponsor bias | Unclear risk | Funding not reported |
| Trials according to risk of bias | Unclear risk | Unclear sequence generation and allocation concealment. Inadequate blinding |
| Methods | CROSS‐OVER RANDOMISED CONTROLLED CLINICAL TRIAL DOUBLE‐BLIND/OPEN‐LABEL: not described, we assume open‐label INTERVENTIONS USED IN TRIALS: Sulphonylurea: chlorpropamide Control: insulin | |
| Participants | INCLUSION CRITERIA:
EXCLUSION CRITERIA:
DIAGNOSTIC CRITERIA: fasting serum glucose of 150 mg/dl or higher on 2 occasions NUMBER OF PATIENTS WITH PREVIOUS CARDIOVASCULAR DISEASE: Sulphonylurea: NR Control: NR NUMBER OF PATIENTS TREATED WITH ASPIRIN/ANTIHYPERTENSIVES/LIPID‐LOWERING: Sulphonylurea: NR Control: NR | |
| Interventions | NUMBER OF STUDY CENTRES: 1 COUNTRY/LOCATION: USA SETTING: outpatients TREATMENT BEFORE STUDY: diet or antidiabetic interventions the previously 12 months TITRATION PERIOD: NR GLYCAEMIC TARGET: achieve fasting glucose levels of ≤ 140 mg/dl while avoiding hypoglycaemic symptoms | |
| Outcomes | OUTCOME(S) (as stated in the protocol/registered trial documents): compliance | |
| Study details | RUN‐IN PERIOD: 4 weeks DURATION OF INTERVENTION: 24 weeks DURATION OF FOLLOW‐UP: 24 weeks STUDY TERMINATED BEFORE REGULAR END: no | |
| Publication details | LANGUAGE OF PUBLICATION: English COMMERCIAL FUNDING PUBLICATION STATUS: peer‐reviewed journal | |
| Stated aim of study | Quote: "We compared compliance with insulin and chlorpropamide in patients newly beginning medication for NIDDM." | |
| Notes | ||
| Risk of bias | ||
| Bias | Authors' judgement | Support for judgement |
| Random sequence generation (selection bias) | Low risk | Quote: "…were randomly assigned using opaque sealed envelopes to therapy…" Through correspondence, the primary author informed us that randomisation was done with a table of random number |
| Allocation concealment (selection bias) | Low risk | Quote: "…were randomly assigned using opaque sealed envelopes to therapy…" |
| Blinding of participants and personnel (performance bias) | High risk | Open‐label design |
| Blinding of outcome assessment (detection bias) | Low risk | Through correspondence we were told that the outcome assessors were blinded for the primary outcome |
| Incomplete outcome data (attrition bias) | Unclear risk | Drop‐outs and reasons described, but not possible to judge whether from first or second treatment period |
| Selective reporting (reporting bias) | Low risk | No trial protocol or design article available, but the primary authors confirmed the predefined outcomes through correspondence |
| Academic bias | Low risk | Primary author's first publication on the interventions |
| Sponsor bias | High risk | Received funding from pharmaceutical industry |
| Trials according to risk of bias | Unclear risk | Adequate sequence generation and allocation concealment, inadequate blinding of participants, adequate blinding of outcome assessors |
| Methods | PARALLEL RANDOMISED CONTROLLED CLINICAL TRIAL DOUBLE‐BLIND/OPEN‐LABEL: double‐blind INTERVENTIONS USED IN TRIALS: Sulphonylurea: glibenclamide Control 1: pioglitazone Control 2: placebo | |
| Participants | INCLUSION CRITERIA:
EXCLUSION CRITERIA: NR DIAGNOSTIC CRITERIA: NR NUMBER OF PATIENTS WITH PREVIOUS CARDIOVASCULAR DISEASE: Sulphonylurea: NR Control 1: NR Control 2: NR NUMBER OF PATIENTS TREATED WITH ASPIRIN/ANTIHYPERTENSIVES/LIPID‐LOWERING: Sulphonylurea: NR Control 1: NR Control 2: NR | |
| Interventions | NUMBER OF STUDY CENTRES: 1 COUNTRY/LOCATION: Finland SETTING: outpatients TREATMENT BEFORE STUDY: diet with or without one oral agent TITRATION PERIOD: titrated during trial GLYCAEMIC TARGET: NR | |
| Outcomes | OUTCOME(S) (as stated in the protocol/registered trial documents): glycaemic control, acute phase proteins and the influence of complement activation | |
| Study details | RUN‐IN PERIOD: NR DURATION OF INTERVENTION: 6 months DURATION OF FOLLOW‐UP: 6 months STUDY TERMINATED BEFORE REGULAR END: no | |
| Publication details | LANGUAGE OF PUBLICATION: English COMMERCIAL FUNDING/NON‐COMMERCIAL FUNDING PUBLICATION STATUS: peer‐reviewed journal | |
| Stated aim of study | Quote: "We wanted to study how these proteins are related to complement activation in type 2 diabetes and how improvement of glycemic control affects them or complement activation." | |
| Notes | ||
| Risk of bias | ||
| Bias | Authors' judgement | Support for judgement |
| Random sequence generation (selection bias) | Unclear risk | Quote: "We wanted to study how these proteins are related to complement activation in type 2 diabetes and how improvement of glycemic control affects them or complement activation." |
| Allocation concealment (selection bias) | Unclear risk | NR |
| Blinding of participants and personnel (performance bias) | Unclear risk | Quote: "This study was performed in a randomized double‐blind manner." Method of blinding not described |
| Blinding of outcome assessment (detection bias) | Unclear risk | NR |
| Incomplete outcome data (attrition bias) | Unclear risk | Loss to follow‐up not described |
| Selective reporting (reporting bias) | Unclear risk | No trial protocol or design article available |
| Academic bias | Low risk | Primary author's first publication on the interventions |
| Sponsor bias | High risk | Received funding from pharmaceutical industry |
| Trials according to risk of bias | Unclear risk | Unclear sequence generation, allocation concealment and blinding |
| Methods | PARALLEL RANDOMISED CONTROLLED CLINICAL TRIAL DOUBLE‐BLIND/OPEN‐LABEL: open‐label INTERVENTIONS USED IN TRIALS: Sulphonylurea: glibenclamide Control: repaglinide | |
| Participants | INCLUSION CRITERIA:
EXCLUSION CRITERIA:
DIAGNOSTIC CRITERIA: NR NUMBER OF PATIENTS WITH PREVIOUS CARDIOVASCULAR DISEASE: Sulphonylurea: NR Control: NR NUMBER OF PATIENTS TREATED WITH ASPIRIN/ANTIHYPERTENSIVES/LIPID‐LOWERING: Sulphonylurea: NR Control: NR | |
| Interventions | NUMBER OF STUDY CENTRES: 1 COUNTRY/LOCATION: Italy SETTING: outpatients TREATMENT BEFORE STUDY: treatment‐naive or peroral antidiabetic drugs TITRATION PERIOD: 6 to 8 weeks GLYCAEMIC TARGET:
| |
| Outcomes | OUTCOME(S) (as stated in the protocol/registered trial documents): carotis intima media thickness, biochemical variables, markers of systemic vascular inflammation | |
| Study details | RUN‐IN PERIOD: none DURATION OF INTERVENTION: 12 months plus 6 to 8 weeks (titration period) DURATION OF FOLLOW‐UP: 12 months plus 6 to 8 weeks (titration period) STUDY TERMINATED BEFORE REGULAR END: no | |
| Publication details | LANGUAGE OF PUBLICATION: English NON‐COMMERCIAL FUNDING PUBLICATION STATUS: peer‐reviewed journal | |
| Stated aim of study | Quote: "We compared the effects of two insulin secretagogues, repaglinide and glyburide, known to have different efficacy on postprandial hyperglycemia, on carotid intima‐media thickness (CIMT) and markers of systemic vascular inflammation in type 2 diabetic patients." | |
| Notes | Non‐diabetic control group not included in the analysis | |
| Risk of bias | ||
| Bias | Authors' judgement | Support for judgement |
| Random sequence generation (selection bias) | Low risk | Quote: "A total of 175 diabetic patients were randomly assigned to open‐label treatment with either repaglinide or glyburide, through the use of a computer‐generated random number sequence (Figure 1)." |
| Allocation concealment (selection bias) | Low risk | Quote: "Allocation was concealed in sealed study folders that were held in a central, secured location until after informed consent was obtained." |
| Blinding of participants and personnel (performance bias) | High risk | Open‐label |
| Blinding of outcome assessment (detection bias) | Low risk | Quote: "The laboratory staff did not know the participants’ group assignments." |
| Incomplete outcome data (attrition bias) | Unclear risk | Not clearly described reason for drop‐outs in each intervention group |
| Selective reporting (reporting bias) | Low risk | No trial protocol or design article available |
| Academic bias | Low risk | Primary author's first publication on the interventions |
| Sponsor bias | Low risk | No commercial funding |
| Trials according to risk of bias | Unclear risk | Adequate sequence generation and allocation concealment, inadequate blinding of participants and investigators, adequate blinding of outcome assessors |
| Methods | PARALLEL RANDOMISED CONTROLLED CLINICAL TRIAL DOUBLE‐BLIND/OPEN‐LABEL: open‐label INTERVENTIONS USED IN TRIALS: Sulphonylurea: glimepiride Control: acarbose | |
| Participants | INCLUSION CRITERIA:
EXCLUSION CRITERIA:
DIAGNOSTIC CRITERIA: NR NUMBER OF PATIENTS WITH PREVIOUS CARDIOVASCULAR DISEASE: Sulphonylurea: NR Control: NR NUMBER OF PATIENTS TREATED WITH ASPIRIN/ANTIHYPERTENSIVES/LIPID‐LOWERING: Sulphonylurea: NR Control: NR | |
| Interventions | NUMBER OF STUDY CENTRES: 17 COUNTRY/LOCATION: Austria SETTING: outpatients TREATMENT BEFORE STUDY: diet TITRATION PERIOD: 6 weeks GLYCAEMIC TARGET: FBG 7.8 mmol/L | |
| Outcomes | OUTCOME(S) (as stated in the protocol/registered trial documents): number of responders in each intervention group, change in HbA1c, weight, postprandial blood glucose and C‐peptide levels from baseline, standard biochemical variables and C‐peptide | |
| Study details | RUN‐IN PERIOD: none DURATION OF INTERVENTION: 26 weeks DURATION OF FOLLOW‐UP: 26 weeks STUDY TERMINATED BEFORE REGULAR END: no | |
| Publication details | LANGUAGE OF PUBLICATION: English COMMERCIAL FUNDING PUBLICATION STATUS: peer‐reviewed journal | |
| Stated aim of study | Quote: "In the present study the efficacy, compliance and safety of acarbose and glimepiride were compared in patients with T2DM over a period of 26 weeks in a multicentre trial in Austria." | |
| Notes | ||
| Risk of bias | ||
| Bias | Authors' judgement | Support for judgement |
| Random sequence generation (selection bias) | Unclear risk | Quote: "Eligible patients were randomized (stratified by study center, blocked) to a dose‐finding phase…" |
| Allocation concealment (selection bias) | Unclear risk | NR |
| Blinding of participants and personnel (performance bias) | High risk | Open‐label design |
| Blinding of outcome assessment (detection bias) | High risk | Only describe that blood samples were analysed in a central laboratory |
| Incomplete outcome data (attrition bias) | Low risk | Loss to follow‐up adequately described |
| Selective reporting (reporting bias) | Unclear risk | No trial protocol or design article available |
| Academic bias | Low risk | Primary author's first publication on the interventions |
| Sponsor bias | High risk | Received funding from pharmaceutical industry |
| Trials according to risk of bias | Unclear risk | Unclear sequence generation and allocation concealment, inadequate blinding |
| Methods | PARALLEL RANDOMISED CONTROLLED CLINICAL TRIAL DOUBLE‐BLIND/OPEN‐LABEL: open‐label INTERVENTIONS USED IN TRIALS: Sulphonylurea: glipizide Control: tolbutamide | |
| Participants | INCLUSION CRITERIA:
EXCLUSION CRITERIA:
DIAGNOSTIC CRITERIA: United States Public Health Service criteria NUMBER OF PATIENTS WITH PREVIOUS CARDIOVASCULAR DISEASE: Sulphonylurea: NR Control: NR NUMBER OF PATIENTS TREATED WITH ASPIRIN/ANTIHYPERTENSIVES/LIPID‐LOWERING: Sulphonylurea: NR Control: NR | |
| Interventions | NUMBER OF STUDY CENTRES: NR COUNTRY/LOCATION: USA SETTING: outpatients TREATMENT BEFORE STUDY: diet and/or antidiabetic drugs TITRATION PERIOD: individual. Until max dose or satisfactory glycaemic control GLYCAEMIC TARGET: NR | |
| Outcomes | OUTCOME(S) (as stated in the protocol/registered trial documents): fasting and 2‐hour postprandial serum glucose levels, insulin secretion and dynamics and glucose disappearance rates | |
| Study details | RUN‐IN PERIOD: 4 weeks DURATION OF INTERVENTION: 6 months DURATION OF FOLLOW‐UP: 6 months STUDY TERMINATED BEFORE REGULAR END: no | |
| Publication details | LANGUAGE OF PUBLICATION: English COMMERCIAL FUNDING/NON‐COMMERCIAL FUNDING PUBLICATION STATUS: peer‐reviewed journal | |
| Stated aim of study | Quote: "Insulin secretion and dynamics and glucose disappearance rates (Kg) were studied before and at the end of the sixth month of therapy" | |
| Notes | ||
| Risk of bias | ||
| Bias | Authors' judgement | Support for judgement |
| Random sequence generation (selection bias) | Low risk | Quote: "Patients then entered the active drug titration phase and were assigned consecutive numbers which were matched with a corresponding list of computer generated random drug assignments." |
| Allocation concealment (selection bias) | Low risk | Quote: "Patients then entered the active drug titration phase and were assigned consecutive numbers which were matched with a corresponding list of computer generated random drug assignments." |
| Blinding of participants and personnel (performance bias) | High risk | Open‐label design |
| Blinding of outcome assessment (detection bias) | High risk | Open‐label design |
| Incomplete outcome data (attrition bias) | Unclear risk | Not reported to which group the patients lost to follow‐up belonged |
| Selective reporting (reporting bias) | Unclear risk | No trial protocol or design article available |
| Academic bias | Low risk | Primary author's first publication on the interventions |
| Sponsor bias | High risk | Received funding from a pharmaceutical industry |
| Trials according to risk of bias | Unclear risk | Adequate sequence generation and allocation concealment, inadequate blinding |
| Methods | PARALLEL RANDOMISED CONTROLLED CLINICAL TRIAL DOUBLE‐BLIND/OPEN‐LABEL: double‐blind INTERVENTIONS USED IN TRIALS: Sulphonylurea: gliclazide Control: vildagliptin | |
| Participants | INCLUSION CRITERIA:
EXCLUSION CRITERIA:
DIAGNOSTIC CRITERIA: NR NUMBER OF PATIENTS WITH PREVIOUS CARDIOVASCULAR DISEASE: Sulphonylurea: NR Control: NR NUMBER OF PATIENTS TREATED WITH ASPIRIN/ANTIHYPERTENSIVES/LIPID‐LOWERING: Sulphonylurea: NR Control: NR | |
| Interventions | NUMBER OF STUDY CENTRES: 151 COUNTRY/LOCATION: 16 countries (Europe, Latin America and South Africa) SETTING: outpatients TREATMENT BEFORE STUDY: treatment‐naive TITRATION PERIOD: 12 weeks GLYCAEMIC TARGET: FPG was < 7 mmol/L | |
| Outcomes | OUTCOME(S) (as stated in the protocol/registered trial documents): change in HbA1c from baseline, body weight, FPG, fasting plasma lipids, fasting proinsulin, fasting insulin, fasting proinsulin/insulin ratio and homeostasis model assessment of insulin resistance (HOMA IR), adverse events both by regular physical examination and measurement of blood chemistry, haematology and urinalysis | |
| Study details | RUN‐IN PERIOD: NR DURATION OF INTERVENTION: 104 weeks DURATION OF FOLLOW‐UP: 104 weeks STUDY TERMINATED BEFORE REGULAR END: no | |
| Publication details | LANGUAGE OF PUBLICATION: English COMMERCIAL FUNDING PUBLICATION STATUS: peer‐reviewed journal | |
| Stated aim of study | Quote: "...designed to compare the efficacy and safety of two years of monotherapy with vildagliptin 50 mg bid and gliclazide up to 320 mg/day in drug‐naïve patients with type 2 diabetes." | |
| Notes | ||
| Risk of bias | ||
| Bias | Authors' judgement | Support for judgement |
| Random sequence generation (selection bias) | Unclear risk | Quote:"..,multi‐center, double‐blind, randomized, active‐controlled study to compare…" |
| Allocation concealment (selection bias) | Unclear risk | Quote:"..,multi‐center, double‐blind, randomized, active‐controlled study to compare…" |
| Blinding of participants and personnel (performance bias) | Unclear risk | Quote:"..,multi‐center, double‐blind, randomized, active‐controlled study to compare…" Method of blinding not described |
| Blinding of outcome assessment (detection bias) | Unclear risk | See above |
| Incomplete outcome data (attrition bias) | Low risk | Reason for loss to follow‐up described |
| Selective reporting (reporting bias) | Low risk | All outcomes from clinicaltrials.gov reported |
| Academic bias | Low risk | Primary author's first publication on the interventions |
| Sponsor bias | High risk | Received grant from pharmaceutical industry |
| Trials according to risk of bias | Unclear risk | Unclear sequence generation, allocation concealment and blinding |
| Methods | PARALLEL RANDOMISED CONTROLLED CLINICAL TRIAL DOUBLE‐BLIND/OPEN‐LABEL: open‐label INTERVENTIONS USED IN TRIALS: Sulphonylurea: glibenclamide Comparator: insulin lispro | |
| Participants | INCLUSION CRITERIA:
EXCLUSION CRITERIA: insulin therapy DIAGNOSTIC CRITERIA: WHO NUMBER OF PATIENTS WITH PREVIOUS CARDIOVASCULAR DISEASE: Sulphonylurea: NR Comparator: NR NUMBER OF PATIENTS TREATED WITH ASPIRIN/ANTIHYPERTENSIVE/LIPID‐LOWERING: Sulphonylurea: NR Comparator: NR | |
| Interventions | NUMBER OF STUDY CENTRES: 19 COUNTRY/LOCATION: Sweden, Germany and Switzerland SETTING: outpatients TREATMENT BEFORE STUDY: drug naive or oral antidiabetic TITRATION PERIOD: NR GLYCAEMIC TARGET: NR | |
| Outcomes | OUTCOME(S) (as stated in the protocol/registered trial documents): postprandial blood glucose excursion, glycaemic control, biochemical variables, safety data | |
| Study details | RUN‐IN PERIOD: 6 weeks DURATION OF INTERVENTION: 24 weeks DURATION OF FOLLOW‐UP: 24 weeks STUDY TERMINATED BEFORE REGULAR END: no | |
| Publication details | LANGUAGE OF PUBLICATION: English COMMERCIAL FUNDING PUBLICATION STATUS: peer‐reviewed journal | |
| Stated aim of study | Quote: "In the present study the efficacy and safety of the preprandial injections of insulin lispro were compared with the oral administration of glibenclamide in patients with type 2 diabetes" | |
| Notes | ||
| Risk of bias | ||
| Bias | Authors' judgement | Support for judgement |
| Random sequence generation (selection bias) | Unclear risk | Quote: "Seventy‐five patients were randomized to…" |
| Allocation concealment (selection bias) | Unclear risk | NR |
| Blinding of participants and personnel (performance bias) | High risk | Open‐label design |
| Blinding of outcome assessment (detection bias) | High risk | We assume not blinded |
| Incomplete outcome data (attrition bias) | Low risk | All completed the trial |
| Selective reporting (reporting bias) | Unclear risk | No trial protocol or design article available |
| Academic bias | Low risk | Primary author's first publication on the interventions |
| Sponsor bias | High risk | Received funding from pharmaceutical industry |
| Trials according to risk of bias | Unclear risk | Unclear sequence generation and allocation concealment, inadequate blinding |
| Methods | PARALLEL RANDOMISED CONTROLLED CLINICAL TRIAL DOUBLE‐BLIND/OPEN‐LABEL: open‐label INTERVENTIONS USED IN TRIALS: Sulphonylurea: glimepiride Comparator: pioglitazone | |
| Participants | INCLUSION CRITERIA:
EXCLUSION CRITERIA:
DIAGNOSTIC CRITERIA: ADA criteria NUMBER OF PATIENTS WITH PREVIOUS CARDIOVASCULAR DISEASE: Sulphonylurea: glimepiride Comparator: pioglitazone NUMBER OF PATIENTS TREATED WITH ASPIRIN/ANTIHYPERTENSIVES/LIPID‐LOWERING: Sulphonylurea: 26/41/13 Comparator: 25/52/18 | |
| Interventions | NUMBER OF STUDY CENTRES: 1, we assume COUNTRY/LOCATION: Germany SETTING: outpatients TREATMENT BEFORE STUDY: not specified TITRATION PERIOD: not described GLYCAEMIC TARGET: morning blood glucose levels less than 6.7 mmol/L | |
| Outcomes | OUTCOME(S) (as stated in the protocol/registered trial documents): heat‐stimulated microvascular blood flow, biochemical variables | |
| Study details | RUN‐IN PERIOD: not described DURATION OF INTERVENTION: 24 weeks DURATION OF FOLLOW‐UP: 24 weeks STUDY TERMINATED BEFORE REGULAR END: no | |
| Publication details | LANGUAGE OF PUBLICATION: English COMMERCIAL FUNDING/NON‐COMMERCIAL FUNDING: no PUBLICATION STATUS: peer‐reviewed journal | |
| Stated aim of study | Quote: "The present study was performed to investigate the effect of improving glucose control and insulin sensitivity by activating PPAR‐γ with pioglitazone, in comparison with glimepiride treatment, on metabolic control, insulin resistance, and microvascular function in patients with type 2 diabetes." | |
| Notes | It is not clearly described whether the trial is open‐label or not, but we assume it to be open‐label, because the addition of other antidiabetic drugs, if intervention failure differed between the 2 interventions The number reported for patients with antihypertensive is the number of patients receiving angiotensin 2‐antagonist or ACE‐inhibitor. Number of lipid‐lowering is the number of patients on statins | |
| Risk of bias | ||
| Bias | Authors' judgement | Support for judgement |
| Random sequence generation (selection bias) | Unclear risk | Quote: "After randomization, patients..." |
| Allocation concealment (selection bias) | Unclear risk | NR |
| Blinding of participants and personnel (performance bias) | Unclear risk | Probably open‐label |
| Blinding of outcome assessment (detection bias) | Unclear risk | NR |
| Incomplete outcome data (attrition bias) | High risk | 179 patients randomised, but only 173 reported. Unknown why the 6 patients did not complete the trial |
| Selective reporting (reporting bias) | Unclear risk | No trial protocol or design article available |
| Academic bias | Low risk | Primary author's first publication on the interventions |
| Sponsor bias | High risk | Received funding from pharmaceutical industry |
| Trials according to risk of bias | Unclear risk | Unclear sequence generation, allocation concealment and blinding |
| Methods | PARALLEL RANDOMISED CONTROLLED CLINICAL TRIAL DOUBLE‐BLIND/OPEN‐LABEL: double‐blind INTERVENTIONS USED IN TRIALS: Sulphonylurea: glibenclamide Control 1: rosiglitazone 4 mg Control 2: rosiglitazone 8 mg | |
| Participants | INCLUSION CRITERIA:
EXCLUSION CRITERIA: Patients who had diabetic complications requiring treatment, serious renal, hepatic or haematological impairment, women of childbearing potential and insulin use were excluded DIAGNOSTIC CRITERIA: NR NUMBER OF PATIENTS WITH PREVIOUS CARDIOVASCULAR DISEASE: Sulphonylurea: NR Control 1: NR Control 2: NR NUMBER OF PATIENTS TREATED WITH ASPIRIN/ANTIHYPERTENSIVES/LIPID‐LOWERING: Sulphonylurea: NR Control 1: NR Control 2: NR | |
| Interventions | NUMBER OF STUDY CENTRES: 71 COUNTRY/LOCATION: France, Germany, Italy, UK, Belgium, Sweden, Ireland and Netherlands SETTING: outpatients TREATMENT BEFORE STUDY: diet or oral therapy (withdrawn 6 months before randomisation) TITRATION PERIOD: 12 weeks GLYCAEMIC TARGET: NR | |
| Outcomes | OUTCOME(S) (as stated in the protocol/registered trial documents): HbA1c, FPG, fructosamine, C‐peptide, insulin, pro‐insulin, 32‐33 split pro‐insulin, urinary albumin, albumin excretion rate and serum lipids | |
| Study details | RUN‐IN PERIOD: 4 to 6 weeks DURATION OF INTERVENTION: 52 weeks DURATION OF FOLLOW‐UP: 52 weeks STUDY TERMINATED BEFORE REGULAR END: no | |
| Publication details | LANGUAGE OF PUBLICATION: English COMMERCIAL FUNDING PUBLICATION STATUS: one of the publications is an article in a peer‐reviewed journal, the other is from the GlaxoSmithKline website | |
| Stated aim of study | Quote: "Sulphonylureas (SU) act by increasing endogenous insulin secretion. Rosiglitazone (RSG) acts predominantly by increasing insulin sensitivity and this study was to determine if RSG was a viable alternative to glibenclamide in first‐line therapy in patients with type 2 diabetes." | |
| Notes | ||
| Risk of bias | ||
| Bias | Authors' judgement | Support for judgement |
| Random sequence generation (selection bias) | Unclear risk | Quote: "....patients who were randomised...." |
| Allocation concealment (selection bias) | Unclear risk | NR |
| Blinding of participants and personnel (performance bias) | Low risk | Quote: "Rosiglitazone, glibenclamide and placebo capsules were matched for weight, shape and colour. A double‐dummy system allowed ‘‘titration’’ of rosiglitazone without a change of dose." |
| Blinding of outcome assessment (detection bias) | Low risk | We assume due to double‐blind design |
| Incomplete outcome data (attrition bias) | Unclear risk | Loss to follow‐up sufficiently described |
| Selective reporting (reporting bias) | Unclear risk | No trial protocol or design article available |
| Academic bias | Low risk | Primary author's first publication on the interventions |
| Sponsor bias | High risk | Sponsored by pharmaceutical company |
| Trials according to risk of bias | Unclear risk | Unclear sequence generation, allocation concealment, adequate blinding |
| Methods | PARALLEL RANDOMISED CONTROLLED CLINICAL TRIAL DOUBLE‐BLIND/OPEN‐LABEL: open‐label INTERVENTIONS USED IN TRIALS: Sulphonylurea: second‐generation sulphonylurea: glipizide, gliquidone, gliclazide and glibenclamide Control: chlorpropamide | |
| Participants | INCLUSION CRITERIA:
EXCLUSION CRITERIA: NR DIAGNOSTIC CRITERIA: NR NUMBER OF PATIENTS WITH PREVIOUS CARDIOVASCULAR DISEASE: Sulphonylurea: NR Control: NR NUMBER OF PATIENTS TREATED WITH ASPIRIN/ANTIHYPERTENSIVES/LIPID‐LOWERING: Sulphonylurea: NR Control: NR | |
| Interventions | NUMBER OF STUDY CENTRES: NR COUNTRY/LOCATION: Scotland SETTING: outpatients TREATMENT BEFORE STUDY: diet TITRATION PERIOD: NR GLYCAEMIC TARGET: NR, describe normal range from 5.6% to 8.7% | |
| Outcomes | OUTCOME(S) (as stated in the protocol/registered trial documents): diabetic control, biochemical variables | |
| Study details | RUN‐IN PERIOD: NR DURATION OF INTERVENTION: 12 months DURATION OF FOLLOW‐UP: 12 months STUDY TERMINATED BEFORE REGULAR END: no | |
| Publication details | LANGUAGE OF PUBLICATION: English NON‐COMMERCIAL FUNDING: not directly, but was sponsored by the medical unit of a general hospital in Scotland PUBLICATION STATUS: peer‐reviewed journal | |
| Stated aim of study | Quote: "Five currently available sulphonylureas were compared to see whether, in routine use for 1 year, they produced any major differences in diabetic control." | |
| Notes | ||
| Risk of bias | ||
| Bias | Authors' judgement | Support for judgement |
| Random sequence generation (selection bias) | Low risk | Quote: "The patients were randomly allocated to one of five concurrent treatment groups…" Correspondence with author: the patients were randomly allocated using a card system with the drugs named on each card and placed randomly in a box |
| Allocation concealment (selection bias) | Unclear risk | NR |
| Blinding of participants and personnel (performance bias) | High risk | Open‐label design |
| Blinding of outcome assessment (detection bias) | Low risk | The outcome assessors were blinded. Information through correspondence |
| Incomplete outcome data (attrition bias) | Low risk | Loss to follow‐up sufficiently described |
| Selective reporting (reporting bias) | Unclear risk | No trial protocol or design article available |
| Academic bias | Low risk | Primary author's first publication on the interventions |
| Sponsor bias | Low risk | No funding from pharmaceutical industry. Information through correspondence |
| Trials according to risk of bias | Unclear risk | Unclear sequence generation, allocation concealment and blinding |
| Methods | CROSS‐OVER RANDOMISED CONTROLLED CLINICAL TRIAL DOUBLE‐BLIND/OPEN‐LABEL: open‐label INTERVENTIONS USED IN TRIALS: Sulphonylurea: glibenclamide Control: metformin | |
| Participants | INCLUSION CRITERIA:
EXCLUSION CRITERIA: Persistent high blood glucose level on maximally tolerated dose of glibenclamide (FBG > 12 mmol/L) and/or intolerable adverse effects DIAGNOSTIC CRITERIA: NR NUMBER OF PATIENTS WITH PREVIOUS CARDIOVASCULAR DISEASE: Sulphonylurea: NR Control: NR NUMBER OF PATIENTS TREATED WITH ASPIRIN/ANTIHYPERTENSIVES/LIPID‐LOWERING: Sulphonylurea: NR Control: NR | |
| Interventions | NUMBER OF STUDY CENTRES: 2 COUNTRY/LOCATION: Sweden SETTING: outpatients TREATMENT BEFORE STUDY: diet and/or glibenclamide TITRATION PERIOD: NR GLYCAEMIC TARGET: NR | |
| Outcomes | OUTCOME(S) (as stated in the protocol/registered trial documents): glycaemic control, lipids, C‐peptide | |
| Study details | RUN‐IN PERIOD: NR DURATION OF INTERVENTION: 6 months DURATION OF FOLLOW‐UP: 6 months STUDY TERMINATED BEFORE REGULAR END: no | |
| Publication details | LANGUAGE OF PUBLICATION: English COMMERCIAL FUNDING PUBLICATION STATUS: peer‐reviewed journal | |
| Stated aim of study | Quote: "The purpose of the present study was to compare long‐term metformin and glibenclamide treatment in their effects on glycaemic control, weight, lipids, lipoproteins and insulin secretion." | |
| Notes | ||
| Risk of bias | ||
| Bias | Authors' judgement | Support for judgement |
| Random sequence generation (selection bias) | Low risk | The participants were randomised to the 2 interventions by help of a table of random numbers (correspondence with author) |
| Allocation concealment (selection bias) | Unclear risk | NR |
| Blinding of participants and personnel (performance bias) | High risk | Open‐label design |
| Blinding of outcome assessment (detection bias) | High risk | We assume not blinded |
| Incomplete outcome data (attrition bias) | Unclear risk | 3 participants lost to follow‐up. Not clearly reported in which group they belonged |
| Selective reporting (reporting bias) | Unclear risk | No trial protocol or design article available |
| Academic bias | Low risk | Primary author's first publication on the interventions |
| Sponsor bias | High risk | Received funding from pharmaceutical industry |
| Trials according to risk of bias | Unclear risk | Adequate sequence generation, unclear allocation concealment, inadequate blinding |
| Methods | PARALLEL RANDOMISED CONTROLLED CLINICAL TRIAL DOUBLE‐BLIND/OPEN‐LABEL: double‐blind INTERVENTIONS USED IN TRIALS: Sulphonylurea: glibenclamide Control: metformin | |
| Participants | INCLUSION CRITERIA:
EXCLUSION CRITERIA:
DIAGNOSTIC CRITERIA: WHO NUMBER OF PATIENTS WITH PREVIOUS CARDIOVASCULAR DISEASE: 12% of all participants had coronary heart disease Sulphonylurea: NR Control: NR NUMBER OF PATIENTS TREATED WITH ASPIRIN/ANTIHYPERTENSIVES/LIPID‐LOWERING: 40% of all participants received beta‐blockers Sulphonylurea: NR Control: NR | |
| Interventions | NUMBER OF STUDY CENTRES: 5 COUNTRY/LOCATION: Sweden SETTING: outpatients TREATMENT BEFORE STUDY: diet or oral antidiabetic agents (had to be withdrawn 2 to 3 weeks before study entry) TITRATION PERIOD: 2 to 12 weeks GLYCAEMIC TARGET: FBG < 6.7 mmol/L | |
| Outcomes | OUTCOME(S) (as stated in the protocol/registered trial documents): efficacy and safety, responders, additive effect of sulphonylurea and metformin, lipids, insulin | |
| Study details | RUN‐IN PERIOD: 8 weeks (6 weeks on diet followed by 2 weeks with placebo tablets) DURATION OF INTERVENTION: 6 months + 2 to 12 weeks DURATION OF FOLLOW‐UP: 6 months + 2 to 12 weeks STUDY TERMINATED BEFORE REGULAR END: no | |
| Publication details | LANGUAGE OF PUBLICATION: English COMMERCIAL FUNDING PUBLICATION STATUS: peer‐reviewed journal | |
| Stated aim of study | Quote: "To assess and compare the therapeutic efficacy and safety of metformin (M) and sulfonylurea (glyburide, G), alone and in various combinations, in patients with non‐insulin‐dependent diabetes mellitus (NIDDM)." | |
| Notes | The group of participants randomised to receive metformin and glibenclamide combination therapy from the start is not included in the meta‐analysis After diet period the patients underwent a main randomisation, early randomisation or delayed randomisation according to the FBG | |
| Risk of bias | ||
| Bias | Authors' judgement | Support for judgement |
| Random sequence generation (selection bias) | Low risk | Quote: ".., patients were randomized (Fig. 1) according to computer‐generated lists…" |
| Allocation concealment (selection bias) | Low risk | Quote: ".., patients were randomized (Fig. 1) according to computer‐generated lists…" |
| Blinding of participants and personnel (performance bias) | Low risk | Quote: "To obtain truly double‐blind conditions, the study used a double dummy technique." |
| Blinding of outcome assessment (detection bias) | Low risk | We assume due to double‐blind design |
| Incomplete outcome data (attrition bias) | Low risk | Loss to follow‐up sufficiently described |
| Selective reporting (reporting bias) | Low risk | All predefined primary and secondary outcomes are clearly described in trial protocol and assessed |
| Academic bias | High risk | Published Hermann 1991 previous to this trial |
| Sponsor bias | High risk | Received funding from pharmaceutical industry |
| Trials according to risk of bias | Low risk | Adequate sequence generation, allocation concealment and blinding |
| Methods | PARALLEL RANDOMISED CONTROLLED CLINICAL TRIAL DOUBLE‐BLIND/OPEN‐LABEL: open‐label INTERVENTIONS USED IN TRIALS: Sulphonylurea: glibenclamide Comparator: acarbose | |
| Participants | INCLUSION CRITERIA:
EXCLUSION CRITERIA:
DIAGNOSTIC CRITERIA: NR NUMBER OF PATIENTS WITH PREVIOUS CARDIOVASCULAR DISEASE: Sulphonylurea: NR Comparator: NR NUMBER OF PATIENTS TREATED WITH ASPIRIN/ANTIHYPERTENSIVES/LIPID‐LOWERING: Sulphonylurea: NR Comparator: NR | |
| Interventions | NUMBER OF STUDY CENTRES: 5 COUNTRY/LOCATION: Germany SETTING: outpatients TREATMENT BEFORE STUDY: diet TITRATION PERIOD: 4 weeks GLYCAEMIC TARGET: NR | |
| Outcomes | OUTCOME(S) (as stated in the protocol/registered trial documents): HbA1c, fasting blood glucose, postprandial blood glucose, renal glucose excretion, subjective compatibility | |
| Study details | RUN‐IN PERIOD: NR, probably none DURATION OF INTERVENTION: 24 weeks DURATION OF FOLLOW‐UP: 24 weeks STUDY TERMINATED BEFORE REGULAR END: no | |
| Publication details | LANGUAGE OF PUBLICATION: German COMMERCIAL FUNDING/NON‐COMMERCIAL FUNDING: NR PUBLICATION STATUS: peer‐reviewed journal | |
| Stated aim of study | Quote: "Comparison of acarbose and glibenclamide on efficacy and adverse effects in patients with type II diabetes" [from English abstract] | |
| Notes | ||
| Risk of bias | ||
| Bias | Authors' judgement | Support for judgement |
| Random sequence generation (selection bias) | Unclear risk | Quote: "Open, randomized study in over 24 weeks in five private practices." [from English abstract] |
| Allocation concealment (selection bias) | Unclear risk | NR |
| Blinding of participants and personnel (performance bias) | High risk | Open‐label |
| Blinding of outcome assessment (detection bias) | High risk | We assume not blinded |
| Incomplete outcome data (attrition bias) | Unclear risk | Not clearly described |
| Selective reporting (reporting bias) | Unclear risk | No trial protocol or design article available |
| Academic bias | Low risk | Primary author's first publication on the interventions |
| Sponsor bias | Unclear risk | Funding not reported |
| Trials according to risk of bias | Unclear risk | Unclear sequence generation and allocation concealment, inadequate blinding |
| Methods | PARALLEL RANDOMISED CONTROLLED CLINICAL TRIAL DOUBLE‐BLIND/OPEN‐LABEL: double‐blind regarding acarbose/placebo and single‐blinded regarding glibenclamide INTERVENTIONS USED IN TRIALS: Sulphonylurea: glibenclamide Control 1: placebo Control 2: acarbose | |
| Participants | INCLUSION CRITERIA:
EXCLUSION CRITERIA:
DIAGNOSTIC CRITERIA: NR NUMBER OF PATIENTS WITH PREVIOUS CARDIOVASCULAR DISEASE: Sulphonylurea: NR Control 1: NR Control 2: NR NUMBER OF PATIENTS TREATED WITH ASPIRIN/ANTIHYPERTENSIVES/LIPID‐LOWERING: Sulphonylurea: NR Control 1: NR Control 2: NR | |
| Interventions | NUMBER OF STUDY CENTRES: 4 COUNTRY/LOCATION: Germany SETTING: outpatients TREATMENT BEFORE STUDY: diet TITRATION PERIOD: the drugs were titrated during the trial GLYCAEMIC TARGET: NR | |
| Outcomes | OUTCOME(S) (as stated in the protocol/registered trial documents): postprandial insulin increase, HbA1c, blood glucose, insulin and urinary glucose | |
| Study details | RUN‐IN PERIOD: none DURATION OF INTERVENTION: 24 weeks DURATION OF FOLLOW‐UP: 24 weeks STUDY TERMINATED BEFORE REGULAR END: no | |
| Publication details | LANGUAGE OF PUBLICATION: English COMMERCIAL FUNDING PUBLICATION STATUS: peer‐reviewed journal | |
| Stated aim of study | Quote: "To compare the different therapeutic principles of a α‐glucosidase inhibitors and sulphonylureas as first line treatment in non‐insulin‐dependent diabetes mellitus (NIDDM) patients with primary dietary failure." | |
| Notes | ||
| Risk of bias | ||
| Bias | Authors' judgement | Support for judgement |
| Random sequence generation (selection bias) | Low risk | Quote: "The random list was generated by electronic data processing for 16 balanced blocks of six patients." |
| Allocation concealment (selection bias) | Unclear risk | NR |
| Blinding of participants and personnel (performance bias) | High risk | Quote: "…double‐blind with respect to acarbose/placebo treatment and single‐blind with respect to the glibenclamide treatment." The glibenclamide intervention was made single‐blind so the investigators could adjust it to metabolic necessities and to avoid hypoglycaemia |
| Blinding of outcome assessment (detection bias) | High risk | NR |
| Incomplete outcome data (attrition bias) | Low risk | All loss to follow‐up reported |
| Selective reporting (reporting bias) | Unclear risk | No trial protocol or design article available |
| Academic bias | High risk | Published similar trials previously (Hoffmann 1990) |
| Sponsor bias | High risk | Received funding from pharmaceutical industry |
| Trials according to risk of bias | Unclear risk | Adequate sequence generation, unclear allocation concealment, inadequate blinding |
| Methods | PARALLEL RANDOMISED CONTROLLED CLINICAL TRIAL DOUBLE‐BLIND/OPEN‐LABEL: open‐label INTERVENTIONS USED IN TRIALS: Sulphonylurea: glibenclamide Control: insulin | |
| Participants | INCLUSION CRITERIA: not specified, but all had T2DM EXCLUSION CRITERIA: NR DIAGNOSTIC CRITERIA: NR NUMBER OF PATIENTS WITH PREVIOUS CARDIOVASCULAR DISEASE: Sulphonylurea: NR Comparator: NR NUMBER OF PATIENTS TREATED WITH ASPIRIN/ANTIHYPERTENSIVES/LIPID‐LOWERING: Sulphonylurea: NR Comparator: NR | |
| Interventions | NUMBER OF STUDY CENTRES: NR COUNTRY/LOCATION: NR SETTING: NR TREATMENT BEFORE STUDY: NR TITRATION PERIOD: NR GLYCAEMIC TARGET: NR | |
| Outcomes | OUTCOME(S) (as stated in the protocol/registered trial documents): HbA1c, FBG, stimulated C‐peptide | |
| Study details | RUN‐IN PERIOD: 8 weeks DURATION OF INTERVENTION: 44 weeks DURATION OF FOLLOW‐UP: 44 weeks STUDY TERMINATED BEFORE REGULAR END: NR | |
| Publication details | LANGUAGE OF PUBLICATION: English COMMERCIAL FUNDING/NON‐COMMERCIAL FUNDING: NR PUBLICATION STATUS: published as abstract from conference proceeding | |
| Stated aim of study | Not clearly stated, but the title says, Quote: "A randomized clinical trial of glyburide versus insulin using staged diabetes management to achieve euglycemia in NIDDM" | |
| Notes | ||
| Risk of bias | ||
| Bias | Authors' judgement | Support for judgement |
| Random sequence generation (selection bias) | Unclear risk | Quote: "A randomized clinical trial of..." |
| Allocation concealment (selection bias) | Unclear risk | NR |
| Blinding of participants and personnel (performance bias) | High risk | Open‐label |
| Blinding of outcome assessment (detection bias) | High risk | We assume not blinded |
| Incomplete outcome data (attrition bias) | Unclear risk | NR |
| Selective reporting (reporting bias) | Unclear risk | No trial protocol or design article available |
| Academic bias | Low risk | Primary author's first publication on the interventions |
| Sponsor bias | Unclear risk | Funding not reported |
| Trials according to risk of bias | Unclear risk | Unclear sequence generation and allocation concealment, inadequate blinding |
| Methods | PARALLEL RANDOMISED CONTROLLED CLINICAL TRIAL DOUBLE‐BLIND/OPEN‐LABEL: double‐blind INTERVENTIONS USED IN TRIALS: Sulphonylurea: glibenclamide Control: pioglitazone | |
| Participants | INCLUSION CRITERIA:
EXCLUSION CRITERIA:
DIAGNOSTIC CRITERIA: NR NUMBER OF PATIENTS WITH PREVIOUS CARDIOVASCULAR DISEASE: Sulphonylurea: NR Control: NR NUMBER OF PATIENTS TREATED WITH ASPIRIN/ANTIHYPERTENSIVES/LIPID‐LOWERING: Sulphonylurea: NR Control: NR | |
| Interventions | NUMBER OF STUDY CENTRES: 65 COUNTRY/LOCATION: USA and Puerto Rico SETTING: outpatients TREATMENT BEFORE STUDY: diet and exercise. Other antidiabetics than the one mentioned in the exclusion criteria TITRATION PERIOD: 16 weeks GLYCAEMIC TARGET: FPG between 69 and 141 mg/dl | |
| Outcomes | OUTCOME(S) (as stated in the protocol/registered trial documents): HbA1c, adverse events and biochemical variables | |
| Study details | RUN‐IN PERIOD: none DURATION OF INTERVENTION: 56 weeks DURATION OF FOLLOW‐UP: 56 weeks STUDY TERMINATED BEFORE REGULAR END: no | |
| Publication details | LANGUAGE OF PUBLICATION: English COMMERCIAL FUNDING PUBLICATION STATUS: peer‐reviewed journal | |
| Stated aim of study | Quote: "To evaluate the long‐term safety and efficacy of glyburide versus pioglitazone in patients with a recent diagnosis of type 2 diabetes mellitus." | |
| Notes | ||
| Risk of bias | ||
| Bias | Authors' judgement | Support for judgement |
| Random sequence generation (selection bias) | Unclear risk | Quote: "…, patients were enrolled and randomly assigned 1:1 by means of…" |
| Allocation concealment (selection bias) | Unclear risk | NR |
| Blinding of participants and personnel (performance bias) | Unclear risk | Quote: "....multicenter, double‐blind trial...." Method of blinding not described |
| Blinding of outcome assessment (detection bias) | Unclear risk | NR |
| Incomplete outcome data (attrition bias) | Low risk | All loss to follow‐up reported |
| Selective reporting (reporting bias) | Unclear risk | No trial protocol or design article available |
| Academic bias | Low risk | Primary author's first publication on the interventions |
| Sponsor bias | High risk | Received funding from pharmaceutical industry |
| Trials according to risk of bias | Unclear risk | Unclear sequence generation, allocation concealment and blinding |
| Methods | PARALLEL RANDOMISED CONTROLLED CLINICAL TRIAL DOUBLE‐BLIND/OPEN‐LABEL: blinding not described, but we assume open‐label INTERVENTIONS USED IN TRIALS: Sulphonylurea: glibenclamide Control: repaglinide | |
| Participants | INCLUSION CRITERIA:
EXCLUSION CRITERIA:
DIAGNOSTIC CRITERIA: NR NUMBER OF PATIENTS WITH PREVIOUS CARDIOVASCULAR DISEASE: Sulphonylurea: NR Control: NR NUMBER OF PATIENTS TREATED WITH ASPIRIN/ANTIHYPERTENSIVES/LIPID‐LOWERING: Sulphonylurea: 0 Control: 0 | |
| Interventions | NUMBER OF STUDY CENTRES: 1 COUNTRY/LOCATION: Pakistan SETTING: outpatients TREATMENT BEFORE STUDY: diet and exercise TITRATION PERIOD: titrated during trial GLYCAEMIC TARGET: FBG < 130 mg/dl and postprandial blood glucose < 175 mg/dl | |
| Outcomes | OUTCOME(S) (as stated in the protocol/registered trial documents): fasting blood glucose , 2 hour postprandial glucose, HbA1c, weight, adverse events, biochemical variables | |
| Study details | RUN‐IN PERIOD: none DURATION OF INTERVENTION: 12 months DURATION OF FOLLOW‐UP: 12 months STUDY TERMINATED BEFORE REGULAR END: no | |
| Publication details | LANGUAGE OF PUBLICATION: English COMMERCIAL FUNDING/NON‐COMMERCIAL FUNDING: NR PUBLICATION STATUS: peer‐reviewed journal | |
| Stated aim of study | Quote: "To evaluate the safety and efficacy (glycaemic control) provided by repaglinide compared with glibenclamide in newly diagnosed type 2 (non‐insulin dependant) diabetic patients." | |
| Notes | Patients taking medication against cardiovascular disease are set to zero as none of the patients were taking long‐term medication | |
| Risk of bias | ||
| Bias | Authors' judgement | Support for judgement |
| Random sequence generation (selection bias) | Unclear risk | Quote: "Fifty patients were randomly selected for each group." |
| Allocation concealment (selection bias) | Unclear risk | NR |
| Blinding of participants and personnel (performance bias) | High risk | Blinding not described, but we assume open‐label |
| Blinding of outcome assessment (detection bias) | High risk | Not described, but we assume not blinded |
| Incomplete outcome data (attrition bias) | Unclear risk | Loss to follow‐up not described |
| Selective reporting (reporting bias) | Unclear risk | No design article or study protocol available |
| Academic bias | Low risk | Primary author's first publication on the interventions |
| Sponsor bias | Unclear risk | Funding not reported |
| Trials according to risk of bias | Unclear risk | Unclear sequence generation and allocation concealment, inadequate blinding |
| Methods | PARALLEL RANDOMISED CONTROLLED CLINICAL TRIAL DOUBLE‐BLIND/OPEN‐LABEL: double‐blind INTERVENTIONS USED IN TRIALS: Sulphonylurea: glibenclamide Control 1: placebo Control 2: miglitol 25 mg Control 3: miglitol 50 mg | |
| Participants | INCLUSION CRITERIA:
EXCLUSION CRITERIA: Serious illness that would prevent satisfactory completing of the study DIAGNOSTIC CRITERIA: NR NUMBER OF PATIENTS WITH PREVIOUS CARDIOVASCULAR DISEASE: Sulphonylurea: NR Control 1: NR Control 2: NR Control 3: NR NUMBER OF PATIENTS TREATED WITH ASPIRIN/ANTIHYPERTENSIVES/LIPID‐LOWERING: Sulphonylurea: Control 1: NR Control 2: NR Control 3: NR | |
| Interventions | NUMBER OF STUDY CENTRES: 30 COUNTRY/LOCATION: USA SETTING: outpatients TREATMENT BEFORE STUDY: diet TITRATION PERIOD: titrated during trial until week 40 GLYCAEMIC TARGET: FPG < 140 mg/dl | |
| Outcomes | OUTCOME(S) (as stated in the protocol/registered trial documents): HbA1c, plasma glucose, serum insulin, lipid levels, albumin and glucose excursions | |
| Study details | RUN‐IN PERIOD: 6 weeks DURATION OF INTERVENTION: 56 weeks DURATION OF FOLLOW‐UP: 56 weeks STUDY TERMINATED BEFORE REGULAR END: yes | |
| Publication details | LANGUAGE OF PUBLICATION: English COMMERCIAL FUNDING PUBLICATION STATUS: peer‐reviewed journal | |
| Stated aim of study | Quote: "The objective of this study was to determine the safety, efficacy, and tolerability of the a‐glucosidase inhibitor miglitol vs. the sulfonylurea glyburide in the treatment of elderly patients with type 2 diabetes mellitus, inadequately controlled by diet alone." | |
| Notes | ||
| Risk of bias | ||
| Bias | Authors' judgement | Support for judgement |
| Random sequence generation (selection bias) | Unclear risk | Quote: "Four hundred eleven (411) diet‐treated patients age 60 yr or greater were randomized to receive…" |
| Allocation concealment (selection bias) | Unclear risk | NR |
| Blinding of participants and personnel (performance bias) | Low risk | Quote: "Glyburide dose titration was doubly blinded by encapsulation of active tablets or inactive excipients, and by an automated, interactive (between investigators and sponsor) dispensing system that permitted upwards and downwards dose titration without the glyburide dose appearing on tablets or packaging." |
| Blinding of outcome assessment (detection bias) | Low risk | We assume the outcomes assessors were blinded |
| Incomplete outcome data (attrition bias) | Unclear risk | Loss to follow‐up not adequately described |
| Selective reporting (reporting bias) | Unclear risk | Primary and secondary outcomes not stated in published protocol or design article |
| Academic bias | Low risk | Primary author's first publication on the interventions |
| Sponsor bias | High risk | Received funding from pharmaceutical company |
| Trials according to risk of bias | Unclear risk | Unclear sequence generation and allocation concealment, adequate blinding |
| Methods | PARALLEL RANDOMISED CONTROLLED CLINICAL TRIAL DOUBLE‐BLIND/OPEN‐LABEL: double‐blind in the first trial period (24 weeks), thereafter open‐label (28 weeks) INTERVENTIONS USED IN TRIALS: Sulphonylurea: glibenclamide Control: liraglutide | |
| Participants | INCLUSION CRITERIA:
EXCLUSION CRITERIA:
DIAGNOSTIC CRITERIA: the diagnosis of T2DM was done clinically by each investigator NUMBER OF PATIENTS WITH PREVIOUS CARDIOVASCULAR DISEASE: Sulphonylurea: 77 Control: 166 NUMBER OF PATIENTS TREATED WITH ASPIRIN/ANTIHYPERTENSIVES/LIPID‐LOWERING: Sulphonylurea: 5/47/36 Control: 13/101/94 | |
| Interventions | NUMBER OF STUDY CENTRES: 75 COUNTRY/LOCATION: Japan SETTING: outpatients TREATMENT BEFORE STUDY: diet with or without oral antidiabetic monotherapy TITRATION PERIOD: 2 weeks GLYCAEMIC TARGET: HbA1c < 6.9% | |
| Outcomes | OUTCOME(S) (as stated in the protocol/registered trial documents): HbA1c, FPG, postprandial glucose, body weight, waist circumference, lipids, biochemical variables, hypoglycaemia, adverse events | |
| Study details | RUN‐IN PERIOD: 4 to 6 weeks DURATION OF INTERVENTION: 52 weeks DURATION OF FOLLOW‐UP: 52 weeks STUDY TERMINATED BEFORE REGULAR END: no | |
| Publication details | LANGUAGE OF PUBLICATION: English COMMERCIAL FUNDING PUBLICATION STATUS: peer‐reviewed journal | |
| Stated aim of study | Quote: "We compared the safety and efficacy of liraglutide vs glibenclamide in patients with poorly controlled (HbA1c, 7.4–10.4%) type 2 diabetes." | |
| Notes | ||
| Risk of bias | ||
| Bias | Authors' judgement | Support for judgement |
| Random sequence generation (selection bias) | Low risk | Quote: "…, the subjects were randomly assigned at a 1:2 ratio to receive 1‐year treatment with glibenclamide 1.25–2.5 mg/day or liraglutide given as follows…" The patients were randomised according to a randomisation list. The list was generated by a person in Trans Cocmos, Inc (information through correspondence) |
| Allocation concealment (selection bias) | Unclear risk | NR |
| Blinding of participants and personnel (performance bias) | Unclear risk | The trial consisted of 2 periods; a double‐blind period with adequate blinding of participants and investigators. Quote: "The trial utilised a double‐dummy method whereby placebo liraglutide injections and placebo glibenclamide tablets were administered alongside active therapy." The second trial period was open‐label |
| Blinding of outcome assessment (detection bias) | High risk | The outcomes assessors were not blinded. However, the data review and decision on handling data were performed before the data from the liraglutide antibodies were available (information from correspondence) |
| Incomplete outcome data (attrition bias) | Low risk | Loss to follow‐up sufficiently described |
| Selective reporting (reporting bias) | Low risk | Primary and secondary outcomes clearly defined in protocol published at www.clinicaltrials.gov, and they are all assessed |
| Academic bias | Low risk | Primary author's first publication on the interventions |
| Sponsor bias | High risk | Received funding from pharmaceutical company |
| Trials according to risk of bias | Unclear risk | Adequate sequence generation, unclear allocation concealment and blinding |
| Methods | PARALLEL RANDOMISED CONTROLLED CLINICAL TRIAL DOUBLE‐BLIND/OPEN‐LABEL: we assume double‐blind, as a placebo group is included INTERVENTIONS USED IN TRIALS: Sulphonylurea 1: gliclazide Sulphonylurea 2: glibenclamide Control 1: acarbose Control 2: metformin Control 3: placebo | |
| Participants | INCLUSION CRITERIA:
EXCLUSION CRITERIA: NR DIAGNOSTIC CRITERIA: NR NUMBER OF PATIENTS WITH PREVIOUS CARDIOVASCULAR DISEASE: Sulphonylurea 1: NR Sulphonylurea 2: NR Control 1: NR Control 2: NR Control 3: NR NUMBER OF PATIENTS TREATED WITH ASPIRIN/ANTIHYPERTENSIVES/LIPID‐LOWERING: Sulphonylurea 1: NR Sulphonylurea 2: NR Control 1: NR Control 2: NR Control 3: NR | |
| Interventions | NUMBER OF STUDY CENTRES: NR COUNTRY/LOCATION: Turkey SETTING: NR TREATMENT BEFORE STUDY: diet TITRATION PERIOD: NR GLYCAEMIC TARGET: NR | |
| Outcomes | OUTCOME(S) (as stated in the protocol/registered trial documents): FPG, HbA1c, postprandial serum insulin level, fasting serum‐insulin levels and C‐peptide | |
| Study details | RUN‐IN PERIOD: NR DURATION OF INTERVENTION: 24 weeks DURATION OF FOLLOW‐UP: 24 weeks STUDY TERMINATED BEFORE REGULAR END: NR | |
| Publication details | LANGUAGE OF PUBLICATION: English COMMERCIAL FUNDING/NON‐COMMERCIAL FUNDING: NR PUBLICATION STATUS: abstract in peer‐reviewed journal | |
| Stated aim of study | Quote: "This study was planned to compare the different oral antidiabetic agents in NIDDM patients with dietary failure." | |
| Notes | ||
| Risk of bias | ||
| Bias | Authors' judgement | Support for judgement |
| Random sequence generation (selection bias) | Unclear risk | Quote: "43 NIDDM patients (35‐65 years of age, BMI< 35 kg/m2, HbA1c 7‐9%, duration of diabetes > 6 months) were randomized into five groups and treated for 24 weeks..." |
| Allocation concealment (selection bias) | Unclear risk | NR |
| Blinding of participants and personnel (performance bias) | Unclear risk | NR, but we assume double‐blinded because of placebo group |
| Blinding of outcome assessment (detection bias) | Unclear risk | NR |
| Incomplete outcome data (attrition bias) | Unclear risk | NR |
| Selective reporting (reporting bias) | Unclear risk | No design article or protocol available |
| Academic bias | Low risk | Primary author's first publication on the interventions |
| Sponsor bias | Unclear risk | Funding not reported |
| Trials according to risk of bias | Unclear risk | Unclear sequence generation, allocation concealment and blinding |
| Methods | PARALLEL RANDOMISED CONTROLLED CLINICAL TRIAL DOUBLE‐BLIND/OPEN‐LABEL: open‐label INTERVENTIONS USED IN TRIALS: Sulphonylurea: gliclazide Control: acarbose | |
| Participants | INCLUSION CRITERIA:
EXCLUSION CRITERIA: NR DIAGNOSTIC CRITERIA: NR NUMBER OF PATIENTS WITH PREVIOUS CARDIOVASCULAR DISEASE: Sulphonylurea: NR Control: NR NUMBER OF PATIENTS TREATED WITH ASPIRIN/ANTIHYPERTENSIVES/LIPID‐LOWERING: Sulphonylurea: NR Control: NR | |
| Interventions | NUMBER OF STUDY CENTRES: 1 COUNTRY/LOCATION: Japan SETTING: NR TREATMENT BEFORE STUDY: NR TITRATION PERIOD: NR GLYCAEMIC TARGET: NR | |
| Outcomes | OUTCOME(S) (as stated in the protocol/registered trial documents): waist size, visceral and subcutaneous fat | |
| Study details | RUN‐IN PERIOD: NR DURATION OF INTERVENTION: 12 months DURATION OF FOLLOW‐UP: 12 months STUDY TERMINATED BEFORE REGULAR END: NR | |
| Publication details | LANGUAGE OF PUBLICATION: Japanese COMMERCIAL FUNDING: no PUBLICATION STATUS: peer‐reviewed journal | |
| Stated aim of study | Quote: "To compare effects of sulphonylurea and alpha‐glucosidase inhibitor (acarbose) on glucose and lipid metabolism in DM patients." | |
| Notes | Evaluated by Japanese extractor | |
| Risk of bias | ||
| Bias | Authors' judgement | Support for judgement |
| Random sequence generation (selection bias) | Unclear risk | "...randomised.." Method not described |
| Allocation concealment (selection bias) | Low risk | Envelope used |
| Blinding of participants and personnel (performance bias) | High risk | Open‐label design |
| Blinding of outcome assessment (detection bias) | High risk | Assume not blinded |
| Incomplete outcome data (attrition bias) | High risk | Loss to follow‐up not addressed |
| Selective reporting (reporting bias) | Unclear risk | No design article or protocol available |
| Academic bias | Low risk | Primary author's first publication on the interventions |
| Sponsor bias | Low risk | No funding from pharmaceutical industry |
| Trials according to risk of bias | Unclear risk | Unclear sequence generation, adequate allocation concealment and inadequate blinding |
| Methods | PARALLEL RANDOMISED CONTROLLED CLINICAL TRIAL DOUBLE‐BLIND/OPEN‐LABEL: single‐blind regarding acarbose versus glibenclamide, double‐blind regarding acarbose versus placebo INTERVENTIONS USED IN TRIALS: Sulphonylurea: glibenclamide Control 1: acarbose Control 2: placebo | |
| Participants | INCLUSION CRITERIA:
EXCLUSION CRITERIA:
DIAGNOSTIC CRITERIA: NR NUMBER OF PATIENTS WITH PREVIOUS CARDIOVASCULAR DISEASE: Sulphonylurea: NR Control 1: NR Control 2: NR NUMBER OF PATIENTS TREATED WITH ASPIRIN/ANTIHYPERTENSIVES/LIPID‐LOWERING: Sulphonylurea: NR Control 1: NR Control 2: NR | |
| Interventions | NUMBER OF STUDY CENTRES: NR COUNTRY/LOCATION: Croatia SETTING: outpatients TREATMENT BEFORE STUDY: diet TITRATION PERIOD: titrated during trial GLYCAEMIC TARGET: NR | |
| Outcomes | OUTCOME(S) (as stated in the protocol/registered trial documents): HbA1c, relative postprandial serum insulin increase, blood glucose (fasting, 1‐hour postprandial), fasting serum insulin, 1‐hour postprandial serum insulin, urine glucose, biochemical parameters | |
| Study details | RUN‐IN PERIOD: NR DURATION OF INTERVENTION: 24 weeks DURATION OF FOLLOW‐UP: 24 weeks STUDY TERMINATED BEFORE REGULAR END: no | |
| Publication details | LANGUAGE OF PUBLICATION: English COMMERCIAL FUNDING/NON‐COMMERCIAL FUNDING: NR PUBLICATION STATUS: peer‐reviewed journal | |
| Stated aim of study | Quote: "The study was designed as a multicentric, randomized group comparison between acarbose and placebo as a double‐blind, and between acarbose and glibenclamide as single‐blind trial." | |
| Notes | ||
| Risk of bias | ||
| Bias | Authors' judgement | Support for judgement |
| Random sequence generation (selection bias) | Unclear risk | Quote: "On entering the study, the patients were consecutively allocated a number and divided into groups." |
| Allocation concealment (selection bias) | Unclear risk | NR |
| Blinding of participants and personnel (performance bias) | High risk | Quote: "…between acarbose and placebo as a double‐blind, and between acarbose and glibenclamide as single‐blind trial." However, the prescription of tablets are different in the acarbose group (tablets given 3 times a day) compared to the placebo group (tablets given 2 times a day) |
| Blinding of outcome assessment (detection bias) | Unclear risk | NR |
| Incomplete outcome data (attrition bias) | Unclear risk | Loss to follow‐up adequately described |
| Selective reporting (reporting bias) | Unclear risk | No design article or study protocol available |
| Academic bias | Low risk | Primary author's first publication on the interventions |
| Sponsor bias | Unclear risk | Funding not reported |
| Trials according to risk of bias | Unclear risk | Unclear sequence generation and allocation concealment, inadequate blinding of participants and investigators, unclear blinding of outcome assessors |
| Methods | PARALLEL RANDOMISED CONTROLLED CLINICAL TRIAL DOUBLE‐BLIND/OPEN‐LABEL: open‐label INTERVENTIONS USED IN TRIALS: Sulphonylurea: gliclazide Control 1: metformin Control 2: pioglitazone | |
| Participants | INCLUSION CRITERIA:
EXCLUSION CRITERIA:
DIAGNOSTIC CRITERIA: NR NUMBER OF PATIENTS WITH PREVIOUS CARDIOVASCULAR DISEASE: Sulphonylurea: NR Control 1: NR Control 2: NR NUMBER OF PATIENTS TREATED WITH ASPIRIN/ANTIHYPERTENSIVES/LIPID‐LOWERING: Sulphonylurea: NR Control 1: NR Control 2: NR | |
| Interventions | NUMBER OF STUDY CENTRES: NR COUNTRY/LOCATION: United Kingdom SETTING: outpatients TREATMENT BEFORE STUDY: diet or low‐dose oral hypoglycaemic drugs TITRATION PERIOD: 3 months GLYCAEMIC TARGET: FBG < 7 mmol/L | |
| Outcomes | OUTCOME(S) (as stated in the protocol/registered trial documents): lipids and biochemical variables | |
| Study details | RUN‐IN PERIOD: 3 months DURATION OF INTERVENTION: 24 weeks DURATION OF FOLLOW‐UP: 24 weeks STUDY TERMINATED BEFORE REGULAR END: no | |
| Publication details | LANGUAGE OF PUBLICATION: English COMMERCIAL FUNDING PUBLICATION STATUS: peer‐reviewed journal | |
| Stated aim of study | Quote: "To compare effects of different oral hypoglycemic drugs as first‐line therapy on lipoprotein subfractions in type 2 diabetes." | |
| Notes | ||
| Risk of bias | ||
| Bias | Authors' judgement | Support for judgement |
| Random sequence generation (selection bias) | Unclear risk | Quote: "...patients were randomly assigned.." |
| Allocation concealment (selection bias) | Unclear risk | NR |
| Blinding of participants and personnel (performance bias) | High risk | Open‐label design |
| Blinding of outcome assessment (detection bias) | Low risk | Quote: "Individual three‐digit patient identification numbers ensured that the laboratory staff was blinded to treatment allocation." |
| Incomplete outcome data (attrition bias) | Low risk | All drop‐outs sufficiently described |
| Selective reporting (reporting bias) | Unclear risk | No study protocol or design article available |
| Academic bias | Low risk | Primary author's first publication on the interventions |
| Sponsor bias | High risk | Received funding from pharmaceutical company |
| Trials according to risk of bias | Unclear risk | Unclear sequence generation and allocation concealment, inadequate blinding of participants and investigators, adequate blinding of outcome assessors |
| Methods | PARALLEL RANDOMISED CONTROLLED CLINICAL TRIAL DOUBLE‐BLIND/OPEN‐LABEL: double‐blind in the first year, thereafter open‐label extension INTERVENTIONS USED IN TRIALS: Sulphonylurea: glimepiride Control 1: liraglutide 1.2 mg Control 2: liraglutide 1.8 mg | |
| Participants | INCLUSION CRITERIA:
EXCLUSION CRITERIA:
DIAGNOSTIC CRITERIA: NR NUMBER OF PATIENTS WITH PREVIOUS CARDIOVASCULAR DISEASE: Sulphonylurea: NR Control 1: NR Control 2: NR NUMBER OF PATIENTS TREATED WITH ASPIRIN/ANTIHYPERTENSIVES/LIPID‐LOWERING: Sulphonylurea: NR Control 1: NR Control 2: NR | |
| Interventions | NUMBER OF STUDY CENTRES: 138 COUNTRY/LOCATION: USA and Mexico SETTING: outpatients TREATMENT BEFORE STUDY: diet or half the highest dose of oral monotherapy for at least 2 months TITRATION PERIOD: 2 to 3 weeks GLYCAEMIC TARGET: HbA1c < 7% | |
| Outcomes | OUTCOME(S) (as stated in the protocol/registered trial documents): HbA1c, body weight, FPG, self measured 8‐point plasma‐glucose profiles (measured before each meal, 90 min after the start of each meal, at bedtime and at 0300 h), blood pressure, ß‐cell function (proinsulin to insulin ratio and 2 models of B‐cell function: homoeostasis model assessment ‐B and homoeostasis model assessment‐insulin resistance), fasting glucagon and patients’ reported assessment of quality of life | |
| Study details | RUN‐IN PERIOD: none DURATION OF INTERVENTION: 195 weeks DURATION OF FOLLOW‐UP: 195 weeks STUDY TERMINATED BEFORE REGULAR END: yes. The duration of the treatment period was planned to be 260 weeks (5 years). Quote: "The trial was terminated at week 195 due to an insufficient number of subjects remaining to obtain reasonable statistical power.” | |
| Publication details | LANGUAGE OF PUBLICATION: English COMMERCIAL FUNDING PUBLICATION STATUS: peer‐reviewed journal | |
| Stated aim of study | Quote: "We aimed to investigate the safety and efficacy of liraglutide as monotherapy for this disorder." | |
| Notes | ||
| Risk of bias | ||
| Bias | Authors' judgement | Support for judgement |
| Random sequence generation (selection bias) | Low risk | Quote: "Randomisation was done with telephone‐based or web‐based systems. Participants were randomly assigned to the lowest available number." |
| Allocation concealment (selection bias) | Low risk | Quote: "Randomisation was done with telephone‐based or web‐based systems. Participants were randomly assigned to the lowest available number." |
| Blinding of participants and personnel (performance bias) | Unclear risk | The first year of the trial had adequate blinding of participants and personnel. Blinding of participants and personnel was not possible in the open‐label extension |
| Blinding of outcome assessment (detection bias) | High risk | Outcomes are assessed in the open‐label extension period and we therefore assume that the outcome assessors were not blinded |
| Incomplete outcome data (attrition bias) | Unclear risk | Some patients were lost to follow‐up, when the trial went from double‐blind to open‐label extension and between the open‐label extensions without being clearly described. All loss to follow‐up adequately described during the intervention periods |
| Selective reporting (reporting bias) | Low risk | Primary and secondary outcomes predefined in the study protocol are assessed |
| Academic bias | Low risk | Primary author's first publication on the interventions |
| Sponsor bias | High risk | Received funding from pharmaceutical industry |
| Trials according to risk of bias | Unclear risk | Adequate sequence generation and allocation concealment, unclear blinding of participants and investigators, inadequate blinding of outcome assessors |
| Methods | PARALLEL RANDOMISED CONTROLLED CLINICAL TRIAL DOUBLE‐BLIND/OPEN‐LABEL: double‐blind INTERVENTIONS USED IN TRIALS: Sulphonylurea: glipizide Control: repaglinide | |
| Participants | INCLUSION CRITERIA:
EXCLUSION CRITERIA:
DIAGNOSTIC CRITERIA: NR NUMBER OF PATIENTS WITH PREVIOUS CARDIOVASCULAR DISEASE: Sulphonylurea: NR Control: NR NUMBER OF PATIENTS TREATED WITH ASPIRIN/ANTIHYPERTENSIVES/LIPID‐LOWERING: Sulphonylurea: NR Control: NR | |
| Interventions | NUMBER OF STUDY CENTRES: 23 COUNTRY/LOCATION: Denmark, Sweden, Norway and Finland SETTING: outpatients TREATMENT BEFORE STUDY: diet or oral antidiabetic drugs TITRATION PERIOD: 6 weeks | |
| Outcomes | OUTCOME(S) (as stated in the protocol/registered trial documents): HbA1c, FBG, fasting C‐peptide, insulin, triglycerides, total cholesterol, HDL‐cholesterol, safety endpoints | |
| Study details | RUN‐IN PERIOD: 1 week DURATION OF INTERVENTION: 12 months + 6 to 8 weeks DURATION OF FOLLOW‐UP: 12 months + 6 to 8 weeks STUDY TERMINATED BEFORE REGULAR END: no | |
| Publication details | LANGUAGE OF PUBLICATION: English COMMERCIAL FUNDING PUBLICATION STATUS: peer‐reviewed journal | |
| Stated aim of study | Quote: "To evaluate the long‐term effectiveness and safety of repaglinide, a novel prandial glucose regulator, in comparison with glipizide in the treatment of patients with Type 2 diabetes." | |
| Notes | ||
| Risk of bias | ||
| Bias | Authors' judgement | Support for judgement |
| Random sequence generation (selection bias) | Unclear risk | Quote: "Patients were randomized to treatment with repaglinide or glipizide at a 2:1 ratio (in order to test rigorously the safety of the relatively new agent repaglinide)” OR "One week later the patients were randomized to either repaglinide or glipizide following cessation of any previous antidiabetic medication." |
| Allocation concealment (selection bias) | Unclear risk | NR |
| Blinding of participants and personnel (performance bias) | Low risk | Quote: "Placebo tablets were used in the glipizide group for lunch and dinner." |
| Blinding of outcome assessment (detection bias) | Low risk | We assume the outcome assessors were blinded due to a double‐blind design |
| Incomplete outcome data (attrition bias) | Low risk | Adequate description of patients lost to follow‐up |
| Selective reporting (reporting bias) | Low risk | Primary and secondary outcomes assessed as predefined |
| Academic bias | Low risk | Primary author's first publication on the interventions |
| Sponsor bias | High risk | Received funding from pharmaceutical industry |
| Trials according to risk of bias | Unclear risk | Unclear sequence generation and allocation concealment, adequate blinding |
| Methods | PARALLEL RANDOMISED CONTROLLED CLINICAL TRIAL DOUBLE‐BLIND/OPEN‐LABEL: double‐blind INTERVENTIONS USED IN TRIALS: Sulphonylurea: glibenclamide Control: repaglinide | |
| Participants | INCLUSION CRITERIA:
EXCLUSION CRITERIA:
DIAGNOSTIC CRITERIA: WHO criteria NUMBER OF PATIENTS WITH PREVIOUS CARDIOVASCULAR DISEASE: Sulphonylurea: NR Control: NR NUMBER OF PATIENTS TREATED WITH ASPIRIN/ANTIHYPERTENSIVES/LIPID‐LOWERING: Sulphonylurea: 2 Control: 11 | |
| Interventions | NUMBER OF STUDY CENTRES: 21 COUNTRY/LOCATION: USA and Canada SETTING: outpatients TREATMENT BEFORE STUDY: diet or oral antidiabetic (other than repaglinide) TITRATION PERIOD: 8 weeks GLYCAEMIC TARGET: FPG 80 to 140 mg/dl, HbA1c ≤ 7.5% | |
| Outcomes | OUTCOME(S) (as stated in the protocol/registered trial documents): HbA1c, FPG, lipid metabolism, changes in body weight and safety profiles, including hypoglycaemic events | |
| Study details | RUN‐IN PERIOD: NR DURATION OF INTERVENTION: 12 months DURATION OF FOLLOW‐UP: 12 + 3 months STUDY TERMINATED BEFORE REGULAR END: no | |
| Publication details | LANGUAGE OF PUBLICATION: English COMMERCIAL FUNDING PUBLICATION STATUS: peer‐reviewed journal | |
| Stated aim of study | Quote: "This prospective, 1‐year, multicenter, double‐blind, randomized, parallel‐group study was designed to show that repaglinide was at least equivalent to glyburide in patients with type 2 diabetes." | |
| Notes | Number with previously cardiovascular disease is the number of participants with previously serious cardiac events | |
| Risk of bias | ||
| Bias | Authors' judgement | Support for judgement |
| Random sequence generation (selection bias) | Unclear risk | Quote: "Patients were randomized within each study center in a 2:1 ratio of repaglinide and glyburide and discontinued OHAs on the morning of the first post randomization visit." |
| Allocation concealment (selection bias) | Unclear risk | NR |
| Blinding of participants and personnel (performance bias) | Low risk | Quote: "Glyburide patients received a starting dose of 2.5 mg before breakfast and placebo before |
| Blinding of outcome assessment (detection bias) | Low risk | We assume the outcome assessors were blinded due to a double‐blind design |
| Incomplete outcome data (attrition bias) | Low risk | Loss to follow‐up sufficiently described |
| Selective reporting (reporting bias) | Low risk | Primary and secondary outcomes assessed as predefined |
| Academic bias | High risk | First author has published similar trials (Damsbo 1999) |
| Sponsor bias | High risk | Received funding from pharmaceutical industry |
| Trials according to risk of bias | Unclear risk | Unclear sequence generation and allocation concealment, adequate blinding |
| Methods | PARALLEL RANDOMISED CONTROLLED CLINICAL TRIAL DOUBLE‐BLIND/OPEN‐LABEL: open‐label INTERVENTIONS USED IN TRIALS: Sulphonylurea: gliclazide Control: nothing | |
| Participants | INCLUSION CRITERIA:
EXCLUSION CRITERIA:
DIAGNOSTIC CRITERIA: NR NUMBER OF PATIENTS WITH PREVIOUS CARDIOVASCULAR DISEASE: Sulphonylurea: NR Control: NR NUMBER OF PATIENTS TREATED WITH ASPIRIN/ANTIHYPERTENSIVES/LIPID‐LOWERING: Sulphonylurea: NR/0/0 Control: NR/0/0 | |
| Interventions | NUMBER OF STUDY CENTRES: NR COUNTRY/LOCATION: Turkey SETTING: outpatients TREATMENT BEFORE STUDY: NR TITRATION PERIOD: NR GLYCAEMIC TARGET: NR | |
| Outcomes | OUTCOME(S) (as stated in the protocol/registered trial documents): glycaemic control, markers of inflammation | |
| Study details | RUN‐IN PERIOD: NR DURATION OF INTERVENTION: 6 months DURATION OF FOLLOW‐UP: 6 months STUDY TERMINATED BEFORE REGULAR END: no | |
| Publication details | LANGUAGE OF PUBLICATION: English COMMERCIAL FUNDING/NON‐COMMERCIAL FUNDING: NR PUBLICATION STATUS: peer‐reviewed journal | |
| Stated aim of study | Quote: "In this study, we aimed to investigate whether gliclazide or diet treatment has an effect on serum levels of acute phase reactants, markers of inflammation." | |
| Notes | The group of healthy controls is not included in the analyses | |
| Risk of bias | ||
| Bias | Authors' judgement | Support for judgement |
| Random sequence generation (selection bias) | Unclear risk | Quote: "Twenty‐six patients were prospectively randomized to take gliclazide…" |
| Allocation concealment (selection bias) | Unclear risk | NR |
| Blinding of participants and personnel (performance bias) | High risk | Open‐label design |
| Blinding of outcome assessment (detection bias) | High risk | We assume not blinded |
| Incomplete outcome data (attrition bias) | Unclear risk | Number lost to follow‐up not reported |
| Selective reporting (reporting bias) | Unclear risk | No design article or study protocol |
| Academic bias | Low risk | Primary author's first publication on the interventions |
| Sponsor bias | Unclear risk | NR |
| Trials according to risk of bias | Unclear risk | Unclear sequence generation and allocation concealment, inadequate blinding |
| Methods | PARALLEL RANDOMISED CONTROLLED CLINICAL TRIAL DOUBLE‐BLIND/OPEN‐LABEL: NR, we assume open‐label INTERVENTIONS USED IN TRIALS: Sulphonylurea: glibenclamide Comparator 1: pioglitazone Comparator 2: voglibose | |
| Participants | INCLUSION CRITERIA:
EXCLUSION CRITERIA:
DIAGNOSTIC CRITERIA: WHO NUMBER OF PATIENTS WITH PREVIOUS CARDIOVASCULAR DISEASE: Sulphonylurea: NR Comparator: NR NUMBER OF PATIENTS TREATED WITH ASPIRIN/ANTIHYPERTENSIVES/LIPID‐LOWERING: Sulphonylurea: NR/0/NR Comparator: NR/0/NR | |
| Interventions | NUMBER OF STUDY CENTRES: 1 COUNTRY/LOCATION: Japan SETTING: outpatients TREATMENT BEFORE STUDY: diet TITRATION PERIOD: NR GLYCAEMIC TARGET: NR | |
| Outcomes | OUTCOME(S) (as stated in the protocol/registered trial documents): urinary albumin excretion, intima‐media thickness, pulse wave velocity, HbA1c | |
| Study details | RUN‐IN PERIOD: NR DURATION OF INTERVENTION: 12 months DURATION OF FOLLOW‐UP: 12 months STUDY TERMINATED BEFORE REGULAR END: no | |
| Publication details | LANGUAGE OF PUBLICATION: English COMMERCIAL FUNDING/NON‐COMMERCIAL FUNDING: NR PUBLICATION STATUS: peer‐reviewed journal | |
| Stated aim of study | Quote: "The aim of the present study was to compare the effects of pioglitazone (amelioration of insulin resistance), sulfonylurea (augmentation of insulin supply), and voglibose (limitation of postprandial hyperglycemia) on UAE, IMT, and PWV in normotensive diabetes patients with microalbuminuria." | |
| Notes | Group of healthy controls are not included in the analyses | |
| Risk of bias | ||
| Bias | Authors' judgement | Support for judgement |
| Random sequence generation (selection bias) | Unclear risk | Quote: "The patients were randomly assigned to 1 of 3 treatment groups by sealed envelop method: treatment with pioglitazone 30 mg/d (n = 15), treatment with glibenclamide 5 mg/d (n = 15), or treatment with voglibose 0.6 mg/d (n = 15)" |
| Allocation concealment (selection bias) | Low risk | Quote: "The patients were randomly assigned to 1 of 3 treatment groups by sealed envelop method: treatment with pioglitazone 30 mg/d (n = 15), treatment with glibenclamide 5 mg/d (n = 15), or treatment with voglibose 0.6 mg/d (n = 15)" |
| Blinding of participants and personnel (performance bias) | High risk | Blinding not reported, we assume open‐label |
| Blinding of outcome assessment (detection bias) | High risk | NR, we assume not blinded |
| Incomplete outcome data (attrition bias) | Low risk | Quote: "There were no dropouts throughout the study period" |
| Selective reporting (reporting bias) | Low risk | All outcomes reported |
| Academic bias | High risk | Nakamura 2000 |
| Sponsor bias | Unclear risk | NR |
| Trials according to risk of bias | Unclear risk | Unclear sequence generation, adequate allocation concealment, unclear blinding |
| Methods | PARALLEL RANDOMISED CONTROLLED CLINICAL TRIAL DOUBLE‐BLIND/OPEN‐LABEL: double‐blind INTERVENTIONS USED IN TRIALS: Sulphonylurea: glibenclamide Comparator 1: pioglitazone Comparator 2: voglibose Comparator 3: nateglinide | |
| Participants | INCLUSION CRITERIA:
EXCLUSION CRITERIA:
DIAGNOSTIC CRITERIA: NR NUMBER OF PATIENTS WITH PREVIOUS CARDIOVASCULAR DISEASE: Sulphonylurea: NR Comparator: NR NUMBER OF PATIENTS TREATED WITH ASPIRIN/ANTIHYPERTENSIVES/LIPID‐LOWERING: Sulphonylurea: 0/0/0 Comparator: 0/0/0 | |
| Interventions | NUMBER OF STUDY CENTRES: 1 COUNTRY/LOCATION: Japan SETTING: outpatients TREATMENT BEFORE STUDY: diet TITRATION PERIOD: 3 months GLYCAEMIC TARGET: NR | |
| Outcomes | OUTCOME(S) (as stated in the protocol/registered trial documents): glucose, HbA1c, creatinine, urea nitrogen, total cholesterol, high density lipoprotein cholesterol, triglyceride and urinary albumin excretion | |
| Study details | RUN‐IN PERIOD: 3 months DURATION OF INTERVENTION: 12 months DURATION OF FOLLOW‐UP: 12 months STUDY TERMINATED BEFORE REGULAR END: no | |
| Publication details | LANGUAGE OF PUBLICATION: English COMMERCIAL FUNDING: no NON‐COMMERCIAL FUNDING: Shinmatsudo Central General Hospital and Koto Hospital PUBLICATION STATUS: peer‐reviewed journal | |
| Stated aim of study | Quote: "The aim of the present study was to determine whether pioglitazone affects urinary L‐FABP levels in diabetic nephropathy patients with microalbuminuria." | |
| Notes | Group of healthy controls are not included in the analyses | |
| Risk of bias | ||
| Bias | Authors' judgement | Support for judgement |
| Random sequence generation (selection bias) | Low risk | Quote: "The diabetes patients with microalbuminuria were randomly assigned to one of four treatment groups by the sealed envelope method: treatment with pioglitazone 30 mg/d (n = 17), with glibenclamide 5 mg/d (n = 18), with voglibose 0.6 mg/d (n = 17), or with nateglinide 270 mg/d (n = 16)." The randomisation sequence was made by computer |
| Allocation concealment (selection bias) | Low risk | See above |
| Blinding of participants and personnel (performance bias) | Low risk | Participants and investigators were blinded. Information through correspondence |
| Blinding of outcome assessment (detection bias) | Low risk | Outcomes assessors were blinded. Information through correspondence |
| Incomplete outcome data (attrition bias) | Low risk | Quote: "..., and there were no dropouts." |
| Selective reporting (reporting bias) | High risk | Primary and secondary outcomes reported by author, but not described in publication |
| Academic bias | High risk | Nakamura 2000; Nakamura 2004 |
| Sponsor bias | Low risk | No commercial funding |
| Trials according to risk of bias | Low risk | Adequate sequence generation, allocation concealment and blinding |
| Methods | PARALLEL RANDOMISED CONTROLLED CLINICAL TRIAL DOUBLE‐BLIND/OPEN‐LABEL: double‐blind INTERVENTIONS USED IN TRIALS: Sulphonylurea: glibenclamide Control: insulin | |
| Participants | INCLUSION CRITERIA:
EXCLUSION CRITERIA:
DIAGNOSTIC CRITERIA: National Diabetes Data Group NUMBER OF PATIENTS WITH PREVIOUS CARDIOVASCULAR DISEASE: Sulphonylurea: NR Control: NR NUMBER OF PATIENTS TREATED WITH ASPIRIN/ANTIHYPERTENSIVES/LIPID‐LOWERING: Sulphonylurea: NR Control: NR | |
| Interventions | NUMBER OF STUDY CENTRES: 1 COUNTRY/LOCATION: USA SETTING: outpatients TREATMENT BEFORE STUDY: diet TITRATION PERIOD: titrated during trial GLYCAEMIC TARGET: FBG < 6.4 mmol/L without hypoglycaemia | |
| Outcomes | OUTCOME(S) (as stated in the protocol/registered trial documents): efficacy and complications, lipid status and weight | |
| Study details | RUN‐IN PERIOD: 1 month DURATION OF INTERVENTION: 9 months DURATION OF FOLLOW‐UP: 9 months STUDY TERMINATED BEFORE REGULAR END: no | |
| Publication details | LANGUAGE OF PUBLICATION: English COMMERCIAL FUNDING/NON‐COMMERCIAL FUNDING PUBLICATION STATUS: peer‐reviewed journal | |
| Stated aim of study | Quote: "To compare the relatively efficacy, risks, and benefits of insulin with glyburide in achieving normoglycaemia in non‐insulin‐dependent diabetes mellitus." | |
| Notes | ||
| Risk of bias | ||
| Bias | Authors' judgement | Support for judgement |
| Random sequence generation (selection bias) | Low risk | Quote: "……were randomly assigned to either glyburide or NPH insulin therapy using a computer‐generated list." |
| Allocation concealment (selection bias) | Low risk | Quote: "……were randomly assigned to either glyburide or NPH insulin therapy using a computer‐generated list." |
| Blinding of participants and personnel (performance bias) | Low risk | Quote: "Glyburide (5‐mg tablets) and identical placebo tablets were supplied by the manufacturer..." |
| Blinding of outcome assessment (detection bias) | Low risk | Quote: "The success of the double‐blind treatment strategy was tested by asking the research nurse and patient to guess.." We assume that the nurses were the outcome assessors |
| Incomplete outcome data (attrition bias) | Low risk | No participants were lost to follow‐up |
| Selective reporting (reporting bias) | Unclear risk | No design article or study protocol available |
| Academic bias | Low risk | Primary author's first publication on the interventions |
| Sponsor bias | High risk | Received funding from pharmaceutical company |
| Trials according to risk of bias | Low risk | Adequate sequence generation, allocation concealment and blinding |
| Methods | PARALLEL RANDOMISED CONTROLLED CLINICAL TRIAL DOUBLE‐BLIND/OPEN‐LABEL: double‐blind INTERVENTIONS USED IN TRIALS: Sulphonylurea: glibenclamide Control: miglitol | |
| Participants | INCLUSION CRITERIA:
EXCLUSION CRITERIA:
DIAGNOSTIC CRITERIA: National Diabetes Group Criteria NUMBER OF PATIENTS WITH PREVIOUS CARDIOVASCULAR DISEASE: Sulphonylurea: NR Control: NR NUMBER OF PATIENTS TREATED WITH ASPIRIN/ANTIHYPERTENSIVES/LIPID‐LOWERING: Sulphonylurea: NR Control: NR | |
| Interventions | NUMBER OF STUDY CENTRES: 4 COUNTRY/LOCATION: Italy SETTING: outpatients TREATMENT BEFORE STUDY: diet or biguanides (discontinued at least 2 months before inclusion in trial) TITRATION PERIOD: 6 weeks GLYCAEMIC TARGET: NR | |
| Outcomes | OUTCOME(S) (as stated in the protocol/registered trial documents): HbA1c, meal‐stimulated serum insulin and C‐peptide, FBG, postprandial glucose, total and HDL cholesterol, triglycerides, side effects and compliance | |
| Study details | RUN‐IN PERIOD: 7 weeks DURATION OF INTERVENTION: 6 months DURATION OF FOLLOW‐UP: 6 months STUDY TERMINATED BEFORE REGULAR END: no | |
| Publication details | LANGUAGE OF PUBLICATION: English and Italian COMMERCIAL FUNDING/NON‐COMMERCIAL FUNDING PUBLICATION STATUS: peer‐reviewed journal | |
| Stated aim of study | Quote: "The purpose of the present study was to compare the effectiveness of miglitol and glibenclamide in reducing HbA1c during long‐term (24 week) administration in Type 2 diabetic patients (5‐7) as well as meal‐stimulated serum insulin and C‐peptide levels (8, 9)." | |
| Notes | ||
| Risk of bias | ||
| Bias | Authors' judgement | Support for judgement |
| Random sequence generation (selection bias) | Unclear risk | Quote: "…, patients were randomly assigned to miglitol…." |
| Allocation concealment (selection bias) | Unclear risk | NR |
| Blinding of participants and personnel (performance bias) | Low risk | Quote: "The glibenclamide group received a breakfast placebo throughout the study." |
| Blinding of outcome assessment (detection bias) | Low risk | We assume they were blinded |
| Incomplete outcome data (attrition bias) | Unclear risk | Not described to which group patients lost to follow‐up belonged |
| Selective reporting (reporting bias) | Unclear risk | No design article or protocol available |
| Academic bias | Low risk | Primary author's first publication on the interventions |
| Sponsor bias | High risk | Received funding from pharmaceutical company |
| Trials according to risk of bias | Unclear risk | Unclear sequence generation and allocation concealment, adequate blinding |
| Methods | PARALLEL RANDOMISED CONTROLLED CLINICAL TRIAL DOUBLE‐BLIND/OPEN‐LABEL: double‐blind INTERVENTIONS USED IN TRIALS: Sulphonylurea: gliclazide Control: pioglitazone | |
| Participants | INCLUSION CRITERIA:
EXCLUSION CRITERIA: described in inclusion criteria DIAGNOSTIC CRITERIA: NR NUMBER OF PATIENTS WITH PREVIOUS CARDIOVASCULAR DISEASE: Sulphonylurea: 0 Control: 0 NUMBER OF PATIENTS TREATED WITH ASPIRIN/ANTIHYPERTENSIVES/LIPID‐LOWERING: Sulphonylurea: NR Control: NR | |
| Interventions | NUMBER OF STUDY CENTRES: 33 COUNTRY/LOCATION: Italy SETTING: outpatients TREATMENT BEFORE STUDY: diet or maximum of 1 oral hypoglycaemic agent TITRATION PERIOD: drugs were titrated every month to achieve glycaemic target GLYCAEMIC TARGET: the dose of drugs was increased if FBG was > 7.5 mmol/L or HbA1c > 7.5% | |
| Outcomes | OUTCOME(S) (as stated in the protocol/registered trial documents): HbA1c, FBG, insulin and homeostasis model assessment of insulin resistance, self monitoring blood glucose, changes in plasminogen activator‐1, antithrombin‐III, von Willebrand factor and platelets | |
| Study details | RUN‐IN PERIOD: 2 weeks DURATION OF INTERVENTION: 1 year DURATION OF FOLLOW‐UP: 1 year STUDY TERMINATED BEFORE REGULAR END: no | |
| Publication details | LANGUAGE OF PUBLICATION: English COMMERCIAL FUNDING PUBLICATION STATUS: peer‐reviewed journal | |
| Stated aim of study | Quote: "To compare long‐term (1 year) efficacy and safety of pioglitazone and gliclazide in patients with Type 2 diabetes." | |
| Notes | ||
| Risk of bias | ||
| Bias | Authors' judgement | Support for judgement |
| Random sequence generation (selection bias) | Unclear risk | Quote: "Patients were randomised to receive either pioglitazone 30–45 mg/day or gliclazide 80–320 mg/day for up to one year." |
| Allocation concealment (selection bias) | Unclear risk | NR |
| Blinding of participants and personnel (performance bias) | Low risk | Quote: "In order to assure the double‐blindness, drugs or placebo were identical in weight, taste, colour and shape and kept in coloured bottles with increasing doses of drugs. The lower doses of pioglitazone (30 mg) or gliclazide (80 mg) were stored in red bottles along with the placebo; 45 mg of pioglitazone and placebo or 80 and 160 mg of gliclazide were kept in blue and yellow bottles." |
| Blinding of outcome assessment (detection bias) | Low risk | Double‐blind design. We assume the outcomes assessors were blinded |
| Incomplete outcome data (attrition bias) | Low risk | Drop‐outs sufficiently described |
| Selective reporting (reporting bias) | Unclear risk | Primary and secondary outcomes clearly defined and assessed in publication, but no design article or study protocol available |
| Academic bias | Low risk | Primary author's first publication on the interventions |
| Sponsor bias | High risk | Received support from a pharmaceutical company |
| Trials according to risk of bias | Unclear risk | Unclear sequence generation and allocation concealment, adequate blinding |
| Methods | PARALLEL RANDOMISED CONTROLLED CLINICAL TRIAL DOUBLE‐BLIND/OPEN‐LABEL: blinding not described, but we assume open‐label INTERVENTIONS USED IN TRIALS: Sulphonylurea: glibenclamide Control: acarbose | |
| Participants | INCLUSION CRITERIA:
EXCLUSION CRITERIA:
DIAGNOSTIC CRITERIA: NR NUMBER OF PATIENTS WITH PREVIOUS CARDIOVASCULAR DISEASE: Sulphonylurea: NR Control: NR NUMBER OF PATIENTS TREATED WITH ASPIRIN/ANTIHYPERTENSIVES/LIPID‐LOWERING: Sulphonylurea: NR Control: NR | |
| Interventions | NUMBER OF STUDY CENTRES: 1 COUNTRY/LOCATION: USA SETTING: outpatients TREATMENT BEFORE STUDY: oral antidiabetic intervention or diet TITRATION PERIOD: titrated during trial GLYCAEMIC TARGET: NR | |
| Outcomes | OUTCOME(S) (as stated in the protocol/registered trial documents): blood pressure, serum insulin and biochemical variables | |
| Study details | RUN‐IN PERIOD: 4 weeks DURATION OF INTERVENTION: 6 months DURATION OF FOLLOW‐UP: 6 months STUDY TERMINATED BEFORE REGULAR END: no | |
| Publication details | LANGUAGE OF PUBLICATION: English COMMERCIAL FUNDING PUBLICATION STATUS: peer‐reviewed journal | |
| Stated aim of study | Quote: "To investigate the relationship between hypertension and hyperinsulinaemia, the effects on blood pressure and insulin levels of two oral antidiabetic agents with different mechanisms of action, acarbose (an α‐glucosidase inhibitor) and glibenclamide (an insulin promoter), were compared in patients with hypertension and type 2 diabetes mellitus." | |
| Notes | ||
| Risk of bias | ||
| Bias | Authors' judgement | Support for judgement |
| Random sequence generation (selection bias) | Unclear risk | Quote: "This study had a randomised, controlled, parallel‐group design" |
| Allocation concealment (selection bias) | Unclear risk | NR |
| Blinding of participants and personnel (performance bias) | High risk | We assume open‐label |
| Blinding of outcome assessment (detection bias) | High risk | NR, we assume not blinded |
| Incomplete outcome data (attrition bias) | Low risk | 13 patients excluded due to protocol deviations |
| Selective reporting (reporting bias) | Unclear risk | No trial protocol or design article available |
| Academic bias | Low risk | First article |
| Sponsor bias | High risk | Received funding from pharmaceutical company |
| Trials according to risk of bias | Unclear risk | Unclear sequence generation and allocation concealment, inadequate blinding |
| Methods | PARALLEL RANDOMISED CONTROLLED CLINICAL TRIAL DOUBLE‐BLIND/OPEN‐LABEL: open‐label INTERVENTIONS USED IN TRIALS: Sulphonylurea: gliclazide Control: acarbose | |
| Participants | INCLUSION CRITERIA:
EXCLUSION CRITERIA:
DIAGNOSTIC CRITERIA: NR NUMBER OF PATIENTS WITH PREVIOUS CARDIOVASCULAR DISEASE: Sulphonylurea: NR Control: NR NUMBER OF PATIENTS TREATED WITH ASPIRIN/ANTIHYPERTENSIVES/LIPID‐LOWERING: Sulphonylurea: NR Control: NR | |
| Interventions | NUMBER OF STUDY CENTRES: 1 COUNTRY/LOCATION: Turkey SETTING: outpatients TREATMENT BEFORE STUDY: diet TITRATION PERIOD: 4 weeks GLYCAEMIC TARGET: not directly described, but they use HbA1c levels < 8% as a success criteria in the results section | |
| Outcomes | OUTCOME(S) (as stated in the protocol/registered trial documents): fasting and postprandial plasma insulin, C‐peptide, glucose levels, HbA1C, lipid profiles, biochemical tests for evaluation of drug safety | |
| Study details | RUN‐IN PERIOD: 4 weeks DURATION OF INTERVENTION: 24 weeks DURATION OF FOLLOW‐UP: 24 weeks STUDY TERMINATED BEFORE REGULAR END: no | |
| Publication details | LANGUAGE OF PUBLICATION: English COMMERCIAL FUNDING PUBLICATION STATUS: peer‐reviewed journal | |
| Stated aim of study | Quote: "To compare the effect of acarbose and gliclazide on clinical findings, biochemical parameters and safety in type 2 diabetic patients insufficiently controlled with medical nutrition therapy (MNT)." | |
| Notes | ||
| Risk of bias | ||
| Bias | Authors' judgement | Support for judgement |
| Random sequence generation (selection bias) | Unclear risk | Quote: "Seventy‐two patients (age 35–70 years, BMI ≤ 35 kg/m2), who had not taken any oral antidiabetic drug previously, were randomised into two groups after a four‐week placebo period, and treated for 24 weeks with acarbose (100 mg two to three times daily) and gliclazide (40–80 mg twice daily)." |
| Allocation concealment (selection bias) | Unclear risk | NR |
| Blinding of participants and personnel (performance bias) | High risk | Open‐label design |
| Blinding of outcome assessment (detection bias) | High risk | We assume not blinded due to open‐label design |
| Incomplete outcome data (attrition bias) | Unclear risk | Loss to follow‐up not adequately described |
| Selective reporting (reporting bias) | Unclear risk | Outcomes clearly defined in trial publication, but not in a published protocol or design article |
| Academic bias | Low risk | Primary author's first publication on the interventions |
| Sponsor bias | High risk | Received funding from pharmaceutical company |
| Trials according to risk of bias | Unclear risk | Unclear sequence generation and allocation concealment, inadequate blinding |
| Methods | PARALLEL RANDOMISED CONTROLLED CLINICAL TRIAL DOUBLE‐BLIND/OPEN‐LABEL: double‐blind INTERVENTIONS USED IN TRIALS: Sulphonylurea: glibenclamide Control 1: miglitol Control 2: placebo | |
| Participants | INCLUSION CRITERIA:
EXCLUSION CRITERIA: NR DIAGNOSTIC CRITERIA: WHO NUMBER OF PATIENTS WITH PREVIOUS CARDIOVASCULAR DISEASE: Sulphonylurea: NR Control 1: NR Control 2: NR NUMBER OF PATIENTS TREATED WITH ASPIRIN/ANTIHYPERTENSIVES/LIPID‐LOWERING: Sulphonylurea: NR Control 1: NR Control 2: NR | |
| Interventions | NUMBER OF STUDY CENTRES: 18 COUNTRY/LOCATION: Austria, Germany, Israel and Czech Republic SETTING: outpatients TREATMENT BEFORE STUDY: treatment‐naive TITRATION PERIOD: 4 weeks GLYCAEMIC TARGET: NR | |
| Outcomes | OUTCOME(S) (as stated in the protocol/registered trial documents): HbA1c, biochemical variables | |
| Study details | RUN‐IN PERIOD: 4 weeks DURATION OF INTERVENTION: 24 weeks DURATION OF FOLLOW‐UP: 24 weeks STUDY TERMINATED BEFORE REGULAR END: no | |
| Publication details | LANGUAGE OF PUBLICATION: English COMMERCIAL FUNDING PUBLICATION STATUS: peer‐reviewed journal | |
| Stated aim of study | Quote: "To compare the therapeutic effects of the alpha‐glucosidase inhibitor miglitol (BAY m 1099), the sulfonylurea glibenclamide, and placebo on parameters of metabolic control and safety in patients with NIDDM that is inadequately controlled by diet alone." | |
| Notes | ||
| Risk of bias | ||
| Bias | Authors' judgement | Support for judgement |
| Random sequence generation (selection bias) | Unclear risk | Quote: "Randomization of eligible patients into a miglitol, glibenclamide (Euglucon, Boehringer Mannheim), and placebo treatment groups took place after a 4‐week single‐blind double‐placebo run‐in period, if the patient was at least 80% compliant." |
| Allocation concealment (selection bias) | Unclear risk | NR |
| Blinding of participants and personnel (performance bias) | Unclear risk | Quote: "Patients randomized to the three treatment groups received double‐blind, double‐dummy treatment." However, the titration regimen and the opportunity to increase the dose differed for the investigator, depending on the randomised intervention |
| Blinding of outcome assessment (detection bias) | Unclear risk | See above |
| Incomplete outcome data (attrition bias) | Unclear risk | There were many drop‐outs and a very sparse description of the reasons |
| Selective reporting (reporting bias) | Low risk | Primary and secondary outcomes are reported |
| Academic bias | Low risk | Primary author's first publication on the interventions |
| Sponsor bias | High risk | Several authors work in the pharmaceutical industry |
| Trials according to risk of bias | Unclear risk | Unclear sequence generation, allocation concealment and blinding |
| Methods | PARALLEL RANDOMISED CONTROLLED CLINICAL TRIAL DOUBLE‐BLIND/OPEN‐LABEL: open‐label INTERVENTIONS USED IN TRIALS: Sulphonylurea: glimepiride Control: pioglitazone | |
| Participants | INCLUSION CRITERIA:
EXCLUSION CRITERIA:
DIAGNOSTIC CRITERIA: NR NUMBER OF PATIENTS WITH PREVIOUS CARDIOVASCULAR DISEASE: Sulphonylurea: NR Control: NR NUMBER OF PATIENTS TREATED WITH ASPIRIN/ANTIHYPERTENSIVES/LIPID‐LOWERING: Sulphonylurea: NR Control: NR | |
| Interventions | NUMBER OF STUDY CENTRES: 33 COUNTRY/LOCATION: Japan SETTING: outpatients TREATMENT BEFORE STUDY: diet TITRATION PERIOD: titrated during trial GLYCAEMIC TARGET: FBG < 120 mg/dL, but > 80 mg/dl | |
| Outcomes | OUTCOME(S) (as stated in the protocol/registered trial documents): percentage of patients with HbA1c < 6.9 at the end of study, change in HbA1c at 6 months compared with baseline, fasting plasma glucose, insulin, lipids and plasma natriuretic peptide levels, body weight, BMI, safety of study medication, compliance | |
| Study details | RUN‐IN PERIOD: 1 month DURATION OF INTERVENTION: 6 months DURATION OF FOLLOW‐UP: 6 months STUDY TERMINATED BEFORE REGULAR END: no | |
| Publication details | LANGUAGE OF PUBLICATION: English COMMERCIAL FUNDING PUBLICATION STATUS: peer‐reviewed journal | |
| Stated aim of study | Quote: "To compare first‐line agent glimepiride and pioglitazone in Japanese patients with type 2 diabetes uncontrolled by diet and exercise with respect to glycaemic control, safety and metabolic changes." | |
| Notes | ||
| Risk of bias | ||
| Bias | Authors' judgement | Support for judgement |
| Random sequence generation (selection bias) | Low risk | Quote: "Randomization was carried out by a central registration method." |
| Allocation concealment (selection bias) | Unclear risk | NR |
| Blinding of participants and personnel (performance bias) | High risk | Open‐label design |
| Blinding of outcome assessment (detection bias) | High risk | In protocol described that no one was blinded |
| Incomplete outcome data (attrition bias) | Low risk | All loss to follow‐up explained |
| Selective reporting (reporting bias) | High risk | Assessed primary and secondary outcomes, but had in protocol predefined per cent of patients achieving HbA1c < 6.5%, however only reports the per cent of patients achieving HbA1c < 6.9% |
| Academic bias | Low risk | Primary author's first publication on the interventions |
| Sponsor bias | High risk | Pharmaceutical funding |
| Trials according to risk of bias | Unclear risk | Inadequate sequence generation, unclear allocation concealment, inadequate blinding |
| Methods | PARALLEL RANDOMISED CONTROLLED CLINICAL TRIAL DOUBLE‐BLIND/OPEN‐LABEL: open‐label INTERVENTIONS USED IN TRIALS: Sulphonylurea: glibenclamide Control: acarbose | |
| Participants | INCLUSION CRITERIA:
EXCLUSION CRITERIA:
DIAGNOSTIC CRITERIA: NR NUMBER OF PATIENTS WITH PREVIOUS CARDIOVASCULAR DISEASE: Sulphonylurea: NR Control: NR NUMBER OF PATIENTS TREATED WITH ASPIRIN/ANTIHYPERTENSIVES/LIPID‐LOWERING: Sulphonylurea: NR Control: NR | |
| Interventions | NUMBER OF STUDY CENTRES: 7 COUNTRY/LOCATION: Germany SETTING: outpatients TREATMENT BEFORE STUDY: diet TITRATION PERIOD: glibenclamide titrated during the trial, the dose of acarbose was doubled after 2 weeks. GLYCAEMIC TARGET: NR | |
| Outcomes | OUTCOME(S) (as stated in the protocol/registered trial documents): FBG and 1 hour after breakfast, HbA1c, triglycerides, cholesterol, body weight, blood pressure, subjective symptoms, biochemical variables | |
| Study details | RUN‐IN PERIOD: none DURATION OF INTERVENTION: 24 weeks DURATION OF FOLLOW‐UP: 24 weeks STUDY TERMINATED BEFORE REGULAR END: no | |
| Publication details | LANGUAGE OF PUBLICATION: English and German COMMERCIAL FUNDING PUBLICATION STATUS: peer‐reviewed journal | |
| Stated aim of study | Quote: "This was the rationale to investigate the efficacy of acarbose vs. glibenclamide in a 6 months group comparison." | |
| Notes | ||
| Risk of bias | ||
| Bias | Authors' judgement | Support for judgement |
| Random sequence generation (selection bias) | Low risk | Quote: "The patients were in each centre consecutively assigned to one of two treatment groups according to a list of random numbers (after principle of randomness)." |
| Allocation concealment (selection bias) | Unclear risk | NR |
| Blinding of participants and personnel (performance bias) | High risk | Open‐label design |
| Blinding of outcome assessment (detection bias) | High risk | We assume not blinded due to open‐label design |
| Incomplete outcome data (attrition bias) | Unclear risk | Reasons for drop‐outs clearly described, but it is not possible to estimate to which intervention they were originally randomised. The participants lost to follow‐up are not included in the analysis |
| Selective reporting (reporting bias) | Unclear risk | Primary and secondary outcomes not clearly described. No design article or protocol available |
| Academic bias | Low risk | Primary author's first publication on the interventions |
| Sponsor bias | High risk | Received funding from pharmaceutical company |
| Trials according to risk of bias | Unclear risk | Unclear sequence generation and allocation concealment, inadequate blinding |
| Methods | PARALLEL RANDOMISED CONTROLLED CLINICAL TRIAL DOUBLE‐BLIND/OPEN‐LABEL: not described, we assume open‐label INTERVENTIONS USED IN TRIALS: Sulphonylurea: glibenclamide Control: troglitazone | |
| Participants | INCLUSION CRITERIA: T2DM with fasting glucose ≥ to 7.8 mmol/L and < 16.7 mmol/L on > 2 separate occasions EXCLUSION CRITERIA:
DIAGNOSTIC CRITERIA: NR NUMBER OF PATIENTS WITH PREVIOUS CARDIOVASCULAR DISEASE: Sulphonylurea: NR Control: NR NUMBER OF PATIENTS TREATED WITH ASPIRIN/ANTIHYPERTENSIVES/LIPID‐LOWERING: Sulphonylurea: NR Control: NR | |
| Interventions | NUMBER OF STUDY CENTRES: NR COUNTRY/LOCATION: USA SETTING: outpatients TREATMENT BEFORE STUDY: NR TITRATION PERIOD: NR GLYCAEMIC TARGET: NR | |
| Outcomes | OUTCOME(S) (as stated in the protocol/registered trial documents): haemodynamic mechanism of blood pressure lowering glucose, insulin, C‐peptide and HbA1c. Resting and stress blood pressure, stroke volume and cardiac output | |
| Study details | RUN‐IN PERIOD: NR DURATION OF INTERVENTION: 6 months DURATION OF FOLLOW‐UP: 6 months STUDY TERMINATED BEFORE REGULAR END: no | |
| Publication details | LANGUAGE OF PUBLICATION: English NON‐COMMERCIAL FUNDING PUBLICATION STATUS: peer‐reviewed journal | |
| Stated aim of study | Quote: "The present study examined the hemodynamic mechanisms of blood pressure (BP) lowering by troglitazone in patients with type 2 diabetes mellitus (DM) at rest and during a mental arithmetic test (MAT)." | |
| Notes | "This study was performed as a 2‐part protocol. The first part was to compare BP response to a mental arithmetic test (MAT) in persons with and without DM. Twenty‐two DM patients and 12 age‐ and gender‐matched controls participated in this protocol. The second part was designed to compare metabolic and hemodynamic effects of troglitazone and glyburide in subjects with DM. The same 22 DM patients were randomized to either the troglitazone or glyburide group and treated for 6 months" The healthy controls are not included | |
| Risk of bias | ||
| Bias | Authors' judgement | Support for judgement |
| Random sequence generation (selection bias) | Unclear risk | Quote: "The DM group was then randomized to receive…" |
| Allocation concealment (selection bias) | Unclear risk | Not described |
| Blinding of participants and personnel (performance bias) | High risk | Unlikely, not mentioned |
| Blinding of outcome assessment (detection bias) | High risk | Unlikely |
| Incomplete outcome data (attrition bias) | Unclear risk | No drop‐outs accounted for. Due to the size of the study it is very likely that there were no drop‐outs |
| Selective reporting (reporting bias) | Unclear risk | No trial protocol or design article available |
| Academic bias | Low risk | Primary author's first publication on the interventions |
| Sponsor bias | Low risk | No funding from the pharmaceutical industry |
| Trials according to risk of bias | Unclear risk | Unclear sequence generation and allocation concealment, inadequate blinding |
| Methods | PARALLEL RANDOMISED CONTROLLED CLINICAL TRIAL DOUBLE‐BLIND/OPEN‐LABEL: open‐label INTERVENTIONS USED IN TRIALS: Sulphonylurea: glibenclamide Comparator: rosiglitazone | |
| Participants | INCLUSION CRITERIA:
EXCLUSION CRITERIA:
DIAGNOSTIC CRITERIA: National Diabetes Data Group definition, with fasting C‐peptide concentration ≥ 0.8 ng/ml NUMBER OF PATIENTS WITH PREVIOUS CARDIOVASCULAR DISEASE: Sulphonylurea: NR Comparator: NR NUMBER OF PATIENTS TREATED WITH ASPIRIN/ANTIHYPERTENSIVES/LIPID‐LOWERING: Sulphonylurea: NR Comparator: NR | |
| Interventions | NUMBER OF STUDY CENTRES: 19 COUNTRY/LOCATION: USA SETTING: outpatients TREATMENT BEFORE STUDY: varied from diet, single oral antidiabetic drug or combination therapy TITRATION PERIOD: 8 weeks GLYCAEMIC TARGET: NR | |
| Outcomes | OUTCOME(S) (as stated in the protocol/registered trial documents): change from baseline in Left Ventricular Mass Index at weeks 28 and 52, change from baseline in left ventricular end‐diastolic volume, ejection fraction, blood pressure, heart rate, arterial pressure, pulse, glycaemic control, serum lipids at weeks 28 and 52, urinary albumin excretion | |
| Study details | RUN‐IN PERIOD: 4 weeks DURATION OF INTERVENTION: 52 weeks DURATION OF FOLLOW‐UP: 52 weeks STUDY TERMINATED BEFORE REGULAR END: no | |
| Publication details | LANGUAGE OF PUBLICATION: English COMMERCIAL FUNDING PUBLICATION STATUS: peer‐reviewed journal | |
| Stated aim of study | Quote: "This open‐label, active‐controlled study investigated the cardiac safety and antihyperglycemic effect of rosiglitazone (RSG) in patients with type 2 diabetes." | |
| Notes | ||
| Risk of bias | ||
| Bias | Authors' judgement | Support for judgement |
| Random sequence generation (selection bias) | Unclear risk | Quote: "Eligible patients were randomly assigned…" |
| Allocation concealment (selection bias) | Unclear risk | NR |
| Blinding of participants and personnel (performance bias) | High risk | Open‐label design |
| Blinding of outcome assessment (detection bias) | High risk | We assume not blinded |
| Incomplete outcome data (attrition bias) | Unclear risk | Discrepancy in number lost to follow‐up in publication |
| Selective reporting (reporting bias) | Unclear risk | No design article or protocol |
| Academic bias | Low risk | Primary author's first publication on the interventions |
| Sponsor bias | High risk | Received commercial funding |
| Trials according to risk of bias | Unclear risk | Unclear sequence generation and allocation concealment, inadequate blinding |
| Methods | PARALLEL RANDOMISED CONTROLLED CLINICAL TRIAL DOUBLE‐BLIND/OPEN‐LABEL: double‐blind INTERVENTIONS USED IN TRIALS: Sulphonylurea: glimepiride Comparator: pioglitazone | |
| Participants | INCLUSION CRITERIA:
EXCLUSION CRITERIA:
DIAGNOSTIC CRITERIA: NR NUMBER OF PATIENTS WITH PREVIOUS CARDIOVASCULAR DISEASE: Sulphonylurea: NR Comparator: NR NUMBER OF PATIENTS TREATED WITH ASPIRIN/ANTIHYPERTENSIVES/LIPID‐LOWERING: Sulphonylurea: NR/NR/14 Comparator: NR/NR/15 | |
| Interventions | NUMBER OF STUDY CENTRES: 19 COUNTRY/LOCATION: Mexico SETTING: outpatients TREATMENT BEFORE STUDY: diet or monotherapy oral (not maximum dose) TITRATION PERIOD: 12 weeks GLYCAEMIC TARGET: FBG ≤ 7 mmol/L and a 1‐hour postprandial blood glucose concentration ≤ 10 mmol/L | |
| Outcomes | OUTCOME(S) (as stated in the protocol/registered trial documents): glycaemic control, insulin sensitivity and safety assessment | |
| Study details | RUN‐IN PERIOD: 1 to 3 weeks DURATION OF INTERVENTION: 52 weeks DURATION OF FOLLOW‐UP: 52 weeks STUDY TERMINATED BEFORE REGULAR END: no | |
| Publication details | LANGUAGE OF PUBLICATION: English COMMERCIAL FUNDING PUBLICATION STATUS: peer‐reviewed journal | |
| Stated aim of study | Quote: "The goals of this study were to compare changes in measures of glycemic control and insulin sensitivity in Mexican patients with type 2 diabetes who received pioglitazone or glimepiride for 1 year." | |
| Notes | ||
| Risk of bias | ||
| Bias | Authors' judgement | Support for judgement |
| Random sequence generation (selection bias) | Low risk | Quote: "Patients who met the inclusion criteria were randomized in equal proportions to receive pioglitazone or glimepiride during the titration period according to a central randomization table generated by the sponsor and administered by an automated interactive voice‐response system." |
| Allocation concealment (selection bias) | Low risk | See above |
| Blinding of participants and personnel (performance bias) | Unclear risk | Quote: "All doses of both drugs were administered as a single capsule to ensure blinding." However, according to the titration regimen pioglitazone could be prescribed in 3 tablets and glimepiride in 4 tablets. They have not reported use of placebo |
| Blinding of outcome assessment (detection bias) | Unclear risk | Not described |
| Incomplete outcome data (attrition bias) | Low risk | Description of all patients lost to follow‐up |
| Selective reporting (reporting bias) | Low risk | Primary and secondary outcomes reported |
| Academic bias | High risk | First author has published similar trials (Tan 2004a) |
| Sponsor bias | High risk | Received commercial funding |
| Trials according to risk of bias | Unclear risk | Adequate sequence generation and allocation concealment, unclear blinding |
| Methods | PARALLEL RANDOMISED CONTROLLED CLINICAL TRIAL DOUBLE‐BLIND/OPEN‐LABEL: double‐blind INTERVENTIONS USED IN TRIALS: Sulphonylurea: glibenclamide Comparator: pioglitazone | |
| Participants | INCLUSION CRITERIA:
EXCLUSION CRITERIA:
DIAGNOSTIC CRITERIA: NR NUMBER OF PATIENTS WITH PREVIOUS CARDIOVASCULAR DISEASE: Sulphonylurea: NR Comparator: NR NUMBER OF PATIENTS TREATED WITH ASPIRIN/ANTIHYPERTENSIVES/LIPID‐LOWERING: Sulphonylurea: NR/47/28 Comparator: NR/45/29 | |
| Interventions | NUMBER OF STUDY CENTRES: 22 COUNTRY/LOCATION: Denmark, Norway, Sweden and Finland SETTING: outpatients TREATMENT BEFORE STUDY: oral monotherapy (not maximum dose) or diet TITRATION PERIOD: 12 weeks GLYCAEMIC TARGET: FBG of < 7 mmol/L (126 mg/dl) and 1‐h PBG of < 10 mmol/L (180 mg/dl) | |
| Outcomes | OUTCOME(S) (as stated in the protocol/registered trial documents): efficacy and safety | |
| Study details | RUN‐IN PERIOD: 1 to 3 weeks DURATION OF INTERVENTION: 52 weeks DURATION OF FOLLOW‐UP: 52 weeks STUDY TERMINATED BEFORE REGULAR END: no | |
| Publication details | LANGUAGE OF PUBLICATION: English COMMERCIAL FUNDING PUBLICATION STATUS: peer‐reviewed journal | |
| Stated aim of study | Quote: "This study compared the effects of 52 weeks' treatment with pioglitazone, a thiazolidinedione that reduces insulin resistance, and glibenclamide, on insulin sensitivity, glycaemic control, and lipids in patients with Type 2 diabetes." | |
| Notes | Not clearly reported in publication whether the trial is double‐blind or open‐label, but we assume open‐label, based on the different doses in the titration period | |
| Risk of bias | ||
| Bias | Authors' judgement | Support for judgement |
| Random sequence generation (selection bias) | Unclear risk | Quote: "Patients were randomized to receive pioglitazone or micronized glibenclamide." |
| Allocation concealment (selection bias) | Unclear risk | NR |
| Blinding of participants and personnel (performance bias) | Low risk | Blinding not reported in the publication. Sponsor described the blinding; glibenclamide and pioglitazone tablets were put inside a capsule to ensure blinding. Dummy titration visit was made for pioglitazone to ensure blinding |
| Blinding of outcome assessment (detection bias) | Unclear risk | NR |
| Incomplete outcome data (attrition bias) | Low risk | There was a very high number of patients lost to follow‐up. The reasons for all of them were not clear in the publication, but additional information from the sponsors provided us with sufficient information |
| Selective reporting (reporting bias) | Low risk | All outcomes predefined in study protocol and reported |
| Academic bias | High risk | First author has published similar trials (Tan 2004) |
| Sponsor bias | High risk | Received commercial funding |
| Trials according to risk of bias | Unclear risk | Unclear sequence generation and allocation concealment, adequate blinding of participants and investigators, unclear blinding of outcome assessors |
| Methods | PARALLEL RANDOMISED CONTROLLED CLINICAL TRIAL DOUBLE‐BLIND/OPEN‐LABEL: double‐blind (extension of Charbonnel 2005) INTERVENTIONS USED IN TRIALS: Sulphonylurea: gliclazide Control: pioglitazone | |
| Participants | INCLUSION CRITERIA: extension of Charbonnel 2005 EXCLUSION CRITERIA: extension of Charbonnel 2005 DIAGNOSTIC CRITERIA: NR NUMBER OF PATIENTS WITH PREVIOUS CARDIOVASCULAR DISEASE: Sulphonylurea: NR Control: NR NUMBER OF PATIENTS TREATED WITH ASPIRIN/ANTIHYPERTENSIVES/LIPID‐LOWERING: Sulphonylurea: NR Control: NR | |
| Interventions | NUMBER OF STUDY CENTRES: 98 centres (selected on basis on the number of patients selected for the parent study) COUNTRY/LOCATION: Australia, Canada, Finland, Poland, the Slovak Republic, United Kingdom and South Africa SETTING: outpatients TREATMENT BEFORE STUDY: before randomisation to initial double‐blind treatment phase, the patients were drug‐naive (Charbonnel 2005). The patients were receiving either gliclazide or pioglitazone before the extension trial TITRATION PERIOD: none for the extension period GLYCAEMIC TARGET: HbA1c < 8% | |
| Outcomes | OUTCOME(S) (as stated in the protocol/registered trial documents): time to intervention failure, HbA1c, FPG, fasting serum insulin, homeostasis model assessment for insulin sensitivity and for cell activity | |
| Study details | RUN‐IN PERIOD: none DURATION OF INTERVENTION: 52 weeks DURATION OF FOLLOW‐UP: 52 weeks STUDY TERMINATED BEFORE REGULAR END: no | |
| Publication details | LANGUAGE OF PUBLICATION: English COMMERCIAL FUNDING PUBLICATION STATUS: peer‐reviewed journal | |
| Stated aim of study | Quote: "The hypothesis that pioglitazone treatment is superior to gliclazide treatment in sustaining glycemic control for up to 2 years in patients with type 2 diabetes was tested." | |
| Notes | ||
| Risk of bias | ||
| Bias | Authors' judgement | Support for judgement |
| Random sequence generation (selection bias) | Unclear risk | Quote: "This was a randomized, multicenter..." |
| Allocation concealment (selection bias) | Unclear risk | NR |
| Blinding of participants and personnel (performance bias) | Low risk | Quote: "...randomized, multicenter, double‐blind, double‐dummy, parallel‐group,..." |
| Blinding of outcome assessment (detection bias) | Low risk | We assume the outcome assessors were blinded |
| Incomplete outcome data (attrition bias) | Low risk | Adequate description of patients lost to follow‐up |
| Selective reporting (reporting bias) | Unclear risk | No published protocol or design article available |
| Academic bias | High risk | Published similar trial previously (Tan 2004; Tan 2004a) |
| Sponsor bias | High risk | Received funding from pharmaceutical company |
| Trials according to risk of bias | Unclear risk | Unclear sequence generation and allocation concealment, adequate blinding |
| Methods | PARALLEL RANDOMISED CONTROLLED CLINICAL TRIAL DOUBLE‐BLIND/OPEN‐LABEL: open‐label NUMBER OF PATIENTS WITH PREVIOUS CARDIOVASCULAR DISEASE: Sulphonylurea: glimepiride Comparator: metformin | |
| Participants | INCLUSION CRITERIA:
EXCLUSION CRITERIA: described in the inclusion criteria DIAGNOSTIC CRITERIA: WHO 1999 NUMBER OF PATIENTS WITH PREVIOUS CARDIOVASCULAR DISEASE: Sulphonylurea: 13 Comparator: 13 NUMBER OF PATIENTS TREATED WITH ASPIRIN/ANTIHYPERTENSIVES/LIPID‐LOWERING: Sulphonylurea: 0/NR/0 Comparator: 0/NR/0 | |
| Interventions | NUMBER OF STUDY CENTRES: NR, probably 1 COUNTRY/LOCATION: China SETTING: NR TREATMENT BEFORE STUDY: NR TITRATION PERIOD: NR GLYCAEMIC TARGET: | |
| Outcomes | OUTCOME(S) (as stated in the protocol/registered trial documents): biochemical variables | |
| Study details | RUN‐IN PERIOD: NR DURATION OF INTERVENTION: 6 months DURATION OF FOLLOW‐UP: 6 months STUDY TERMINATED BEFORE REGULAR END: no | |
| Publication details | LANGUAGE OF PUBLICATION: Chinese NON‐COMMERCIAL FUNDING PUBLICATION STATUS: peer‐reviewed journal | |
| Stated aim of study | Quote "To investigate the effect of glimepiride and metformin on free fatty acid in patients with Type 2 diabetes mellitus and to further study the relationship between free fatty acid and insulin resistance in patients with Type 2 diabetes mellitus." [From English abstract]. | |
| Notes | The abstract described the trial as a prospective case‐control study, where patients were divided into 3 groups. In the main text the author state that the patients were randomised. Intervention group in trial, not included in the review: glimepiride plus metformin The number of patients with previous cardiovascular disease is the number of patients with hypertension | |
| Risk of bias | ||
| Bias | Authors' judgement | Support for judgement |
| Random sequence generation (selection bias) | Unclear risk | "....randomised..." [translated from Chinese] |
| Allocation concealment (selection bias) | Unclear risk | NR |
| Blinding of participants and personnel (performance bias) | High risk | Open‐label design |
| Blinding of outcome assessment (detection bias) | High risk | We assume not blinded |
| Incomplete outcome data (attrition bias) | Unclear risk | No loss to follow‐up reported |
| Selective reporting (reporting bias) | Unclear risk | No related information provided |
| Academic bias | Low risk | Primary author's first publication on the interventions |
| Sponsor bias | Low risk | "Sponsored by 15th National Research Project (2001BAA702B04); Science and Technology research Project of Hunan Province (03ssy3069)." [Translated from Chinese] |
| Trials according to risk of bias | Unclear risk | Unclear sequence generation and allocation concealment, inadequate blinding |
| Methods | PARALLEL RANDOMISED CONTROLLED CLINICAL TRIAL DOUBLE‐BLIND/OPEN‐LABEL: open‐label INTERVENTIONS USED IN TRIALS: Sulphonylurea: glibenclamide Comparator: pioglitazone | |
| Participants | INCLUSION CRITERIA:
EXCLUSION CRITERIA:
DIAGNOSTIC CRITERIA: NR NUMBER OF PATIENTS WITH PREVIOUS CARDIOVASCULAR DISEASE: Sulphonylurea: NR Comparator: NR NUMBER OF PATIENTS TREATED WITH ASPIRIN/ANTIHYPERTENSIVES/LIPID‐LOWERING: Sulphonylurea: NR/NR/0 Comparator: NR/NR/0 | |
| Interventions | NUMBER OF STUDY CENTRES: 18 COUNTRY/LOCATION: Japan SETTING: outpatients TREATMENT BEFORE STUDY: diet TITRATION PERIOD: 8 weeks GLYCAEMIC TARGET: FPG < 126 mg/dl | |
| Outcomes | OUTCOME(S) (as stated in the protocol/registered trial documents): biochemical variables | |
| Study details | RUN‐IN PERIOD: NR DURATION OF INTERVENTION: 24 weeks DURATION OF FOLLOW‐UP: 24 weeks STUDY TERMINATED BEFORE REGULAR END: no | |
| Publication details | LANGUAGE OF PUBLICATION: English COMMERCIAL FUNDING/NON‐COMMERCIAL FUNDING: NR PUBLICATION STATUS: peer‐reviewed journal | |
| Stated aim of study | Quote: "The effects of pioglitazone hydrochloride monotherapy on abnormal lipid control were evaluated in Japanese patients with type 2 diabetes mellitus, comparing with glibenclamide monotherapy." | |
| Notes | ||
| Risk of bias | ||
| Bias | Authors' judgement | Support for judgement |
| Random sequence generation (selection bias) | Unclear risk | Quote: "This study was a randomized..." |
| Allocation concealment (selection bias) | Unclear risk | NR |
| Blinding of participants and personnel (performance bias) | High risk | Open‐label |
| Blinding of outcome assessment (detection bias) | High risk | We assume not blinded |
| Incomplete outcome data (attrition bias) | Unclear risk | Not extensively described |
| Selective reporting (reporting bias) | Unclear risk | No trial protocol or design article available |
| Academic bias | Low risk | Primary author's first publication on the interventions |
| Sponsor bias | Unclear risk | NR |
| Trials according to risk of bias | Unclear risk | Unclear sequence generation and allocation concealment, inadequate blinding |
| Methods | PARALLEL RANDOMISED CONTROLLED CLINICAL TRIAL DOUBLE‐BLIND/OPEN‐LABEL: open‐label INTERVENTIONS USED IN TRIALS: Sulphonylurea: gliclazide Comparator: metformin | |
| Participants | INCLUSION CRITERIA:
EXCLUSION CRITERIA: described within the inclusion criteria DIAGNOSTIC CRITERIA: NR NUMBER OF PATIENTS WITH PREVIOUS CARDIOVASCULAR DISEASE: Sulphonylurea: NR Control: NR NUMBER OF PATIENTS TREATED WITH ASPIRIN/ANTIHYPERTENSIVES/LIPID‐LOWERING: Sulphonylurea: NR Control: NR | |
| Interventions | INTERVENTIONS USED IN TRIALS: Sulphonylurea: gliclazide Control: metformin NUMBER OF STUDY CENTRES: 1 COUNTRY/LOCATION: Canada SETTING: outpatients TREATMENT BEFORE STUDY: not gliclazide, metformin or insulin; other oral were withdrawn 30 days prior to randomisation TITRATION PERIOD: not reported, but the dose was gradually increased GLYCAEMIC TARGET: self monitoring less than 8.0 mmol/L fasting in the morning, less than 10 mmol/L after meals | |
| Outcomes | OUTCOME(S) (as stated in the protocol/registered trial documents): efficacy, lipid peroxidation and side effects | |
| Study details | RUN‐IN PERIOD: 30 days DURATION OF INTERVENTION: 24 weeks DURATION OF FOLLOW‐UP: 24 weeks STUDY TERMINATED BEFORE REGULAR END: no | |
| Publication details | LANGUAGE OF PUBLICATION: English COMMERCIAL FUNDING PUBLICATION STATUS: peer‐reviewed journal | |
| Stated aim of study | Quote: "Consequently, the goal of this study is to compare gliclazide and metformin in patients with type 2 diabetes mellitus with regard to efficacy, side effects profile, and lipid peroxidation." | |
| Notes | ||
| Risk of bias | ||
| Bias | Authors' judgement | Support for judgement |
| Random sequence generation (selection bias) | Unclear risk | Quote: "Each subject were then randomized to…" |
| Allocation concealment (selection bias) | Unclear risk | NR |
| Blinding of participants and personnel (performance bias) | High risk | Open‐label design |
| Blinding of outcome assessment (detection bias) | High risk | Open‐label design |
| Incomplete outcome data (attrition bias) | Low risk | 3 drop‐outs, reasons explained |
| Selective reporting (reporting bias) | Unclear risk | No design article or protocol available |
| Academic bias | Low risk | Primary author's first publication on the interventions |
| Sponsor bias | High risk | Received funding from pharmaceutical company |
| Trials according to risk of bias | Unclear risk | Unclear sequence generation and allocation concealment, inadequate blinding |
| Methods | CROSS‐OVER RANDOMISED CONTROLLED CLINICAL TRIAL DOUBLE‐BLIND/OPEN‐LABEL: double‐blind INTERVENTIONS USED IN TRIALS: Sulphonylurea: glibenclamide Control: metformin | |
| Participants | INCLUSION CRITERIA:
EXCLUSION CRITERIA:
DIAGNOSTIC CRITERIA: ADA criteria NUMBER OF PATIENTS WITH PREVIOUS CARDIOVASCULAR DISEASE: Sulphonylurea: 0 Control: 0 NUMBER OF PATIENTS TREATED WITH ASPIRIN/ANTIHYPERTENSIVES/LIPID‐LOWERING: Sulphonylurea: 1/8/1 Control: 0/8/3 | |
| Interventions | NUMBER OF STUDY CENTRES: 1 COUNTRY/LOCATION: Italy SETTING: outpatients TREATMENT BEFORE STUDY: diet and/or oral antidiabetic intervention TITRATION PERIOD: 4 weeks GLYCAEMIC TARGET: during both phases of the study, doses were titrated in 4 steps (at intervals of minimum 20 days) to achieve HbA1c ≤ 6.0% and fasting plasma glucose less than 140 mg/dL, in the absence of hypoglycaemic episodes | |
| Outcomes | OUTCOME(S) (as stated in the protocol/registered trial documents): HbA1c, FBG, insulin resistance, BMI, lipids and side effects | |
| Study details | RUN‐IN PERIOD: 4 weeks DURATION OF INTERVENTION: 6 months, thereafter switch to combination therapy DURATION OF FOLLOW‐UP: 6 months STUDY TERMINATED BEFORE REGULAR END: no | |
| Publication details | LANGUAGE OF PUBLICATION: English COMMERCIAL FUNDING/NON‐COMMERCIAL FUNDING PUBLICATION STATUS: peer‐reviewed journal | |
| Stated aim of study | Quote: "In the present randomized, double‐blind trial, efficacy and tolerability of metformin and glibenclamide given alone or in combination were compared in 88 type 2 diabetic patients,using a cross‐over design." | |
| Notes | The combination group of glibenclamide plus metformin is not included in the meta‐analysis | |
| Risk of bias | ||
| Bias | Authors' judgement | Support for judgement |
| Random sequence generation (selection bias) | Low risk | Quote: "After a 4‐week run‐in period (T 0), eligible patients were randomized to 3 treatment groups…" The random allocation schedule was generated by the pharmaceutical technique department (from correspondence) |
| Allocation concealment (selection bias) | Low risk | Quote: "All tablets were supplied by Guidotti Laboratories, Pisa, Italy, which generated the allocation schedule and provided the blinding procedure." Each drug was prepared and labelled by sequential number according to the allocation schedule. Participants were assigned in numbers in a consecutive order by a physician, who was blinded to treatments (from correspondence) |
| Blinding of participants and personnel (performance bias) | Low risk | Quote: "All tablets were supplied by Guidotti Laboratories, Pisa, Italy, which generated the allocation schedule and provided the blinding procedure." |
| Blinding of outcome assessment (detection bias) | Low risk | We assume outcome assessors were adequately blinded |
| Incomplete outcome data (attrition bias) | Unclear risk | Difficult to assess drop‐outs and their reasons after the first intervention period |
| Selective reporting (reporting bias) | Low risk | Primary outcome very vaguely defined in publication, but clarified through communication with corresponding author |
| Academic bias | Low risk | Primary author's first publication on the interventions |
| Sponsor bias | High risk | Received funding from pharmaceutical company |
| Trials according to risk of bias | Low risk | Adequate sequence generation, allocation concealment and blinding |
| Methods | PARALLEL RANDOMISED CONTROLLED CLINICAL TRIAL DOUBLE‐BLIND/OPEN‐LABEL: double‐blind evaluation of oral intervention, open‐label for insulin INTERVENTIONS USED IN TRIALS: Sulphonylurea: tolbutamide Control 1: placebo Control 2: insulin | |
| Participants | INCLUSION CRITERIA:
EXCLUSION CRITERIA: prior history of ketoacidosis DIAGNOSTIC CRITERIA: patients fulfilling the requirements got a diagnostic test. Diagnostic test: the sum of 4 glucose values from glucose tolerance test had to be equal or greater than 500 mg/100 ml in order to be eligible for the study) NUMBER OF PATIENTS WITH PREVIOUS CARDIOVASCULAR DISEASE: Sulphonylurea: 14 Control 1: 10 Control 2: 16 NUMBER OF PATIENTS TREATED WITH ASPIRIN/ANTIHYPERTENSIVES/LIPID‐LOWERING: Sulphonylurea: 4/55/NR Control 1: 7/48/NR Control 2: 7/62/NR | |
| Interventions | NUMBER OF STUDY CENTRES: 12 COUNTRY/LOCATION: USA SETTING: outpatients TREATMENT BEFORE STUDY: hypoglycaemic therapy, not further specified TITRATION PERIOD: NR GLYCAEMIC TARGET: NR | |
| Outcomes | OUTCOME(S) (as stated in the protocol/registered trial documents): vascular complications, natural history of diabetes | |
| Study details | RUN‐IN PERIOD: 4 weeks DURATION OF INTERVENTION: 4.75 years DURATION OF FOLLOW‐UP: 4.75 years STUDY TERMINATED BEFORE REGULAR END: no | |
| Publication details | LANGUAGE OF PUBLICATION: English NON‐COMMERCIAL FUNDING PUBLICATION STATUS: peer‐reviewed journal | |
| Stated aim of study | Quote: "The University Group Diabetes Program had three major objectives: (1) Evaluation of the efficacy of various hypoglycaemic treatments in the prevention of vascular complications in patients with mild diabetes. (2) Study of the natural history of a group of patients with maturity onset, noninsulin dependent diabetes. (3) Development of methods applicable to cooperative clinical trials." | |
| Notes | The phenformin group is not included in the analysis as it was included in the trial 18 months after the other interventions groups. The insulin variable (IVAR) intervention group had a more strict glycaemic target and is therefore not included in the analysis. The insulin data is from the insulin standard intervention group in trial. Data from this intervention group are reported after a duration of intervention of 5.75 years to make the data comparable with tolbutamide. The number reported with previously cardiovascular disease is the number of participants with angina | |
| Risk of bias | ||
| Bias | Authors' judgement | Support for judgement |
| Random sequence generation (selection bias) | Low risk | Quote: "Patients enrolled in the UGDP were randomly assigned to one of the five treatment groups. All assignments were made by the UGDP coordinating center." |
| Allocation concealment (selection bias) | Low risk | Quote: "Separate allocation schedules were used for each of the participating Clinical Centers. These schedules were prepared using a table of random numbers and were designed to insure a specified number of patients in each of the treatment groups in a given clinic at periodic intervals throughout the course of the recruitment. The allocation procedure used in each of these clinics was designed to provide the same number of patients in each of these four treatments groups after every sixteenth allocation. (Another assignment ratio when phenformin was added)." |
| Blinding of participants and personnel (performance bias) | Unclear risk | The tolbutamide and placebo group is adequately blinded. Quote: "Lactose placebo was given in tablet form which was indistinguishable by inspection from tolbutamide. The dosage schedule chosen was the same as for tolbutamide." The insulin group was open‐label |
| Blinding of outcome assessment (detection bias) | Low risk | Quote: "…blind evaluation long‐term observation of patients, and central collection, editing, and monitoring of the observed data." |
| Incomplete outcome data (attrition bias) | Unclear risk | Not specifically described for each intervention group Quote: "A total of 654 out of 823 patients had 5 complete years of follow‐up…" |
| Selective reporting (reporting bias) | Low risk | Outcomes predefined in design article and assessed |
| Academic bias | Low risk | Primary author's first publication on the interventions |
| Sponsor bias | Low risk | No pharmaceutical funding |
| Trials according to risk of bias | Unclear risk | Adequate sequence generation, allocation concealment and blinding of outcome assessors. Unclear blinding of participants and investigators |
| Methods | PARALLEL RANDOMISED CONTROLLED CLINICAL TRIAL DOUBLE‐BLIND/OPEN‐LABEL: open‐label INTERVENTIONS USED IN TRIALS: Sulphonylurea 1: chlorpropamide Sulphonylurea 2: glibenclamide Sulphonylurea 3: glipizide Control: insulin | |
| Participants | INCLUSION CRITERIA:
EXCLUSION CRITERIA:
DIAGNOSTIC CRITERIA: FPG > 6 mmol/L on 2 occasions NUMBER OF PATIENTS WITH PREVIOUS CARDIOVASCULAR DISEASE: Sulphonylurea: NR Control: NR NUMBER OF PATIENTS TREATED WITH ASPIRIN/ANTIHYPERTENSIVES/LIPID‐LOWERING: Sulphonylurea 1: 9/69/2 Sulphonylurea 2: 7/69/0 Sulphonylurea: NR/NR/NR Control: insulin: 16/97/2 | |
| Interventions | NUMBER OF STUDY CENTRES: 23 COUNTRY/LOCATION: United Kingdom SETTING: outpatients TREATMENT BEFORE STUDY: diet TITRATION PERIOD: the antidiabetic interventions were up titrated during the intervention period to achieve/maintain glycaemic target GLYCAEMIC TARGET: the aim of intensive treatment was FPG less than 6 mmol/L and, in insulin‐treated patients, pre‐meal glucose concentrations of 4 to 7 mmol/L | |
| Outcomes | OUTCOME(S) (as stated in the protocol/registered trial documents): any diabetes‐related outcome, diabetes‐related death, all‐cause mortality, single components of macrovascular and microvascular outcomes, surrogate clinical outcomes, hyperglycaemic, quality of life | |
| Study details | RUN‐IN PERIOD: 3 months DURATION OF INTERVENTION: 10.0 years DURATION OF FOLLOW‐UP: 10.0 years STUDY TERMINATED BEFORE REGULAR END: no | |
| Publication details | LANGUAGE OF PUBLICATION: English COMMERCIAL FUNDING/NON‐COMMERCIAL FUNDING PUBLICATION STATUS: peer‐reviewed journal | |
| Stated aim of study | Quote: "We compared the effects of intensive blood‐glucose control with either sulphonylurea or insulin and conventional treatment on the risk of microvascular and macrovascular complications in patients with type 2 diabetes in a randomised controlled trial." | |
| Notes | The number of patients treated with aspirin/antihypertensives/lipid‐lowering are only for the participants in glucose study 1. The number for aspirin is the number taking more than one a day, the number for antihypertensives are other than diuretics. We have not included data from the conventional intervention group in the UKPDS, as it had another glycaemic target. | |
| Risk of bias | ||
| Bias | Authors' judgement | Support for judgement |
| Random sequence generation (selection bias) | Low risk | Quote: "Randomisation was by means of centrally produced, computer‐generated therapy allocations in sealed, opaque envelopes which were opened in sequence." |
| Allocation concealment (selection bias) | Low risk | Quote: "Randomisation was by means of centrally produced, computer‐generated therapy allocations in sealed, opaque envelopes which were opened in sequence." |
| Blinding of participants and personnel (performance bias) | High risk | Open‐label design: "The trial was open once patients were randomised" |
| Blinding of outcome assessment (detection bias) | Low risk | Quote: "Members of the UKPDS end‐point committee, who were unaware of assignments to study groups, adjudicated outcomes.." |
| Incomplete outcome data (attrition bias) | Unclear risk | Loss to follow‐up for each of the antidiabetic drug groups is not clearly described |
| Selective reporting (reporting bias) | High risk | Quote: "A subsidiary comparison is between those allocated to insulin and those allocated to sulphonylurea in all the randomisation groups to assess whether either has a specific risk or advantage." Not all the participants randomised in the sulphonylurea group are reported in the major comparison, as the primary and secondary outcomes for the participants randomised to glipizide and chlorpropamide in the Glucose II trial are not reported |
| Academic bias | Low risk | Primary author's first publication on the interventions |
| Sponsor bias | High risk | Received funding from pharmaceutical company |
| Trials according to risk of bias | Unclear risk | Adequate sequence generation and allocation concealment, inadequate blinding of participants and investigators |
| Methods | PARALLEL RANDOMISED CONTROLLED CLINICAL TRIAL DOUBLE‐BLIND/OPEN‐LABEL: open‐label INTERVENTIONS USED IN TRIALS: Sulphonylurea 1: chlorpropamide Sulphonylurea 2: glibenclamide Control 1: metformin Control 2: insulin | |
| Participants | INCLUSION CRITERIA:
EXCLUSION CRITERIA:
DIAGNOSTIC CRITERIA: fasting plasma glucose > 6 mmol/L on 2 occasions NUMBER OF PATIENTS WITH PREVIOUS CARDIOVASCULAR DISEASE: Sulphonylurea 1: NR Sulphonylurea 2: NR Control 1: NR Control 2: NR NUMBER OF PATIENTS TREATED WITH ASPIRIN/ANTIHYPERTENSIVES/LIPID‐LOWERING: Sulphonylurea 1: 5/40/2 Sulphonylurea 2: 3/44/2 Control 1: 5/51/1 Control 2: 12/49/1 | |
| Interventions | NUMBER OF STUDY CENTRES: 15 COUNTRY/LOCATION: United Kingdom SETTING: outpatients TREATMENT BEFORE STUDY: diet TITRATION PERIOD: the antidiabetic interventions were up titrated during the intervention period to achieve/maintain glycaemic target GLYCAEMIC TARGET: the aim of intensive treatment was FPG less than 6 mmol/L and, in insulin‐treated patients, pre‐meal glucose concentrations of 4 to 7 mmol/L | |
| Outcomes | OUTCOME(S) (as stated in the protocol/registered trial documents): any diabetes‐related outcome, diabetes‐related death, all‐cause mortality, single components of macrovascular and microvascular outcomes, surrogate clinical outcomes, hyperglycaemic, quality of life | |
| Study details | RUN‐IN PERIOD: 3 months DURATION OF INTERVENTION: 10.7 years DURATION OF FOLLOW‐UP: 10.7 years STUDY TERMINATED BEFORE REGULAR END: no | |
| Publication details | LANGUAGE OF PUBLICATION: English COMMERCIAL FUNDING/NON‐COMMERCIAL FUNDING PUBLICATION STATUS: peer‐reviewed journal | |
| Stated aim of study | Quote: "This study investigated whether intensive glucose control with metformin has any specific advantage or disadvantage." | |
| Notes | The number for aspirin is the number taken more than one a day, the number for antihypertensives are other than diuretics. We have not included data from the conventional intervention group in the UKPDS, as it had another glycaemic target | |
| Risk of bias | ||
| Bias | Authors' judgement | Support for judgement |
| Random sequence generation (selection bias) | Low risk | We assume the same method was applied as in UKPDS 1998 |
| Allocation concealment (selection bias) | Low risk | Quote: "....allocations in sealed, opaque envelopes which were opened in sequence." |
| Blinding of participants and personnel (performance bias) | High risk | Open‐label design |
| Blinding of outcome assessment (detection bias) | Low risk | We assume the same method was applied as in UKPDS 1998 |
| Incomplete outcome data (attrition bias) | Unclear risk | Loss to follow‐up for each of the antidiabetic drug groups is not clearly described |
| Selective reporting (reporting bias) | High risk | Quote: "The response to metformin therapy in the obese subjects is assessed by comparison with those allocated to diet policy and to sulphonylurea therapy." However, this comparison has never been reported. |
| Academic bias | Low risk | Primary author's first publication on the interventions |
| Sponsor bias | High risk | Received funding from pharmaceutical company |
| Trials according to risk of bias | Unclear risk | Adequate sequence generation, allocation concealment and blinding of outcome assessors, inadequate blinding of participants and investigators |
| Methods | PARALLEL RANDOMISED CONTROLLED CLINICAL TRIAL DOUBLE‐BLIND/OPEN‐LABEL: double‐blind INTERVENTIONS USED IN TRIALS: Sulphonylurea: tolbutamide Control: acarbose | |
| Participants | INCLUSION CRITERIA:
EXCLUSION CRITERIA:
DIAGNOSTIC CRITERIA: Symptoms suggestive of diabetes mellitus and a capillary FBG ≥ 6.7 mmol/L or patients in whom a raised blood glucose level was found coincidentally For patients without symptoms more than 1 abnormal fasting blood glucose was needed NUMBER OF PATIENTS WITH PREVIOUS CARDIOVASCULAR DISEASE: Sulphonylurea: NR Control: NR NUMBER OF PATIENTS TREATED WITH ASPIRIN/ANTIHYPERTENSIVES/LIPID‐LOWERING: Sulphonylurea: NR/11/3 Control: NR/3/4 | |
| Interventions | NUMBER OF STUDY CENTRES: 46 COUNTRY/LOCATION: The Netherlands SETTING: outpatients, general practice TREATMENT BEFORE STUDY: diet TITRATION PERIOD: 6 weeks GLYCAEMIC TARGET: FBG less than 6.7 mmol/L | |
| Outcomes | OUTCOME(S) (as stated in the protocol/registered trial documents): HbA1c, fasting and post‐load blood glucose and insulin levels, lipids and adverse events | |
| Study details | RUN‐IN PERIOD: 8 weeks DURATION OF INTERVENTION: 30 weeks DURATION OF FOLLOW‐UP: 30 weeks STUDY TERMINATED BEFORE REGULAR END: no | |
| Publication details | LANGUAGE OF PUBLICATION: English COMMERCIAL FUNDING PUBLICATION STATUS: peer‐reviewed journal | |
| Stated aim of study | Quote: "We performed a double blind randomised controlled trial in general practice to assess equivalence between tolbutamide and acarbose with respect to the effect on mean HbA1c in newly diagnosed patients with type 2 diabetes." | |
| Notes | Number of patients on antihypertensive is the number receiving agent acting on the renin‐angiotensin system | |
| Risk of bias | ||
| Bias | Authors' judgement | Support for judgement |
| Random sequence generation (selection bias) | Low risk | Quote: "We performed a double blind randomised controlled trial in general practice to assess equivalence between tolbutamide and acarbose with respect to the effect on mean HbA1c in newly diagnosed patients with type 2 diabetes." |
| Allocation concealment (selection bias) | Low risk | Quote: "The clinical quality assurance manager kept the allocation schedule in a central study file not accessible to the participating general practitioners. The code was sent to the general practitioner in a sealed radio‐opaque envelope that was only to be broken in case of a medical emergency. At the end of the study the envelope had to be returned unopened." |
| Blinding of participants and personnel (performance bias) | Low risk | Quote: "Because of the different sizes of the actual tablets it was necessary to use the so‐called ‘double dummy’ technique to ensure blinding. All patients received two sets of pills, apparently acarbose and tolbutamide, but only one set contained an active substance." |
| Blinding of outcome assessment (detection bias) | Low risk | We assume the outcome assessors were blinded |
| Incomplete outcome data (attrition bias) | Low risk | All loss to follow‐up described |
| Selective reporting (reporting bias) | Low risk | All primary and secondary outcomes reported |
| Academic bias | Low risk | Primary author's first publication on the interventions |
| Sponsor bias | High risk | Sponsored by pharmaceutical company |
| Trials according to risk of bias | Low risk | Adequate sequence generation, allocation concealment and blinding |
| Methods | PARALLEL RANDOMISED CONTROLLED CLINICAL TRIAL DOUBLE‐BLIND/OPEN‐LABEL: not described, we assume open‐label INTERVENTIONS USED IN TRIALS: Sulphonylurea: glibenclamide Control: pioglitazone | |
| Participants | INCLUSION CRITERIA:
EXCLUSION CRITERIA:
DIAGNOSTIC CRITERIA: FPG > 126 mg/dL NUMBER OF PATIENTS WITH PREVIOUS CARDIOVASCULAR DISEASE: Sulphonylurea: NR Control: NR NUMBER OF PATIENTS TREATED WITH ASPIRIN/ANTIHYPERTENSIVES/LIPID‐LOWERING: Sulphonylurea: NR/11/13 Control: NR/8/14 | |
| Interventions | NUMBER OF STUDY CENTRES: 1 COUNTRY/LOCATION: Japan SETTING: outpatients TREATMENT BEFORE STUDY: diet TITRATION PERIOD: NR GLYCAEMIC TARGET: decrease of plasma glucose level equivalent to a decline of 0.6% in terms of HbA1c in 6 months | |
| Outcomes | OUTCOME(S) (as stated in the protocol/registered trial documents): change in pulse‐wave velocity, BMI, blood pressure, brachial‐ankle pulse‐wave velocity, FPG, HbA1c, fasting immunoreactive insulin, homeostasis model insulin resistance index, total cholesterol, low‐density lipoprotein cholesterol, high‐density lipoprotein cholesterol and triglyceride | |
| Study details | RUN‐IN PERIOD: NR DURATION OF INTERVENTION: 6 months DURATION OF FOLLOW‐UP: 6 months STUDY TERMINATED BEFORE REGULAR END: no | |
| Publication details | LANGUAGE OF PUBLICATION: English COMMERCIAL FUNDING/NON‐COMMERCIAL FUNDING: NR PUBLICATION STATUS: peer‐reviewed journal | |
| Stated aim of study | Quote: "To investigate the anti‐arteriosclerotic effects of pioglitazone in patients with diabetes mellitus using pulse wave velocity (PWV) as an index of efficacy" | |
| Notes | Number of patients with antihypertensives reported are only ACE‐inhibitors | |
| Risk of bias | ||
| Bias | Authors' judgement | Support for judgement |
| Random sequence generation (selection bias) | Unclear risk | Quote: "They were randomly divided into two groups..." |
| Allocation concealment (selection bias) | Low risk | Quote: "They were randomly divided into two groups by the envelope method (when the patient was registered, we opened the envelope in which contained either a card printed for pioglitazone (PIO) or for glibenclamide (GC) and followed the instructions), and assigned to receive either PIO or GC." |
| Blinding of participants and personnel (performance bias) | High risk | We assume open‐label, no blinding described |
| Blinding of outcome assessment (detection bias) | High risk | We assume open‐label, no blinding described |
| Incomplete outcome data (attrition bias) | Low risk | Quote: "In the PIO group, drug administration was discontinued in two patients because of the development of edema. In the GC group, drug administration was discontinued in one patient because of signs of hypoglycemia. Therefore, a total of three patients were excluded from the present study." |
| Selective reporting (reporting bias) | Unclear risk | No trial protocol or design article available |
| Academic bias | Low risk | Primary author's first publication on the interventions |
| Sponsor bias | Unclear risk | Funding not reported |
| Trials according to risk of bias | Unclear risk | Unclear sequence generation, adequate allocation concealment, inadequate blinding |
| Methods | CROSS‐OVER RANDOMISED CONTROLLED CLINICAL TRIAL DOUBLE‐BLIND/OPEN‐LABEL: open‐label INTERVENTIONS USED IN TRIALS: Sulphonylurea: tolbutamide Control: insulin | |
| Participants | INCLUSION CRITERIA:
EXCLUSION CRITERIA:
DIAGNOSTIC CRITERIA: WHO NUMBER OF PATIENTS WITH PREVIOUS CARDIOVASCULAR DISEASE: Sulphonylurea: NR Control: NR NUMBER OF PATIENTS TREATED WITH ASPIRIN/ANTIHYPERTENSIVES/LIPID‐LOWERING: Sulphonylurea: NR Control: NR | |
| Interventions | NUMBER OF STUDY CENTRES: 1 COUNTRY/LOCATION: The Netherlands SETTING: outpatients TREATMENT BEFORE STUDY: diet or exercise TITRATION PERIOD: NR GLYCAEMIC TARGET: FBG < 8.0 mmol/L, HbA1c < 9% | |
| Outcomes | OUTCOME(S) (as stated in the protocol/registered trial documents): glycaemic control, beta‐cell function and lipids | |
| Study details | RUN‐IN PERIOD: 3 months DURATION OF INTERVENTION: 6 months DURATION OF FOLLOW‐UP: 6 months STUDY TERMINATED BEFORE REGULAR END: no | |
| Publication details | LANGUAGE OF PUBLICATION: English COMMERCIAL FUNDING PUBLICATION STATUS: peer‐reviewed journal | |
| Stated aim of study | Quote: "In 13 non‐obese patients with Type 2 diabetes mellitus who failed to achieve adequate blood glucose control on dietary treatment (fasting blood glucose 13.4 +/‐ 2.7 (+/‐ SD) mmol l‐1, glycosylated haemoglobin 13.0 +/‐ 1.7%), the effects of 6 months insulin or sulphonylurea therapy on blood glucose control and lipid metabolism were compared in a randomized crossover study." | |
| Notes | Group of healthy controls not included in the analyses | |
| Risk of bias | ||
| Bias | Authors' judgement | Support for judgement |
| Random sequence generation (selection bias) | Unclear risk | Quote: "Patients were randomly assigned to start either therapy." |
| Allocation concealment (selection bias) | Unclear risk | NR |
| Blinding of participants and personnel (performance bias) | High risk | Open‐label design |
| Blinding of outcome assessment (detection bias) | High risk | We assume not blinded |
| Incomplete outcome data (attrition bias) | Unclear risk | Loss to follow‐up not adequately described |
| Selective reporting (reporting bias) | Unclear risk | No protocol or design article |
| Academic bias | Low risk | Primary author's first publication on the interventions |
| Sponsor bias | High risk | Received grant from industry |
| Trials according to risk of bias | Unclear risk | Unclear sequence generation and allocation concealment, inadequate blinding |
| Methods | PARALLEL RANDOMISED CONTROLLED CLINICAL TRIAL DOUBLE‐BLIND/OPEN‐LABEL: double‐blind INTERVENTIONS USED IN TRIALS: Sulphonylurea: glibenclamide Control: repaglinide | |
| Participants | INCLUSION CRITERIA:
EXCLUSION CRITERIA:
DIAGNOSTIC CRITERIA: WHO NUMBER OF PATIENTS WITH PREVIOUS CARDIOVASCULAR DISEASE: Sulphonylurea: NR Comparator: NR NUMBER OF PATIENTS TREATED WITH ASPIRIN/ANTIHYPERTENSIVES/LIPID‐LOWERING: Sulphonylurea: NR Comparator: NR | |
| Interventions | NUMBER OF STUDY CENTRES: 42 COUNTRY/LOCATION: The Netherlands, Germany and Austria SETTING: outpatients TREATMENT BEFORE STUDY: diet and/or oral antidiabetic drugs TITRATION PERIOD: 6 to 8 weeks GLYCAEMIC TARGET: Targets for treatment were fasting blood glucose of 4.4 to 6.1 mmol/L and postprandial levels of 4.4 to 8.0 mmol/L and HbA1c < 6.5% | |
| Outcomes | OUTCOME(S) (as stated in the protocol/registered trial documents): glycaemic values, insulin, lipids, hypoglycaemia and adverse events | |
| Study details | RUN‐IN PERIOD: 1 week DURATION OF INTERVENTION: 12 months + 6 to 8 weeks DURATION OF FOLLOW‐UP: 12 months + 6 to 8 weeks STUDY TERMINATED BEFORE REGULAR END: no | |
| Publication details | LANGUAGE OF PUBLICATION: English COMMERCIAL FUNDING PUBLICATION STATUS: peer‐reviewed journal | |
| Stated aim of study | Quote: "This multicenter study was designed to compare the efficacy and safety of this drug with glyburide in a 1‐year randomized double‐blind study of outpatients with type 2 diabetes." | |
| Notes | ||
| Risk of bias | ||
| Bias | Authors' judgement | Support for judgement |
| Random sequence generation (selection bias) | Unclear risk | Quote: "The patients visited the outpatient clinic 1 week later and were asymmetrically randomized into blocks of six patients per treatment group in a 2:1 ratio of repaglinide to glyburide." |
| Allocation concealment (selection bias) | Unclear risk | NR |
| Blinding of participants and personnel (performance bias) | Low risk | Quote: "To maintain the thrice‐daily dosing regimen, the glyburide group received placebo tablets at meals where no glyburide was taken." |
| Blinding of outcome assessment (detection bias) | Low risk | As the trial is double‐blinded and we assume the doctor assessed the outcome, we judged blinding as outcome assessors as low risk of bias |
| Incomplete outcome data (attrition bias) | Low risk | Loss to follow‐up not adequately described |
| Selective reporting (reporting bias) | Low risk | Primary and secondary outcomes assessed as predefined |
| Academic bias | Low risk | Primary author's first publication on the interventions |
| Sponsor bias | High risk | Sponsored by pharmaceutical company |
| Trials according to risk of bias | Unclear risk | Unclear sequence generation and allocation concealment, adequate blinding |
| Methods | PARALLEL RANDOMISED CONTROLLED CLINICAL TRIAL DOUBLE‐BLIND/OPEN‐LABEL: NR, we assume open‐label INTERVENTIONS USED IN TRIALS: Sulphonylurea: glimepiride Control 1: pioglitazone Control 2: metformin | |
| Participants | INCLUSION CRITERIA:
EXCLUSION CRITERIA:
DIAGNOSTIC CRITERIA: NR NUMBER OF PATIENTS WITH PREVIOUS CARDIOVASCULAR DISEASE: Sulphonylurea: NR Control 1: NR NUMBER OF PATIENTS TREATED WITH ASPIRIN/ANTIHYPERTENSIVES/LIPID‐LOWERING: Sulphonylurea: NR/18/0 Control 1: NR/16/0 Control 2: NR/18/0 | |
| Interventions | NUMBER OF STUDY CENTRES: NR COUNTRY/LOCATION: Japan SETTING: outpatients TREATMENT BEFORE STUDY: diet TITRATION PERIOD: NR GLYCAEMIC TARGET: HbA1c ≤ 7% | |
| Outcomes | OUTCOME(S) (as stated in the protocol/registered trial documents): HbA1c, metabolic variables | |
| Study details | RUN‐IN PERIOD: 1 month DURATION OF INTERVENTION: 12 months DURATION OF FOLLOW‐UP: 12 months STUDY TERMINATED BEFORE REGULAR END: no | |
| Publication details | LANGUAGE OF PUBLICATION: English COMMERCIAL FUNDING/NON‐COMMERCIAL FUNDING: NR PUBLICATION STATUS: peer‐reviewed journal | |
| Stated aim of study | Quote: "To compare the metabolic effects of pioglitazone, metformin, and glimepiride in the treatment of Japanese patients with newly diagnosed Type 2 diabetes." | |
| Notes | ||
| Risk of bias | ||
| Bias | Authors' judgement | Support for judgement |
| Random sequence generation (selection bias) | Low risk | Quote: "Random assignment was determined by the biostatistician, who provided sealed sequentially numbered envelopes opened only at the time of randomization." |
| Allocation concealment (selection bias) | Low risk | Quote: "Random assignment was determined by the biostatistician, who provided sealed sequentially numbered envelopes opened only at the time of randomization." |
| Blinding of participants and personnel (performance bias) | High risk | Blinding not described, we assume open‐label design |
| Blinding of outcome assessment (detection bias) | High risk | Blinding not described, we assume open‐label design |
| Incomplete outcome data (attrition bias) | Low risk | All loss to follow‐up sufficiently described |
| Selective reporting (reporting bias) | Unclear risk | No trial protocol or design article available |
| Academic bias | Low risk | Primary author's first publication on the interventions |
| Sponsor bias | Unclear risk | Funding not reported |
| Trials according to risk of bias | Unclear risk | Adequate sequence generation and allocation concealment, inadequate blinding |
| Methods | PARALLEL RANDOMISED CONTROLLED CLINICAL TRIAL DOUBLE‐BLIND/OPEN‐LABEL: open‐label INTERVENTIONS USED IN TRIALS: Sulphonylurea: glipizide Comparator: rosiglitazone | |
| Participants | INCLUSION CRITERIA:
EXCLUSION CRITERIA:
DIAGNOSTIC CRITERIA: WHO criteria 1999 NUMBER OF PATIENTS WITH PREVIOUS CARDIOVASCULAR DISEASE: Sulphonylurea: 0 Comparator: 0 NUMBER OF PATIENTS TREATED WITH ASPIRIN/ANTIHYPERTENSIVE/LIPID‐LOWERING: Sulphonylurea: NR Comparator: NR | |
| Interventions | NUMBER OF STUDY CENTRES: 24 COUNTRY/LOCATION: China SETTING: outpatients TREATMENT BEFORE STUDY: treatment‐naive TITRATION PERIOD: NR GLYCAEMIC TARGET: NR | |
| Outcomes | OUTCOME(S) (as stated in the protocol/registered trial documents): biochemical variables, carotis intima‐media thickness | |
| Study details | RUN‐IN PERIOD: NR DURATION OF INTERVENTION: 6 months DURATION OF FOLLOW‐UP: 6 months STUDY TERMINATED BEFORE REGULAR END: no | |
| Publication details | LANGUAGE OF PUBLICATION: Chinese NON‐COMMERCIAL FUNDING PUBLICATION STATUS: peer‐reviewed journal | |
| Stated aim of study | Quote "To study the effects of thiazolidinediones (TZDs) on anti‐atherosclerosis in elder male patients with type 2 diabetes, and understand related factors induced this function." | |
| Notes | The 2 rosiglitazone groups are meta‐analysed as 1 group | |
| Risk of bias | ||
| Bias | Authors' judgement | Support for judgement |
| Random sequence generation (selection bias) | Unclear risk | Quote: "Randomly allocated into 3 groups." |
| Allocation concealment (selection bias) | Unclear risk | NR |
| Blinding of participants and personnel (performance bias) | High risk | Open‐label design |
| Blinding of outcome assessment (detection bias) | High risk | Outcome assessors not blinded |
| Incomplete outcome data (attrition bias) | Low risk | "All of the included patients completed 6 months’ follow‐up." |
| Selective reporting (reporting bias) | Unclear risk | Not clearly stated |
| Academic bias | Low risk | Primary author's first publication on the interventions |
| Sponsor bias | Low risk | Quote: "This trial was supported by Chinese Medical Care Centre Foundation, No. HeiB055." |
| Trials according to risk of bias | Unclear risk | Unclear sequence generation and allocation concealment, inadequate blinding |
ACE: angiotension converting enzyme; ADA: American Diabetes Association; ADOPT: A Diabetes Outcome Progression Trial; (cyclic) AMP: adenosine monophosphate;APPROACH: Assessment on the Prevention of Progression by Rosiglitazone on Atherosclerosis in Type 2 Diabetes Patients with Cardiovascular History; BMI: body mass index; FBG: fasting blood glucose; FPG: fasting plasma glucose; HbA1c: glycosylated haemoglobin A1c; LEAD‐3: Liraglutide Effect and Action in Diabetes‐3; NR: not reported; NYHA: New York Heart Association; PPG: postprandial plasma glucose; T2DM: type 2 diabetes mellitus; UKPDS: United Kingdom Prospective Diabetes Study; WHO: World Health Organization
Characteristics of excluded studies [ordered by study ID]
Ir a:
| Study | Reason for exclusion |
| Duration of intervention less than 24 weeks | |
| Not a randomised clinical trial | |
| Not a randomised clinical trial. | |
| Not comparing interventions of interest. Comparing gliclazide with a mixed group of sulphonylureas. Participants in diet group are not randomised. | |
| Not a randomised clinical trial | |
| Not a randomised clinical trial | |
| Not comparing interventions of interest. Comparing glimepiride with glibenclamide. | |
| Not a randomised clinical trial | |
| Not a randomised clinical trial | |
| Not including patients with T2DM | |
| Not comparing interventions of interest. Patients are randomised to insulin provision regime (not only sulphonylureas). | |
| Duration of intervention less than 24 weeks | |
| Not a randomised clinical trial | |
| Not a randomised clinical trial | |
| Duration of intervention less than 24 weeks | |
| Not a randomised clinical trial | |
| Not a randomised clinical trial | |
| Not a randomised clinical trial | |
| Duration of intervention less than 24 weeks | |
| Not a randomised clinical trial | |
| Duration of intervention less than 24 weeks | |
| Not a randomised clinical trial | |
| Not comparing interventions of interest. Comparing gliclazide with glibenclamide. | |
| Not a randomised clinical trial. Authors asked and replied. | |
| Not a randomised clinical trial | |
| Not a randomised clinical trial | |
| Not comparing the interventions of interest. Metformin is continued after the randomisation. | |
| Not comparing interventions of interest. Comparing glimepiride with glibenclamide. | |
| Not a randomised clinical trial | |
| Not comparing interventions of interest. Comparing 2 different formulas of gliclazide. | |
| Not comparing interventions of interest. Comparing 2 different formulas of gliclazide. | |
| Not a randomised clinical trial | |
| Includes also patients with normal glucose tolerance | |
| Not a randomised clinical trial | |
| Not a randomised clinical trial | |
| Duration of intervention in publication less than 24 weeks. Report that data after 1 year of intervention will be published, but publication could not be found. Attempt made to contact authors. | |
| Duration of intervention less than 24 weeks | |
| Duration of intervention less than 24 weeks | |
| Not a randomised clinical trial | |
| Not comparing the interventions of interest. Patients are not exclusively allocated to sulphonylurea monotherapy, but some of the patients receive insulin in combination with sulphonylurea. | |
| Not comparing the interventions of interest. Metformin is continued after the randomisation. | |
| Duration of intervention less than 24 weeks | |
| Not comparing the interventions of interest | |
| Not a randomised clinical trial | |
| Not a randomised clinical trial | |
| Duration of intervention less than 24 weeks | |
| Not a randomised clinical trial | |
| Duration of intervention less than 24 weeks | |
| Not a randomised clinical trial | |
| Not a randomised clinical trial | |
| Not comparing the interventions of interest. The 3 randomised groups receive glibenclamide. | |
| Not comparing the interventions of interest. Comparing glimepiride with glibenclamide/gliclazide. | |
| Duration of intervention less than 24 weeks | |
| Not a randomised clinical trial | |
| Not a randomised clinical trial | |
| Not comparing interventions of interest. The randomised groups receive gliclazide and glibenclamide. | |
| Duration of intervention less than 24 weeks | |
| Duration of intervention less than 24 weeks | |
| Duration of intervention less than 24 weeks | |
| Not a randomised clinical trial | |
| Not a randomised clinical trial | |
| Not comparing the interventions of interest. Metformin is continued after the randomisation. | |
| Duration of intervention less than 24 weeks | |
| Duration of intervention less than 24 weeks | |
| Not comparing the interventions of interest. The group randomised to insulin secretagogues receives both sulphonylurea and repaglinide. | |
| Duration of intervention less than 24 weeks | |
| Duration of intervention less than 24 weeks | |
| Duration of intervention less than 24 weeks | |
| Not a randomised clinical trial | |
| Duration of intervention less than 24 weeks | |
| Not comparing the interventions of interest. Metformin is continued after the randomisation. Correspondence with author. | |
| Duration of intervention less than 24 weeks | |
| Not comparing the interventions of interest. Comparing glibornuride with glibenclamide. | |
| Duration of intervention less than 24 weeks | |
| Not comparing the interventions of interest. Comparing glibenclamide with gliquidone. | |
| Not comparing the interventions of interest. Metformin is continued after the randomisation. Clarified after e‐mailing with corresponding author. | |
| Duration of intervention less than 24 weeks | |
| Only published as abstract, and the patients described as divided. Attempt to contact primary author. We assume not a randomised clinical trial. | |
| Not including patients with type 2 diabetes mellitus | |
| Duration of intervention less than 24 weeks for each randomised group in the cross‐over trial | |
| Not comparing the interventions of interest. Metformin is continued after the randomisation. | |
| Not randomising participants to the intervention of interest, but only randomising patients to placebo or hydroxychloroquine in addition to glibenclamide. | |
| Not comparing the interventions of interest. Metformin is continued after the randomisation. | |
| Not comparing the interventions of interest. Investigates the effect of combination therapy. | |
| Not comparing the interventions of interest. Comparing glibenclamide with glipizide. | |
| Not a randomised clinical trial | |
| Not a randomised clinical trial | |
| Not comparing the interventions of interest. Comparing glibenclamide with glipizide. | |
| Not a randomised clinical trial | |
| Not comparing the interventions of interest. Metformin and alpha‐glucose inhibitors are continued after the randomisation. | |
| Not comparing the interventions of interest. Metformin is continued after the randomisation. | |
| Only published as abstract, and the patients described as divided. Attempt to contact primary author. We assume not a randomised clinical trial. | |
| Duration of intervention less than 24 weeks | |
| Not comparing the interventions of interest. Metformin is continued after the randomisation. | |
| Not comparing interventions of interest. Other antidiabetic intervention is not stopped at entry to trial. | |
| Duration of intervention less than 24 weeks | |
| Not comparing the interventions of interest. Comparing glimepiride with gliclazide. | |
| Not exclusively including patients with T2DM | |
| Duration of intervention less than 24 weeks | |
| Duration of intervention less than 24 weeks | |
| Duration of intervention less than 24 weeks | |
| Not including patients with T2DM | |
| Duration of intervention less than 24 weeks |
T2DM: type 2 diabetes mellitus
Data and analyses
| Outcome or subgroup title | No. of studies | No. of participants | Statistical method | Effect size |
| 1 All‐cause mortality Show forest plot | 5 | 883 | Risk Ratio (M‐H, Random, 95% CI) | 1.51 [0.91, 2.52] |
| Analysis 1.1  Comparison 1 Sulphonylureas versus placebo, Outcome 1 All‐cause mortality. | ||||
| 1.1 First‐generation SU | 2 | 553 | Risk Ratio (M‐H, Random, 95% CI) | 1.46 [0.87, 2.45] |
| 1.2 Second‐generation SU | 3 | 330 | Risk Ratio (M‐H, Random, 95% CI) | 4.86 [0.24, 99.94] |
| 1.3 Third‐generation SU | 0 | 0 | Risk Ratio (M‐H, Random, 95% CI) | 0.0 [0.0, 0.0] |
| 2 All‐cause mortality; best‐worst case scenario Show forest plot | 1 | 57 | Risk Ratio (M‐H, Random, 95% CI) | 0.0 [0.0, 0.0] |
| Analysis 1.2  Comparison 1 Sulphonylureas versus placebo, Outcome 2 All‐cause mortality; best‐worst case scenario. | ||||
| 2.1 First‐generation SU | 0 | 0 | Risk Ratio (M‐H, Random, 95% CI) | 0.0 [0.0, 0.0] |
| 2.2 Second‐generation SU | 1 | 57 | Risk Ratio (M‐H, Random, 95% CI) | 0.0 [0.0, 0.0] |
| 2.3 Third‐generation SU | 0 | 0 | Risk Ratio (M‐H, Random, 95% CI) | 0.0 [0.0, 0.0] |
| 3 All‐cause mortality; worst‐best case scenario Show forest plot | 1 | 57 | Risk Ratio (M‐H, Random, 95% CI) | 0.0 [0.0, 0.0] |
| Analysis 1.3  Comparison 1 Sulphonylureas versus placebo, Outcome 3 All‐cause mortality; worst‐best case scenario. | ||||
| 3.1 First‐generation SU | 0 | 0 | Risk Ratio (M‐H, Random, 95% CI) | 0.0 [0.0, 0.0] |
| 3.2 Second‐generation SU | 1 | 57 | Risk Ratio (M‐H, Random, 95% CI) | 0.0 [0.0, 0.0] |
| 3.3 Third‐generation SU | 0 | 0 | Risk Ratio (M‐H, Random, 95% CI) | 0.0 [0.0, 0.0] |
| 4 Cardiovascular mortality Show forest plot | 5 | 883 | Risk Ratio (M‐H, Random, 95% CI) | 2.64 [1.35, 5.17] |
| Analysis 1.4 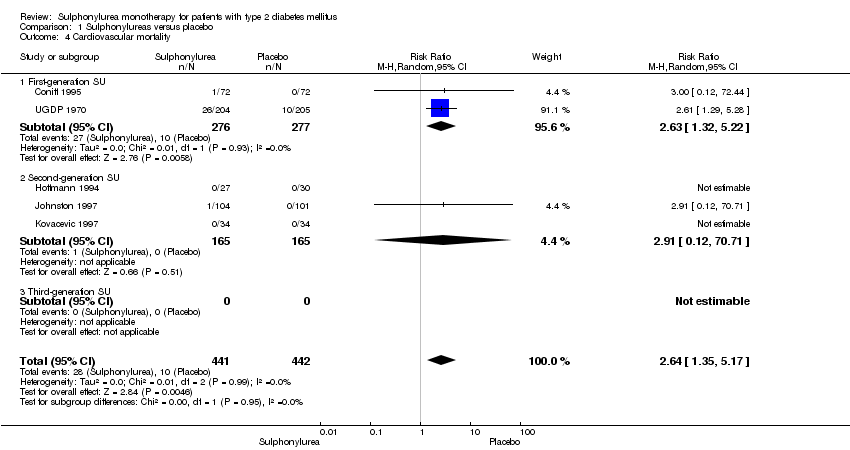 Comparison 1 Sulphonylureas versus placebo, Outcome 4 Cardiovascular mortality. | ||||
| 4.1 First‐generation SU | 2 | 553 | Risk Ratio (M‐H, Random, 95% CI) | 2.63 [1.32, 5.22] |
| 4.2 Second‐generation SU | 3 | 330 | Risk Ratio (M‐H, Random, 95% CI) | 2.91 [0.12, 70.71] |
| 4.3 Third‐generation SU | 0 | 0 | Risk Ratio (M‐H, Random, 95% CI) | 0.0 [0.0, 0.0] |
| 5 Non‐fatal macrovascular outcomes Show forest plot | 1 | 205 | Risk Ratio (M‐H, Random, 95% CI) | 1.32 [0.82, 2.13] |
| Analysis 1.5  Comparison 1 Sulphonylureas versus placebo, Outcome 5 Non‐fatal macrovascular outcomes. | ||||
| 5.1 First‐generation SU | 0 | 0 | Risk Ratio (M‐H, Random, 95% CI) | 0.0 [0.0, 0.0] |
| 5.2 Second‐generation SU | 1 | 205 | Risk Ratio (M‐H, Random, 95% CI) | 1.32 [0.82, 2.13] |
| 5.3 Third‐generation SU | 0 | 0 | Risk Ratio (M‐H, Random, 95% CI) | 0.0 [0.0, 0.0] |
| 6 Non‐fatal myocardial infarction Show forest plot | 1 | 409 | Risk Ratio (M‐H, Random, 95% CI) | 0.80 [0.43, 1.51] |
| Analysis 1.6 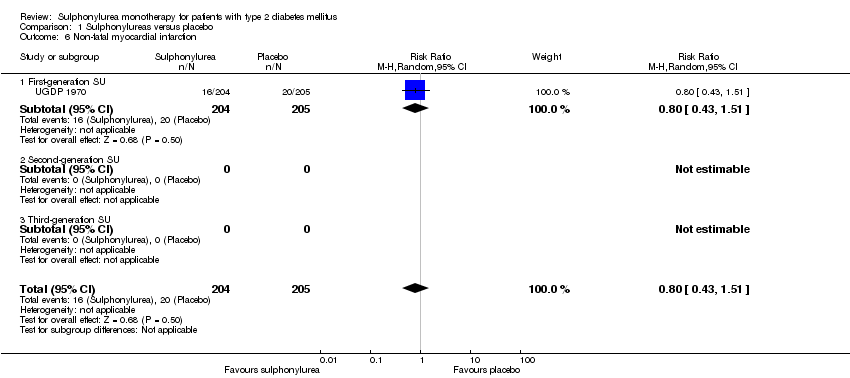 Comparison 1 Sulphonylureas versus placebo, Outcome 6 Non‐fatal myocardial infarction. | ||||
| 6.1 First‐generation SU | 1 | 409 | Risk Ratio (M‐H, Random, 95% CI) | 0.80 [0.43, 1.51] |
| 6.2 Second‐generation SU | 0 | 0 | Risk Ratio (M‐H, Random, 95% CI) | 0.0 [0.0, 0.0] |
| 6.3 Third‐generation SU | 0 | 0 | Risk Ratio (M‐H, Random, 95% CI) | 0.0 [0.0, 0.0] |
| 7 Amputation of lower extremity Show forest plot | 1 | 409 | Risk Ratio (M‐H, Random, 95% CI) | 0.20 [0.01, 4.16] |
| Analysis 1.7  Comparison 1 Sulphonylureas versus placebo, Outcome 7 Amputation of lower extremity. | ||||
| 7.1 First‐generation SU | 1 | 409 | Risk Ratio (M‐H, Random, 95% CI) | 0.20 [0.01, 4.16] |
| 7.2 Second‐generation SU | 0 | 0 | Risk Ratio (M‐H, Random, 95% CI) | 0.0 [0.0, 0.0] |
| 7.3 Third‐generation SU | 0 | 0 | Risk Ratio (M‐H, Random, 95% CI) | 0.0 [0.0, 0.0] |
| 8 Nephropathy Show forest plot | 1 | 409 | Risk Ratio (M‐H, Random, 95% CI) | 1.26 [0.34, 4.61] |
| Analysis 1.8 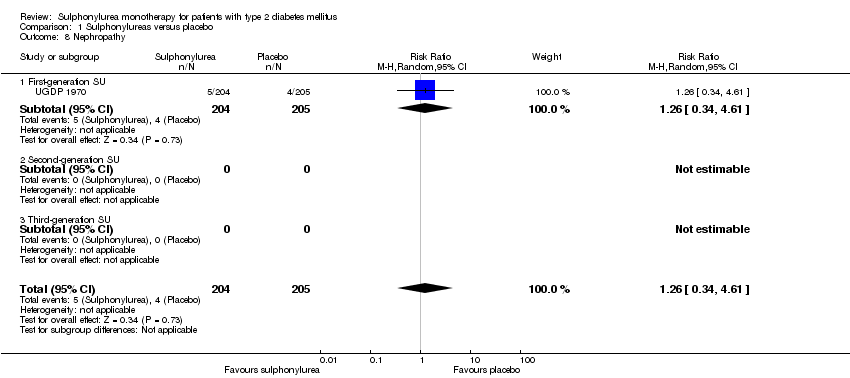 Comparison 1 Sulphonylureas versus placebo, Outcome 8 Nephropathy. | ||||
| 8.1 First‐generation SU | 1 | 409 | Risk Ratio (M‐H, Random, 95% CI) | 1.26 [0.34, 4.61] |
| 8.2 Second‐generation SU | 0 | 0 | Risk Ratio (M‐H, Random, 95% CI) | 0.0 [0.0, 0.0] |
| 8.3 Third‐generation SU | 0 | 0 | Risk Ratio (M‐H, Random, 95% CI) | 0.0 [0.0, 0.0] |
| 9 Retinopathy Show forest plot | 1 | 409 | Risk Ratio (M‐H, Random, 95% CI) | 0.93 [0.67, 1.30] |
| Analysis 1.9 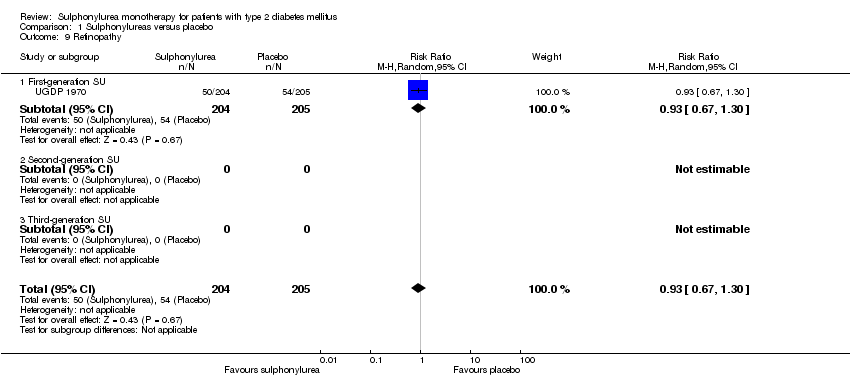 Comparison 1 Sulphonylureas versus placebo, Outcome 9 Retinopathy. | ||||
| 9.1 First‐generation SU | 1 | 409 | Risk Ratio (M‐H, Random, 95% CI) | 0.93 [0.67, 1.30] |
| 9.2 Second‐generation SU | 0 | 0 | Risk Ratio (M‐H, Random, 95% CI) | 0.0 [0.0, 0.0] |
| 9.3 Third‐generation SU | 0 | 0 | Risk Ratio (M‐H, Random, 95% CI) | 0.0 [0.0, 0.0] |
| 10 Change in fasting blood glucose from baseline (mmol/L) Show forest plot | 6 | 342 | Mean Difference (IV, Random, 95% CI) | ‐1.35 [‐2.00, ‐0.69] |
| Analysis 1.10  Comparison 1 Sulphonylureas versus placebo, Outcome 10 Change in fasting blood glucose from baseline (mmol/L). | ||||
| 10.1 First‐generation SU | 1 | 128 | Mean Difference (IV, Random, 95% CI) | ‐2.1 [‐3.19, ‐1.01] |
| 10.2 Second‐generation SU | 5 | 214 | Mean Difference (IV, Random, 95% CI) | ‐1.20 [‐1.94, ‐0.46] |
| 10.3 Third‐generation SU | 0 | 0 | Mean Difference (IV, Random, 95% CI) | 0.0 [0.0, 0.0] |
| 11 Change in HbA1c from baseline (%) Show forest plot | 6 | 342 | Mean Difference (IV, Random, 95% CI) | 1.00 [‐1.21, ‐0.79] |
| Analysis 1.11  Comparison 1 Sulphonylureas versus placebo, Outcome 11 Change in HbA1c from baseline (%). | ||||
| 11.1 First‐generation SU | 1 | 128 | Mean Difference (IV, Random, 95% CI) | ‐0.94 [‐1.29, ‐0.59] |
| 11.2 Second‐generation SU | 5 | 214 | Mean Difference (IV, Random, 95% CI) | ‐1.02 [‐1.32, ‐0.72] |
| 11.3 Third‐generation SU | 0 | 0 | Mean Difference (IV, Random, 95% CI) | 0.0 [0.0, 0.0] |
| 12 Change in BMI from baseline (kg/m2) Show forest plot | 3 | 141 | Mean Difference (IV, Random, 95% CI) | ‐0.09 [‐0.59, 0.41] |
| Analysis 1.12  Comparison 1 Sulphonylureas versus placebo, Outcome 12 Change in BMI from baseline (kg/m2). | ||||
| 12.1 First‐generation SU | 0 | 0 | Mean Difference (IV, Random, 95% CI) | 0.0 [0.0, 0.0] |
| 12.2 Second‐generation SU | 3 | 141 | Mean Difference (IV, Random, 95% CI) | ‐0.09 [‐0.59, 0.41] |
| 12.3 Third‐generation SU | 0 | 0 | Mean Difference (IV, Random, 95% CI) | 0.0 [0.0, 0.0] |
| 13 Change in weight from baseline (kg) Show forest plot | 1 | 128 | Mean Difference (IV, Random, 95% CI) | ‐0.40 [‐1.36, 0.56] |
| Analysis 1.13 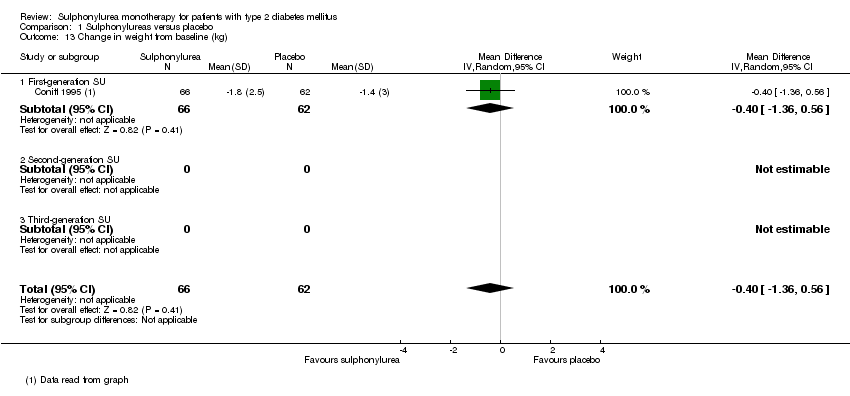 Comparison 1 Sulphonylureas versus placebo, Outcome 13 Change in weight from baseline (kg). | ||||
| 13.1 First‐generation SU | 1 | 128 | Mean Difference (IV, Random, 95% CI) | ‐0.40 [‐1.36, 0.56] |
| 13.2 Second‐generation SU | 0 | 0 | Mean Difference (IV, Random, 95% CI) | 0.0 [0.0, 0.0] |
| 13.3 Third‐generation SU | 0 | 0 | Mean Difference (IV, Random, 95% CI) | 0.0 [0.0, 0.0] |
| 14 Adverse events Show forest plot | 3 | 346 | Risk Ratio (M‐H, Random, 95% CI) | 1.23 [0.92, 1.64] |
| Analysis 1.14 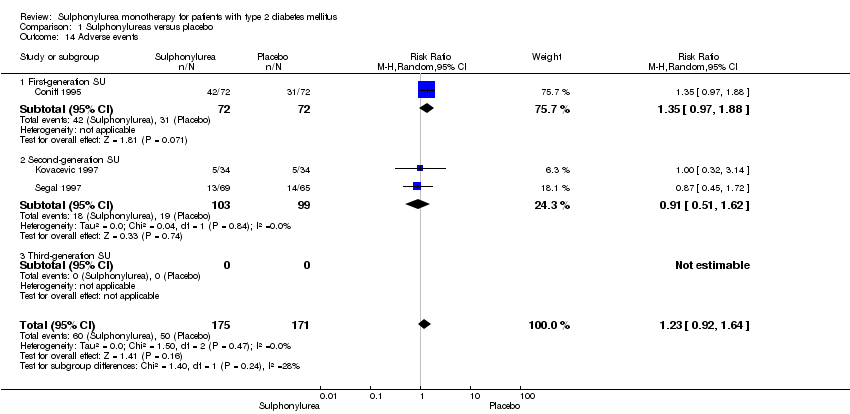 Comparison 1 Sulphonylureas versus placebo, Outcome 14 Adverse events. | ||||
| 14.1 First‐generation SU | 1 | 144 | Risk Ratio (M‐H, Random, 95% CI) | 1.35 [0.97, 1.88] |
| 14.2 Second‐generation SU | 2 | 202 | Risk Ratio (M‐H, Random, 95% CI) | 0.91 [0.51, 1.62] |
| 14.3 Third‐generation SU | 0 | 0 | Risk Ratio (M‐H, Random, 95% CI) | 0.0 [0.0, 0.0] |
| 15 Drop‐outs due to adverse events Show forest plot | 6 | 654 | Risk Ratio (M‐H, Random, 95% CI) | 0.67 [0.33, 1.36] |
| Analysis 1.15  Comparison 1 Sulphonylureas versus placebo, Outcome 15 Drop‐outs due to adverse events. | ||||
| 15.1 First‐generation SU | 1 | 144 | Risk Ratio (M‐H, Random, 95% CI) | 0.75 [0.17, 3.23] |
| 15.2 Second‐generation SU | 5 | 510 | Risk Ratio (M‐H, Random, 95% CI) | 0.62 [0.24, 1.57] |
| 15.3 Third‐generation SU | 0 | 0 | Risk Ratio (M‐H, Random, 95% CI) | 0.0 [0.0, 0.0] |
| 16 Mild hypoglycaemia Show forest plot | 1 | 134 | Risk Ratio (M‐H, Random, 95% CI) | 12.26 [0.70, 213.33] |
| Analysis 1.16 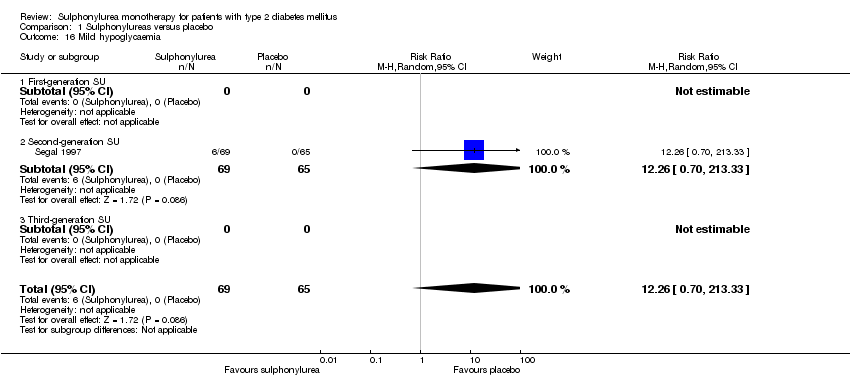 Comparison 1 Sulphonylureas versus placebo, Outcome 16 Mild hypoglycaemia. | ||||
| 16.1 First‐generation SU | 0 | 0 | Risk Ratio (M‐H, Random, 95% CI) | 0.0 [0.0, 0.0] |
| 16.2 Second‐generation SU | 1 | 134 | Risk Ratio (M‐H, Random, 95% CI) | 12.26 [0.70, 213.33] |
| 16.3 Third‐generation SU | 0 | 0 | Risk Ratio (M‐H, Random, 95% CI) | 0.0 [0.0, 0.0] |
| 17 Severe hypoglycaemia Show forest plot | 1 | 46 | Risk Ratio (M‐H, Random, 95% CI) | 0.0 [0.0, 0.0] |
| Analysis 1.17  Comparison 1 Sulphonylureas versus placebo, Outcome 17 Severe hypoglycaemia. | ||||
| 17.1 First‐generation SU | 0 | 0 | Risk Ratio (M‐H, Random, 95% CI) | 0.0 [0.0, 0.0] |
| 17.2 Second‐generation SU | 1 | 46 | Risk Ratio (M‐H, Random, 95% CI) | 0.0 [0.0, 0.0] |
| 17.3 Third‐generation SU | 0 | 0 | Risk Ratio (M‐H, Random, 95% CI) | 0.0 [0.0, 0.0] |
| 18 Cancer Show forest plot | 2 | 614 | Risk Ratio (M‐H, Random, 95% CI) | 0.54 [0.06, 5.05] |
| Analysis 1.18 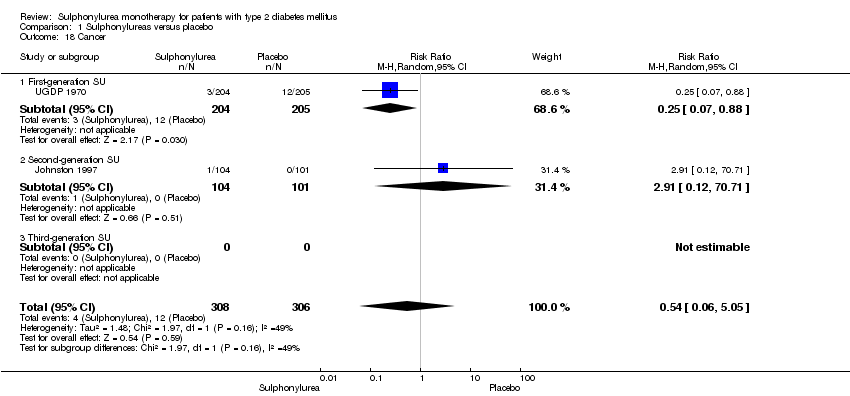 Comparison 1 Sulphonylureas versus placebo, Outcome 18 Cancer. | ||||
| 18.1 First‐generation SU | 1 | 409 | Risk Ratio (M‐H, Random, 95% CI) | 0.25 [0.07, 0.88] |
| 18.2 Second‐generation SU | 1 | 205 | Risk Ratio (M‐H, Random, 95% CI) | 2.91 [0.12, 70.71] |
| 18.3 Third‐generation SU | 0 | 0 | Risk Ratio (M‐H, Random, 95% CI) | 0.0 [0.0, 0.0] |
| 19 Intervention failure Show forest plot | 4 | 794 | Risk Ratio (M‐H, Random, 95% CI) | 0.26 [0.07, 0.94] |
| Analysis 1.19  Comparison 1 Sulphonylureas versus placebo, Outcome 19 Intervention failure. | ||||
| 19.1 First‐generation SU | 1 | 409 | Risk Ratio (M‐H, Random, 95% CI) | 0.72 [0.44, 1.19] |
| 19.2 Second‐generation SU | 3 | 385 | Risk Ratio (M‐H, Random, 95% CI) | 0.13 [0.04, 0.44] |
| 19.3 Third‐generation SU | 0 | 0 | Risk Ratio (M‐H, Random, 95% CI) | 0.0 [0.0, 0.0] |
| Outcome or subgroup title | No. of studies | No. of participants | Statistical method | Effect size |
| 1 All‐cause mortality Show forest plot | 8 | 3768 | Risk Ratio (M‐H, Random, 95% CI) | 0.98 [0.61, 1.58] |
| Analysis 2.1  Comparison 2 Sulphonylureas versus metformin, Outcome 1 All‐cause mortality. | ||||
| 1.1 First‐generation SU | 0 | 0 | Risk Ratio (M‐H, Random, 95% CI) | 0.0 [0.0, 0.0] |
| 1.2 Second‐generation SU | 6 | 3528 | Risk Ratio (M‐H, Random, 95% CI) | 0.98 [0.61, 1.58] |
| 1.3 Third‐generation SU | 2 | 240 | Risk Ratio (M‐H, Random, 95% CI) | 0.0 [0.0, 0.0] |
| 2 All‐cause mortality; best‐worst case scenario Show forest plot | 5 | 283 | Risk Ratio (M‐H, Random, 95% CI) | 0.72 [0.12, 4.45] |
| Analysis 2.2  Comparison 2 Sulphonylureas versus metformin, Outcome 2 All‐cause mortality; best‐worst case scenario. | ||||
| 2.1 First‐generation SU | 0 | 0 | Risk Ratio (M‐H, Random, 95% CI) | 0.0 [0.0, 0.0] |
| 2.2 Second‐generation SU | 4 | 207 | Risk Ratio (M‐H, Random, 95% CI) | 1.02 [0.10, 10.25] |
| 2.3 Third‐generation SU | 1 | 76 | Risk Ratio (M‐H, Random, 95% CI) | 0.35 [0.01, 8.35] |
| 3 All‐cause mortality; worst‐best case scenario Show forest plot | 5 | 283 | Risk Ratio (M‐H, Random, 95% CI) | 1.81 [0.37, 8.71] |
| Analysis 2.3 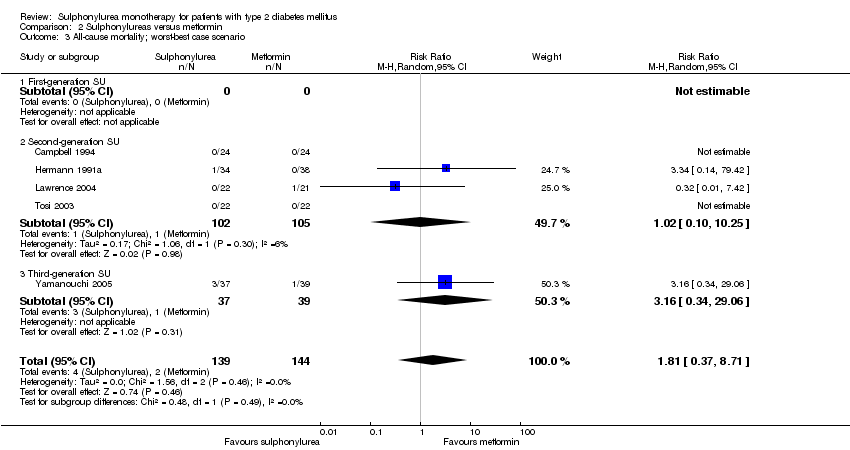 Comparison 2 Sulphonylureas versus metformin, Outcome 3 All‐cause mortality; worst‐best case scenario. | ||||
| 3.1 First‐generation SU | 0 | 0 | Risk Ratio (M‐H, Random, 95% CI) | 0.0 [0.0, 0.0] |
| 3.2 Second‐generation SU | 4 | 207 | Risk Ratio (M‐H, Random, 95% CI) | 1.02 [0.10, 10.25] |
| 3.3 Third‐generation SU | 1 | 76 | Risk Ratio (M‐H, Random, 95% CI) | 3.16 [0.34, 29.06] |
| 4 Cardiovascular mortality Show forest plot | 8 | 3768 | Risk Ratio (M‐H, Random, 95% CI) | 1.47 [0.54, 4.01] |
| Analysis 2.4  Comparison 2 Sulphonylureas versus metformin, Outcome 4 Cardiovascular mortality. | ||||
| 4.1 First‐generation SU | 0 | 0 | Risk Ratio (M‐H, Random, 95% CI) | 0.0 [0.0, 0.0] |
| 4.2 Second‐generation SU | 6 | 3528 | Risk Ratio (M‐H, Random, 95% CI) | 1.47 [0.54, 4.01] |
| 4.3 Third‐generation SU | 2 | 240 | Risk Ratio (M‐H, Random, 95% CI) | 0.0 [0.0, 0.0] |
| 5 Non‐fatal macrovascular outcomes Show forest plot | 4 | 3094 | Risk Ratio (M‐H, Random, 95% CI) | 0.67 [0.48, 0.93] |
| Analysis 2.5  Comparison 2 Sulphonylureas versus metformin, Outcome 5 Non‐fatal macrovascular outcomes. | ||||
| 5.1 First‐generation SU | 0 | 0 | Risk Ratio (M‐H, Random, 95% CI) | 0.0 [0.0, 0.0] |
| 5.2 Second‐generation SU | 3 | 3018 | Risk Ratio (M‐H, Random, 95% CI) | 0.67 [0.48, 0.93] |
| 5.3 Third‐generation SU | 1 | 76 | Risk Ratio (M‐H, Random, 95% CI) | 0.0 [0.0, 0.0] |
| 6 Non‐fatal myocardial infarction Show forest plot | 4 | 3061 | Risk Ratio (M‐H, Random, 95% CI) | 1.02 [0.37, 2.85] |
| Analysis 2.6  Comparison 2 Sulphonylureas versus metformin, Outcome 6 Non‐fatal myocardial infarction. | ||||
| 6.1 First‐generation SU | 0 | 0 | Risk Ratio (M‐H, Random, 95% CI) | 0.0 [0.0, 0.0] |
| 6.2 Second‐generation SU | 4 | 3061 | Risk Ratio (M‐H, Random, 95% CI) | 1.02 [0.37, 2.85] |
| 6.3 Third‐generation SU | 0 | 0 | Risk Ratio (M‐H, Random, 95% CI) | 0.0 [0.0, 0.0] |
| 7 Non‐fatal stroke Show forest plot | 1 | 44 | Risk Ratio (M‐H, Random, 95% CI) | 0.0 [0.0, 0.0] |
| Analysis 2.7  Comparison 2 Sulphonylureas versus metformin, Outcome 7 Non‐fatal stroke. | ||||
| 7.1 First‐generation SU | 0 | 0 | Risk Ratio (M‐H, Random, 95% CI) | 0.0 [0.0, 0.0] |
| 7.2 Second‐generation SU | 1 | 44 | Risk Ratio (M‐H, Random, 95% CI) | 0.0 [0.0, 0.0] |
| 7.3 Third‐generation SU | 0 | 0 | Risk Ratio (M‐H, Random, 95% CI) | 0.0 [0.0, 0.0] |
| 8 Amputation of lower extremity Show forest plot | 1 | 44 | Risk Ratio (M‐H, Random, 95% CI) | 0.0 [0.0, 0.0] |
| Analysis 2.8  Comparison 2 Sulphonylureas versus metformin, Outcome 8 Amputation of lower extremity. | ||||
| 8.1 First‐generation SU | 0 | 0 | Risk Ratio (M‐H, Random, 95% CI) | 0.0 [0.0, 0.0] |
| 8.2 Second‐generation SU | 1 | 44 | Risk Ratio (M‐H, Random, 95% CI) | 0.0 [0.0, 0.0] |
| 8.3 Third‐generation SU | 0 | 0 | Risk Ratio (M‐H, Random, 95% CI) | 0.0 [0.0, 0.0] |
| 9 Peripheral revascularisation Show forest plot | 2 | 2946 | Risk Ratio (M‐H, Random, 95% CI) | 1.15 [0.69, 1.92] |
| Analysis 2.9  Comparison 2 Sulphonylureas versus metformin, Outcome 9 Peripheral revascularisation. | ||||
| 9.1 First‐generation SU | 0 | 0 | Risk Ratio (M‐H, Random, 95% CI) | 0.0 [0.0, 0.0] |
| 9.2 Second‐generation SU | 2 | 2946 | Risk Ratio (M‐H, Random, 95% CI) | 1.15 [0.69, 1.92] |
| 9.3 Third‐generation SU | 0 | 0 | Risk Ratio (M‐H, Random, 95% CI) | 0.0 [0.0, 0.0] |
| 10 Microvascular outcomes Show forest plot | 1 | 44 | Risk Ratio (M‐H, Random, 95% CI) | 2.0 [0.20, 20.49] |
| Analysis 2.10  Comparison 2 Sulphonylureas versus metformin, Outcome 10 Microvascular outcomes. | ||||
| 10.1 First‐generation SU | 0 | 0 | Risk Ratio (M‐H, Random, 95% CI) | 0.0 [0.0, 0.0] |
| 10.2 Second‐generation SU | 1 | 44 | Risk Ratio (M‐H, Random, 95% CI) | 2.0 [0.20, 20.49] |
| 10.3 Third‐generation SU | 0 | 0 | Risk Ratio (M‐H, Random, 95% CI) | 0.0 [0.0, 0.0] |
| 11 Nephropathy Show forest plot | 1 | 44 | Risk Ratio (M‐H, Random, 95% CI) | 1.0 [0.07, 15.00] |
| Analysis 2.11  Comparison 2 Sulphonylureas versus metformin, Outcome 11 Nephropathy. | ||||
| 11.1 First‐generation SU | 0 | 0 | Risk Ratio (M‐H, Random, 95% CI) | 0.0 [0.0, 0.0] |
| 11.2 Second‐generation SU | 1 | 44 | Risk Ratio (M‐H, Random, 95% CI) | 1.0 [0.07, 15.00] |
| 11.3 Third‐generation SU | 0 | 0 | Risk Ratio (M‐H, Random, 95% CI) | 0.0 [0.0, 0.0] |
| 12 Retinal photocoagulation Show forest plot | 1 | 44 | Risk Ratio (M‐H, Random, 95% CI) | 0.0 [0.0, 0.0] |
| Analysis 2.12  Comparison 2 Sulphonylureas versus metformin, Outcome 12 Retinal photocoagulation. | ||||
| 12.1 First‐generation SU | 0 | 0 | Risk Ratio (M‐H, Random, 95% CI) | 0.0 [0.0, 0.0] |
| 12.2 Second‐generation SU | 1 | 44 | Risk Ratio (M‐H, Random, 95% CI) | 0.0 [0.0, 0.0] |
| 12.3 Third‐generation SU | 0 | 0 | Risk Ratio (M‐H, Random, 95% CI) | 0.0 [0.0, 0.0] |
| 13 Change in fasting blood glucose from baseline (mmol/L) Show forest plot | 15 | 4654 | Mean Difference (IV, Random, 95% CI) | 0.20 [‐0.07, 0.48] |
| Analysis 2.13 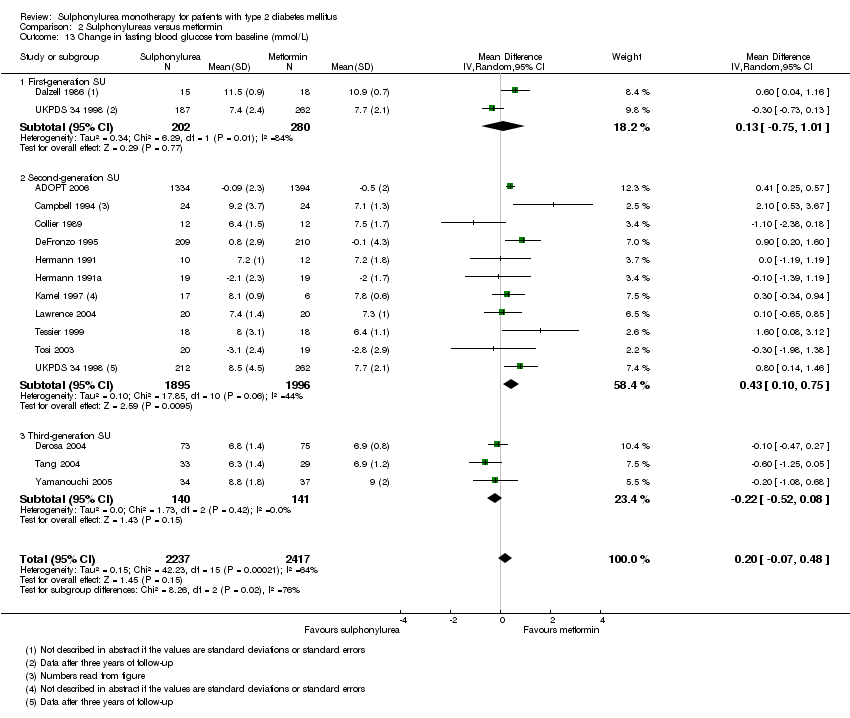 Comparison 2 Sulphonylureas versus metformin, Outcome 13 Change in fasting blood glucose from baseline (mmol/L). | ||||
| 13.1 First‐generation SU | 2 | 482 | Mean Difference (IV, Random, 95% CI) | 0.13 [‐0.75, 1.01] |
| 13.2 Second‐generation SU | 11 | 3891 | Mean Difference (IV, Random, 95% CI) | 0.43 [0.10, 0.75] |
| 13.3 Third‐generation SU | 3 | 281 | Mean Difference (IV, Random, 95% CI) | ‐0.22 [‐0.52, 0.08] |
| 14 Change in HbA1c from baseline (%) Show forest plot | 13 | 3632 | Mean Difference (IV, Random, 95% CI) | 0.06 [‐0.16, 0.29] |
| Analysis 2.14  Comparison 2 Sulphonylureas versus metformin, Outcome 14 Change in HbA1c from baseline (%). | ||||
| 14.1 First‐generation SU | 0 | 0 | Mean Difference (IV, Random, 95% CI) | 0.0 [0.0, 0.0] |
| 14.2 Second‐generation SU | 10 | 3351 | Mean Difference (IV, Random, 95% CI) | 0.17 [‐0.09, 0.44] |
| 14.3 Third‐generation SU | 3 | 281 | Mean Difference (IV, Random, 95% CI) | ‐0.18 [‐0.43, 0.07] |
| 15 Change in BMI from baseline (kg/m2) Show forest plot | 5 | 322 | Mean Difference (IV, Random, 95% CI) | 0.13 [‐0.69, 0.94] |
| Analysis 2.15 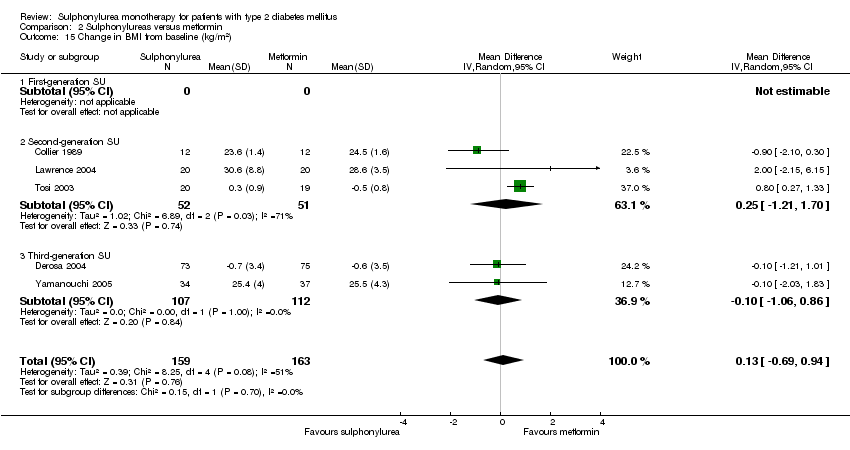 Comparison 2 Sulphonylureas versus metformin, Outcome 15 Change in BMI from baseline (kg/m2). | ||||
| 15.1 First‐generation SU | 0 | 0 | Mean Difference (IV, Random, 95% CI) | 0.0 [0.0, 0.0] |
| 15.2 Second‐generation SU | 3 | 103 | Mean Difference (IV, Random, 95% CI) | 0.25 [‐1.21, 1.70] |
| 15.3 Third‐generation SU | 2 | 219 | Mean Difference (IV, Random, 95% CI) | ‐0.10 [‐1.06, 0.86] |
| 16 Change in weight from baseline (kg) Show forest plot | 7 | 3497 | Mean Difference (IV, Random, 95% CI) | 3.77 [3.06, 4.47] |
| Analysis 2.16  Comparison 2 Sulphonylureas versus metformin, Outcome 16 Change in weight from baseline (kg). | ||||
| 16.1 First‐generation SU | 0 | 0 | Mean Difference (IV, Random, 95% CI) | 0.0 [0.0, 0.0] |
| 16.2 Second‐generation SU | 7 | 3497 | Mean Difference (IV, Random, 95% CI) | 3.77 [3.06, 4.47] |
| 16.3 Third‐generation SU | 0 | 0 | Mean Difference (IV, Random, 95% CI) | 0.0 [0.0, 0.0] |
| 17 Adverse events Show forest plot | 5 | 3118 | Risk Ratio (M‐H, Random, 95% CI) | 0.99 [0.97, 1.01] |
| Analysis 2.17 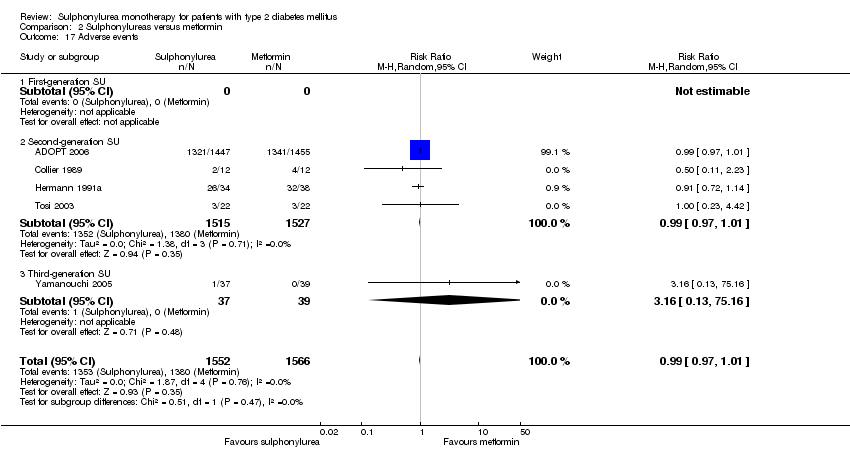 Comparison 2 Sulphonylureas versus metformin, Outcome 17 Adverse events. | ||||
| 17.1 First‐generation SU | 0 | 0 | Risk Ratio (M‐H, Random, 95% CI) | 0.0 [0.0, 0.0] |
| 17.2 Second‐generation SU | 4 | 3042 | Risk Ratio (M‐H, Random, 95% CI) | 0.99 [0.97, 1.01] |
| 17.3 Third‐generation SU | 1 | 76 | Risk Ratio (M‐H, Random, 95% CI) | 3.16 [0.13, 75.16] |
| 18 Serious adverse events Show forest plot | 5 | 3175 | Risk Ratio (M‐H, Random, 95% CI) | 0.94 [0.82, 1.07] |
| Analysis 2.18  Comparison 2 Sulphonylureas versus metformin, Outcome 18 Serious adverse events. | ||||
| 18.1 First‐generation SU | 0 | 0 | Risk Ratio (M‐H, Random, 95% CI) | 0.0 [0.0, 0.0] |
| 18.2 Second‐generation SU | 4 | 3011 | Risk Ratio (M‐H, Random, 95% CI) | 0.94 [0.82, 1.07] |
| 18.3 Third‐generation SU | 1 | 164 | Risk Ratio (M‐H, Random, 95% CI) | 0.0 [0.0, 0.0] |
| 19 Drop‐outs due to adverse events Show forest plot | 8 | 3731 | Risk Ratio (M‐H, Random, 95% CI) | 1.18 [0.98, 1.41] |
| Analysis 2.19  Comparison 2 Sulphonylureas versus metformin, Outcome 19 Drop‐outs due to adverse events. | ||||
| 19.1 First‐generation SU | 0 | 0 | Risk Ratio (M‐H, Random, 95% CI) | 0.0 [0.0, 0.0] |
| 19.2 Second‐generation SU | 7 | 3567 | Risk Ratio (M‐H, Random, 95% CI) | 1.19 [0.99, 1.42] |
| 19.3 Third‐generation SU | 1 | 164 | Risk Ratio (M‐H, Random, 95% CI) | 0.20 [0.01, 4.20] |
| 20 Mild hypoglycaemia Show forest plot | 6 | 4827 | Risk Ratio (M‐H, Fixed, 95% CI) | 3.16 [2.74, 3.64] |
| Analysis 2.20 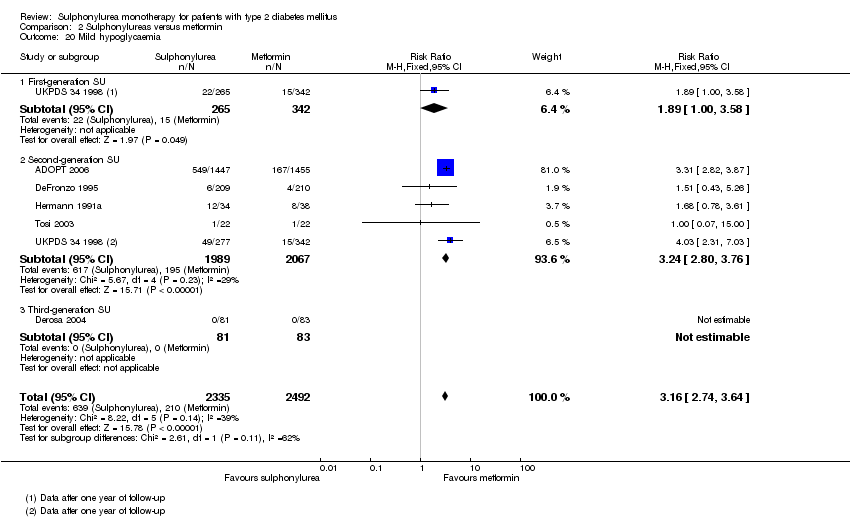 Comparison 2 Sulphonylureas versus metformin, Outcome 20 Mild hypoglycaemia. | ||||
| 20.1 First‐generation SU | 1 | 607 | Risk Ratio (M‐H, Fixed, 95% CI) | 1.89 [1.00, 3.58] |
| 20.2 Second‐generation SU | 5 | 4056 | Risk Ratio (M‐H, Fixed, 95% CI) | 3.24 [2.80, 3.76] |
| 20.3 Third‐generation SU | 1 | 164 | Risk Ratio (M‐H, Fixed, 95% CI) | 0.0 [0.0, 0.0] |
| 21 Moderate hypoglycaemia Show forest plot | 1 | 44 | Risk Ratio (M‐H, Random, 95% CI) | 3.0 [0.13, 69.87] |
| Analysis 2.21  Comparison 2 Sulphonylureas versus metformin, Outcome 21 Moderate hypoglycaemia. | ||||
| 21.1 First‐generation SU | 0 | 0 | Risk Ratio (M‐H, Random, 95% CI) | 0.0 [0.0, 0.0] |
| 21.2 Second‐generation SU | 1 | 44 | Risk Ratio (M‐H, Random, 95% CI) | 3.0 [0.13, 69.87] |
| 21.3 Third‐generation SU | 0 | 0 | Risk Ratio (M‐H, Random, 95% CI) | 0.0 [0.0, 0.0] |
| 22 Severe hypoglycaemia Show forest plot | 5 | 4408 | Risk Ratio (M‐H, Random, 95% CI) | 4.50 [1.24, 16.31] |
| Analysis 2.22 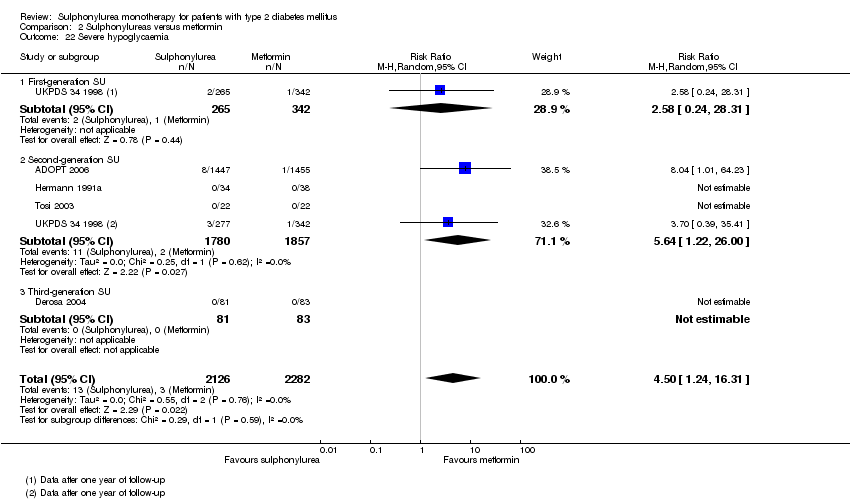 Comparison 2 Sulphonylureas versus metformin, Outcome 22 Severe hypoglycaemia. | ||||
| 22.1 First‐generation SU | 1 | 607 | Risk Ratio (M‐H, Random, 95% CI) | 2.58 [0.24, 28.31] |
| 22.2 Second‐generation SU | 4 | 3637 | Risk Ratio (M‐H, Random, 95% CI) | 5.64 [1.22, 26.00] |
| 22.3 Third‐generation SU | 1 | 164 | Risk Ratio (M‐H, Random, 95% CI) | 0.0 [0.0, 0.0] |
| 23 Cancer Show forest plot | 1 | 2902 | Risk Ratio (M‐H, Random, 95% CI) | 1.11 [0.76, 1.61] |
| Analysis 2.23  Comparison 2 Sulphonylureas versus metformin, Outcome 23 Cancer. | ||||
| 23.1 First‐generation SU | 0 | 0 | Risk Ratio (M‐H, Random, 95% CI) | 0.0 [0.0, 0.0] |
| 23.2 Second‐generation SU | 1 | 2902 | Risk Ratio (M‐H, Random, 95% CI) | 1.11 [0.76, 1.61] |
| 23.3 Third‐generation SU | 0 | 0 | Risk Ratio (M‐H, Random, 95% CI) | 0.0 [0.0, 0.0] |
| 24 Intervention failure Show forest plot | 9 | 4990 | Risk Ratio (M‐H, Random, 95% CI) | 0.92 [0.60, 1.39] |
| Analysis 2.24  Comparison 2 Sulphonylureas versus metformin, Outcome 24 Intervention failure. | ||||
| 24.1 First‐generation SU | 1 | 607 | Risk Ratio (M‐H, Random, 95% CI) | 0.63 [0.36, 1.09] |
| 24.2 Second‐generation SU | 7 | 4143 | Risk Ratio (M‐H, Random, 95% CI) | 0.97 [0.60, 1.57] |
| 24.3 Third‐generation SU | 2 | 240 | Risk Ratio (M‐H, Random, 95% CI) | 1.23 [0.43, 3.50] |
| Outcome or subgroup title | No. of studies | No. of participants | Statistical method | Effect size |
| 1 All‐cause mortality Show forest plot | 8 | 5030 | Risk Ratio (M‐H, Random, 95% CI) | 0.92 [0.60, 1.41] |
| Analysis 3.1  Comparison 3 Sulphonylureas versus thiazolidinediones, Outcome 1 All‐cause mortality. | ||||
| 1.1 First‐generation SU | 0 | 0 | Risk Ratio (M‐H, Random, 95% CI) | 0.0 [0.0, 0.0] |
| 1.2 Second‐generation SU | 7 | 4955 | Risk Ratio (M‐H, Random, 95% CI) | 0.92 [0.60, 1.41] |
| 1.3 Third‐generation SU | 1 | 75 | Risk Ratio (M‐H, Random, 95% CI) | 0.0 [0.0, 0.0] |
| 2 All‐cause mortality; best‐worst case scenario Show forest plot | 5 | 1327 | Risk Ratio (M‐H, Random, 95% CI) | 0.18 [0.06, 0.54] |
| Analysis 3.2  Comparison 3 Sulphonylureas versus thiazolidinediones, Outcome 2 All‐cause mortality; best‐worst case scenario. | ||||
| 2.1 First‐generation SU | 0 | 0 | Risk Ratio (M‐H, Random, 95% CI) | 0.0 [0.0, 0.0] |
| 2.2 Second‐generation SU | 4 | 1252 | Risk Ratio (M‐H, Random, 95% CI) | 0.18 [0.06, 0.54] |
| 2.3 Third‐generation SU | 1 | 75 | Risk Ratio (M‐H, Random, 95% CI) | 0.0 [0.0, 0.0] |
| 3 All‐cause mortality; worst‐best case scenario Show forest plot | 5 | 1327 | Risk Ratio (M‐H, Random, 95% CI) | 7.49 [1.39, 40.18] |
| Analysis 3.3  Comparison 3 Sulphonylureas versus thiazolidinediones, Outcome 3 All‐cause mortality; worst‐best case scenario. | ||||
| 3.1 First‐generation SU | 0 | 0 | Risk Ratio (M‐H, Random, 95% CI) | 0.0 [0.0, 0.0] |
| 3.2 Second‐generation SU | 4 | 1252 | Risk Ratio (M‐H, Random, 95% CI) | 9.76 [0.59, 161.27] |
| 3.3 Third‐generation SU | 1 | 75 | Risk Ratio (M‐H, Random, 95% CI) | 7.18 [0.38, 134.45] |
| 4 Cardiovascular mortality Show forest plot | 8 | 5030 | Risk Ratio (M‐H, Random, 95% CI) | 1.30 [0.55, 3.07] |
| Analysis 3.4  Comparison 3 Sulphonylureas versus thiazolidinediones, Outcome 4 Cardiovascular mortality. | ||||
| 4.1 First‐generation SU | 0 | 0 | Risk Ratio (M‐H, Random, 95% CI) | 0.0 [0.0, 0.0] |
| 4.2 Second‐generation SU | 7 | 4955 | Risk Ratio (M‐H, Random, 95% CI) | 1.30 [0.55, 3.07] |
| 4.3 Third‐generation SU | 1 | 75 | Risk Ratio (M‐H, Random, 95% CI) | 0.0 [0.0, 0.0] |
| 5 Non‐fatal macrovascular outcomes Show forest plot | 7 | 4675 | Risk Ratio (M‐H, Random, 95% CI) | 0.91 [0.62, 1.33] |
| Analysis 3.5 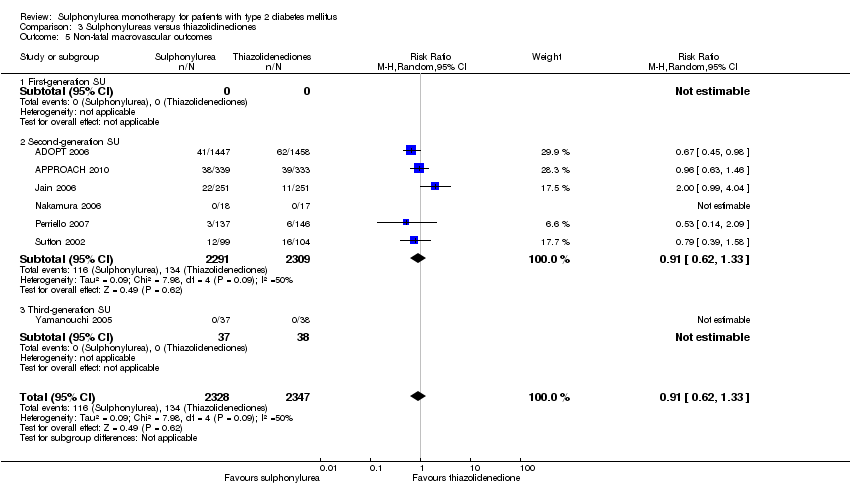 Comparison 3 Sulphonylureas versus thiazolidinediones, Outcome 5 Non‐fatal macrovascular outcomes. | ||||
| 5.1 First‐generation SU | 0 | 0 | Risk Ratio (M‐H, Random, 95% CI) | 0.0 [0.0, 0.0] |
| 5.2 Second‐generation SU | 6 | 4600 | Risk Ratio (M‐H, Random, 95% CI) | 0.91 [0.62, 1.33] |
| 5.3 Third‐generation SU | 1 | 75 | Risk Ratio (M‐H, Random, 95% CI) | 0.0 [0.0, 0.0] |
| 6 Non‐fatal myocardial infarction Show forest plot | 7 | 4956 | Risk Ratio (M‐H, Random, 95% CI) | 0.68 [0.41, 1.14] |
| Analysis 3.6 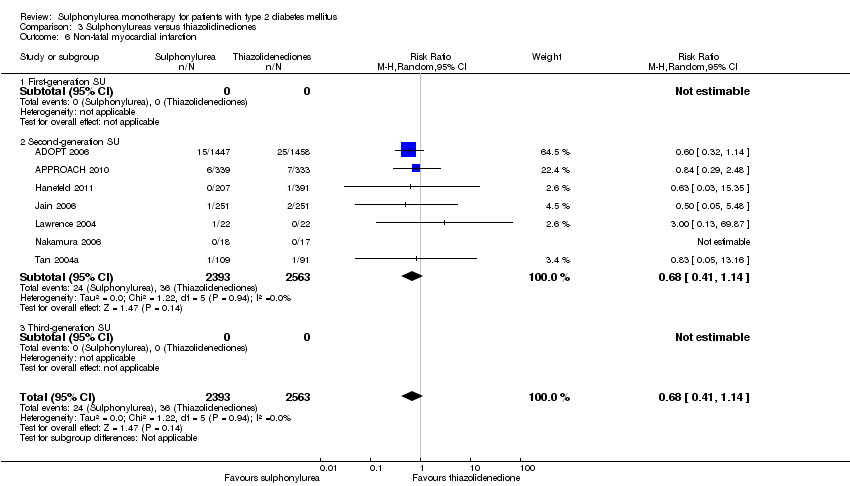 Comparison 3 Sulphonylureas versus thiazolidinediones, Outcome 6 Non‐fatal myocardial infarction. | ||||
| 6.1 First‐generation SU | 0 | 0 | Risk Ratio (M‐H, Random, 95% CI) | 0.0 [0.0, 0.0] |
| 6.2 Second‐generation SU | 7 | 4956 | Risk Ratio (M‐H, Random, 95% CI) | 0.68 [0.41, 1.14] |
| 6.3 Third‐generation SU | 0 | 0 | Risk Ratio (M‐H, Random, 95% CI) | 0.0 [0.0, 0.0] |
| 7 Non‐fatal stroke Show forest plot | 2 | 707 | Risk Ratio (M‐H, Random, 95% CI) | 0.20 [0.02, 1.67] |
| Analysis 3.7  Comparison 3 Sulphonylureas versus thiazolidinediones, Outcome 7 Non‐fatal stroke. | ||||
| 7.1 First‐generation SU | 0 | 0 | Risk Ratio (M‐H, Random, 95% CI) | 0.0 [0.0, 0.0] |
| 7.2 Second‐generation SU | 2 | 707 | Risk Ratio (M‐H, Random, 95% CI) | 0.20 [0.02, 1.67] |
| 7.3 Third‐generation SU | 0 | 0 | Risk Ratio (M‐H, Random, 95% CI) | 0.0 [0.0, 0.0] |
| 8 Amputation of lower extremity Show forest plot | 2 | 707 | Risk Ratio (M‐H, Random, 95% CI) | 0.0 [0.0, 0.0] |
| Analysis 3.8  Comparison 3 Sulphonylureas versus thiazolidinediones, Outcome 8 Amputation of lower extremity. | ||||
| 8.1 First‐generation SU | 0 | 0 | Risk Ratio (M‐H, Random, 95% CI) | 0.0 [0.0, 0.0] |
| 8.2 Second‐generation SU | 2 | 707 | Risk Ratio (M‐H, Random, 95% CI) | 0.0 [0.0, 0.0] |
| 8.3 Third‐generation SU | 0 | 0 | Risk Ratio (M‐H, Random, 95% CI) | 0.0 [0.0, 0.0] |
| 9 Cardial revascularisation Show forest plot | 2 | 707 | Risk Ratio (M‐H, Random, 95% CI) | 1.02 [0.61, 1.71] |
| Analysis 3.9  Comparison 3 Sulphonylureas versus thiazolidinediones, Outcome 9 Cardial revascularisation. | ||||
| 9.1 First‐generation SU | 0 | 0 | Risk Ratio (M‐H, Random, 95% CI) | 0.0 [0.0, 0.0] |
| 9.2 Second‐generation SU | 2 | 707 | Risk Ratio (M‐H, Random, 95% CI) | 1.02 [0.61, 1.71] |
| 9.3 Third‐generation SU | 0 | 0 | Risk Ratio (M‐H, Random, 95% CI) | 0.0 [0.0, 0.0] |
| 10 Peripheral revascularisation Show forest plot | 3 | 3612 | Risk Ratio (M‐H, Random, 95% CI) | 0.87 [0.54, 1.39] |
| Analysis 3.10  Comparison 3 Sulphonylureas versus thiazolidinediones, Outcome 10 Peripheral revascularisation. | ||||
| 10.1 First‐generation SU | 0 | 0 | Risk Ratio (M‐H, Random, 95% CI) | 0.0 [0.0, 0.0] |
| 10.2 Second‐generation SU | 3 | 3612 | Risk Ratio (M‐H, Random, 95% CI) | 0.87 [0.54, 1.39] |
| 10.3 Third‐generation SU | 0 | 0 | Risk Ratio (M‐H, Random, 95% CI) | 0.0 [0.0, 0.0] |
| 11 Microvascular outcomes Show forest plot | 2 | 235 | Risk Ratio (M‐H, Random, 95% CI) | 0.83 [0.05, 13.16] |
| Analysis 3.11 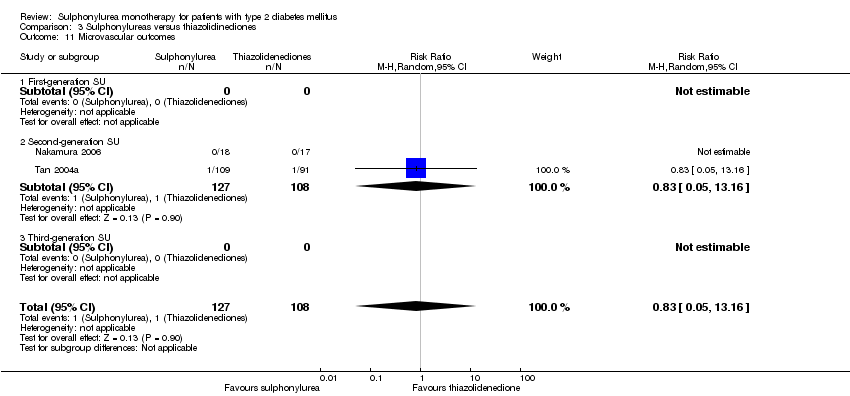 Comparison 3 Sulphonylureas versus thiazolidinediones, Outcome 11 Microvascular outcomes. | ||||
| 11.1 First‐generation SU | 0 | 0 | Risk Ratio (M‐H, Random, 95% CI) | 0.0 [0.0, 0.0] |
| 11.2 Second‐generation SU | 2 | 235 | Risk Ratio (M‐H, Random, 95% CI) | 0.83 [0.05, 13.16] |
| 11.3 Third‐generation SU | 0 | 0 | Risk Ratio (M‐H, Random, 95% CI) | 0.0 [0.0, 0.0] |
| 12 Nephropathy Show forest plot | 2 | 707 | Risk Ratio (M‐H, Random, 95% CI) | 0.11 [0.01, 2.02] |
| Analysis 3.12 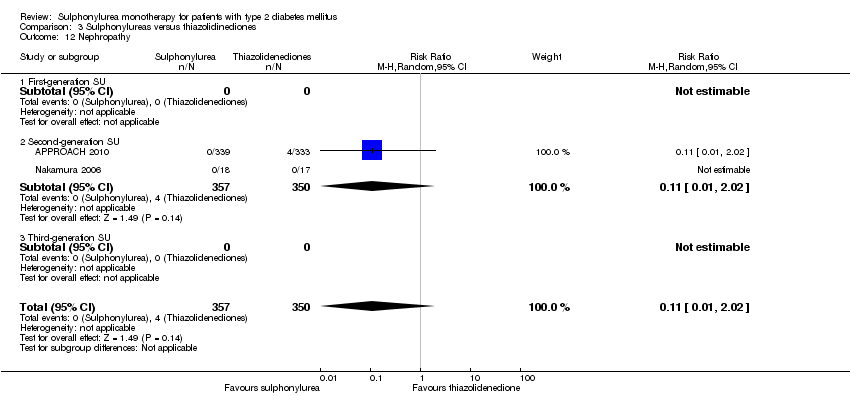 Comparison 3 Sulphonylureas versus thiazolidinediones, Outcome 12 Nephropathy. | ||||
| 12.1 First‐generation SU | 0 | 0 | Risk Ratio (M‐H, Random, 95% CI) | 0.0 [0.0, 0.0] |
| 12.2 Second‐generation SU | 2 | 707 | Risk Ratio (M‐H, Random, 95% CI) | 0.11 [0.01, 2.02] |
| 12.3 Third‐generation SU | 0 | 0 | Risk Ratio (M‐H, Random, 95% CI) | 0.0 [0.0, 0.0] |
| 13 Retinopathy Show forest plot | 2 | 707 | Risk Ratio (M‐H, Random, 95% CI) | 0.98 [0.06, 15.64] |
| Analysis 3.13 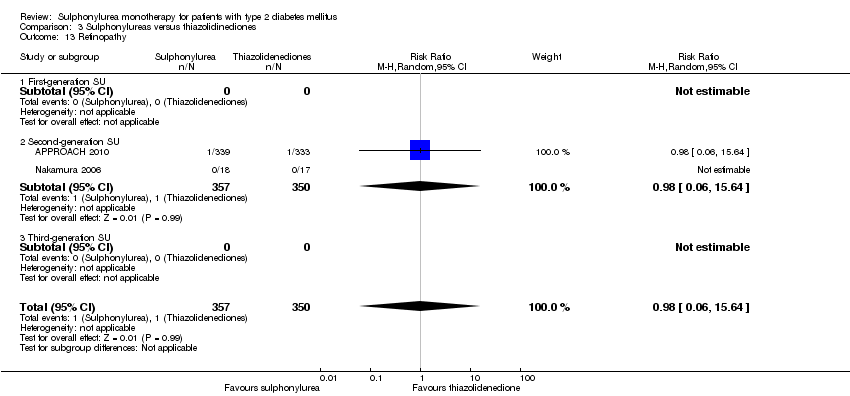 Comparison 3 Sulphonylureas versus thiazolidinediones, Outcome 13 Retinopathy. | ||||
| 13.1 First‐generation SU | 0 | 0 | Risk Ratio (M‐H, Random, 95% CI) | 0.0 [0.0, 0.0] |
| 13.2 Second‐generation SU | 2 | 707 | Risk Ratio (M‐H, Random, 95% CI) | 0.98 [0.06, 15.64] |
| 13.3 Third‐generation SU | 0 | 0 | Risk Ratio (M‐H, Random, 95% CI) | 0.0 [0.0, 0.0] |
| 14 Retinal photocoagulation Show forest plot | 2 | 707 | Risk Ratio (M‐H, Random, 95% CI) | 0.0 [0.0, 0.0] |
| Analysis 3.14  Comparison 3 Sulphonylureas versus thiazolidinediones, Outcome 14 Retinal photocoagulation. | ||||
| 14.1 First‐generation SU | 0 | 0 | Risk Ratio (M‐H, Random, 95% CI) | 0.0 [0.0, 0.0] |
| 14.2 Second‐generation SU | 2 | 707 | Risk Ratio (M‐H, Random, 95% CI) | 0.0 [0.0, 0.0] |
| 14.3 Third‐generation SU | 0 | 0 | Risk Ratio (M‐H, Random, 95% CI) | 0.0 [0.0, 0.0] |
| 15 Change in fasting blood glucose from baseline (mmol/L) Show forest plot | 18 | 6731 | Mean Difference (IV, Random, 95% CI) | 0.53 [0.31, 0.75] |
| Analysis 3.15  Comparison 3 Sulphonylureas versus thiazolidinediones, Outcome 15 Change in fasting blood glucose from baseline (mmol/L). | ||||
| 15.1 First‐generation SU | 0 | 0 | Mean Difference (IV, Random, 95% CI) | 0.0 [0.0, 0.0] |
| 15.2 Second‐generation SU | 14 | 6076 | Mean Difference (IV, Random, 95% CI) | 0.56 [0.33, 0.79] |
| 15.3 Third‐generation SU | 4 | 655 | Mean Difference (IV, Random, 95% CI) | 0.46 [‐0.22, 1.13] |
| 16 Change in HbA1c from baseline (%) Show forest plot | 21 | 7435 | Mean Difference (IV, Random, 95% CI) | 0.03 [‐0.10, 0.16] |
| Analysis 3.16  Comparison 3 Sulphonylureas versus thiazolidinediones, Outcome 16 Change in HbA1c from baseline (%). | ||||
| 16.1 First‐generation SU | 0 | 0 | Mean Difference (IV, Random, 95% CI) | 0.0 [0.0, 0.0] |
| 16.2 Second‐generation SU | 17 | 6776 | Mean Difference (IV, Random, 95% CI) | 0.06 [‐0.09, 0.20] |
| 16.3 Third‐generation SU | 4 | 659 | Mean Difference (IV, Random, 95% CI) | ‐0.09 [‐0.31, 0.14] |
| 17 Change in BMI from baseline (kg/m2) Show forest plot | 7 | 532 | Mean Difference (IV, Random, 95% CI) | ‐0.98 [‐1.18, ‐0.79] |
| Analysis 3.17 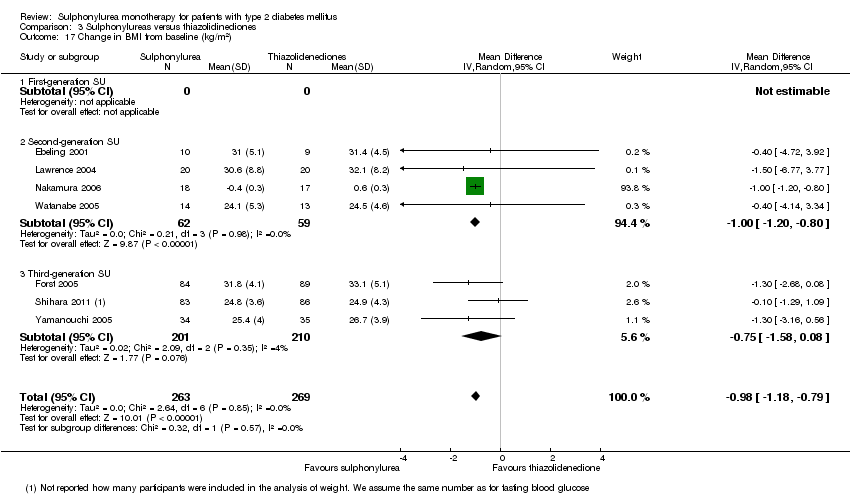 Comparison 3 Sulphonylureas versus thiazolidinediones, Outcome 17 Change in BMI from baseline (kg/m2). | ||||
| 17.1 First‐generation SU | 0 | 0 | Mean Difference (IV, Random, 95% CI) | 0.0 [0.0, 0.0] |
| 17.2 Second‐generation SU | 4 | 121 | Mean Difference (IV, Random, 95% CI) | 1.00 [‐1.20, ‐0.80] |
| 17.3 Third‐generation SU | 3 | 411 | Mean Difference (IV, Random, 95% CI) | ‐0.75 [‐1.58, 0.08] |
| 18 Change in weight from baseline (kg) Show forest plot | 11 | 5948 | Mean Difference (IV, Random, 95% CI) | ‐1.86 [‐2.50, ‐1.21] |
| Analysis 3.18  Comparison 3 Sulphonylureas versus thiazolidinediones, Outcome 18 Change in weight from baseline (kg). | ||||
| 18.1 First‐generation SU | 0 | 0 | Mean Difference (IV, Random, 95% CI) | 0.0 [0.0, 0.0] |
| 18.2 Second‐generation SU | 10 | 5779 | Mean Difference (IV, Random, 95% CI) | ‐1.90 [‐2.56, ‐1.25] |
| 18.3 Third‐generation SU | 1 | 169 | Mean Difference (IV, Random, 95% CI) | 0.20 [‐3.75, 4.15] |
| 19 Adverse events Show forest plot | 13 | 7001 | Risk Ratio (M‐H, Random, 95% CI) | 0.98 [0.94, 1.01] |
| Analysis 3.19  Comparison 3 Sulphonylureas versus thiazolidinediones, Outcome 19 Adverse events. | ||||
| 19.1 First‐generation SU | 0 | 0 | Risk Ratio (M‐H, Random, 95% CI) | 0.0 [0.0, 0.0] |
| 19.2 Second‐generation SU | 10 | 6491 | Risk Ratio (M‐H, Random, 95% CI) | 0.99 [0.97, 1.01] |
| 19.3 Third‐generation SU | 3 | 510 | Risk Ratio (M‐H, Random, 95% CI) | 0.88 [0.78, 0.99] |
| 20 Serious adverse events Show forest plot | 11 | 5605 | Risk Ratio (M‐H, Random, 95% CI) | 0.90 [0.80, 1.01] |
| Analysis 3.20 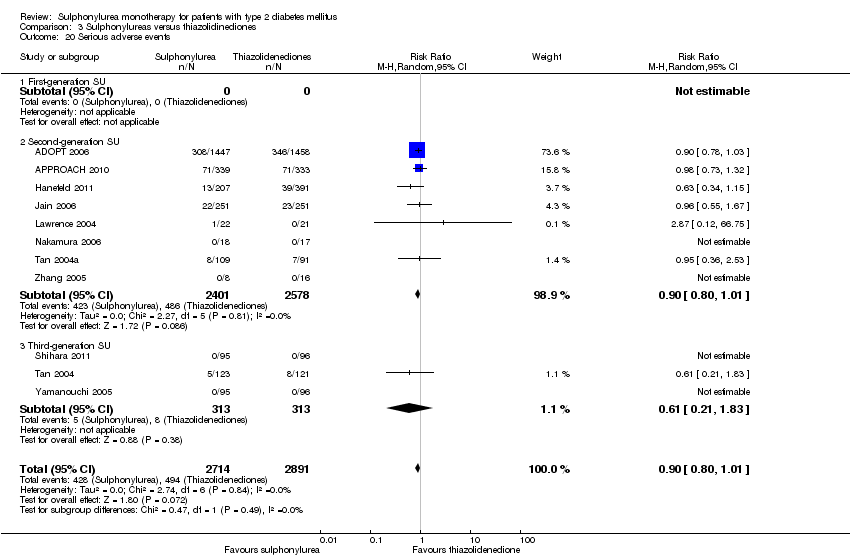 Comparison 3 Sulphonylureas versus thiazolidinediones, Outcome 20 Serious adverse events. | ||||
| 20.1 First‐generation SU | 0 | 0 | Risk Ratio (M‐H, Random, 95% CI) | 0.0 [0.0, 0.0] |
| 20.2 Second‐generation SU | 8 | 4979 | Risk Ratio (M‐H, Random, 95% CI) | 0.90 [0.80, 1.01] |
| 20.3 Third‐generation SU | 3 | 626 | Risk Ratio (M‐H, Random, 95% CI) | 0.61 [0.21, 1.83] |
| 21 Drop‐outs due to adverse events Show forest plot | 17 | 7856 | Risk Ratio (M‐H, Random, 95% CI) | 1.16 [1.00, 1.34] |
| Analysis 3.21  Comparison 3 Sulphonylureas versus thiazolidinediones, Outcome 21 Drop‐outs due to adverse events. | ||||
| 21.1 First‐generation SU | 0 | 0 | Risk Ratio (M‐H, Random, 95% CI) | 0.0 [0.0, 0.0] |
| 21.2 Second‐generation SU | 15 | 7433 | Risk Ratio (M‐H, Random, 95% CI) | 1.15 [0.98, 1.36] |
| 21.3 Third‐generation SU | 2 | 423 | Risk Ratio (M‐H, Random, 95% CI) | 0.54 [0.15, 1.97] |
| 22 Mild hypoglycaemia Show forest plot | 9 | 6556 | Risk Ratio (M‐H, Random, 95% CI) | 3.95 [3.08, 5.06] |
| Analysis 3.22  Comparison 3 Sulphonylureas versus thiazolidinediones, Outcome 22 Mild hypoglycaemia. | ||||
| 22.1 First‐generation SU | 0 | 0 | Risk Ratio (M‐H, Random, 95% CI) | 0.0 [0.0, 0.0] |
| 22.2 Second‐generation SU | 8 | 6365 | Risk Ratio (M‐H, Random, 95% CI) | 4.05 [3.28, 5.00] |
| 22.3 Third‐generation SU | 1 | 191 | Risk Ratio (M‐H, Random, 95% CI) | 1.41 [0.47, 4.30] |
| 23 Moderate hypoglycaemia Show forest plot | 1 | 35 | Risk Ratio (M‐H, Random, 95% CI) | 0.0 [0.0, 0.0] |
| Analysis 3.23  Comparison 3 Sulphonylureas versus thiazolidinediones, Outcome 23 Moderate hypoglycaemia. | ||||
| 23.1 First‐generation SU | 0 | 0 | Risk Ratio (M‐H, Random, 95% CI) | 0.0 [0.0, 0.0] |
| 23.2 Second‐generation SU | 1 | 35 | Risk Ratio (M‐H, Random, 95% CI) | 0.0 [0.0, 0.0] |
| 23.3 Third‐generation SU | 0 | 0 | Risk Ratio (M‐H, Random, 95% CI) | 0.0 [0.0, 0.0] |
| 24 Severe hypoglycaemia Show forest plot | 8 | 6030 | Risk Ratio (M‐H, Random, 95% CI) | 6.11 [1.57, 23.79] |
| Analysis 3.24  Comparison 3 Sulphonylureas versus thiazolidinediones, Outcome 24 Severe hypoglycaemia. | ||||
| 24.1 First‐generation SU | 0 | 0 | Risk Ratio (M‐H, Random, 95% CI) | 0.0 [0.0, 0.0] |
| 24.2 Second‐generation SU | 6 | 5660 | Risk Ratio (M‐H, Random, 95% CI) | 6.11 [1.57, 23.79] |
| 24.3 Third‐generation SU | 2 | 370 | Risk Ratio (M‐H, Random, 95% CI) | 0.0 [0.0, 0.0] |
| 25 Cancer Show forest plot | 6 | 4912 | Risk Ratio (M‐H, Random, 95% CI) | 1.02 [0.72, 1.45] |
| Analysis 3.25 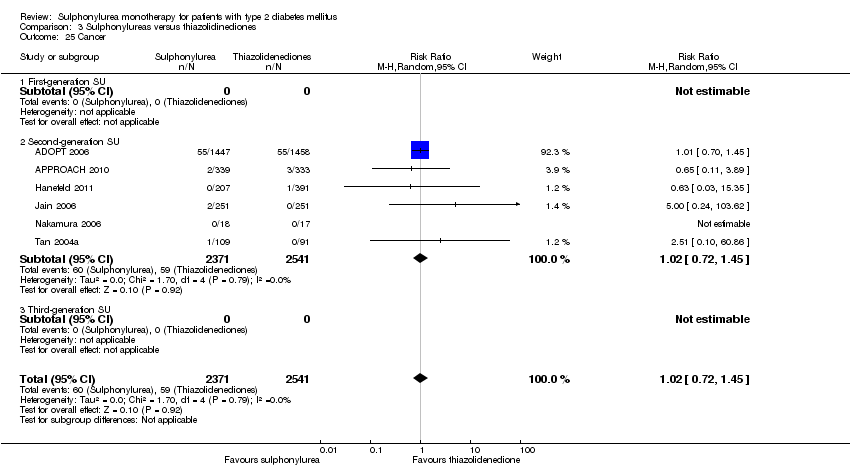 Comparison 3 Sulphonylureas versus thiazolidinediones, Outcome 25 Cancer. | ||||
| 25.1 First‐generation SU | 0 | 0 | Risk Ratio (M‐H, Random, 95% CI) | 0.0 [0.0, 0.0] |
| 25.2 Second‐generation SU | 6 | 4912 | Risk Ratio (M‐H, Random, 95% CI) | 1.02 [0.72, 1.45] |
| 25.3 Third‐generation SU | 0 | 0 | Risk Ratio (M‐H, Random, 95% CI) | 0.0 [0.0, 0.0] |
| 26 Intervention failure Show forest plot | 10 | 6757 | Risk Ratio (M‐H, Random, 95% CI) | 0.97 [0.65, 1.45] |
| Analysis 3.26  Comparison 3 Sulphonylureas versus thiazolidinediones, Outcome 26 Intervention failure. | ||||
| 26.1 First‐generation SU | 0 | 0 | Risk Ratio (M‐H, Random, 95% CI) | 0.0 [0.0, 0.0] |
| 26.2 Second‐generation SU | 8 | 6438 | Risk Ratio (M‐H, Random, 95% CI) | 1.10 [0.73, 1.65] |
| 26.3 Third‐generation SU | 2 | 319 | Risk Ratio (M‐H, Random, 95% CI) | 0.24 [0.08, 0.75] |
| Outcome or subgroup title | No. of studies | No. of participants | Statistical method | Effect size |
| 1 All‐cause mortality Show forest plot | 5 | 3586 | Risk Ratio (M‐H, Random, 95% CI) | 1.05 [0.92, 1.21] |
| Analysis 4.1  Comparison 4 Sulphonylureas versus insulin, Outcome 1 All‐cause mortality. | ||||
| 1.1 First‐generation SU | 2 | 1944 | Risk Ratio (M‐H, Random, 95% CI) | 1.18 [0.88, 1.59] |
| 1.2 Second‐generation SU | 4 | 1642 | Risk Ratio (M‐H, Random, 95% CI) | 0.96 [0.79, 1.18] |
| 1.3 Third‐generation SU | 0 | 0 | Risk Ratio (M‐H, Random, 95% CI) | 0.0 [0.0, 0.0] |
| 2 All‐cause mortality; best‐worst case scenario Show forest plot | 2 | 80 | Risk Ratio (M‐H, Random, 95% CI) | 0.13 [0.02, 0.95] |
| Analysis 4.2 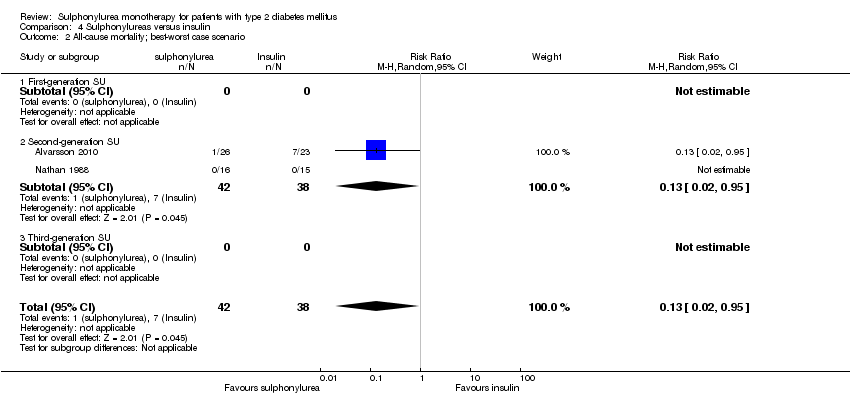 Comparison 4 Sulphonylureas versus insulin, Outcome 2 All‐cause mortality; best‐worst case scenario. | ||||
| 2.1 First‐generation SU | 0 | 0 | Risk Ratio (M‐H, Random, 95% CI) | 0.0 [0.0, 0.0] |
| 2.2 Second‐generation SU | 2 | 80 | Risk Ratio (M‐H, Random, 95% CI) | 0.13 [0.02, 0.95] |
| 2.3 Third‐generation SU | 0 | 0 | Risk Ratio (M‐H, Random, 95% CI) | 0.0 [0.0, 0.0] |
| 3 All‐cause mortality; worst‐best case scenario Show forest plot | 2 | 80 | Risk Ratio (M‐H, Random, 95% CI) | 3.54 [0.83, 15.00] |
| Analysis 4.3  Comparison 4 Sulphonylureas versus insulin, Outcome 3 All‐cause mortality; worst‐best case scenario. | ||||
| 3.1 First‐generation SU | 0 | 0 | Risk Ratio (M‐H, Random, 95% CI) | 0.0 [0.0, 0.0] |
| 3.2 Second‐generation SU | 2 | 80 | Risk Ratio (M‐H, Random, 95% CI) | 3.54 [0.83, 15.00] |
| 3.3 Third‐generation SU | 0 | 0 | Risk Ratio (M‐H, Random, 95% CI) | 0.0 [0.0, 0.0] |
| 4 Cardiovascular mortality Show forest plot | 5 | 3586 | Risk Ratio (M‐H, Random, 95% CI) | 1.09 [0.82, 1.44] |
| Analysis 4.4 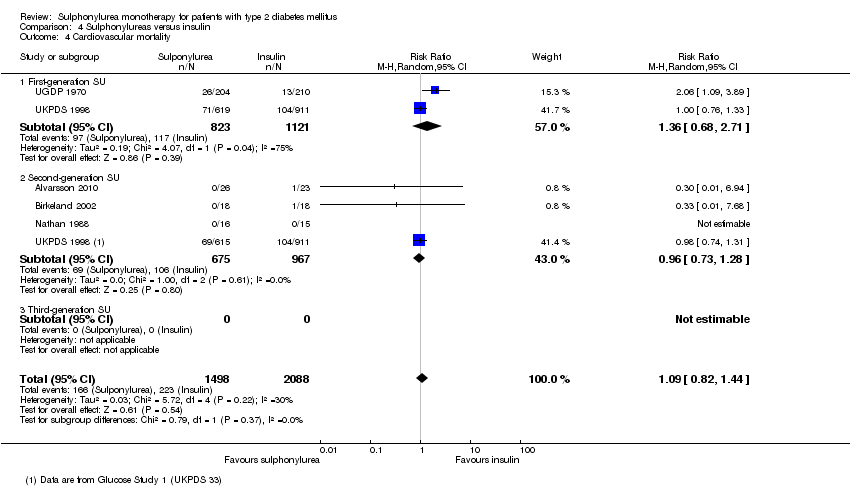 Comparison 4 Sulphonylureas versus insulin, Outcome 4 Cardiovascular mortality. | ||||
| 4.1 First‐generation SU | 2 | 1944 | Risk Ratio (M‐H, Random, 95% CI) | 1.36 [0.68, 2.71] |
| 4.2 Second‐generation SU | 4 | 1642 | Risk Ratio (M‐H, Random, 95% CI) | 0.96 [0.73, 1.28] |
| 4.3 Third‐generation SU | 0 | 0 | Risk Ratio (M‐H, Random, 95% CI) | 0.0 [0.0, 0.0] |
| 5 Non‐fatal myocardial infarction Show forest plot | 2 | 3470 | Risk Ratio (M‐H, Random, 95% CI) | 0.99 [0.79, 1.23] |
| Analysis 4.5  Comparison 4 Sulphonylureas versus insulin, Outcome 5 Non‐fatal myocardial infarction. | ||||
| 5.1 First‐generation SU | 2 | 1944 | Risk Ratio (M‐H, Random, 95% CI) | 1.08 [0.81, 1.45] |
| 5.2 Second‐generation SU | 1 | 1526 | Risk Ratio (M‐H, Random, 95% CI) | 0.86 [0.61, 1.22] |
| 5.3 Third‐generation SU | 0 | 0 | Risk Ratio (M‐H, Random, 95% CI) | 0.0 [0.0, 0.0] |
| 6 Non‐fatal stroke Show forest plot | 2 | 3470 | Risk Ratio (M‐H, Random, 95% CI) | 1.45 [1.02, 2.06] |
| Analysis 4.6 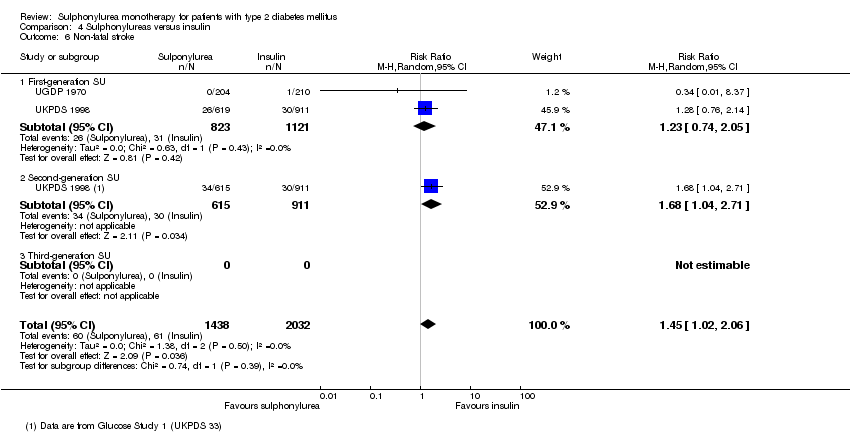 Comparison 4 Sulphonylureas versus insulin, Outcome 6 Non‐fatal stroke. | ||||
| 6.1 First‐generation SU | 2 | 1944 | Risk Ratio (M‐H, Random, 95% CI) | 1.23 [0.74, 2.05] |
| 6.2 Second‐generation SU | 1 | 1526 | Risk Ratio (M‐H, Random, 95% CI) | 1.68 [1.04, 2.71] |
| 6.3 Third‐generation SU | 0 | 0 | Risk Ratio (M‐H, Random, 95% CI) | 0.0 [0.0, 0.0] |
| 7 Amputation of lower extremity Show forest plot | 2 | 3470 | Risk Ratio (M‐H, Random, 95% CI) | 0.49 [0.24, 1.00] |
| Analysis 4.7  Comparison 4 Sulphonylureas versus insulin, Outcome 7 Amputation of lower extremity. | ||||
| 7.1 First‐generation SU | 2 | 1944 | Risk Ratio (M‐H, Random, 95% CI) | 0.49 [0.18, 1.34] |
| 7.2 Second‐generation SU | 1 | 1526 | Risk Ratio (M‐H, Random, 95% CI) | 0.49 [0.18, 1.35] |
| 7.3 Third‐generation SU | 0 | 0 | Risk Ratio (M‐H, Random, 95% CI) | 0.0 [0.0, 0.0] |
| 8 Microvascular outcomes Show forest plot | 1 | 3056 | Risk Ratio (M‐H, Random, 95% CI) | 1.12 [0.82, 1.53] |
| Analysis 4.8  Comparison 4 Sulphonylureas versus insulin, Outcome 8 Microvascular outcomes. | ||||
| 8.1 First‐generation SU | 1 | 1530 | Risk Ratio (M‐H, Random, 95% CI) | 1.30 [0.95, 1.77] |
| 8.2 Second‐generation SU | 1 | 1526 | Risk Ratio (M‐H, Random, 95% CI) | 0.94 [0.67, 1.33] |
| 8.3 Third‐generation SU | 0 | 0 | Risk Ratio (M‐H, Random, 95% CI) | 0.0 [0.0, 0.0] |
| 9 Nephropathy Show forest plot | 1 | 414 | Risk Ratio (M‐H, Random, 95% CI) | 11.32 [0.63, 203.45] |
| Analysis 4.9 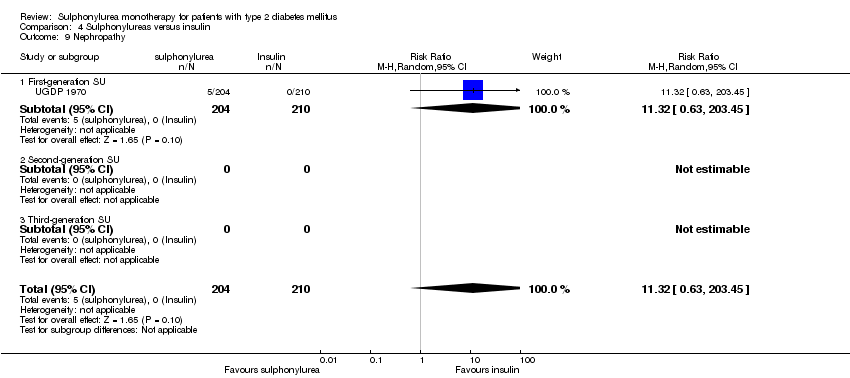 Comparison 4 Sulphonylureas versus insulin, Outcome 9 Nephropathy. | ||||
| 9.1 First‐generation SU | 1 | 414 | Risk Ratio (M‐H, Random, 95% CI) | 11.32 [0.63, 203.45] |
| 9.2 Second‐generation SU | 0 | 0 | Risk Ratio (M‐H, Random, 95% CI) | 0.0 [0.0, 0.0] |
| 9.3 Third‐generation SU | 0 | 0 | Risk Ratio (M‐H, Random, 95% CI) | 0.0 [0.0, 0.0] |
| 10 Retinopathy Show forest plot | 1 | 414 | Risk Ratio (M‐H, Random, 95% CI) | 0.99 [0.71, 1.39] |
| Analysis 4.10  Comparison 4 Sulphonylureas versus insulin, Outcome 10 Retinopathy. | ||||
| 10.1 First‐generation SU | 1 | 414 | Risk Ratio (M‐H, Random, 95% CI) | 0.99 [0.71, 1.39] |
| 10.2 Second‐generation SU | 0 | 0 | Risk Ratio (M‐H, Random, 95% CI) | 0.0 [0.0, 0.0] |
| 10.3 Third‐generation SU | 0 | 0 | Risk Ratio (M‐H, Random, 95% CI) | 0.0 [0.0, 0.0] |
| 11 Retinal photocoagulation Show forest plot | 1 | 3056 | Risk Ratio (M‐H, Random, 95% CI) | 1.03 [0.80, 1.31] |
| Analysis 4.11  Comparison 4 Sulphonylureas versus insulin, Outcome 11 Retinal photocoagulation. | ||||
| 11.1 First‐generation SU | 1 | 1530 | Risk Ratio (M‐H, Random, 95% CI) | 1.12 [0.80, 1.57] |
| 11.2 Second‐generation SU | 1 | 1526 | Risk Ratio (M‐H, Random, 95% CI) | 0.93 [0.65, 1.32] |
| 11.3 Third‐generation SU | 0 | 0 | Risk Ratio (M‐H, Random, 95% CI) | 0.0 [0.0, 0.0] |
| 12 Change in fasting blood glucose from baseline (mmol/L) Show forest plot | 5 | 2423 | Mean Difference (IV, Random, 95% CI) | 0.12 [‐0.37, 0.61] |
| Analysis 4.12 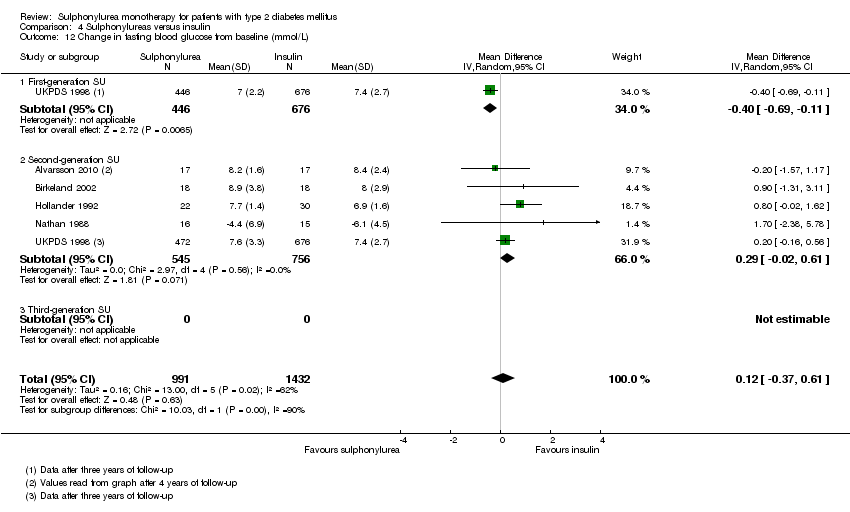 Comparison 4 Sulphonylureas versus insulin, Outcome 12 Change in fasting blood glucose from baseline (mmol/L). | ||||
| 12.1 First‐generation SU | 1 | 1122 | Mean Difference (IV, Random, 95% CI) | ‐0.40 [‐0.69, ‐0.11] |
| 12.2 Second‐generation SU | 5 | 1301 | Mean Difference (IV, Random, 95% CI) | 0.29 [‐0.02, 0.61] |
| 12.3 Third‐generation SU | 0 | 0 | Mean Difference (IV, Random, 95% CI) | 0.0 [0.0, 0.0] |
| 13 Change in HbA1c from baseline (%) Show forest plot | 6 | 2566 | Mean Difference (IV, Random, 95% CI) | ‐0.09 [‐0.20, 0.03] |
| Analysis 4.13 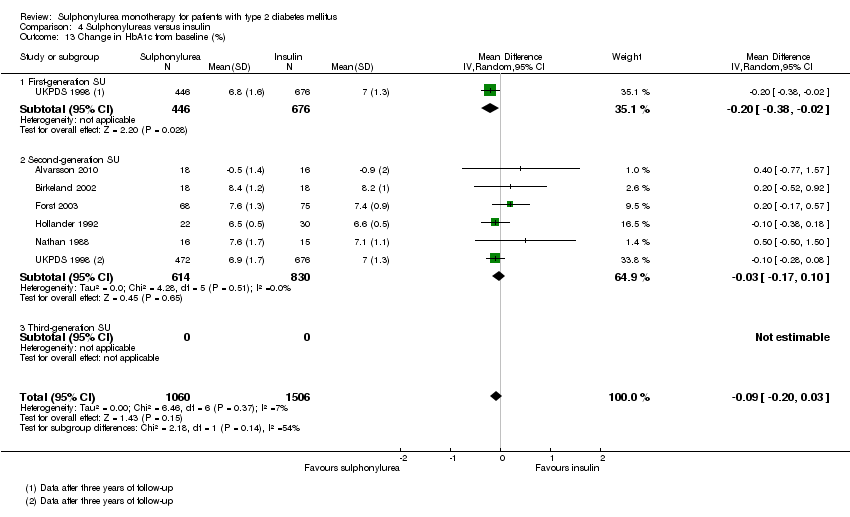 Comparison 4 Sulphonylureas versus insulin, Outcome 13 Change in HbA1c from baseline (%). | ||||
| 13.1 First‐generation SU | 1 | 1122 | Mean Difference (IV, Random, 95% CI) | ‐0.20 [‐0.38, ‐0.02] |
| 13.2 Second‐generation SU | 6 | 1444 | Mean Difference (IV, Random, 95% CI) | ‐0.03 [‐0.17, 0.10] |
| 13.3 Third‐generation SU | 0 | 0 | Mean Difference (IV, Random, 95% CI) | 0.0 [0.0, 0.0] |
| 14 Change in BMI from baseline (kg/m2) Show forest plot | 1 | 34 | Mean Difference (IV, Random, 95% CI) | ‐1.70 [‐4.10, 0.70] |
| Analysis 4.14  Comparison 4 Sulphonylureas versus insulin, Outcome 14 Change in BMI from baseline (kg/m2). | ||||
| 14.1 First‐generation SU | 0 | 0 | Mean Difference (IV, Random, 95% CI) | 0.0 [0.0, 0.0] |
| 14.2 Second‐generation SU | 1 | 34 | Mean Difference (IV, Random, 95% CI) | ‐1.70 [‐4.10, 0.70] |
| 14.3 Third‐generation SU | 0 | 0 | Mean Difference (IV, Random, 95% CI) | 0.0 [0.0, 0.0] |
| 15 Change in weight from baseline (kg) Show forest plot | 5 | 2514 | Mean Difference (IV, Random, 95% CI) | 1.00 [‐2.82, 0.83] |
| Analysis 4.15  Comparison 4 Sulphonylureas versus insulin, Outcome 15 Change in weight from baseline (kg). | ||||
| 15.1 First‐generation SU | 1 | 1122 | Mean Difference (IV, Random, 95% CI) | ‐2.30 [‐4.11, ‐0.49] |
| 15.2 Second‐generation SU | 5 | 1392 | Mean Difference (IV, Random, 95% CI) | ‐0.37 [‐2.39, 1.65] |
| 15.3 Third‐generation SU | 0 | 0 | Mean Difference (IV, Random, 95% CI) | 0.0 [0.0, 0.0] |
| 16 Adverse events Show forest plot | 1 | 143 | Risk Ratio (M‐H, Random, 95% CI) | 1.06 [0.68, 1.65] |
| Analysis 4.16  Comparison 4 Sulphonylureas versus insulin, Outcome 16 Adverse events. | ||||
| 16.1 First‐generation SU | 0 | 0 | Risk Ratio (M‐H, Random, 95% CI) | 0.0 [0.0, 0.0] |
| 16.2 Second‐generation SU | 1 | 143 | Risk Ratio (M‐H, Random, 95% CI) | 1.06 [0.68, 1.65] |
| 16.3 Third‐generation SU | 0 | 0 | Risk Ratio (M‐H, Random, 95% CI) | 0.0 [0.0, 0.0] |
| 17 Drop‐outs due to adverse events Show forest plot | 2 | 192 | Risk Ratio (M‐H, Random, 95% CI) | 3.54 [0.43, 29.43] |
| Analysis 4.17  Comparison 4 Sulphonylureas versus insulin, Outcome 17 Drop‐outs due to adverse events. | ||||
| 17.1 First‐generation SU | 0 | 0 | Risk Ratio (M‐H, Random, 95% CI) | 0.0 [0.0, 0.0] |
| 17.2 Second‐generation SU | 2 | 192 | Risk Ratio (M‐H, Random, 95% CI) | 3.54 [0.43, 29.43] |
| 17.3 Third‐generation SU | 0 | 0 | Risk Ratio (M‐H, Random, 95% CI) | 0.0 [0.0, 0.0] |
| 18 Mild hypoglycaemia Show forest plot | 2 | 3105 | Risk Ratio (M‐H, Random, 95% CI) | 0.94 [0.45, 1.95] |
| Analysis 4.18 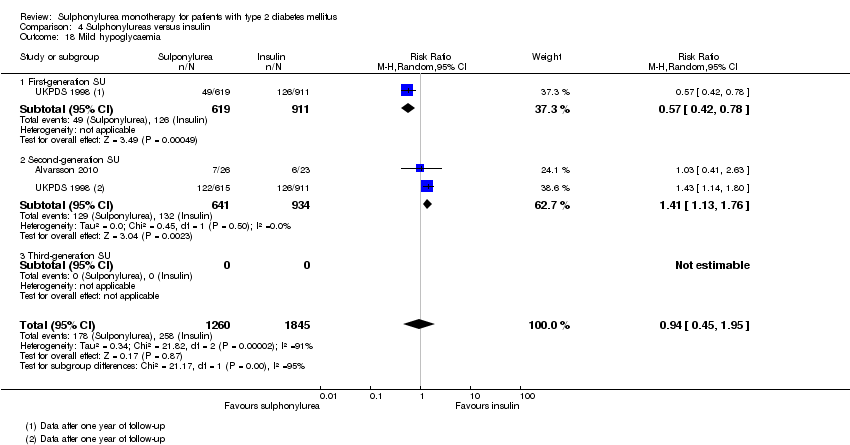 Comparison 4 Sulphonylureas versus insulin, Outcome 18 Mild hypoglycaemia. | ||||
| 18.1 First‐generation SU | 1 | 1530 | Risk Ratio (M‐H, Random, 95% CI) | 0.57 [0.42, 0.78] |
| 18.2 Second‐generation SU | 2 | 1575 | Risk Ratio (M‐H, Random, 95% CI) | 1.41 [1.13, 1.76] |
| 18.3 Third‐generation SU | 0 | 0 | Risk Ratio (M‐H, Random, 95% CI) | 0.0 [0.0, 0.0] |
| 19 Severe hypoglycaemia Show forest plot | 4 | 3172 | Risk Ratio (M‐H, Random, 95% CI) | 1.27 [0.38, 4.24] |
| Analysis 4.19  Comparison 4 Sulphonylureas versus insulin, Outcome 19 Severe hypoglycaemia. | ||||
| 19.1 First‐generation SU | 1 | 1530 | Risk Ratio (M‐H, Random, 95% CI) | 0.59 [0.11, 3.02] |
| 19.2 Second‐generation SU | 4 | 1642 | Risk Ratio (M‐H, Random, 95% CI) | 2.07 [0.66, 6.50] |
| 19.3 Third‐generation SU | 0 | 0 | Risk Ratio (M‐H, Random, 95% CI) | 0.0 [0.0, 0.0] |
| 20 Cancer Show forest plot | 3 | 3519 | Risk Ratio (M‐H, Random, 95% CI) | 1.01 [0.75, 1.36] |
| Analysis 4.20  Comparison 4 Sulphonylureas versus insulin, Outcome 20 Cancer. | ||||
| 20.1 First‐generation SU | 2 | 1944 | Risk Ratio (M‐H, Random, 95% CI) | 0.81 [0.29, 2.27] |
| 20.2 Second‐generation SU | 2 | 1575 | Risk Ratio (M‐H, Random, 95% CI) | 0.95 [0.61, 1.49] |
| 20.3 Third‐generation SU | 0 | 0 | Risk Ratio (M‐H, Random, 95% CI) | 0.0 [0.0, 0.0] |
| 21 Intervention failure Show forest plot | 4 | 3200 | Risk Ratio (M‐H, Random, 95% CI) | 1.24 [0.67, 2.27] |
| Analysis 4.21  Comparison 4 Sulphonylureas versus insulin, Outcome 21 Intervention failure. | ||||
| 21.1 First‐generation SU | 1 | 1530 | Risk Ratio (M‐H, Random, 95% CI) | 0.62 [0.44, 0.89] |
| 21.2 Second‐generation SU | 4 | 1670 | Risk Ratio (M‐H, Random, 95% CI) | 1.96 [0.80, 4.76] |
| 21.3 Third‐generation SU | 0 | 0 | Risk Ratio (M‐H, Random, 95% CI) | 0.0 [0.0, 0.0] |
| Outcome or subgroup title | No. of studies | No. of participants | Statistical method | Effect size |
| 1 All‐cause mortality Show forest plot | 6 | 714 | Risk Ratio (M‐H, Random, 95% CI) | 2.25 [0.43, 11.84] |
| Analysis 5.1  Comparison 5 Sulphonylureas versus alpha‐glucosidase inhibitors, Outcome 1 All‐cause mortality. | ||||
| 1.1 First‐generation SU | 2 | 246 | Risk Ratio (M‐H, Random, 95% CI) | 3.16 [0.13, 76.44] |
| 1.2 Second‐generation SU | 4 | 468 | Risk Ratio (M‐H, Random, 95% CI) | 1.98 [0.28, 13.86] |
| 1.3 Third‐generation SU | 0 | 0 | Risk Ratio (M‐H, Random, 95% CI) | 0.0 [0.0, 0.0] |
| 2 All‐cause mortality; best‐worst case scenario Show forest plot | 2 | 90 | Risk Ratio (M‐H, Random, 95% CI) | 0.0 [0.0, 0.0] |
| Analysis 5.2  Comparison 5 Sulphonylureas versus alpha‐glucosidase inhibitors, Outcome 2 All‐cause mortality; best‐worst case scenario. | ||||
| 2.1 First‐generation SU | 0 | 0 | Risk Ratio (M‐H, Random, 95% CI) | 0.0 [0.0, 0.0] |
| 2.2 Second‐generation SU | 2 | 90 | Risk Ratio (M‐H, Random, 95% CI) | 0.0 [0.0, 0.0] |
| 2.3 Third‐generation SU | 0 | 0 | Risk Ratio (M‐H, Random, 95% CI) | 0.0 [0.0, 0.0] |
| 3 All‐cause mortality; worst‐best case scenario Show forest plot | 2 | 90 | Risk Ratio (M‐H, Random, 95% CI) | 0.0 [0.0, 0.0] |
| Analysis 5.3  Comparison 5 Sulphonylureas versus alpha‐glucosidase inhibitors, Outcome 3 All‐cause mortality; worst‐best case scenario. | ||||
| 3.1 First‐generation SU | 0 | 0 | Risk Ratio (M‐H, Random, 95% CI) | 0.0 [0.0, 0.0] |
| 3.2 Second‐generation SU | 2 | 90 | Risk Ratio (M‐H, Random, 95% CI) | 0.0 [0.0, 0.0] |
| 3.3 Third‐generation SU | 0 | 0 | Risk Ratio (M‐H, Random, 95% CI) | 0.0 [0.0, 0.0] |
| 4 Cardiovascular mortality Show forest plot | 6 | 708 | Risk Ratio (M‐H, Random, 95% CI) | 2.39 [0.30, 19.28] |
| Analysis 5.4  Comparison 5 Sulphonylureas versus alpha‐glucosidase inhibitors, Outcome 4 Cardiovascular mortality. | ||||
| 4.1 First‐generation SU | 2 | 242 | Risk Ratio (M‐H, Random, 95% CI) | 3.0 [0.12, 72.44] |
| 4.2 Second‐generation SU | 4 | 466 | Risk Ratio (M‐H, Random, 95% CI) | 2.02 [0.13, 31.96] |
| 4.3 Third‐generation SU | 0 | 0 | Risk Ratio (M‐H, Random, 95% CI) | 0.0 [0.0, 0.0] |
| 5 Non‐fatal macrovascular outcomes Show forest plot | 2 | 345 | Risk Ratio (M‐H, Random, 95% CI) | 1.61 [1.06, 2.44] |
| Analysis 5.5  Comparison 5 Sulphonylureas versus alpha‐glucosidase inhibitors, Outcome 5 Non‐fatal macrovascular outcomes. | ||||
| 5.1 First‐generation SU | 0 | 0 | Risk Ratio (M‐H, Random, 95% CI) | 0.0 [0.0, 0.0] |
| 5.2 Second‐generation SU | 2 | 345 | Risk Ratio (M‐H, Random, 95% CI) | 1.61 [1.06, 2.44] |
| 5.3 Third‐generation SU | 0 | 0 | Risk Ratio (M‐H, Random, 95% CI) | 0.0 [0.0, 0.0] |
| 6 Non‐fatal myocardial infarction Show forest plot | 2 | 133 | Risk Ratio (M‐H, Random, 95% CI) | 0.96 [0.06, 14.92] |
| Analysis 5.6  Comparison 5 Sulphonylureas versus alpha‐glucosidase inhibitors, Outcome 6 Non‐fatal myocardial infarction. | ||||
| 6.1 First‐generation SU | 1 | 98 | Risk Ratio (M‐H, Random, 95% CI) | 0.96 [0.06, 14.92] |
| 6.2 Second‐generation SU | 1 | 35 | Risk Ratio (M‐H, Random, 95% CI) | 0.0 [0.0, 0.0] |
| 6.3 Third‐generation SU | 0 | 0 | Risk Ratio (M‐H, Random, 95% CI) | 0.0 [0.0, 0.0] |
| 7 Non‐fatal stroke Show forest plot | 1 | 35 | Risk Ratio (M‐H, Random, 95% CI) | 0.0 [0.0, 0.0] |
| Analysis 5.7  Comparison 5 Sulphonylureas versus alpha‐glucosidase inhibitors, Outcome 7 Non‐fatal stroke. | ||||
| 7.1 First‐generation SU | 0 | 0 | Risk Ratio (M‐H, Random, 95% CI) | 0.0 [0.0, 0.0] |
| 7.2 Second‐generation SU | 1 | 35 | Risk Ratio (M‐H, Random, 95% CI) | 0.0 [0.0, 0.0] |
| 7.3 Third‐generation SU | 0 | 0 | Risk Ratio (M‐H, Random, 95% CI) | 0.0 [0.0, 0.0] |
| 8 Amputation of lower extremity Show forest plot | 1 | 35 | Risk Ratio (M‐H, Random, 95% CI) | 0.0 [0.0, 0.0] |
| Analysis 5.8  Comparison 5 Sulphonylureas versus alpha‐glucosidase inhibitors, Outcome 8 Amputation of lower extremity. | ||||
| 8.1 First‐generation SU | 0 | 0 | Risk Ratio (M‐H, Random, 95% CI) | 0.0 [0.0, 0.0] |
| 8.2 Second‐generation SU | 1 | 35 | Risk Ratio (M‐H, Random, 95% CI) | 0.0 [0.0, 0.0] |
| 8.3 Third‐generation SU | 0 | 0 | Risk Ratio (M‐H, Random, 95% CI) | 0.0 [0.0, 0.0] |
| 9 Cardial revascularisation Show forest plot | 1 | 35 | Risk Ratio (M‐H, Random, 95% CI) | 0.0 [0.0, 0.0] |
| Analysis 5.9  Comparison 5 Sulphonylureas versus alpha‐glucosidase inhibitors, Outcome 9 Cardial revascularisation. | ||||
| 9.1 First‐generation SU | 0 | 0 | Risk Ratio (M‐H, Random, 95% CI) | 0.0 [0.0, 0.0] |
| 9.2 Second‐generation SU | 1 | 35 | Risk Ratio (M‐H, Random, 95% CI) | 0.0 [0.0, 0.0] |
| 9.3 Third‐generation SU | 0 | 0 | Risk Ratio (M‐H, Random, 95% CI) | 0.0 [0.0, 0.0] |
| 10 Peripheral revascularisation Show forest plot | 1 | 35 | Risk Ratio (M‐H, Random, 95% CI) | 0.0 [0.0, 0.0] |
| Analysis 5.10  Comparison 5 Sulphonylureas versus alpha‐glucosidase inhibitors, Outcome 10 Peripheral revascularisation. | ||||
| 10.1 First‐generation SU | 0 | 0 | Risk Ratio (M‐H, Random, 95% CI) | 0.0 [0.0, 0.0] |
| 10.2 Second‐generation SU | 1 | 35 | Risk Ratio (M‐H, Random, 95% CI) | 0.0 [0.0, 0.0] |
| 10.3 Third‐generation SU | 0 | 0 | Risk Ratio (M‐H, Random, 95% CI) | 0.0 [0.0, 0.0] |
| 11 Microvascular outcomes Show forest plot | 1 | 35 | Risk Ratio (M‐H, Random, 95% CI) | 0.0 [0.0, 0.0] |
| Analysis 5.11  Comparison 5 Sulphonylureas versus alpha‐glucosidase inhibitors, Outcome 11 Microvascular outcomes. | ||||
| 11.1 First‐generation SU | 0 | 0 | Risk Ratio (M‐H, Random, 95% CI) | 0.0 [0.0, 0.0] |
| 11.2 Second‐generation SU | 1 | 35 | Risk Ratio (M‐H, Random, 95% CI) | 0.0 [0.0, 0.0] |
| 11.3 Third‐generation SU | 0 | 0 | Risk Ratio (M‐H, Random, 95% CI) | 0.0 [0.0, 0.0] |
| 12 Nephropathy Show forest plot | 1 | 35 | Risk Ratio (M‐H, Random, 95% CI) | 0.0 [0.0, 0.0] |
| Analysis 5.12  Comparison 5 Sulphonylureas versus alpha‐glucosidase inhibitors, Outcome 12 Nephropathy. | ||||
| 12.1 First‐generation SU | 0 | 0 | Risk Ratio (M‐H, Random, 95% CI) | 0.0 [0.0, 0.0] |
| 12.2 Second‐generation SU | 1 | 35 | Risk Ratio (M‐H, Random, 95% CI) | 0.0 [0.0, 0.0] |
| 12.3 Third‐generation SU | 0 | 0 | Risk Ratio (M‐H, Random, 95% CI) | 0.0 [0.0, 0.0] |
| 13 Retinopathy Show forest plot | 1 | 35 | Risk Ratio (M‐H, Random, 95% CI) | 0.0 [0.0, 0.0] |
| Analysis 5.13  Comparison 5 Sulphonylureas versus alpha‐glucosidase inhibitors, Outcome 13 Retinopathy. | ||||
| 13.1 First‐generation SU | 0 | 0 | Risk Ratio (M‐H, Random, 95% CI) | 0.0 [0.0, 0.0] |
| 13.2 Second‐generation SU | 1 | 35 | Risk Ratio (M‐H, Random, 95% CI) | 0.0 [0.0, 0.0] |
| 13.3 Third‐generation SU | 0 | 0 | Risk Ratio (M‐H, Random, 95% CI) | 0.0 [0.0, 0.0] |
| 14 Retinal photocoagulation Show forest plot | 1 | 35 | Risk Ratio (M‐H, Random, 95% CI) | 0.0 [0.0, 0.0] |
| Analysis 5.14  Comparison 5 Sulphonylureas versus alpha‐glucosidase inhibitors, Outcome 14 Retinal photocoagulation. | ||||
| 14.1 First‐generation SU | 0 | 0 | Risk Ratio (M‐H, Random, 95% CI) | 0.0 [0.0, 0.0] |
| 14.2 Second‐generation SU | 1 | 35 | Risk Ratio (M‐H, Random, 95% CI) | 0.0 [0.0, 0.0] |
| 14.3 Third‐generation SU | 0 | 0 | Risk Ratio (M‐H, Random, 95% CI) | 0.0 [0.0, 0.0] |
| 15 Change in fasting blood glucose from baseline (mmol/L) Show forest plot | 11 | 915 | Mean Difference (IV, Random, 95% CI) | ‐0.46 [‐0.80, ‐0.11] |
| Analysis 5.15  Comparison 5 Sulphonylureas versus alpha‐glucosidase inhibitors, Outcome 15 Change in fasting blood glucose from baseline (mmol/L). | ||||
| 15.1 First‐generation SU | 2 | 208 | Mean Difference (IV, Random, 95% CI) | ‐1.16 [‐1.92, ‐0.41] |
| 15.2 Second‐generation SU | 8 | 488 | Mean Difference (IV, Random, 95% CI) | ‐0.16 [‐0.42, 0.11] |
| 15.3 Third‐generation SU | 1 | 219 | Mean Difference (IV, Random, 95% CI) | ‐1.20 [‐1.92, ‐0.48] |
| 16 Change in HbA1c from baseline (%) Show forest plot | 13 | 968 | Mean Difference (IV, Random, 95% CI) | ‐0.20 [‐0.46, 0.06] |
| Analysis 5.16 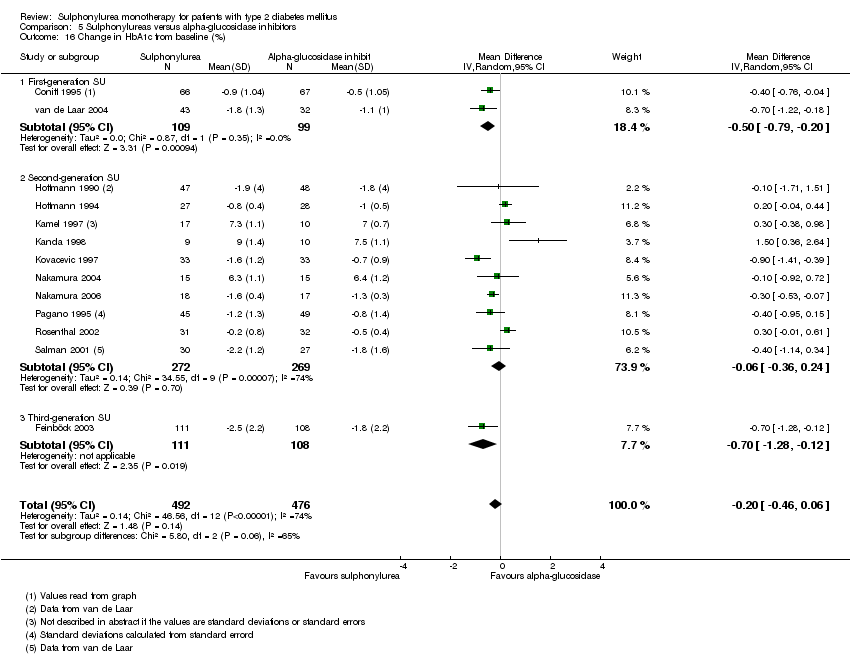 Comparison 5 Sulphonylureas versus alpha‐glucosidase inhibitors, Outcome 16 Change in HbA1c from baseline (%). | ||||
| 16.1 First‐generation SU | 2 | 208 | Mean Difference (IV, Random, 95% CI) | ‐0.50 [‐0.79, ‐0.20] |
| 16.2 Second‐generation SU | 10 | 541 | Mean Difference (IV, Random, 95% CI) | ‐0.06 [‐0.36, 0.24] |
| 16.3 Third‐generation SU | 1 | 219 | Mean Difference (IV, Random, 95% CI) | ‐0.7 [‐1.28, ‐0.12] |
| 17 Change in BMI from baseline (kg/m2) Show forest plot | 5 | 232 | Mean Difference (IV, Random, 95% CI) | ‐0.02 [‐0.20, 0.16] |
| Analysis 5.17  Comparison 5 Sulphonylureas versus alpha‐glucosidase inhibitors, Outcome 17 Change in BMI from baseline (kg/m2). | ||||
| 17.1 First‐generation SU | 0 | 0 | Mean Difference (IV, Random, 95% CI) | 0.0 [0.0, 0.0] |
| 17.2 Second‐generation SU | 5 | 232 | Mean Difference (IV, Random, 95% CI) | ‐0.02 [‐0.20, 0.16] |
| 17.3 Third‐generation SU | 0 | 0 | Mean Difference (IV, Random, 95% CI) | 0.0 [0.0, 0.0] |
| 18 Change in weight from baseline (kg) Show forest plot | 7 | 689 | Mean Difference (IV, Random, 95% CI) | 0.81 [‐0.61, 2.23] |
| Analysis 5.18  Comparison 5 Sulphonylureas versus alpha‐glucosidase inhibitors, Outcome 18 Change in weight from baseline (kg). | ||||
| 18.1 First‐generation SU | 1 | 132 | Mean Difference (IV, Random, 95% CI) | 3.2 [2.29, 4.11] |
| 18.2 Second‐generation SU | 5 | 338 | Mean Difference (IV, Random, 95% CI) | ‐0.22 [‐0.47, 0.03] |
| 18.3 Third‐generation SU | 1 | 219 | Mean Difference (IV, Random, 95% CI) | 1.5 [0.28, 2.72] |
| 19 Adverse events Show forest plot | 11 | 1111 | Risk Ratio (M‐H, Random, 95% CI) | 0.65 [0.51, 0.82] |
| Analysis 5.19  Comparison 5 Sulphonylureas versus alpha‐glucosidase inhibitors, Outcome 19 Adverse events. | ||||
| 19.1 First‐generation SU | 2 | 246 | Risk Ratio (M‐H, Random, 95% CI) | 0.63 [0.52, 0.76] |
| 19.2 Second‐generation SU | 8 | 646 | Risk Ratio (M‐H, Random, 95% CI) | 0.64 [0.39, 1.03] |
| 19.3 Third‐generation SU | 1 | 219 | Risk Ratio (M‐H, Random, 95% CI) | 0.64 [0.53, 0.78] |
| 20 Serious adverse events Show forest plot | 3 | 229 | Risk Ratio (M‐H, Random, 95% CI) | 0.52 [0.09, 3.03] |
| Analysis 5.20  Comparison 5 Sulphonylureas versus alpha‐glucosidase inhibitors, Outcome 20 Serious adverse events. | ||||
| 20.1 First‐generation SU | 1 | 98 | Risk Ratio (M‐H, Random, 95% CI) | 0.96 [0.14, 6.55] |
| 20.2 Second‐generation SU | 2 | 131 | Risk Ratio (M‐H, Random, 95% CI) | 0.15 [0.01, 2.81] |
| 20.3 Third‐generation SU | 0 | 0 | Risk Ratio (M‐H, Random, 95% CI) | 0.0 [0.0, 0.0] |
| 21 Drop‐outs due to adverse events Show forest plot | 12 | 1335 | Risk Ratio (M‐H, Random, 95% CI) | 0.37 [0.22, 0.63] |
| Analysis 5.21  Comparison 5 Sulphonylureas versus alpha‐glucosidase inhibitors, Outcome 21 Drop‐outs due to adverse events. | ||||
| 21.1 First‐generation SU | 2 | 246 | Risk Ratio (M‐H, Random, 95% CI) | 0.28 [0.12, 0.67] |
| 21.2 Second‐generation SU | 9 | 870 | Risk Ratio (M‐H, Random, 95% CI) | 0.48 [0.24, 0.96] |
| 21.3 Third‐generation SU | 1 | 219 | Risk Ratio (M‐H, Random, 95% CI) | 0.19 [0.02, 1.64] |
| 22 Mild hypoglycaemia Show forest plot | 6 | 636 | Risk Ratio (M‐H, Random, 95% CI) | 8.59 [2.62, 28.12] |
| Analysis 5.22 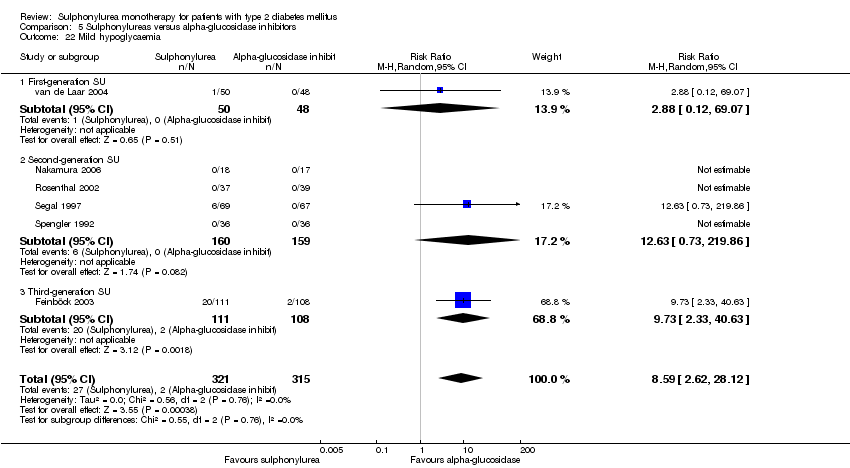 Comparison 5 Sulphonylureas versus alpha‐glucosidase inhibitors, Outcome 22 Mild hypoglycaemia. | ||||
| 22.1 First‐generation SU | 1 | 98 | Risk Ratio (M‐H, Random, 95% CI) | 2.88 [0.12, 69.07] |
| 22.2 Second‐generation SU | 4 | 319 | Risk Ratio (M‐H, Random, 95% CI) | 12.63 [0.73, 219.86] |
| 22.3 Third‐generation SU | 1 | 219 | Risk Ratio (M‐H, Random, 95% CI) | 9.73 [2.33, 40.63] |
| 23 Moderate hypoglycaemia Show forest plot | 3 | 183 | Risk Ratio (M‐H, Random, 95% CI) | 0.0 [0.0, 0.0] |
| Analysis 5.23 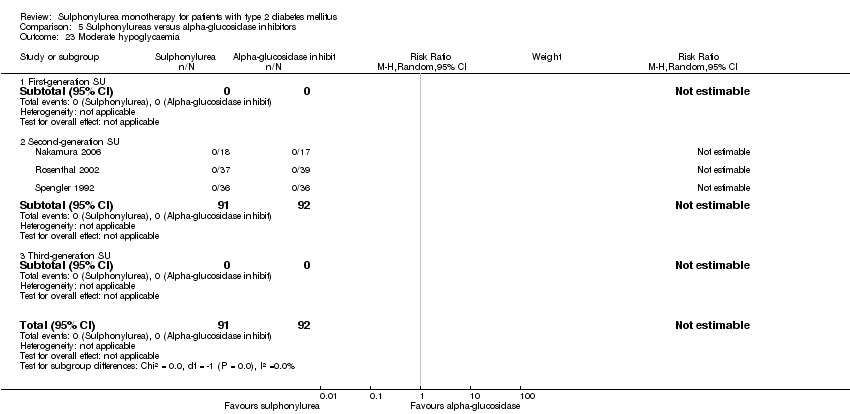 Comparison 5 Sulphonylureas versus alpha‐glucosidase inhibitors, Outcome 23 Moderate hypoglycaemia. | ||||
| 23.1 First‐generation SU | 0 | 0 | Risk Ratio (M‐H, Random, 95% CI) | 0.0 [0.0, 0.0] |
| 23.2 Second‐generation SU | 3 | 183 | Risk Ratio (M‐H, Random, 95% CI) | 0.0 [0.0, 0.0] |
| 23.3 Third‐generation SU | 0 | 0 | Risk Ratio (M‐H, Random, 95% CI) | 0.0 [0.0, 0.0] |
| 24 Severe hypoglycaemia Show forest plot | 5 | 500 | Risk Ratio (M‐H, Random, 95% CI) | 0.0 [0.0, 0.0] |
| Analysis 5.24  Comparison 5 Sulphonylureas versus alpha‐glucosidase inhibitors, Outcome 24 Severe hypoglycaemia. | ||||
| 24.1 First‐generation SU | 1 | 98 | Risk Ratio (M‐H, Random, 95% CI) | 0.0 [0.0, 0.0] |
| 24.2 Second‐generation SU | 3 | 183 | Risk Ratio (M‐H, Random, 95% CI) | 0.0 [0.0, 0.0] |
| 24.3 Third‐generation SU | 1 | 219 | Risk Ratio (M‐H, Random, 95% CI) | 0.0 [0.0, 0.0] |
| 25 Cancer Show forest plot | 3 | 443 | Risk Ratio (M‐H, Random, 95% CI) | 0.90 [0.11, 7.27] |
| Analysis 5.25  Comparison 5 Sulphonylureas versus alpha‐glucosidase inhibitors, Outcome 25 Cancer. | ||||
| 25.1 First‐generation SU | 1 | 98 | Risk Ratio (M‐H, Random, 95% CI) | 0.32 [0.01, 7.67] |
| 25.2 Second‐generation SU | 2 | 345 | Risk Ratio (M‐H, Random, 95% CI) | 1.98 [0.13, 31.35] |
| 25.3 Third‐generation SU | 0 | 0 | Risk Ratio (M‐H, Random, 95% CI) | 0.0 [0.0, 0.0] |
| 26 Intervention failure Show forest plot | 5 | 831 | Risk Ratio (M‐H, Random, 95% CI) | 0.32 [0.18, 0.57] |
| Analysis 5.26  Comparison 5 Sulphonylureas versus alpha‐glucosidase inhibitors, Outcome 26 Intervention failure. | ||||
| 26.1 First‐generation SU | 1 | 98 | Risk Ratio (M‐H, Random, 95% CI) | 0.32 [0.01, 7.67] |
| 26.2 Second‐generation SU | 3 | 514 | Risk Ratio (M‐H, Random, 95% CI) | 0.25 [0.07, 0.92] |
| 26.3 Third‐generation SU | 1 | 219 | Risk Ratio (M‐H, Random, 95% CI) | 0.34 [0.17, 0.65] |
| Outcome or subgroup title | No. of studies | No. of participants | Statistical method | Effect size |
| 1 All‐cause mortality Show forest plot | 3 | 2249 | Risk Ratio (M‐H, Random, 95% CI) | 1.57 [0.62, 4.00] |
| Analysis 6.1  Comparison 6 Sulphonylureas versus incretin‐based intervention, Outcome 1 All‐cause mortality. | ||||
| 1.1 First‐generation SU | 0 | 0 | Risk Ratio (M‐H, Random, 95% CI) | 0.0 [0.0, 0.0] |
| 1.2 Second‐generation SU | 2 | 1503 | Risk Ratio (M‐H, Random, 95% CI) | 1.39 [0.52, 3.68] |
| 1.3 Third‐generation SU | 1 | 746 | Risk Ratio (M‐H, Random, 95% CI) | 6.01 [0.25, 147.05] |
| 2 All‐cause mortality; best‐worst case scenario Show forest plot | 1 | 1092 | Risk Ratio (M‐H, Random, 95% CI) | 0.39 [0.18, 0.84] |
| Analysis 6.2  Comparison 6 Sulphonylureas versus incretin‐based intervention, Outcome 2 All‐cause mortality; best‐worst case scenario. | ||||
| 2.1 First‐generation SU | 0 | 0 | Risk Ratio (M‐H, Random, 95% CI) | 0.0 [0.0, 0.0] |
| 2.2 Second‐generation SU | 1 | 1092 | Risk Ratio (M‐H, Random, 95% CI) | 0.39 [0.18, 0.84] |
| 2.3 Third‐generation SU | 0 | 0 | Risk Ratio (M‐H, Random, 95% CI) | 0.0 [0.0, 0.0] |
| 3 All‐cause mortality; worst‐best case scenario Show forest plot | 1 | 1092 | Risk Ratio (M‐H, Random, 95% CI) | 3.67 [1.50, 8.97] |
| Analysis 6.3 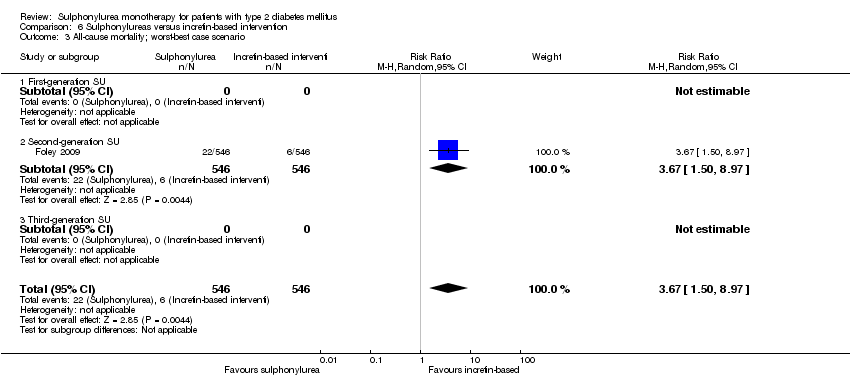 Comparison 6 Sulphonylureas versus incretin‐based intervention, Outcome 3 All‐cause mortality; worst‐best case scenario. | ||||
| 3.1 First‐generation SU | 0 | 0 | Risk Ratio (M‐H, Random, 95% CI) | 0.0 [0.0, 0.0] |
| 3.2 Second‐generation SU | 1 | 1092 | Risk Ratio (M‐H, Random, 95% CI) | 3.67 [1.50, 8.97] |
| 3.3 Third‐generation SU | 0 | 0 | Risk Ratio (M‐H, Random, 95% CI) | 0.0 [0.0, 0.0] |
| 4 Cardiovascular mortality Show forest plot | 2 | 1157 | Risk Ratio (M‐H, Random, 95% CI) | 6.01 [0.25, 147.05] |
| Analysis 6.4  Comparison 6 Sulphonylureas versus incretin‐based intervention, Outcome 4 Cardiovascular mortality. | ||||
| 4.1 First‐generation SU | 0 | 0 | Risk Ratio (M‐H, Random, 95% CI) | 0.0 [0.0, 0.0] |
| 4.2 Second‐generation SU | 1 | 411 | Risk Ratio (M‐H, Random, 95% CI) | 0.0 [0.0, 0.0] |
| 4.3 Third‐generation SU | 1 | 746 | Risk Ratio (M‐H, Random, 95% CI) | 6.01 [0.25, 147.05] |
| 5 Non‐fatal macrovascular outcomes Show forest plot | 1 | 411 | Risk Ratio (M‐H, Random, 95% CI) | 1.61 [0.82, 3.17] |
| Analysis 6.5 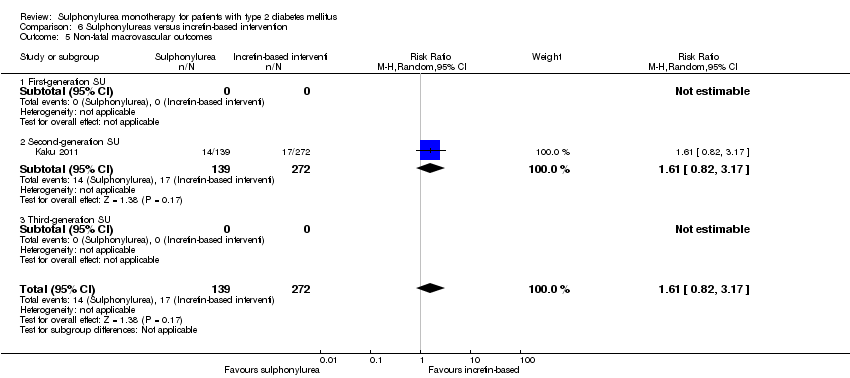 Comparison 6 Sulphonylureas versus incretin‐based intervention, Outcome 5 Non‐fatal macrovascular outcomes. | ||||
| 5.1 First‐generation SU | 0 | 0 | Risk Ratio (M‐H, Random, 95% CI) | 0.0 [0.0, 0.0] |
| 5.2 Second‐generation SU | 1 | 411 | Risk Ratio (M‐H, Random, 95% CI) | 1.61 [0.82, 3.17] |
| 5.3 Third‐generation SU | 0 | 0 | Risk Ratio (M‐H, Random, 95% CI) | 0.0 [0.0, 0.0] |
| 6 Non‐fatal myocardial infarction Show forest plot | 2 | 1157 | Risk Ratio (M‐H, Random, 95% CI) | 0.66 [0.10, 4.19] |
| Analysis 6.6 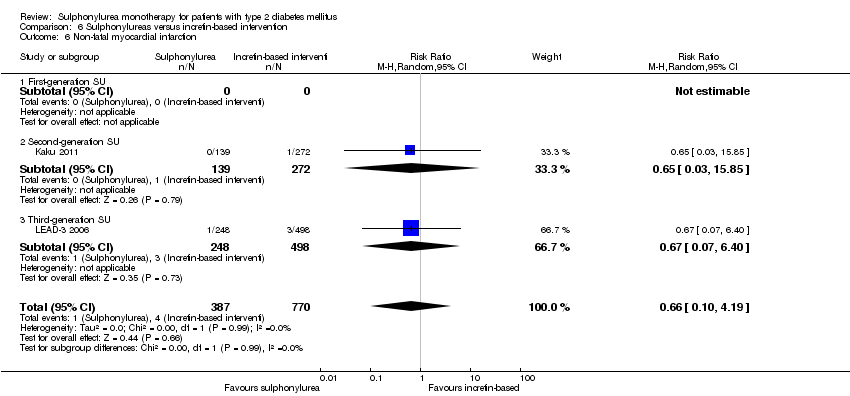 Comparison 6 Sulphonylureas versus incretin‐based intervention, Outcome 6 Non‐fatal myocardial infarction. | ||||
| 6.1 First‐generation SU | 0 | 0 | Risk Ratio (M‐H, Random, 95% CI) | 0.0 [0.0, 0.0] |
| 6.2 Second‐generation SU | 1 | 411 | Risk Ratio (M‐H, Random, 95% CI) | 0.65 [0.03, 15.85] |
| 6.3 Third‐generation SU | 1 | 746 | Risk Ratio (M‐H, Random, 95% CI) | 0.67 [0.07, 6.40] |
| 7 Non‐fatal stroke Show forest plot | 1 | 411 | Risk Ratio (M‐H, Random, 95% CI) | 3.91 [0.36, 42.79] |
| Analysis 6.7 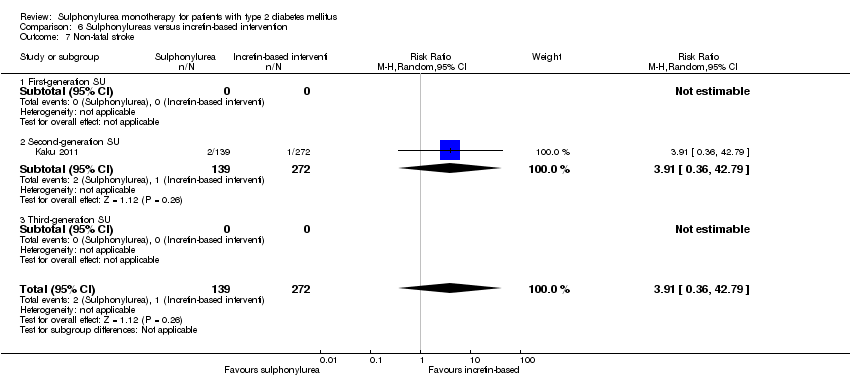 Comparison 6 Sulphonylureas versus incretin‐based intervention, Outcome 7 Non‐fatal stroke. | ||||
| 7.1 First‐generation SU | 0 | 0 | Risk Ratio (M‐H, Random, 95% CI) | 0.0 [0.0, 0.0] |
| 7.2 Second‐generation SU | 1 | 411 | Risk Ratio (M‐H, Random, 95% CI) | 3.91 [0.36, 42.79] |
| 7.3 Third‐generation SU | 0 | 0 | Risk Ratio (M‐H, Random, 95% CI) | 0.0 [0.0, 0.0] |
| 8 Amputation of lower extremity Show forest plot | 1 | 411 | Risk Ratio (M‐H, Random, 95% CI) | 0.0 [0.0, 0.0] |
| Analysis 6.8  Comparison 6 Sulphonylureas versus incretin‐based intervention, Outcome 8 Amputation of lower extremity. | ||||
| 8.1 First‐generation SU | 0 | 0 | Risk Ratio (M‐H, Random, 95% CI) | 0.0 [0.0, 0.0] |
| 8.2 Second‐generation SU | 1 | 411 | Risk Ratio (M‐H, Random, 95% CI) | 0.0 [0.0, 0.0] |
| 8.3 Third‐generation SU | 0 | 0 | Risk Ratio (M‐H, Random, 95% CI) | 0.0 [0.0, 0.0] |
| 9 Cardial revascularisation Show forest plot | 1 | 411 | Risk Ratio (M‐H, Random, 95% CI) | 0.0 [0.0, 0.0] |
| Analysis 6.9  Comparison 6 Sulphonylureas versus incretin‐based intervention, Outcome 9 Cardial revascularisation. | ||||
| 9.1 First‐generation SU | 0 | 0 | Risk Ratio (M‐H, Random, 95% CI) | 0.0 [0.0, 0.0] |
| 9.2 Second‐generation SU | 1 | 411 | Risk Ratio (M‐H, Random, 95% CI) | 0.0 [0.0, 0.0] |
| 9.3 Third‐generation SU | 0 | 0 | Risk Ratio (M‐H, Random, 95% CI) | 0.0 [0.0, 0.0] |
| 10 Peripheral revascularisation Show forest plot | 1 | 411 | Risk Ratio (M‐H, Random, 95% CI) | 0.0 [0.0, 0.0] |
| Analysis 6.10  Comparison 6 Sulphonylureas versus incretin‐based intervention, Outcome 10 Peripheral revascularisation. | ||||
| 10.1 First‐generation SU | 0 | 0 | Risk Ratio (M‐H, Random, 95% CI) | 0.0 [0.0, 0.0] |
| 10.2 Second‐generation SU | 1 | 411 | Risk Ratio (M‐H, Random, 95% CI) | 0.0 [0.0, 0.0] |
| 10.3 Third‐generation SU | 0 | 0 | Risk Ratio (M‐H, Random, 95% CI) | 0.0 [0.0, 0.0] |
| 11 Microvascular outcomes Show forest plot | 1 | 411 | Risk Ratio (M‐H, Random, 95% CI) | 1.09 [0.52, 2.29] |
| Analysis 6.11  Comparison 6 Sulphonylureas versus incretin‐based intervention, Outcome 11 Microvascular outcomes. | ||||
| 11.1 First‐generation SU | 0 | 0 | Risk Ratio (M‐H, Random, 95% CI) | 0.0 [0.0, 0.0] |
| 11.2 Second‐generation SU | 1 | 411 | Risk Ratio (M‐H, Random, 95% CI) | 1.09 [0.52, 2.29] |
| 11.3 Third‐generation SU | 0 | 0 | Risk Ratio (M‐H, Random, 95% CI) | 0.0 [0.0, 0.0] |
| 12 Nephropathy Show forest plot | 1 | 411 | Risk Ratio (M‐H, Random, 95% CI) | 0.98 [0.09, 10.70] |
| Analysis 6.12  Comparison 6 Sulphonylureas versus incretin‐based intervention, Outcome 12 Nephropathy. | ||||
| 12.1 First‐generation SU | 0 | 0 | Risk Ratio (M‐H, Random, 95% CI) | 0.0 [0.0, 0.0] |
| 12.2 Second‐generation SU | 1 | 411 | Risk Ratio (M‐H, Random, 95% CI) | 0.98 [0.09, 10.70] |
| 12.3 Third‐generation SU | 0 | 0 | Risk Ratio (M‐H, Random, 95% CI) | 0.0 [0.0, 0.0] |
| 13 Retinopathy Show forest plot | 1 | 411 | Risk Ratio (M‐H, Random, 95% CI) | 1.10 [0.50, 2.43] |
| Analysis 6.13  Comparison 6 Sulphonylureas versus incretin‐based intervention, Outcome 13 Retinopathy. | ||||
| 13.1 First‐generation SU | 0 | 0 | Risk Ratio (M‐H, Random, 95% CI) | 0.0 [0.0, 0.0] |
| 13.2 Second‐generation SU | 1 | 411 | Risk Ratio (M‐H, Random, 95% CI) | 1.10 [0.50, 2.43] |
| 13.3 Third‐generation SU | 0 | 0 | Risk Ratio (M‐H, Random, 95% CI) | 0.0 [0.0, 0.0] |
| 14 Retinal photocoagulation Show forest plot | 1 | 411 | Risk Ratio (M‐H, Random, 95% CI) | 0.0 [0.0, 0.0] |
| Analysis 6.14 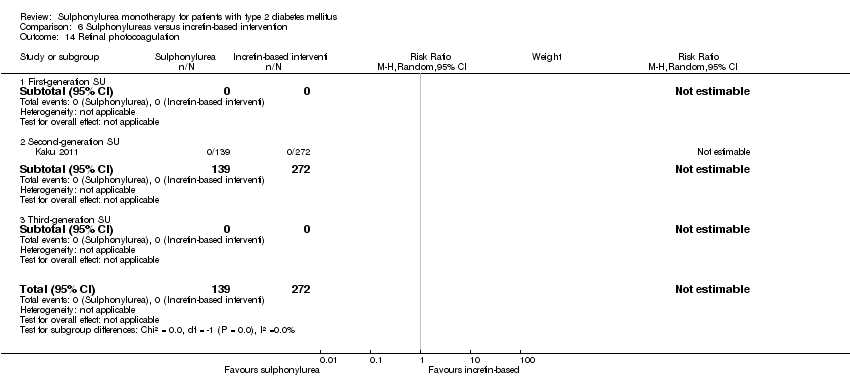 Comparison 6 Sulphonylureas versus incretin‐based intervention, Outcome 14 Retinal photocoagulation. | ||||
| 14.1 First‐generation SU | 0 | 0 | Risk Ratio (M‐H, Random, 95% CI) | 0.0 [0.0, 0.0] |
| 14.2 Second‐generation SU | 1 | 411 | Risk Ratio (M‐H, Random, 95% CI) | 0.0 [0.0, 0.0] |
| 14.3 Third‐generation SU | 0 | 0 | Risk Ratio (M‐H, Random, 95% CI) | 0.0 [0.0, 0.0] |
| 15 Change in fasting blood glucose from baseline (mmol/L) Show forest plot | 3 | 1948 | Mean Difference (IV, Random, 95% CI) | 0.34 [‐0.44, 1.13] |
| Analysis 6.15 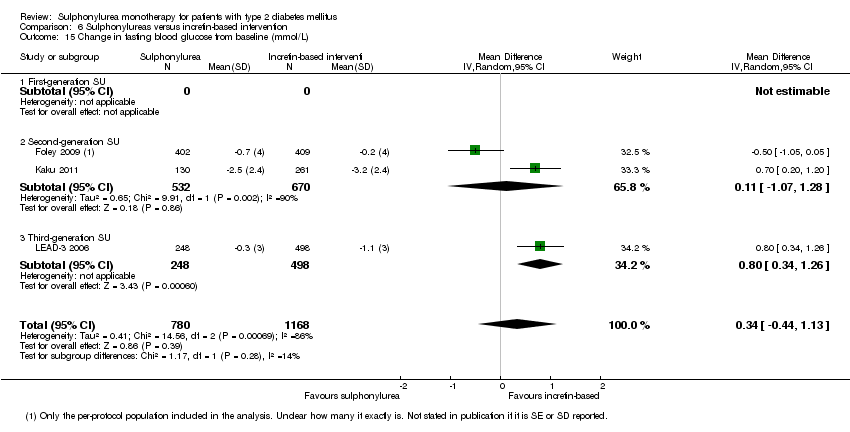 Comparison 6 Sulphonylureas versus incretin‐based intervention, Outcome 15 Change in fasting blood glucose from baseline (mmol/L). | ||||
| 15.1 First‐generation SU | 0 | 0 | Mean Difference (IV, Random, 95% CI) | 0.0 [0.0, 0.0] |
| 15.2 Second‐generation SU | 2 | 1202 | Mean Difference (IV, Random, 95% CI) | 0.11 [‐1.07, 1.28] |
| 15.3 Third‐generation SU | 1 | 746 | Mean Difference (IV, Random, 95% CI) | 0.8 [0.34, 1.26] |
| 16 Change in HbA1c from baseline (%) Show forest plot | 3 | 1950 | Mean Difference (IV, Random, 95% CI) | 0.35 [0.05, 0.64] |
| Analysis 6.16 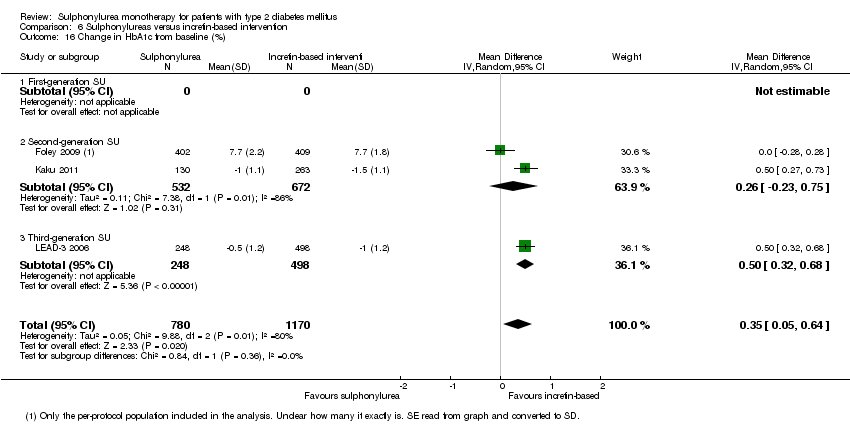 Comparison 6 Sulphonylureas versus incretin‐based intervention, Outcome 16 Change in HbA1c from baseline (%). | ||||
| 16.1 First‐generation SU | 0 | 0 | Mean Difference (IV, Random, 95% CI) | 0.0 [0.0, 0.0] |
| 16.2 Second‐generation SU | 2 | 1204 | Mean Difference (IV, Random, 95% CI) | 0.26 [‐0.23, 0.75] |
| 16.3 Third‐generation SU | 1 | 746 | Mean Difference (IV, Random, 95% CI) | 0.5 [0.32, 0.68] |
| 17 Change in BMI from baseline (kg/m2) Show forest plot | 1 | 400 | Mean Difference (IV, Random, 95% CI) | 0.7 [0.52, 0.88] |
| Analysis 6.17  Comparison 6 Sulphonylureas versus incretin‐based intervention, Outcome 17 Change in BMI from baseline (kg/m2). | ||||
| 17.1 First‐generation SU | 0 | 0 | Mean Difference (IV, Random, 95% CI) | 0.0 [0.0, 0.0] |
| 17.2 Second‐generation SU | 1 | 400 | Mean Difference (IV, Random, 95% CI) | 0.7 [0.52, 0.88] |
| 17.3 Third‐generation SU | 0 | 0 | Mean Difference (IV, Random, 95% CI) | 0.0 [0.0, 0.0] |
| 18 Change in weight from baseline (kg) Show forest plot | 3 | 1952 | Mean Difference (IV, Random, 95% CI) | 1.96 [0.63, 3.28] |
| Analysis 6.18  Comparison 6 Sulphonylureas versus incretin‐based intervention, Outcome 18 Change in weight from baseline (kg). | ||||
| 18.1 First‐generation SU | 0 | 0 | Mean Difference (IV, Random, 95% CI) | 0.0 [0.0, 0.0] |
| 18.2 Second‐generation SU | 2 | 1206 | Mean Difference (IV, Random, 95% CI) | 1.31 [0.33, 2.29] |
| 18.3 Third‐generation SU | 1 | 746 | Mean Difference (IV, Random, 95% CI) | 3.30 [2.64, 3.96] |
| 19 Adverse events Show forest plot | 2 | 1157 | Risk Ratio (M‐H, Random, 95% CI) | 0.89 [0.74, 1.08] |
| Analysis 6.19  Comparison 6 Sulphonylureas versus incretin‐based intervention, Outcome 19 Adverse events. | ||||
| 19.1 First‐generation SU | 0 | 0 | Risk Ratio (M‐H, Random, 95% CI) | 0.0 [0.0, 0.0] |
| 19.2 Second‐generation SU | 1 | 411 | Risk Ratio (M‐H, Random, 95% CI) | 0.97 [0.90, 1.04] |
| 19.3 Third‐generation SU | 1 | 746 | Risk Ratio (M‐H, Random, 95% CI) | 0.82 [0.73, 0.92] |
| 20 Serious adverse events Show forest plot | 2 | 1157 | Risk Ratio (M‐H, Random, 95% CI) | 1.22 [0.77, 1.94] |
| Analysis 6.20  Comparison 6 Sulphonylureas versus incretin‐based intervention, Outcome 20 Serious adverse events. | ||||
| 20.1 First‐generation SU | 0 | 0 | Risk Ratio (M‐H, Random, 95% CI) | 0.0 [0.0, 0.0] |
| 20.2 Second‐generation SU | 1 | 411 | Risk Ratio (M‐H, Random, 95% CI) | 1.37 [0.71, 2.63] |
| 20.3 Third‐generation SU | 1 | 746 | Risk Ratio (M‐H, Random, 95% CI) | 1.09 [0.56, 2.10] |
| 21 Drop‐outs due to adverse events Show forest plot | 3 | 2249 | Risk Ratio (M‐H, Random, 95% CI) | 0.89 [0.64, 1.24] |
| Analysis 6.21  Comparison 6 Sulphonylureas versus incretin‐based intervention, Outcome 21 Drop‐outs due to adverse events. | ||||
| 21.1 First‐generation SU | 0 | 0 | Risk Ratio (M‐H, Random, 95% CI) | 0.0 [0.0, 0.0] |
| 21.2 Second‐generation SU | 2 | 1503 | Risk Ratio (M‐H, Random, 95% CI) | 1.00 [0.67, 1.50] |
| 21.3 Third‐generation SU | 1 | 746 | Risk Ratio (M‐H, Random, 95% CI) | 0.70 [0.40, 1.24] |
| 22 Mild hypoglycaemia Show forest plot | 3 | 2249 | Risk Ratio (M‐H, Random, 95% CI) | 2.07 [1.44, 2.97] |
| Analysis 6.22 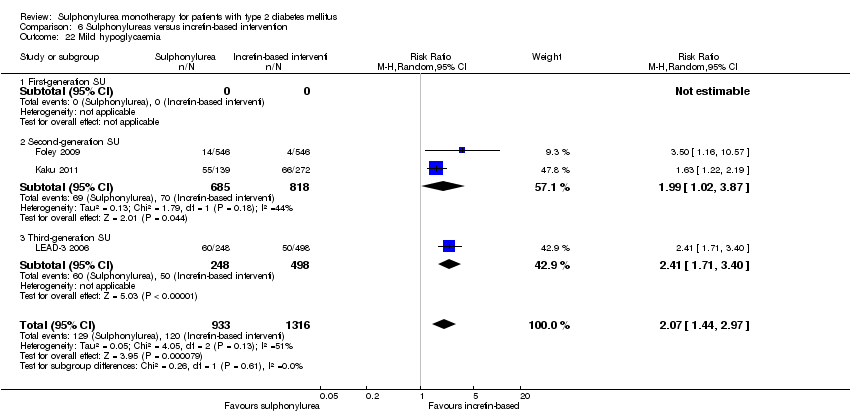 Comparison 6 Sulphonylureas versus incretin‐based intervention, Outcome 22 Mild hypoglycaemia. | ||||
| 22.1 First‐generation SU | 0 | 0 | Risk Ratio (M‐H, Random, 95% CI) | 0.0 [0.0, 0.0] |
| 22.2 Second‐generation SU | 2 | 1503 | Risk Ratio (M‐H, Random, 95% CI) | 1.99 [1.02, 3.87] |
| 22.3 Third‐generation SU | 1 | 746 | Risk Ratio (M‐H, Random, 95% CI) | 2.41 [1.71, 3.40] |
| 23 Severe hypoglycaemia Show forest plot | 3 | 2249 | Risk Ratio (M‐H, Random, 95% CI) | 0.0 [0.0, 0.0] |
| Analysis 6.23  Comparison 6 Sulphonylureas versus incretin‐based intervention, Outcome 23 Severe hypoglycaemia. | ||||
| 23.1 First‐generation SU | 0 | 0 | Risk Ratio (M‐H, Random, 95% CI) | 0.0 [0.0, 0.0] |
| 23.2 Second‐generation SU | 2 | 1503 | Risk Ratio (M‐H, Random, 95% CI) | 0.0 [0.0, 0.0] |
| 23.3 Third‐generation SU | 1 | 746 | Risk Ratio (M‐H, Random, 95% CI) | 0.0 [0.0, 0.0] |
| 24 Intervention failure Show forest plot | 3 | 2249 | Risk Ratio (M‐H, Random, 95% CI) | 1.31 [0.56, 3.05] |
| Analysis 6.24  Comparison 6 Sulphonylureas versus incretin‐based intervention, Outcome 24 Intervention failure. | ||||
| 24.1 First‐generation SU | 0 | 0 | Risk Ratio (M‐H, Random, 95% CI) | 0.0 [0.0, 0.0] |
| 24.2 Second‐generation SU | 2 | 1503 | Risk Ratio (M‐H, Random, 95% CI) | 1.00 [0.41, 2.43] |
| 24.3 Third‐generation SU | 1 | 746 | Risk Ratio (M‐H, Random, 95% CI) | 2.09 [1.22, 3.59] |
| Outcome or subgroup title | No. of studies | No. of participants | Statistical method | Effect size |
| 1 All‐cause mortality Show forest plot | 7 | 2038 | Risk Ratio (M‐H, Random, 95% CI) | 1.44 [0.47, 4.42] |
| Analysis 7.1 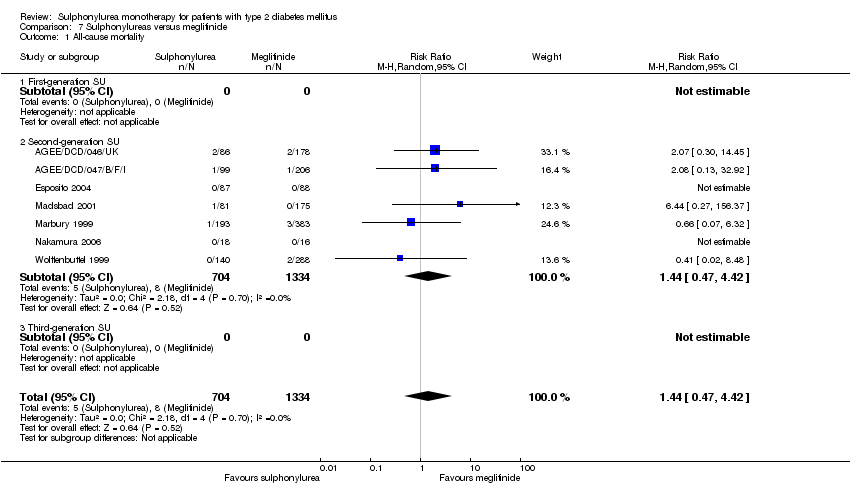 Comparison 7 Sulphonylureas versus meglitinide, Outcome 1 All‐cause mortality. | ||||
| 1.1 First‐generation SU | 0 | 0 | Risk Ratio (M‐H, Random, 95% CI) | 0.0 [0.0, 0.0] |
| 1.2 Second‐generation SU | 7 | 2038 | Risk Ratio (M‐H, Random, 95% CI) | 1.44 [0.47, 4.42] |
| 1.3 Third‐generation SU | 0 | 0 | Risk Ratio (M‐H, Random, 95% CI) | 0.0 [0.0, 0.0] |
| 2 All‐cause mortality; best‐worst case scenario Show forest plot | 2 | 209 | Risk Ratio (M‐H, Random, 95% CI) | 0.07 [0.00, 1.16] |
| Analysis 7.2  Comparison 7 Sulphonylureas versus meglitinide, Outcome 2 All‐cause mortality; best‐worst case scenario. | ||||
| 2.1 First‐generation SU | 0 | 0 | Risk Ratio (M‐H, Random, 95% CI) | 0.0 [0.0, 0.0] |
| 2.2 Second‐generation SU | 2 | 209 | Risk Ratio (M‐H, Random, 95% CI) | 0.07 [0.00, 1.16] |
| 2.3 Third‐generation SU | 0 | 0 | Risk Ratio (M‐H, Random, 95% CI) | 0.0 [0.0, 0.0] |
| 3 All‐cause mortality; worst‐best case scenario Show forest plot | 2 | 209 | Risk Ratio (M‐H, Random, 95% CI) | 15.17 [0.88, 261.61] |
| Analysis 7.3 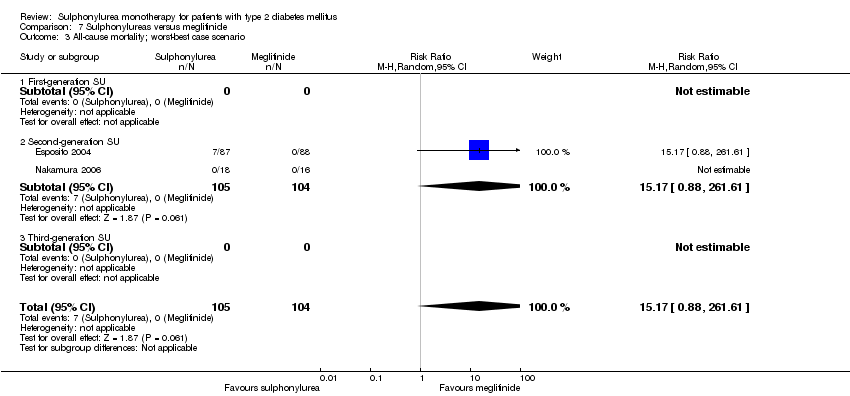 Comparison 7 Sulphonylureas versus meglitinide, Outcome 3 All‐cause mortality; worst‐best case scenario. | ||||
| 3.1 First‐generation SU | 0 | 0 | Risk Ratio (M‐H, Random, 95% CI) | 0.0 [0.0, 0.0] |
| 3.2 Second‐generation SU | 2 | 209 | Risk Ratio (M‐H, Random, 95% CI) | 15.17 [0.88, 261.61] |
| 3.3 Third‐generation SU | 0 | 0 | Risk Ratio (M‐H, Random, 95% CI) | 0.0 [0.0, 0.0] |
| 4 Cardiovascular mortality Show forest plot | 7 | 2038 | Risk Ratio (M‐H, Random, 95% CI) | 0.97 [0.27, 3.53] |
| Analysis 7.4  Comparison 7 Sulphonylureas versus meglitinide, Outcome 4 Cardiovascular mortality. | ||||
| 4.1 First‐generation SU | 0 | 0 | Risk Ratio (M‐H, Random, 95% CI) | 0.0 [0.0, 0.0] |
| 4.2 Second‐generation SU | 7 | 2038 | Risk Ratio (M‐H, Random, 95% CI) | 0.97 [0.27, 3.53] |
| 4.3 Third‐generation SU | 0 | 0 | Risk Ratio (M‐H, Random, 95% CI) | 0.0 [0.0, 0.0] |
| 5 Non‐fatal macrovascular outcomes Show forest plot | 3 | 866 | Risk Ratio (M‐H, Random, 95% CI) | 0.50 [0.20, 1.20] |
| Analysis 7.5  Comparison 7 Sulphonylureas versus meglitinide, Outcome 5 Non‐fatal macrovascular outcomes. | ||||
| 5.1 First‐generation SU | 0 | 0 | Risk Ratio (M‐H, Random, 95% CI) | 0.0 [0.0, 0.0] |
| 5.2 Second‐generation SU | 3 | 866 | Risk Ratio (M‐H, Random, 95% CI) | 0.50 [0.20, 1.20] |
| 5.3 Third‐generation SU | 0 | 0 | Risk Ratio (M‐H, Random, 95% CI) | 0.0 [0.0, 0.0] |
| 6 Non‐fatal myocardial infarction Show forest plot | 3 | 726 | Risk Ratio (M‐H, Random, 95% CI) | 1.03 [0.26, 4.08] |
| Analysis 7.6  Comparison 7 Sulphonylureas versus meglitinide, Outcome 6 Non‐fatal myocardial infarction. | ||||
| 6.1 First‐generation SU | 0 | 0 | Risk Ratio (M‐H, Random, 95% CI) | 0.0 [0.0, 0.0] |
| 6.2 Second‐generation SU | 3 | 726 | Risk Ratio (M‐H, Random, 95% CI) | 1.03 [0.26, 4.08] |
| 6.3 Third‐generation SU | 0 | 0 | Risk Ratio (M‐H, Random, 95% CI) | 0.0 [0.0, 0.0] |
| 7 Non‐fatal stroke Show forest plot | 1 | 34 | Risk Ratio (M‐H, Random, 95% CI) | 0.0 [0.0, 0.0] |
| Analysis 7.7  Comparison 7 Sulphonylureas versus meglitinide, Outcome 7 Non‐fatal stroke. | ||||
| 7.1 First‐generation SU | 0 | 0 | Risk Ratio (M‐H, Random, 95% CI) | 0.0 [0.0, 0.0] |
| 7.2 Second‐generation SU | 1 | 34 | Risk Ratio (M‐H, Random, 95% CI) | 0.0 [0.0, 0.0] |
| 7.3 Third‐generation SU | 0 | 0 | Risk Ratio (M‐H, Random, 95% CI) | 0.0 [0.0, 0.0] |
| 8 Amputation of lower extremity Show forest plot | 1 | 34 | Risk Ratio (M‐H, Random, 95% CI) | 0.0 [0.0, 0.0] |
| Analysis 7.8  Comparison 7 Sulphonylureas versus meglitinide, Outcome 8 Amputation of lower extremity. | ||||
| 8.1 First‐generation SU | 0 | 0 | Risk Ratio (M‐H, Random, 95% CI) | 0.0 [0.0, 0.0] |
| 8.2 Second‐generation SU | 1 | 34 | Risk Ratio (M‐H, Random, 95% CI) | 0.0 [0.0, 0.0] |
| 8.3 Third‐generation SU | 0 | 0 | Risk Ratio (M‐H, Random, 95% CI) | 0.0 [0.0, 0.0] |
| 9 Cardial revascularisation Show forest plot | 1 | 34 | Risk Ratio (M‐H, Random, 95% CI) | 0.0 [0.0, 0.0] |
| Analysis 7.9  Comparison 7 Sulphonylureas versus meglitinide, Outcome 9 Cardial revascularisation. | ||||
| 9.1 First‐generation SU | 0 | 0 | Risk Ratio (M‐H, Random, 95% CI) | 0.0 [0.0, 0.0] |
| 9.2 Second‐generation SU | 1 | 34 | Risk Ratio (M‐H, Random, 95% CI) | 0.0 [0.0, 0.0] |
| 9.3 Third‐generation SU | 0 | 0 | Risk Ratio (M‐H, Random, 95% CI) | 0.0 [0.0, 0.0] |
| 10 Peripheral revascularisation Show forest plot | 1 | 34 | Risk Ratio (M‐H, Random, 95% CI) | 0.0 [0.0, 0.0] |
| Analysis 7.10  Comparison 7 Sulphonylureas versus meglitinide, Outcome 10 Peripheral revascularisation. | ||||
| 10.1 First‐generation SU | 0 | 0 | Risk Ratio (M‐H, Random, 95% CI) | 0.0 [0.0, 0.0] |
| 10.2 Second‐generation SU | 1 | 34 | Risk Ratio (M‐H, Random, 95% CI) | 0.0 [0.0, 0.0] |
| 10.3 Third‐generation SU | 0 | 0 | Risk Ratio (M‐H, Random, 95% CI) | 0.0 [0.0, 0.0] |
| 11 Microvascular outcomes Show forest plot | 1 | 34 | Risk Ratio (M‐H, Random, 95% CI) | 0.0 [0.0, 0.0] |
| Analysis 7.11  Comparison 7 Sulphonylureas versus meglitinide, Outcome 11 Microvascular outcomes. | ||||
| 11.1 First‐generation SU | 0 | 0 | Risk Ratio (M‐H, Random, 95% CI) | 0.0 [0.0, 0.0] |
| 11.2 Second‐generation SU | 1 | 34 | Risk Ratio (M‐H, Random, 95% CI) | 0.0 [0.0, 0.0] |
| 11.3 Third‐generation SU | 0 | 0 | Risk Ratio (M‐H, Random, 95% CI) | 0.0 [0.0, 0.0] |
| 12 Nephropathy Show forest plot | 1 | 34 | Risk Ratio (M‐H, Random, 95% CI) | 0.0 [0.0, 0.0] |
| Analysis 7.12 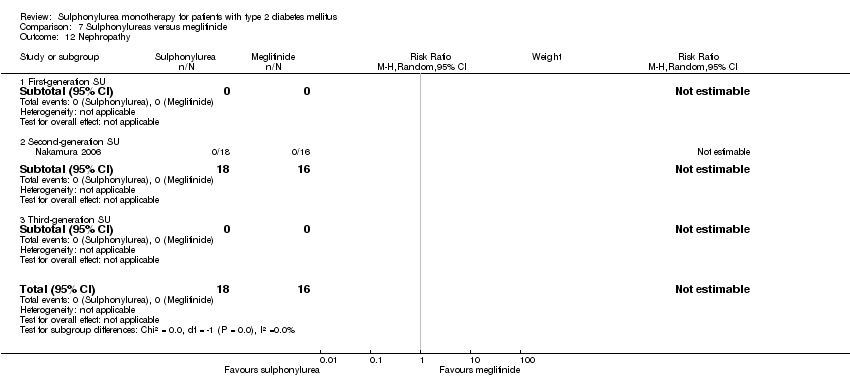 Comparison 7 Sulphonylureas versus meglitinide, Outcome 12 Nephropathy. | ||||
| 12.1 First‐generation SU | 0 | 0 | Risk Ratio (M‐H, Random, 95% CI) | 0.0 [0.0, 0.0] |
| 12.2 Second‐generation SU | 1 | 34 | Risk Ratio (M‐H, Random, 95% CI) | 0.0 [0.0, 0.0] |
| 12.3 Third‐generation SU | 0 | 0 | Risk Ratio (M‐H, Random, 95% CI) | 0.0 [0.0, 0.0] |
| 13 Retinopathy Show forest plot | 1 | 34 | Risk Ratio (M‐H, Random, 95% CI) | 0.0 [0.0, 0.0] |
| Analysis 7.13  Comparison 7 Sulphonylureas versus meglitinide, Outcome 13 Retinopathy. | ||||
| 13.1 First‐generation SU | 0 | 0 | Risk Ratio (M‐H, Random, 95% CI) | 0.0 [0.0, 0.0] |
| 13.2 Second‐generation SU | 1 | 34 | Risk Ratio (M‐H, Random, 95% CI) | 0.0 [0.0, 0.0] |
| 13.3 Third‐generation SU | 0 | 0 | Risk Ratio (M‐H, Random, 95% CI) | 0.0 [0.0, 0.0] |
| 14 Retinal photocoagulation Show forest plot | 1 | 34 | Risk Ratio (M‐H, Random, 95% CI) | 0.0 [0.0, 0.0] |
| Analysis 7.14  Comparison 7 Sulphonylureas versus meglitinide, Outcome 14 Retinal photocoagulation. | ||||
| 14.1 First‐generation SU | 0 | 0 | Risk Ratio (M‐H, Random, 95% CI) | 0.0 [0.0, 0.0] |
| 14.2 Second‐generation SU | 1 | 34 | Risk Ratio (M‐H, Random, 95% CI) | 0.0 [0.0, 0.0] |
| 14.3 Third‐generation SU | 0 | 0 | Risk Ratio (M‐H, Random, 95% CI) | 0.0 [0.0, 0.0] |
| 15 Change in fasting blood glucose from baseline (mmol/L) Show forest plot | 10 | 2329 | Mean Difference (IV, Random, 95% CI) | ‐0.21 [‐0.45, 0.03] |
| Analysis 7.15  Comparison 7 Sulphonylureas versus meglitinide, Outcome 15 Change in fasting blood glucose from baseline (mmol/L). | ||||
| 15.1 First‐generation SU | 0 | 0 | Mean Difference (IV, Random, 95% CI) | 0.0 [0.0, 0.0] |
| 15.2 Second‐generation SU | 9 | 2205 | Mean Difference (IV, Random, 95% CI) | ‐0.27 [‐0.51, ‐0.02] |
| 15.3 Third‐generation SU | 1 | 124 | Mean Difference (IV, Random, 95% CI) | 0.20 [‐0.22, 0.62] |
| 16 Change in HbA1c from baseline (%) Show forest plot | 10 | 2345 | Mean Difference (IV, Random, 95% CI) | 0.05 [‐0.09, 0.19] |
| Analysis 7.16 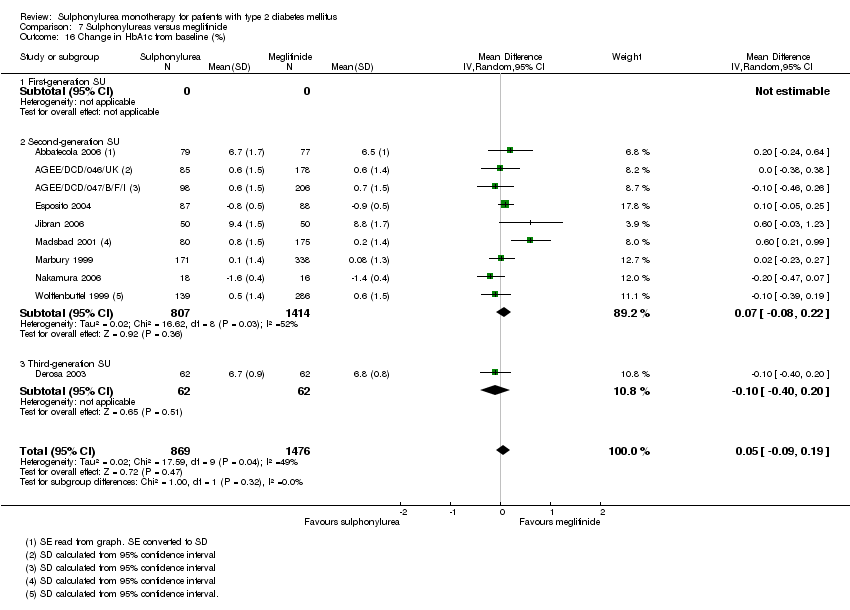 Comparison 7 Sulphonylureas versus meglitinide, Outcome 16 Change in HbA1c from baseline (%). | ||||
| 16.1 First‐generation SU | 0 | 0 | Mean Difference (IV, Random, 95% CI) | 0.0 [0.0, 0.0] |
| 16.2 Second‐generation SU | 9 | 2221 | Mean Difference (IV, Random, 95% CI) | 0.07 [‐0.08, 0.22] |
| 16.3 Third‐generation SU | 1 | 124 | Mean Difference (IV, Random, 95% CI) | ‐0.10 [‐0.40, 0.20] |
| 17 Change in BMI from baseline (kg/m2) Show forest plot | 3 | 333 | Mean Difference (IV, Random, 95% CI) | ‐0.05 [‐0.25, 0.14] |
| Analysis 7.17  Comparison 7 Sulphonylureas versus meglitinide, Outcome 17 Change in BMI from baseline (kg/m2). | ||||
| 17.1 First‐generation SU | 0 | 0 | Mean Difference (IV, Random, 95% CI) | 0.0 [0.0, 0.0] |
| 17.2 Second‐generation SU | 2 | 209 | Mean Difference (IV, Random, 95% CI) | 0.00 [‐0.19, 0.20] |
| 17.3 Third‐generation SU | 1 | 124 | Mean Difference (IV, Random, 95% CI) | ‐0.30 [‐0.66, 0.06] |
| 18 Change in weight from baseline (kg) Show forest plot | 5 | 1176 | Mean Difference (IV, Random, 95% CI) | 0.05 [‐0.40, 0.51] |
| Analysis 7.18  Comparison 7 Sulphonylureas versus meglitinide, Outcome 18 Change in weight from baseline (kg). | ||||
| 18.1 First‐generation SU | 0 | 0 | Mean Difference (IV, Random, 95% CI) | 0.0 [0.0, 0.0] |
| 18.2 Second‐generation SU | 4 | 1052 | Mean Difference (IV, Random, 95% CI) | 0.13 [‐0.50, 0.76] |
| 18.3 Third‐generation SU | 1 | 124 | Mean Difference (IV, Random, 95% CI) | 0.10 [‐1.77, 1.97] |
| 19 Adverse events Show forest plot | 5 | 1829 | Risk Ratio (M‐H, Random, 95% CI) | 1.00 [0.95, 1.06] |
| Analysis 7.19 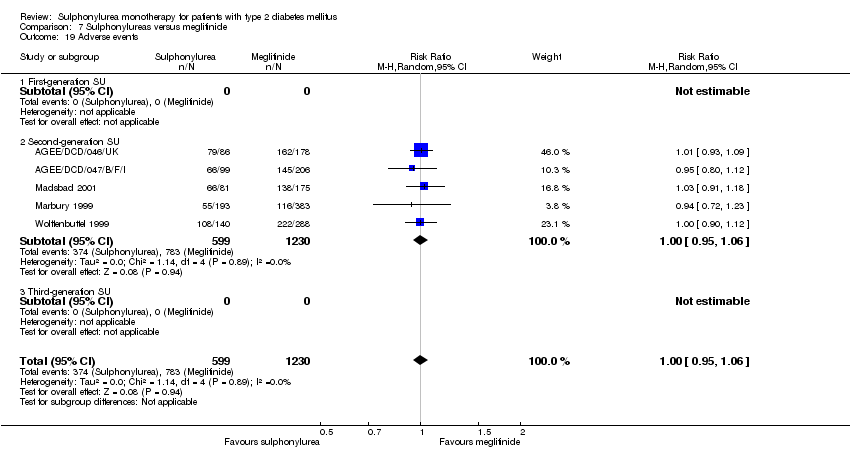 Comparison 7 Sulphonylureas versus meglitinide, Outcome 19 Adverse events. | ||||
| 19.1 First‐generation SU | 0 | 0 | Risk Ratio (M‐H, Random, 95% CI) | 0.0 [0.0, 0.0] |
| 19.2 Second‐generation SU | 5 | 1829 | Risk Ratio (M‐H, Random, 95% CI) | 1.00 [0.95, 1.06] |
| 19.3 Third‐generation SU | 0 | 0 | Risk Ratio (M‐H, Random, 95% CI) | 0.0 [0.0, 0.0] |
| 20 Drop‐outs due to adverse events Show forest plot | 8 | 2151 | Risk Ratio (M‐H, Random, 95% CI) | 1.03 [0.79, 1.33] |
| Analysis 7.20 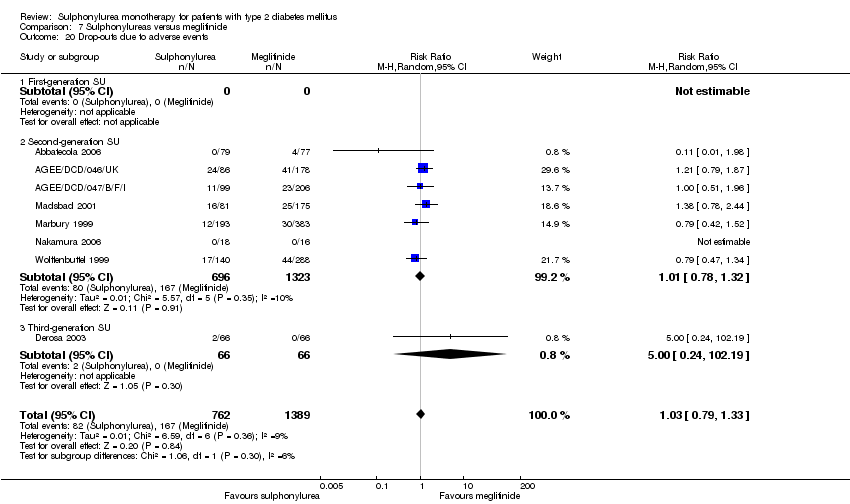 Comparison 7 Sulphonylureas versus meglitinide, Outcome 20 Drop‐outs due to adverse events. | ||||
| 20.1 First‐generation SU | 0 | 0 | Risk Ratio (M‐H, Random, 95% CI) | 0.0 [0.0, 0.0] |
| 20.2 Second‐generation SU | 7 | 2019 | Risk Ratio (M‐H, Random, 95% CI) | 1.01 [0.78, 1.32] |
| 20.3 Third‐generation SU | 1 | 132 | Risk Ratio (M‐H, Random, 95% CI) | 5.0 [0.24, 102.19] |
| 21 Serious adverse events Show forest plot | 5 | 1829 | Risk Ratio (M‐H, Random, 95% CI) | 1.02 [0.74, 1.39] |
| Analysis 7.21 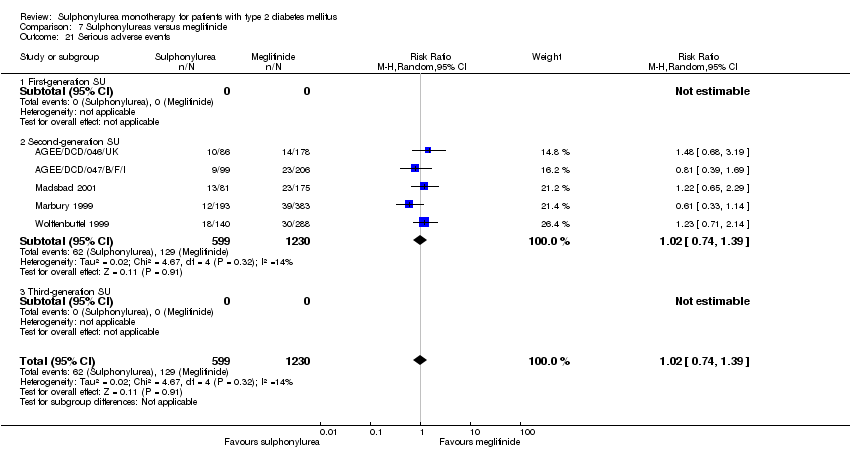 Comparison 7 Sulphonylureas versus meglitinide, Outcome 21 Serious adverse events. | ||||
| 21.1 First‐generation SU | 0 | 0 | Risk Ratio (M‐H, Random, 95% CI) | 0.0 [0.0, 0.0] |
| 21.2 Second‐generation SU | 5 | 1829 | Risk Ratio (M‐H, Random, 95% CI) | 1.02 [0.74, 1.39] |
| 21.3 Third‐generation SU | 0 | 0 | Risk Ratio (M‐H, Random, 95% CI) | 0.0 [0.0, 0.0] |
| 22 Mild hypoglycaemia Show forest plot | 6 | 1863 | Risk Ratio (M‐H, Random, 95% CI) | 1.20 [0.96, 1.49] |
| Analysis 7.22 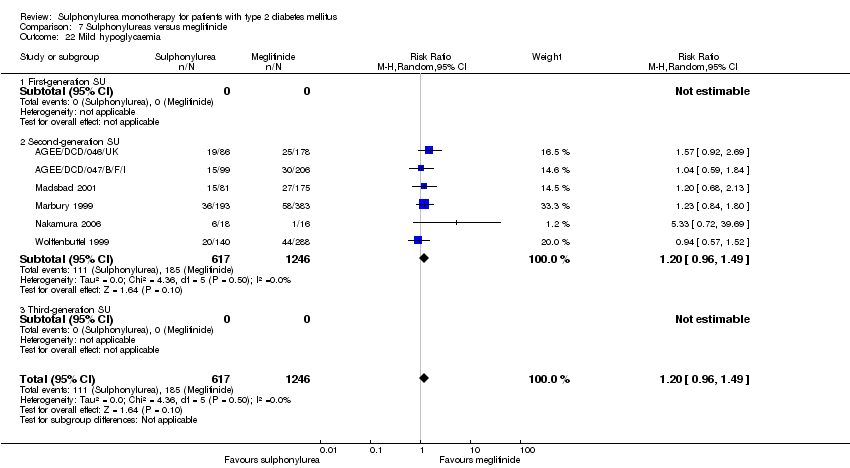 Comparison 7 Sulphonylureas versus meglitinide, Outcome 22 Mild hypoglycaemia. | ||||
| 22.1 First‐generation SU | 0 | 0 | Risk Ratio (M‐H, Random, 95% CI) | 0.0 [0.0, 0.0] |
| 22.2 Second‐generation SU | 6 | 1863 | Risk Ratio (M‐H, Random, 95% CI) | 1.20 [0.96, 1.49] |
| 22.3 Third‐generation SU | 0 | 0 | Risk Ratio (M‐H, Random, 95% CI) | 0.0 [0.0, 0.0] |
| 23 Moderate hypoglycaemia Show forest plot | 1 | 34 | Risk Ratio (M‐H, Random, 95% CI) | 0.0 [0.0, 0.0] |
| Analysis 7.23  Comparison 7 Sulphonylureas versus meglitinide, Outcome 23 Moderate hypoglycaemia. | ||||
| 23.1 First‐generation SU | 0 | 0 | Risk Ratio (M‐H, Random, 95% CI) | 0.0 [0.0, 0.0] |
| 23.2 Second‐generation SU | 1 | 34 | Risk Ratio (M‐H, Random, 95% CI) | 0.0 [0.0, 0.0] |
| 23.3 Third‐generation SU | 0 | 0 | Risk Ratio (M‐H, Random, 95% CI) | 0.0 [0.0, 0.0] |
| 24 Severe hypoglycaemia Show forest plot | 6 | 1863 | Risk Ratio (M‐H, Fixed, 95% CI) | 2.87 [0.91, 8.99] |
| Analysis 7.24 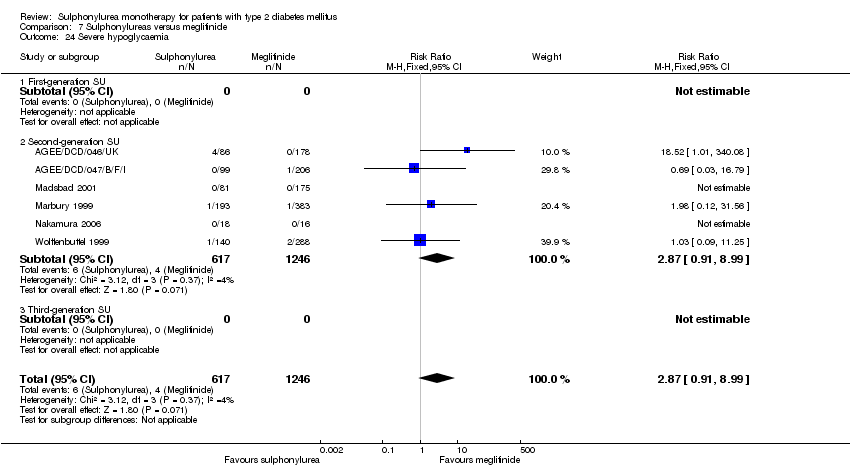 Comparison 7 Sulphonylureas versus meglitinide, Outcome 24 Severe hypoglycaemia. | ||||
| 24.1 First‐generation SU | 0 | 0 | Risk Ratio (M‐H, Fixed, 95% CI) | 0.0 [0.0, 0.0] |
| 24.2 Second‐generation SU | 6 | 1863 | Risk Ratio (M‐H, Fixed, 95% CI) | 2.87 [0.91, 8.99] |
| 24.3 Third‐generation SU | 0 | 0 | Risk Ratio (M‐H, Fixed, 95% CI) | 0.0 [0.0, 0.0] |
| 25 Cancer Show forest plot | 2 | 290 | Risk Ratio (M‐H, Random, 95% CI) | 6.44 [0.27, 156.37] |
| Analysis 7.25  Comparison 7 Sulphonylureas versus meglitinide, Outcome 25 Cancer. | ||||
| 25.1 First‐generation SU | 0 | 0 | Risk Ratio (M‐H, Random, 95% CI) | 0.0 [0.0, 0.0] |
| 25.2 Second‐generation SU | 2 | 290 | Risk Ratio (M‐H, Random, 95% CI) | 6.44 [0.27, 156.37] |
| 25.3 Third‐generation SU | 0 | 0 | Risk Ratio (M‐H, Random, 95% CI) | 0.0 [0.0, 0.0] |
| 26 Intervention failure Show forest plot | 5 | 1656 | Risk Ratio (M‐H, Random, 95% CI) | 0.96 [0.69, 1.35] |
| Analysis 7.26  Comparison 7 Sulphonylureas versus meglitinide, Outcome 26 Intervention failure. | ||||
| 26.1 First‐generation SU | 0 | 0 | Risk Ratio (M‐H, Random, 95% CI) | 0.0 [0.0, 0.0] |
| 26.2 Second‐generation SU | 4 | 1524 | Risk Ratio (M‐H, Random, 95% CI) | 0.98 [0.69, 1.38] |
| 26.3 Third‐generation SU | 1 | 132 | Risk Ratio (M‐H, Random, 95% CI) | 0.67 [0.12, 3.86] |
| Outcome or subgroup title | No. of studies | No. of participants | Statistical method | Effect size |
| 1 All‐cause mortality Show forest plot | 1 | 1234 | Risk Ratio (M‐H, Random, 95% CI) | 0.90 [0.72, 1.11] |
| Analysis 8.1  Comparison 8 Second‐generation sulphonylureas versus first‐generation sulphonylureas, Outcome 1 All‐cause mortality. | ||||
| 2 Cardiovascular mortality Show forest plot | 1 | 1234 | Risk Ratio (M‐H, Random, 95% CI) | 0.98 [0.72, 1.34] |
| Analysis 8.2  Comparison 8 Second‐generation sulphonylureas versus first‐generation sulphonylureas, Outcome 2 Cardiovascular mortality. | ||||
| 3 Non‐fatal myocardial infarction Show forest plot | 1 | 1234 | Risk Ratio (M‐H, Random, 95% CI) | 0.80 [0.55, 1.16] |
| Analysis 8.3  Comparison 8 Second‐generation sulphonylureas versus first‐generation sulphonylureas, Outcome 3 Non‐fatal myocardial infarction. | ||||
| 4 Non‐fatal stroke Show forest plot | 1 | 1234 | Risk Ratio (M‐H, Random, 95% CI) | 1.32 [0.80, 2.17] |
| Analysis 8.4  Comparison 8 Second‐generation sulphonylureas versus first‐generation sulphonylureas, Outcome 4 Non‐fatal stroke. | ||||
| 5 Amputation of lower extremity Show forest plot | 1 | 1234 | Risk Ratio (M‐H, Random, 95% CI) | 1.01 [0.29, 3.46] |
| Analysis 8.5  Comparison 8 Second‐generation sulphonylureas versus first‐generation sulphonylureas, Outcome 5 Amputation of lower extremity. | ||||
| 6 Microvascular outcomes Show forest plot | 1 | 1234 | Odds Ratio (M‐H, Random, 95% CI) | 0.70 [0.48, 1.03] |
| Analysis 8.6  Comparison 8 Second‐generation sulphonylureas versus first‐generation sulphonylureas, Outcome 6 Microvascular outcomes. | ||||
| 7 Retinal photocoagulation Show forest plot | 1 | 1234 | Risk Ratio (M‐H, Random, 95% CI) | 0.82 [0.56, 1.20] |
| Analysis 8.7  Comparison 8 Second‐generation sulphonylureas versus first‐generation sulphonylureas, Outcome 7 Retinal photocoagulation. | ||||
| 8 Change in fasting blood glucose from baseline (mmol/L) Show forest plot | 2 | 936 | Mean Difference (IV, Random, 95% CI) | 0.62 [0.31, 0.94] |
| Analysis 8.8  Comparison 8 Second‐generation sulphonylureas versus first‐generation sulphonylureas, Outcome 8 Change in fasting blood glucose from baseline (mmol/L). | ||||
| 9 Change in HbA1c from baseline (%) Show forest plot | 2 | 1014 | Mean Difference (IV, Random, 95% CI) | ‐1.44 [‐4.48, 1.60] |
| Analysis 8.9  Comparison 8 Second‐generation sulphonylureas versus first‐generation sulphonylureas, Outcome 9 Change in HbA1c from baseline (%). | ||||
| 10 Change in weight from baseline (kg) Show forest plot | 2 | 1014 | Mean Difference (IV, Random, 95% CI) | 1.80 [‐0.63, 4.23] |
| Analysis 8.10 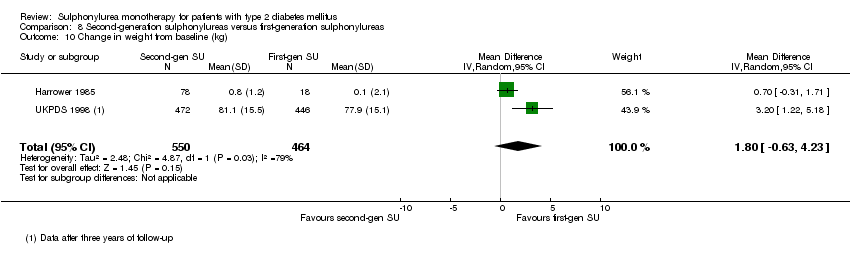 Comparison 8 Second‐generation sulphonylureas versus first‐generation sulphonylureas, Outcome 10 Change in weight from baseline (kg). | ||||
| 11 Mild hypoglycaemia Show forest plot | 1 | 1234 | Risk Ratio (M‐H, Random, 95% CI) | 2.51 [1.83, 3.42] |
| Analysis 8.11 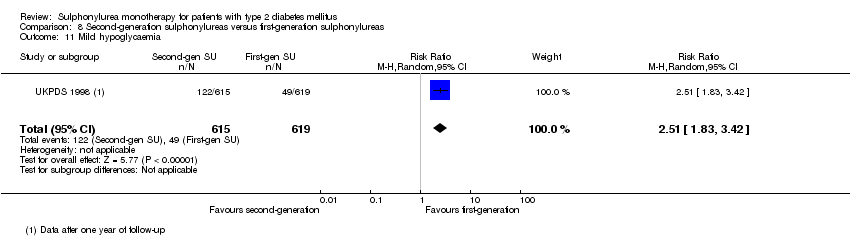 Comparison 8 Second‐generation sulphonylureas versus first‐generation sulphonylureas, Outcome 11 Mild hypoglycaemia. | ||||
| 12 Severe hypoglycaemia Show forest plot | 1 | 1234 | Risk Ratio (M‐H, Random, 95% CI) | 3.52 [0.73, 16.89] |
| Analysis 8.12  Comparison 8 Second‐generation sulphonylureas versus first‐generation sulphonylureas, Outcome 12 Severe hypoglycaemia. | ||||
| 13 Cancer Show forest plot | 1 | 1234 | Risk Ratio (M‐H, Random, 95% CI) | 0.81 [0.50, 1.31] |
| Analysis 8.13  Comparison 8 Second‐generation sulphonylureas versus first‐generation sulphonylureas, Outcome 13 Cancer. | ||||
| 14 Intervention failure Show forest plot | 3 | 1364 | Risk Ratio (M‐H, Random, 95% CI) | 1.96 [0.67, 5.75] |
| Analysis 8.14 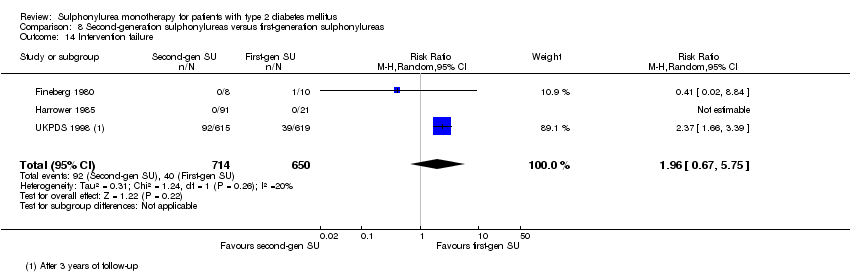 Comparison 8 Second‐generation sulphonylureas versus first‐generation sulphonylureas, Outcome 14 Intervention failure. | ||||

Study flow diagram.
N = number of references

'Risk of bias' graph: review authors' judgements about each risk of bias item presented as percentages across all included studies.
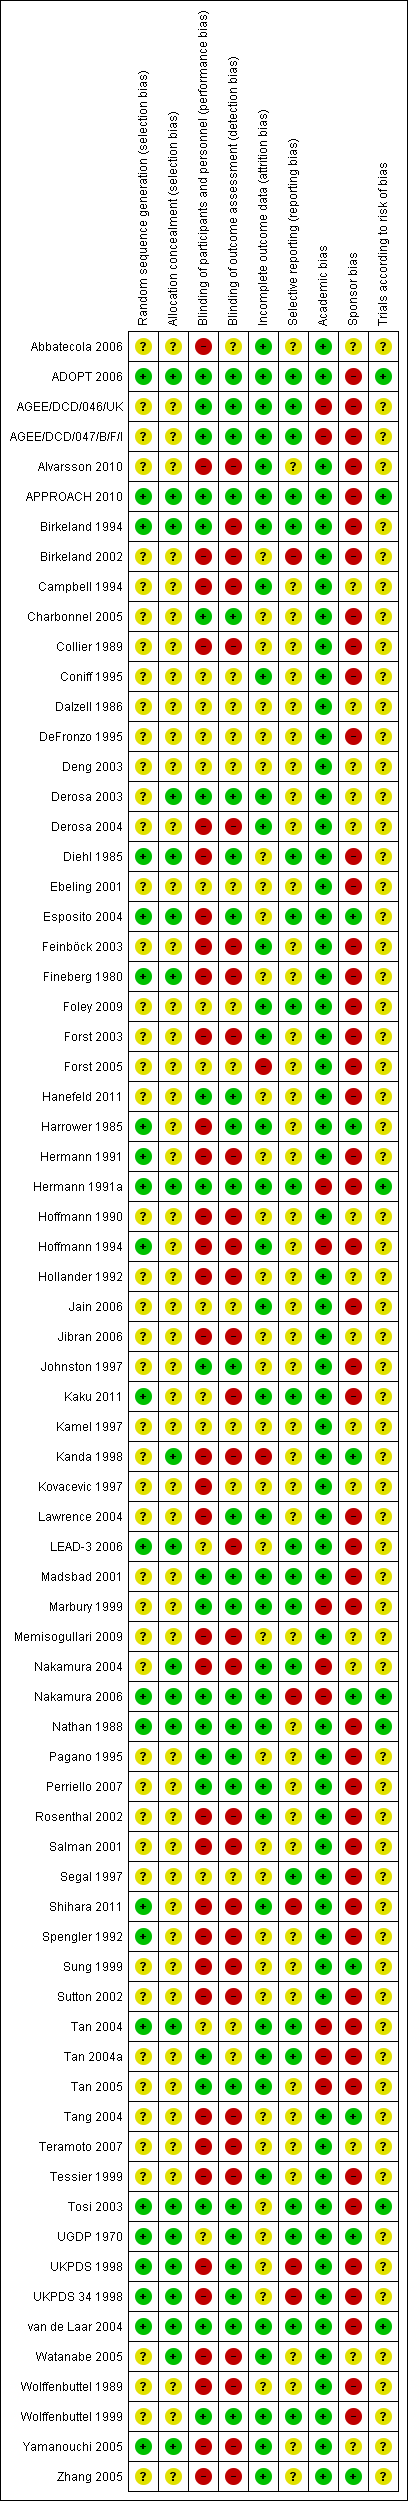
'Risk of bias' summary: review authors' judgements about each risk of bias item for each included study.

Comparison 1 Sulphonylureas versus placebo, Outcome 1 All‐cause mortality.
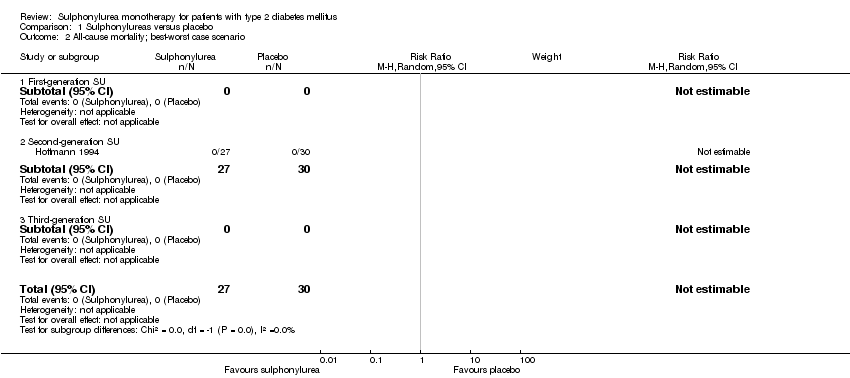
Comparison 1 Sulphonylureas versus placebo, Outcome 2 All‐cause mortality; best‐worst case scenario.

Comparison 1 Sulphonylureas versus placebo, Outcome 3 All‐cause mortality; worst‐best case scenario.

Comparison 1 Sulphonylureas versus placebo, Outcome 4 Cardiovascular mortality.

Comparison 1 Sulphonylureas versus placebo, Outcome 5 Non‐fatal macrovascular outcomes.

Comparison 1 Sulphonylureas versus placebo, Outcome 6 Non‐fatal myocardial infarction.
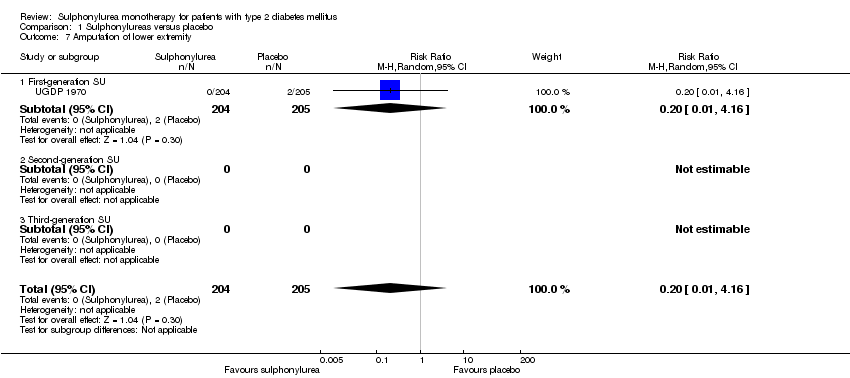
Comparison 1 Sulphonylureas versus placebo, Outcome 7 Amputation of lower extremity.

Comparison 1 Sulphonylureas versus placebo, Outcome 8 Nephropathy.

Comparison 1 Sulphonylureas versus placebo, Outcome 9 Retinopathy.

Comparison 1 Sulphonylureas versus placebo, Outcome 10 Change in fasting blood glucose from baseline (mmol/L).

Comparison 1 Sulphonylureas versus placebo, Outcome 11 Change in HbA1c from baseline (%).

Comparison 1 Sulphonylureas versus placebo, Outcome 12 Change in BMI from baseline (kg/m2).

Comparison 1 Sulphonylureas versus placebo, Outcome 13 Change in weight from baseline (kg).

Comparison 1 Sulphonylureas versus placebo, Outcome 14 Adverse events.

Comparison 1 Sulphonylureas versus placebo, Outcome 15 Drop‐outs due to adverse events.

Comparison 1 Sulphonylureas versus placebo, Outcome 16 Mild hypoglycaemia.

Comparison 1 Sulphonylureas versus placebo, Outcome 17 Severe hypoglycaemia.

Comparison 1 Sulphonylureas versus placebo, Outcome 18 Cancer.
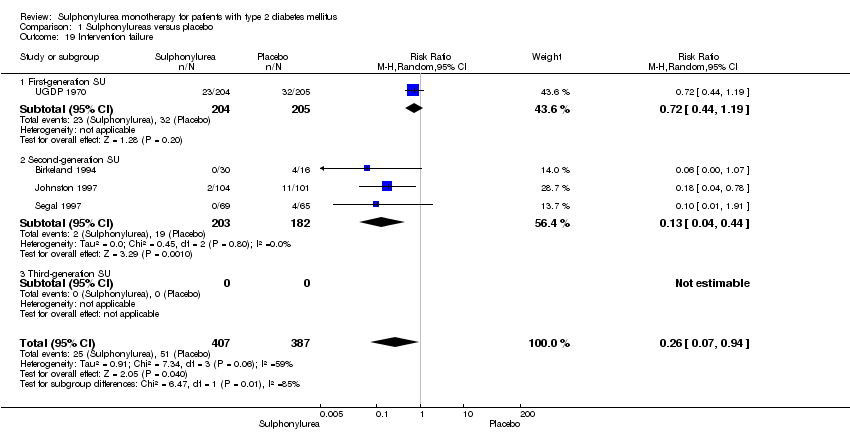
Comparison 1 Sulphonylureas versus placebo, Outcome 19 Intervention failure.

Comparison 2 Sulphonylureas versus metformin, Outcome 1 All‐cause mortality.

Comparison 2 Sulphonylureas versus metformin, Outcome 2 All‐cause mortality; best‐worst case scenario.

Comparison 2 Sulphonylureas versus metformin, Outcome 3 All‐cause mortality; worst‐best case scenario.
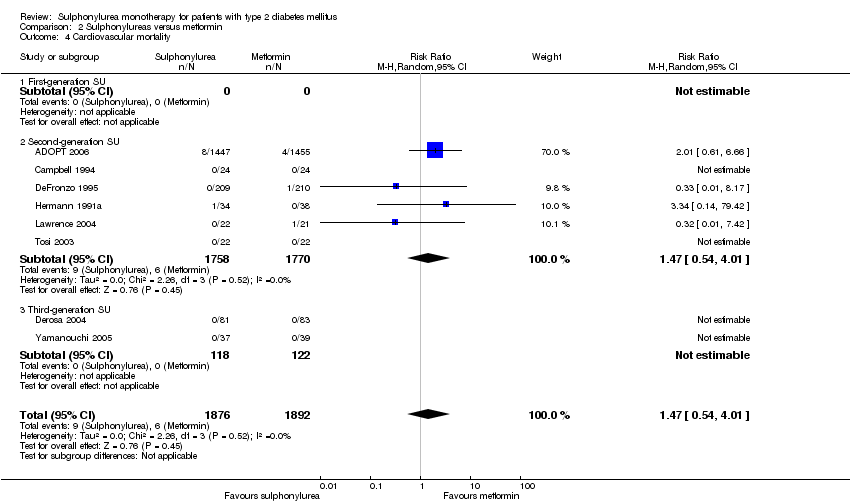
Comparison 2 Sulphonylureas versus metformin, Outcome 4 Cardiovascular mortality.

Comparison 2 Sulphonylureas versus metformin, Outcome 5 Non‐fatal macrovascular outcomes.
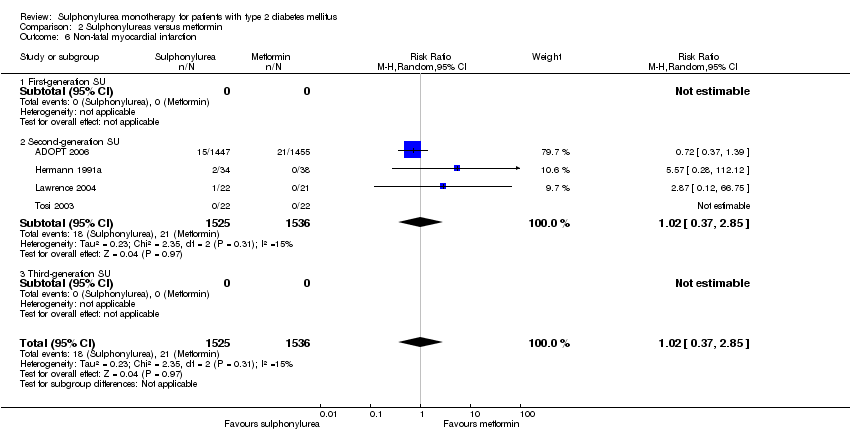
Comparison 2 Sulphonylureas versus metformin, Outcome 6 Non‐fatal myocardial infarction.

Comparison 2 Sulphonylureas versus metformin, Outcome 7 Non‐fatal stroke.

Comparison 2 Sulphonylureas versus metformin, Outcome 8 Amputation of lower extremity.

Comparison 2 Sulphonylureas versus metformin, Outcome 9 Peripheral revascularisation.
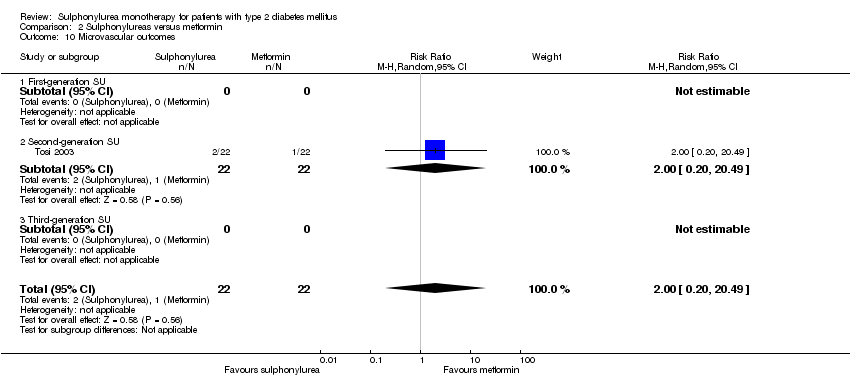
Comparison 2 Sulphonylureas versus metformin, Outcome 10 Microvascular outcomes.
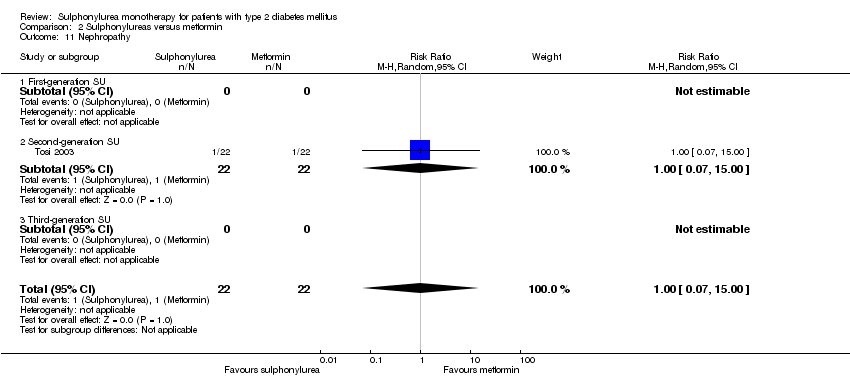
Comparison 2 Sulphonylureas versus metformin, Outcome 11 Nephropathy.

Comparison 2 Sulphonylureas versus metformin, Outcome 12 Retinal photocoagulation.

Comparison 2 Sulphonylureas versus metformin, Outcome 13 Change in fasting blood glucose from baseline (mmol/L).

Comparison 2 Sulphonylureas versus metformin, Outcome 14 Change in HbA1c from baseline (%).

Comparison 2 Sulphonylureas versus metformin, Outcome 15 Change in BMI from baseline (kg/m2).

Comparison 2 Sulphonylureas versus metformin, Outcome 16 Change in weight from baseline (kg).

Comparison 2 Sulphonylureas versus metformin, Outcome 17 Adverse events.

Comparison 2 Sulphonylureas versus metformin, Outcome 18 Serious adverse events.

Comparison 2 Sulphonylureas versus metformin, Outcome 19 Drop‐outs due to adverse events.

Comparison 2 Sulphonylureas versus metformin, Outcome 20 Mild hypoglycaemia.
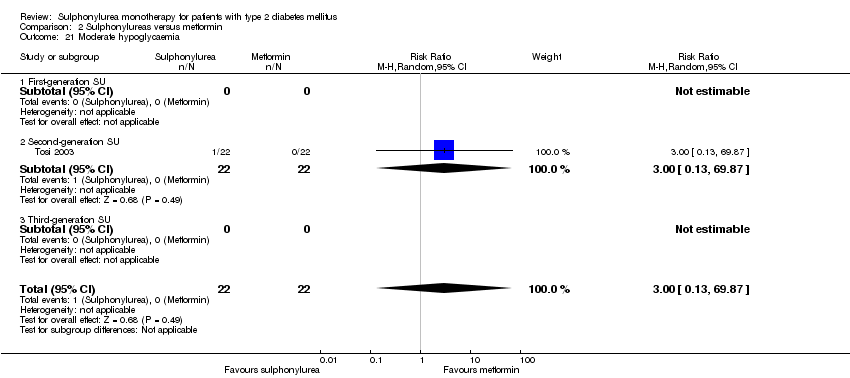
Comparison 2 Sulphonylureas versus metformin, Outcome 21 Moderate hypoglycaemia.

Comparison 2 Sulphonylureas versus metformin, Outcome 22 Severe hypoglycaemia.

Comparison 2 Sulphonylureas versus metformin, Outcome 23 Cancer.
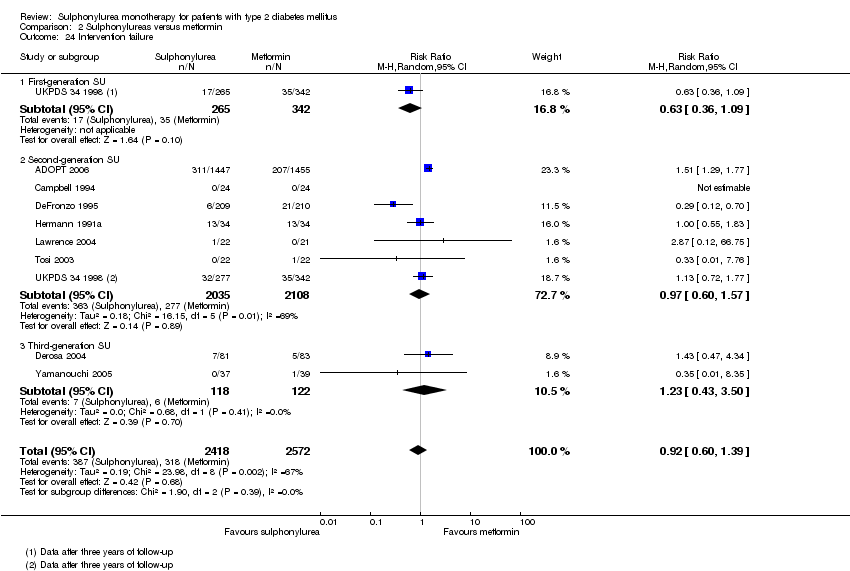
Comparison 2 Sulphonylureas versus metformin, Outcome 24 Intervention failure.

Comparison 3 Sulphonylureas versus thiazolidinediones, Outcome 1 All‐cause mortality.
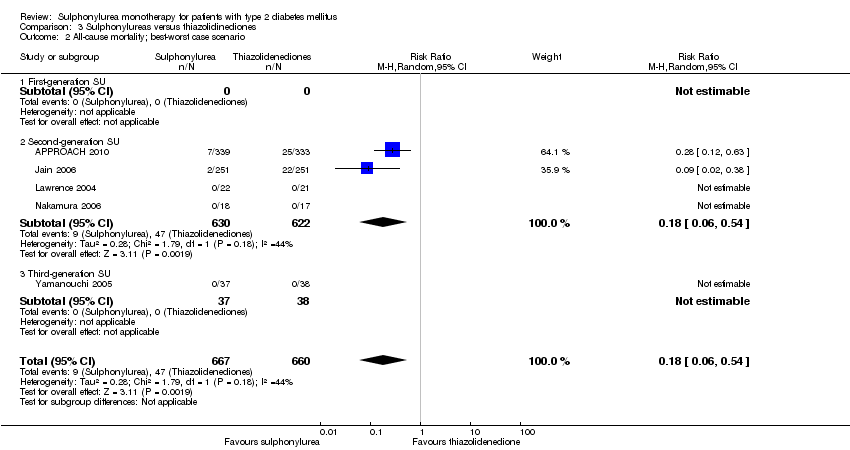
Comparison 3 Sulphonylureas versus thiazolidinediones, Outcome 2 All‐cause mortality; best‐worst case scenario.

Comparison 3 Sulphonylureas versus thiazolidinediones, Outcome 3 All‐cause mortality; worst‐best case scenario.
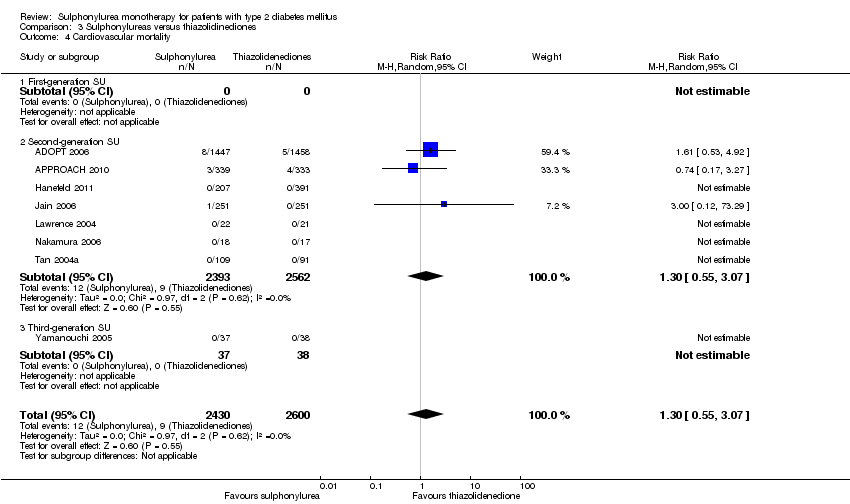
Comparison 3 Sulphonylureas versus thiazolidinediones, Outcome 4 Cardiovascular mortality.

Comparison 3 Sulphonylureas versus thiazolidinediones, Outcome 5 Non‐fatal macrovascular outcomes.

Comparison 3 Sulphonylureas versus thiazolidinediones, Outcome 6 Non‐fatal myocardial infarction.
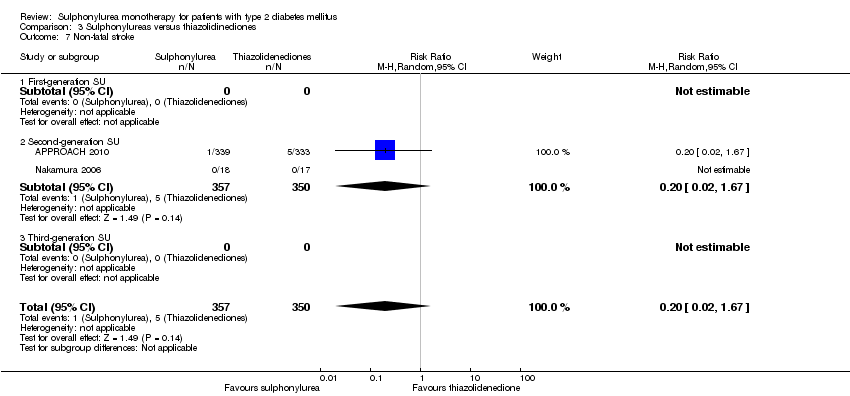
Comparison 3 Sulphonylureas versus thiazolidinediones, Outcome 7 Non‐fatal stroke.
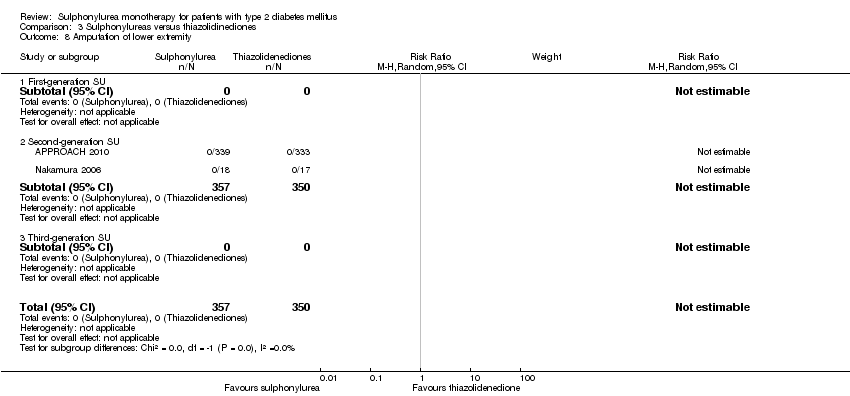
Comparison 3 Sulphonylureas versus thiazolidinediones, Outcome 8 Amputation of lower extremity.
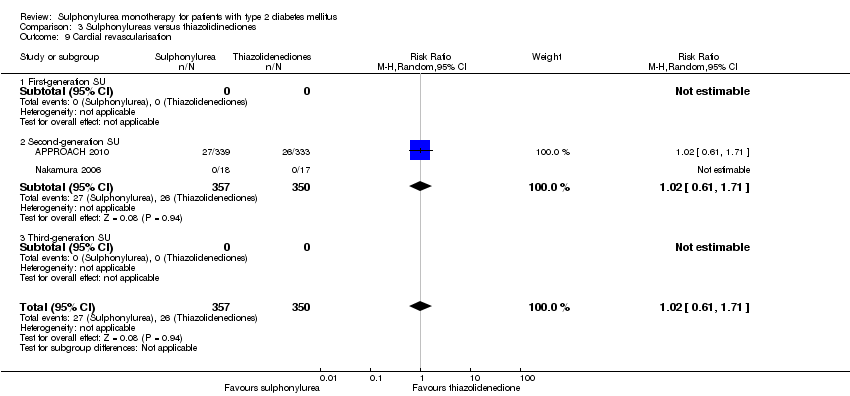
Comparison 3 Sulphonylureas versus thiazolidinediones, Outcome 9 Cardial revascularisation.
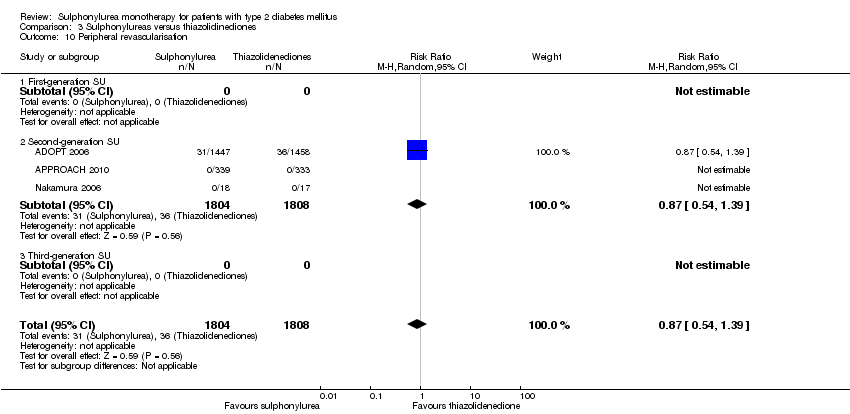
Comparison 3 Sulphonylureas versus thiazolidinediones, Outcome 10 Peripheral revascularisation.

Comparison 3 Sulphonylureas versus thiazolidinediones, Outcome 11 Microvascular outcomes.

Comparison 3 Sulphonylureas versus thiazolidinediones, Outcome 12 Nephropathy.

Comparison 3 Sulphonylureas versus thiazolidinediones, Outcome 13 Retinopathy.

Comparison 3 Sulphonylureas versus thiazolidinediones, Outcome 14 Retinal photocoagulation.

Comparison 3 Sulphonylureas versus thiazolidinediones, Outcome 15 Change in fasting blood glucose from baseline (mmol/L).
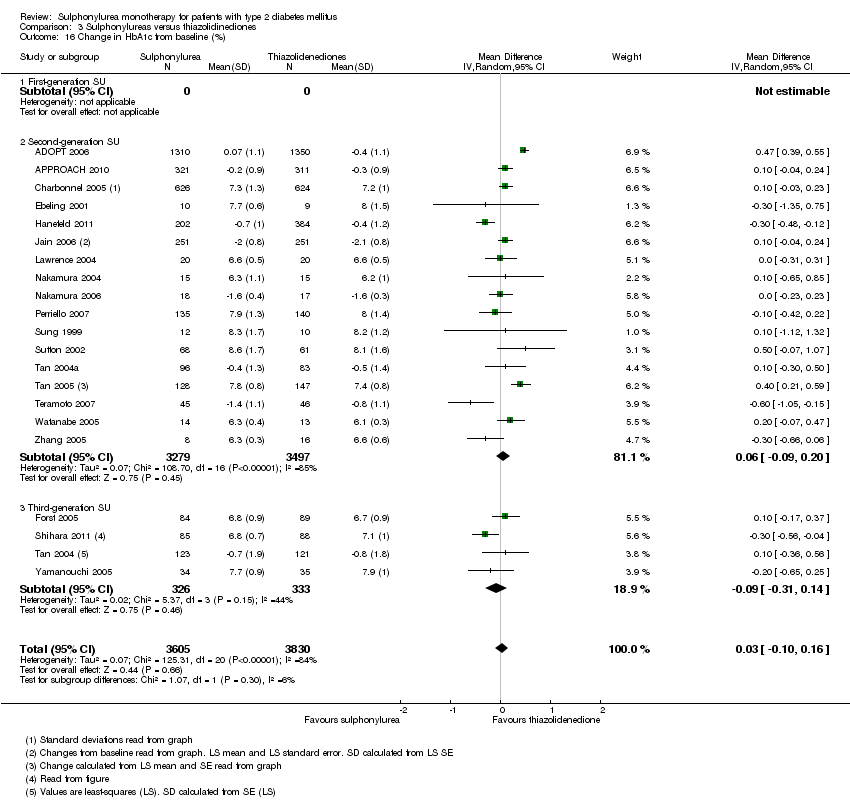
Comparison 3 Sulphonylureas versus thiazolidinediones, Outcome 16 Change in HbA1c from baseline (%).

Comparison 3 Sulphonylureas versus thiazolidinediones, Outcome 17 Change in BMI from baseline (kg/m2).

Comparison 3 Sulphonylureas versus thiazolidinediones, Outcome 18 Change in weight from baseline (kg).

Comparison 3 Sulphonylureas versus thiazolidinediones, Outcome 19 Adverse events.

Comparison 3 Sulphonylureas versus thiazolidinediones, Outcome 20 Serious adverse events.
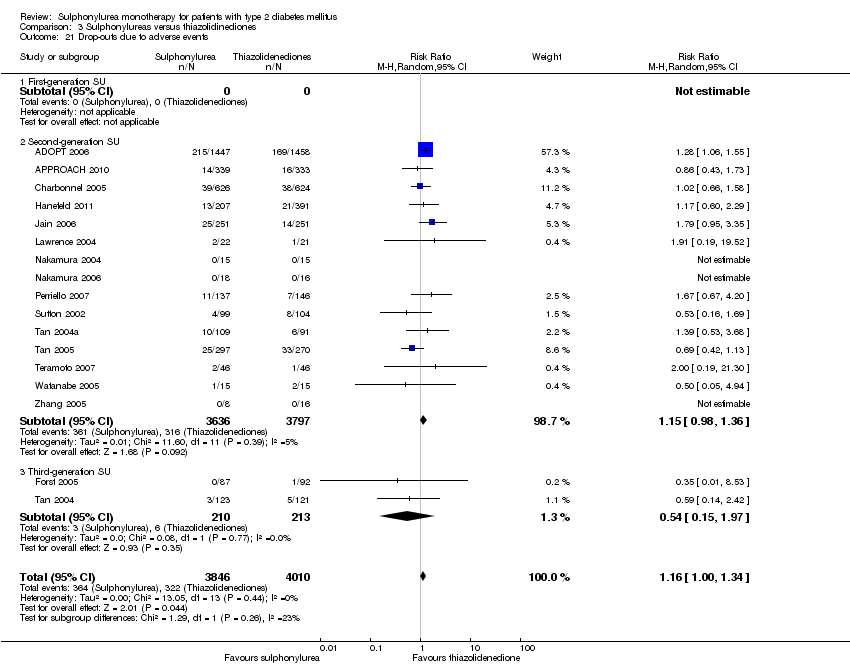
Comparison 3 Sulphonylureas versus thiazolidinediones, Outcome 21 Drop‐outs due to adverse events.

Comparison 3 Sulphonylureas versus thiazolidinediones, Outcome 22 Mild hypoglycaemia.
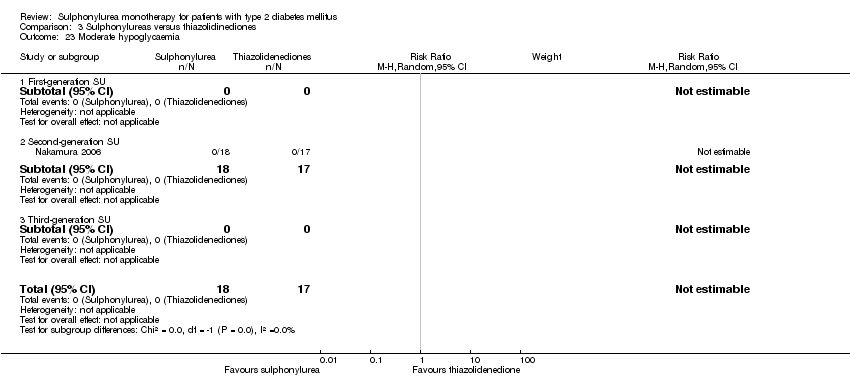
Comparison 3 Sulphonylureas versus thiazolidinediones, Outcome 23 Moderate hypoglycaemia.
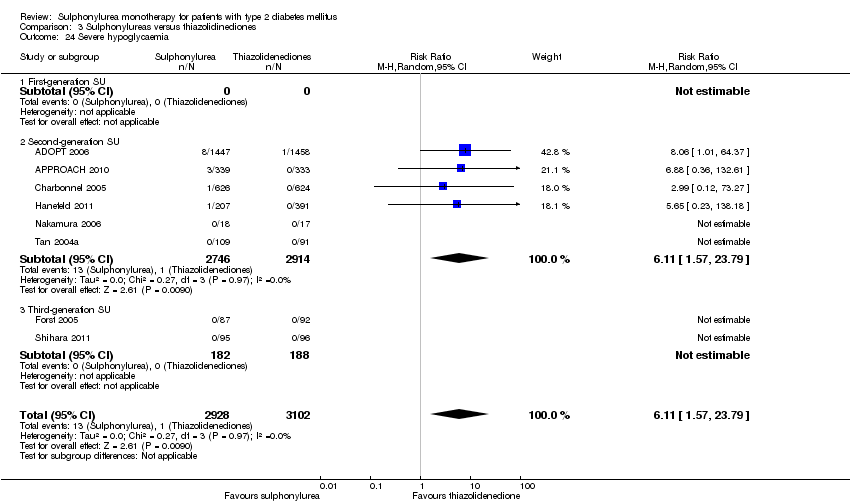
Comparison 3 Sulphonylureas versus thiazolidinediones, Outcome 24 Severe hypoglycaemia.

Comparison 3 Sulphonylureas versus thiazolidinediones, Outcome 25 Cancer.
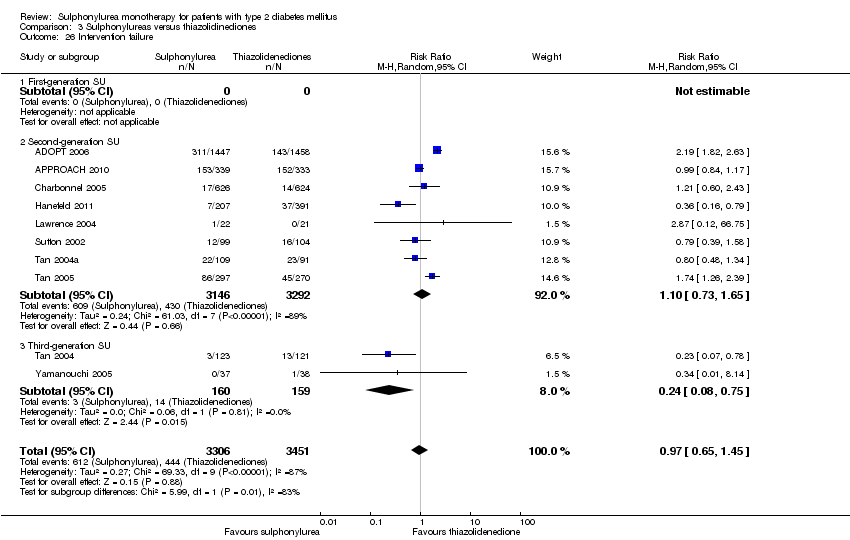
Comparison 3 Sulphonylureas versus thiazolidinediones, Outcome 26 Intervention failure.

Comparison 4 Sulphonylureas versus insulin, Outcome 1 All‐cause mortality.

Comparison 4 Sulphonylureas versus insulin, Outcome 2 All‐cause mortality; best‐worst case scenario.

Comparison 4 Sulphonylureas versus insulin, Outcome 3 All‐cause mortality; worst‐best case scenario.

Comparison 4 Sulphonylureas versus insulin, Outcome 4 Cardiovascular mortality.
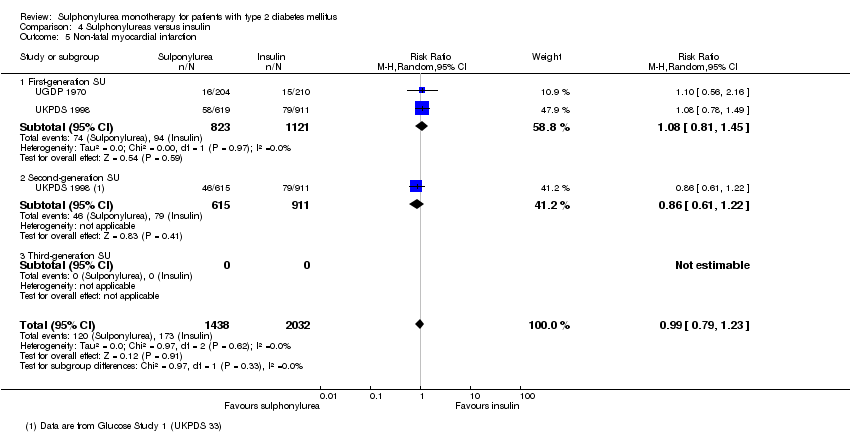
Comparison 4 Sulphonylureas versus insulin, Outcome 5 Non‐fatal myocardial infarction.

Comparison 4 Sulphonylureas versus insulin, Outcome 6 Non‐fatal stroke.

Comparison 4 Sulphonylureas versus insulin, Outcome 7 Amputation of lower extremity.
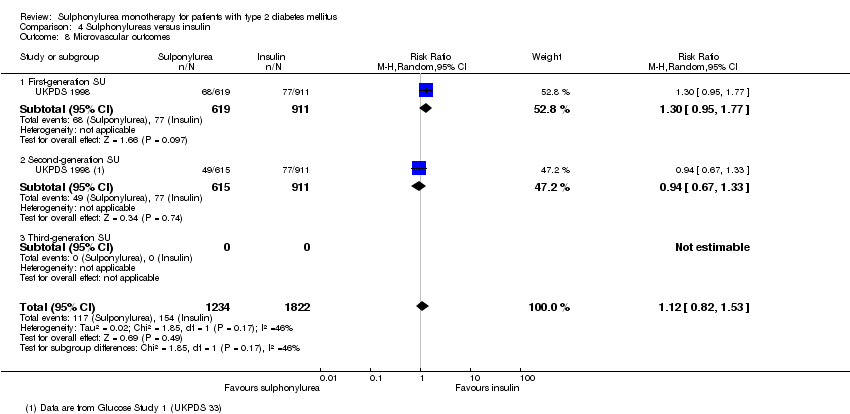
Comparison 4 Sulphonylureas versus insulin, Outcome 8 Microvascular outcomes.

Comparison 4 Sulphonylureas versus insulin, Outcome 9 Nephropathy.

Comparison 4 Sulphonylureas versus insulin, Outcome 10 Retinopathy.
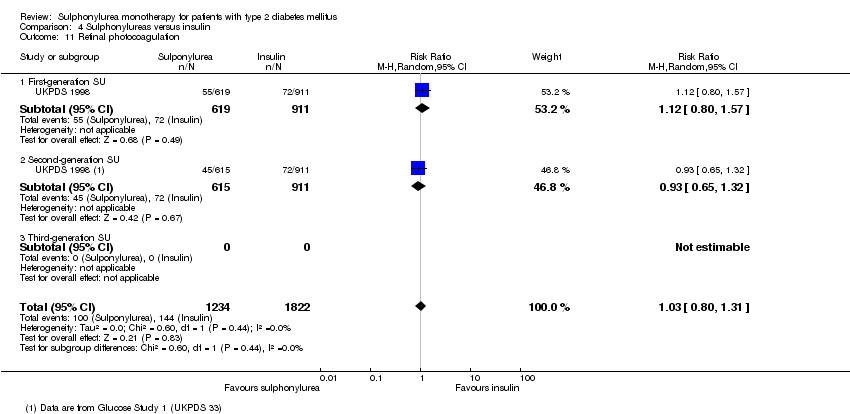
Comparison 4 Sulphonylureas versus insulin, Outcome 11 Retinal photocoagulation.

Comparison 4 Sulphonylureas versus insulin, Outcome 12 Change in fasting blood glucose from baseline (mmol/L).

Comparison 4 Sulphonylureas versus insulin, Outcome 13 Change in HbA1c from baseline (%).

Comparison 4 Sulphonylureas versus insulin, Outcome 14 Change in BMI from baseline (kg/m2).
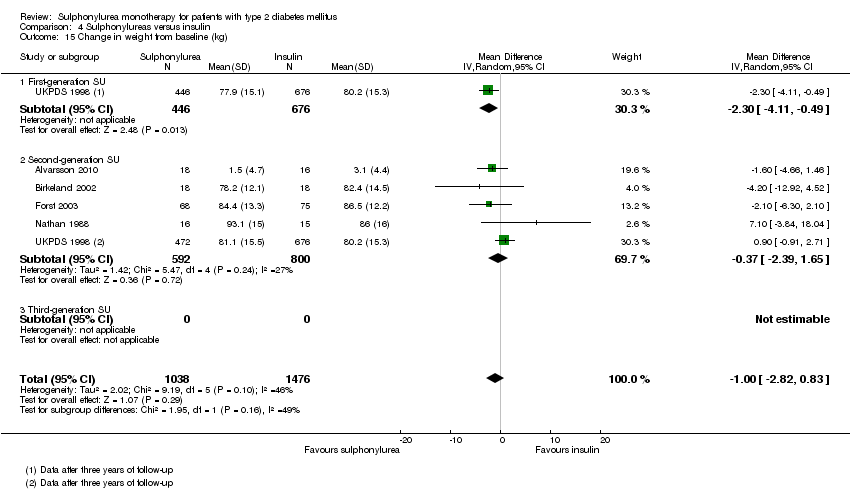
Comparison 4 Sulphonylureas versus insulin, Outcome 15 Change in weight from baseline (kg).
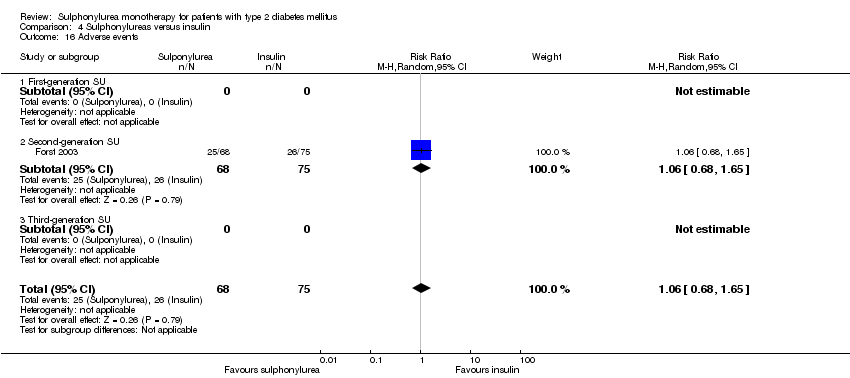
Comparison 4 Sulphonylureas versus insulin, Outcome 16 Adverse events.

Comparison 4 Sulphonylureas versus insulin, Outcome 17 Drop‐outs due to adverse events.

Comparison 4 Sulphonylureas versus insulin, Outcome 18 Mild hypoglycaemia.

Comparison 4 Sulphonylureas versus insulin, Outcome 19 Severe hypoglycaemia.
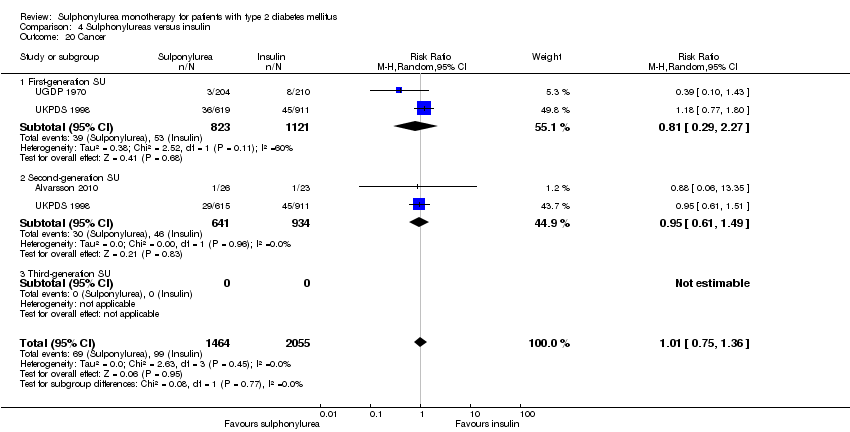
Comparison 4 Sulphonylureas versus insulin, Outcome 20 Cancer.
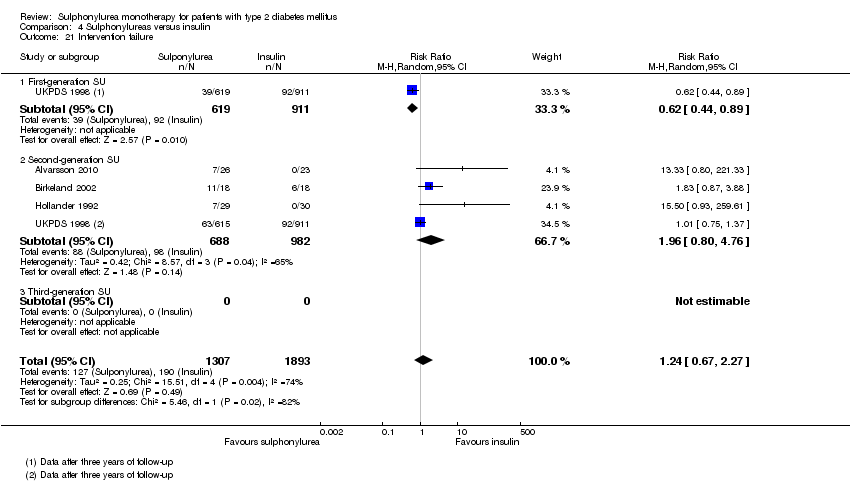
Comparison 4 Sulphonylureas versus insulin, Outcome 21 Intervention failure.
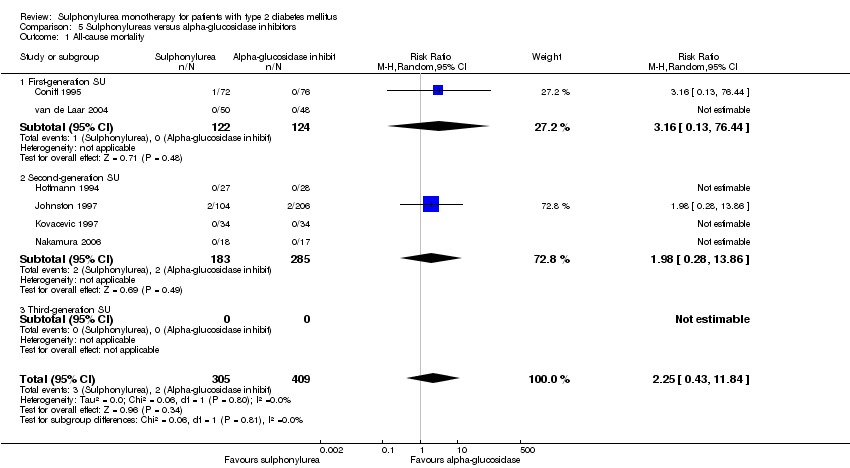
Comparison 5 Sulphonylureas versus alpha‐glucosidase inhibitors, Outcome 1 All‐cause mortality.

Comparison 5 Sulphonylureas versus alpha‐glucosidase inhibitors, Outcome 2 All‐cause mortality; best‐worst case scenario.
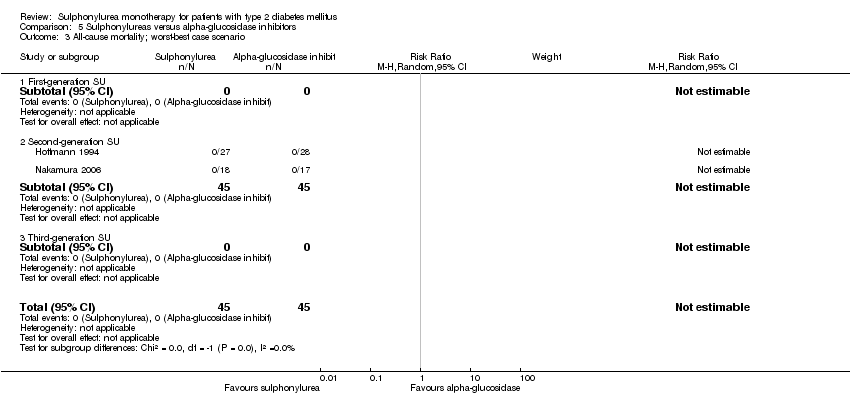
Comparison 5 Sulphonylureas versus alpha‐glucosidase inhibitors, Outcome 3 All‐cause mortality; worst‐best case scenario.
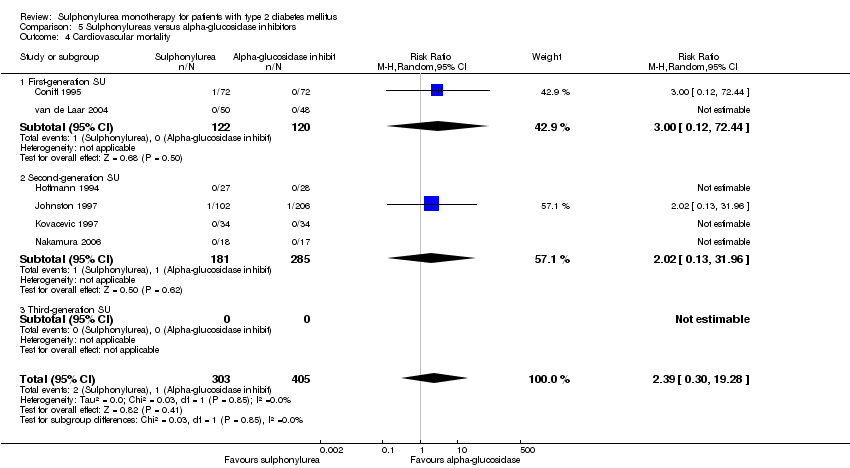
Comparison 5 Sulphonylureas versus alpha‐glucosidase inhibitors, Outcome 4 Cardiovascular mortality.

Comparison 5 Sulphonylureas versus alpha‐glucosidase inhibitors, Outcome 5 Non‐fatal macrovascular outcomes.

Comparison 5 Sulphonylureas versus alpha‐glucosidase inhibitors, Outcome 6 Non‐fatal myocardial infarction.

Comparison 5 Sulphonylureas versus alpha‐glucosidase inhibitors, Outcome 7 Non‐fatal stroke.

Comparison 5 Sulphonylureas versus alpha‐glucosidase inhibitors, Outcome 8 Amputation of lower extremity.

Comparison 5 Sulphonylureas versus alpha‐glucosidase inhibitors, Outcome 9 Cardial revascularisation.

Comparison 5 Sulphonylureas versus alpha‐glucosidase inhibitors, Outcome 10 Peripheral revascularisation.
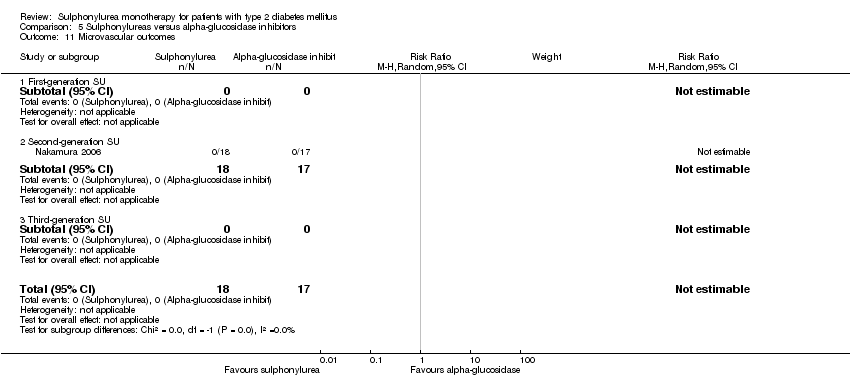
Comparison 5 Sulphonylureas versus alpha‐glucosidase inhibitors, Outcome 11 Microvascular outcomes.

Comparison 5 Sulphonylureas versus alpha‐glucosidase inhibitors, Outcome 12 Nephropathy.
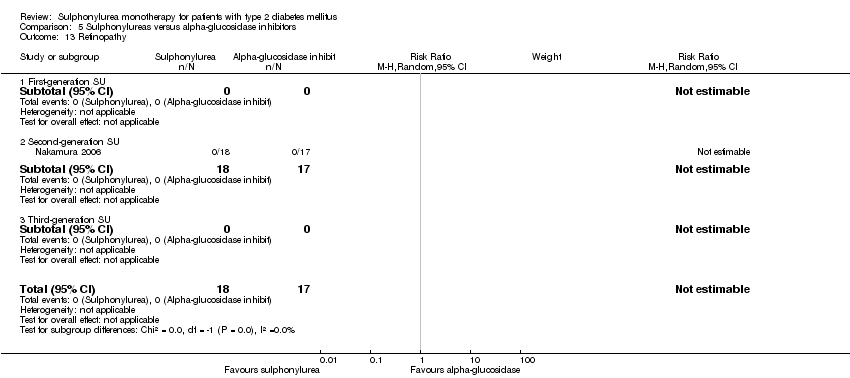
Comparison 5 Sulphonylureas versus alpha‐glucosidase inhibitors, Outcome 13 Retinopathy.

Comparison 5 Sulphonylureas versus alpha‐glucosidase inhibitors, Outcome 14 Retinal photocoagulation.

Comparison 5 Sulphonylureas versus alpha‐glucosidase inhibitors, Outcome 15 Change in fasting blood glucose from baseline (mmol/L).

Comparison 5 Sulphonylureas versus alpha‐glucosidase inhibitors, Outcome 16 Change in HbA1c from baseline (%).
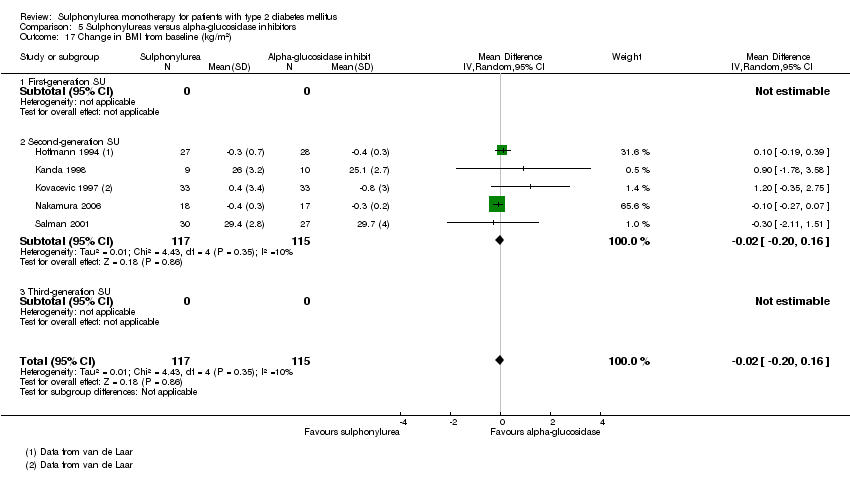
Comparison 5 Sulphonylureas versus alpha‐glucosidase inhibitors, Outcome 17 Change in BMI from baseline (kg/m2).

Comparison 5 Sulphonylureas versus alpha‐glucosidase inhibitors, Outcome 18 Change in weight from baseline (kg).
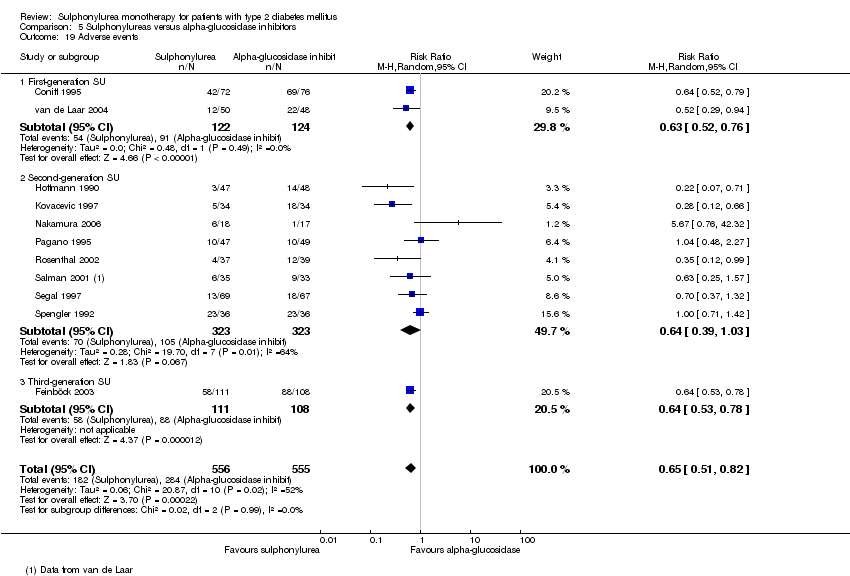
Comparison 5 Sulphonylureas versus alpha‐glucosidase inhibitors, Outcome 19 Adverse events.

Comparison 5 Sulphonylureas versus alpha‐glucosidase inhibitors, Outcome 20 Serious adverse events.

Comparison 5 Sulphonylureas versus alpha‐glucosidase inhibitors, Outcome 21 Drop‐outs due to adverse events.

Comparison 5 Sulphonylureas versus alpha‐glucosidase inhibitors, Outcome 22 Mild hypoglycaemia.

Comparison 5 Sulphonylureas versus alpha‐glucosidase inhibitors, Outcome 23 Moderate hypoglycaemia.

Comparison 5 Sulphonylureas versus alpha‐glucosidase inhibitors, Outcome 24 Severe hypoglycaemia.
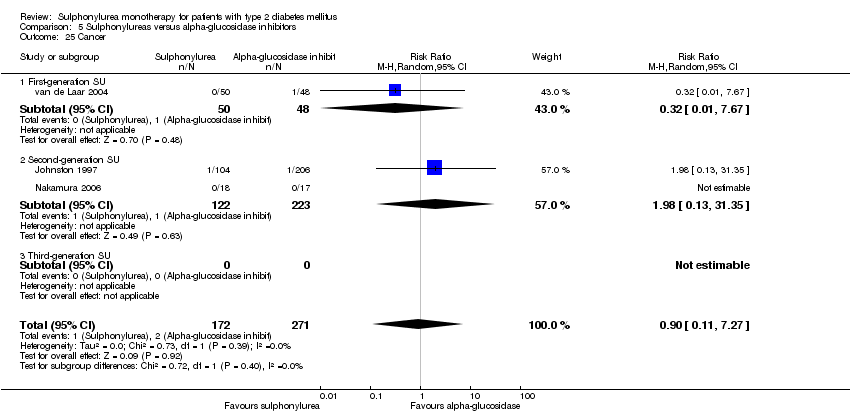
Comparison 5 Sulphonylureas versus alpha‐glucosidase inhibitors, Outcome 25 Cancer.

Comparison 5 Sulphonylureas versus alpha‐glucosidase inhibitors, Outcome 26 Intervention failure.
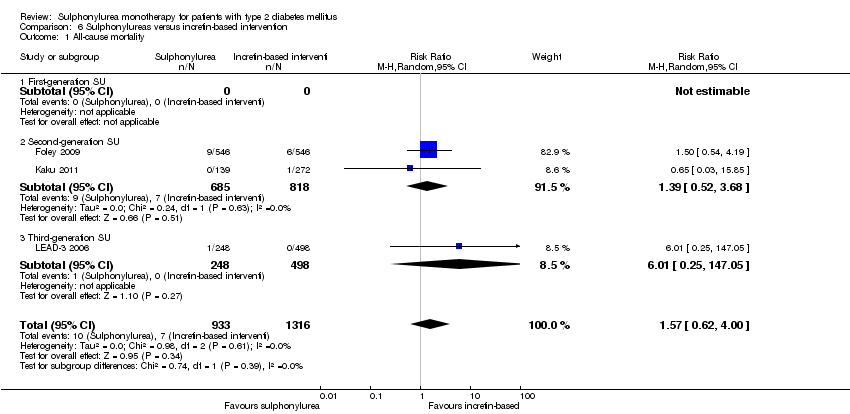
Comparison 6 Sulphonylureas versus incretin‐based intervention, Outcome 1 All‐cause mortality.

Comparison 6 Sulphonylureas versus incretin‐based intervention, Outcome 2 All‐cause mortality; best‐worst case scenario.

Comparison 6 Sulphonylureas versus incretin‐based intervention, Outcome 3 All‐cause mortality; worst‐best case scenario.
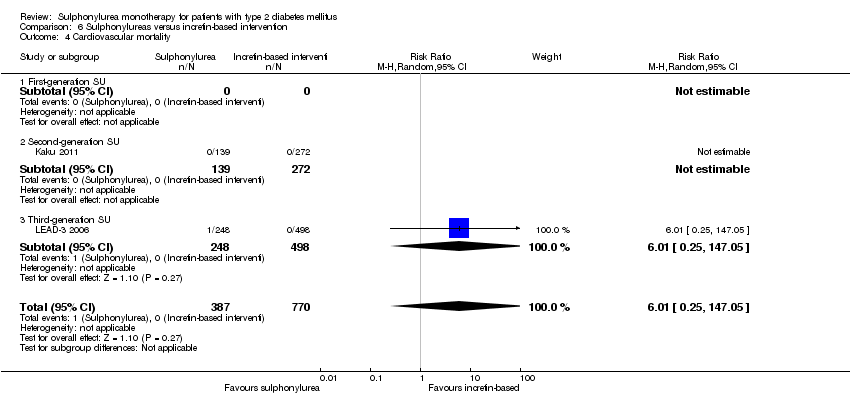
Comparison 6 Sulphonylureas versus incretin‐based intervention, Outcome 4 Cardiovascular mortality.

Comparison 6 Sulphonylureas versus incretin‐based intervention, Outcome 5 Non‐fatal macrovascular outcomes.

Comparison 6 Sulphonylureas versus incretin‐based intervention, Outcome 6 Non‐fatal myocardial infarction.

Comparison 6 Sulphonylureas versus incretin‐based intervention, Outcome 7 Non‐fatal stroke.

Comparison 6 Sulphonylureas versus incretin‐based intervention, Outcome 8 Amputation of lower extremity.

Comparison 6 Sulphonylureas versus incretin‐based intervention, Outcome 9 Cardial revascularisation.

Comparison 6 Sulphonylureas versus incretin‐based intervention, Outcome 10 Peripheral revascularisation.
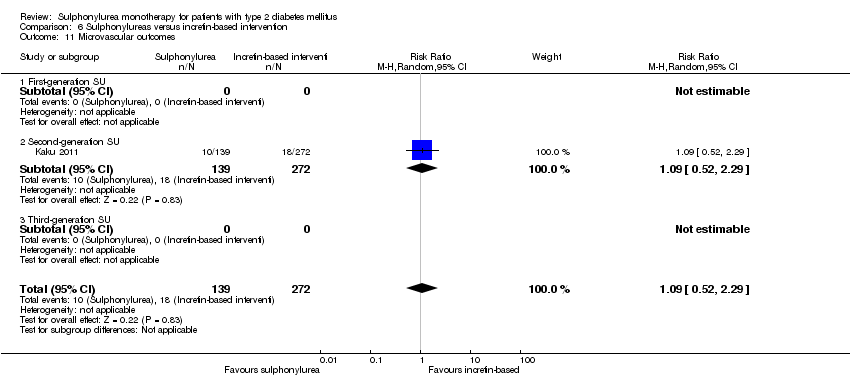
Comparison 6 Sulphonylureas versus incretin‐based intervention, Outcome 11 Microvascular outcomes.

Comparison 6 Sulphonylureas versus incretin‐based intervention, Outcome 12 Nephropathy.
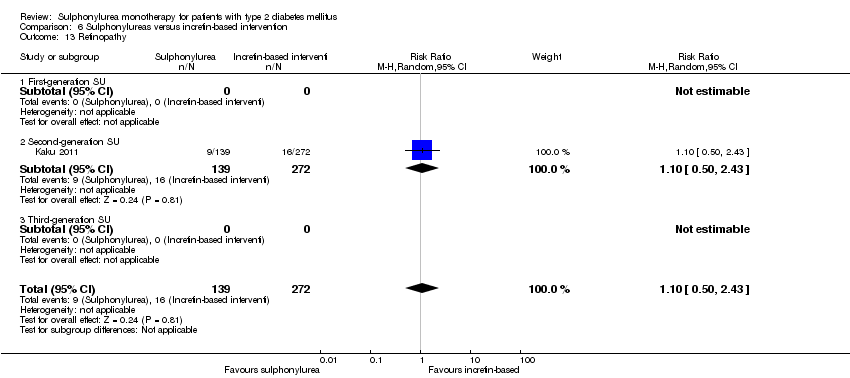
Comparison 6 Sulphonylureas versus incretin‐based intervention, Outcome 13 Retinopathy.

Comparison 6 Sulphonylureas versus incretin‐based intervention, Outcome 14 Retinal photocoagulation.

Comparison 6 Sulphonylureas versus incretin‐based intervention, Outcome 15 Change in fasting blood glucose from baseline (mmol/L).

Comparison 6 Sulphonylureas versus incretin‐based intervention, Outcome 16 Change in HbA1c from baseline (%).
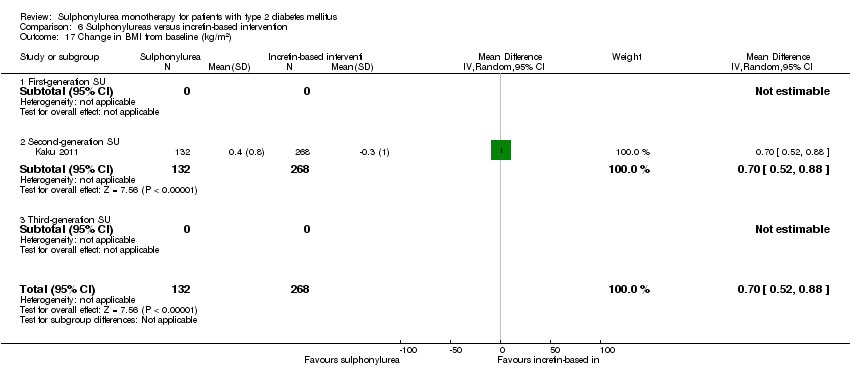
Comparison 6 Sulphonylureas versus incretin‐based intervention, Outcome 17 Change in BMI from baseline (kg/m2).

Comparison 6 Sulphonylureas versus incretin‐based intervention, Outcome 18 Change in weight from baseline (kg).

Comparison 6 Sulphonylureas versus incretin‐based intervention, Outcome 19 Adverse events.

Comparison 6 Sulphonylureas versus incretin‐based intervention, Outcome 20 Serious adverse events.

Comparison 6 Sulphonylureas versus incretin‐based intervention, Outcome 21 Drop‐outs due to adverse events.

Comparison 6 Sulphonylureas versus incretin‐based intervention, Outcome 22 Mild hypoglycaemia.
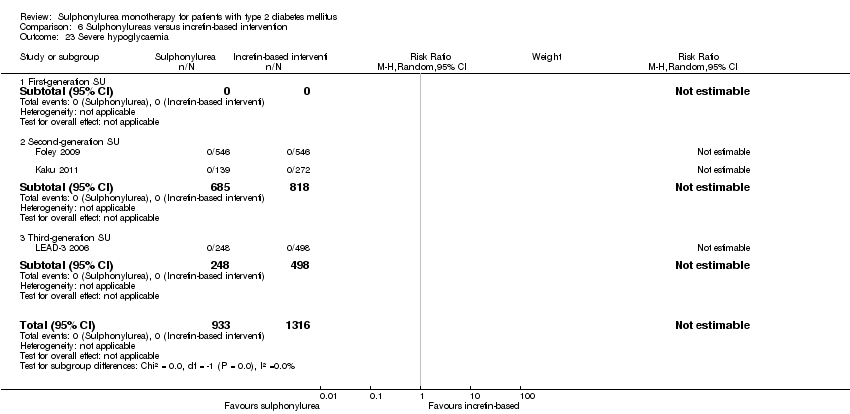
Comparison 6 Sulphonylureas versus incretin‐based intervention, Outcome 23 Severe hypoglycaemia.

Comparison 6 Sulphonylureas versus incretin‐based intervention, Outcome 24 Intervention failure.

Comparison 7 Sulphonylureas versus meglitinide, Outcome 1 All‐cause mortality.

Comparison 7 Sulphonylureas versus meglitinide, Outcome 2 All‐cause mortality; best‐worst case scenario.

Comparison 7 Sulphonylureas versus meglitinide, Outcome 3 All‐cause mortality; worst‐best case scenario.
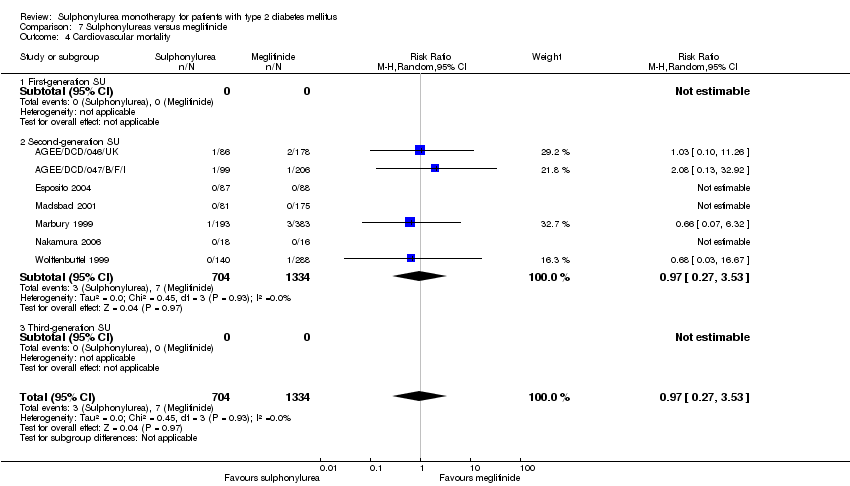
Comparison 7 Sulphonylureas versus meglitinide, Outcome 4 Cardiovascular mortality.

Comparison 7 Sulphonylureas versus meglitinide, Outcome 5 Non‐fatal macrovascular outcomes.

Comparison 7 Sulphonylureas versus meglitinide, Outcome 6 Non‐fatal myocardial infarction.

Comparison 7 Sulphonylureas versus meglitinide, Outcome 7 Non‐fatal stroke.

Comparison 7 Sulphonylureas versus meglitinide, Outcome 8 Amputation of lower extremity.

Comparison 7 Sulphonylureas versus meglitinide, Outcome 9 Cardial revascularisation.

Comparison 7 Sulphonylureas versus meglitinide, Outcome 10 Peripheral revascularisation.

Comparison 7 Sulphonylureas versus meglitinide, Outcome 11 Microvascular outcomes.

Comparison 7 Sulphonylureas versus meglitinide, Outcome 12 Nephropathy.

Comparison 7 Sulphonylureas versus meglitinide, Outcome 13 Retinopathy.

Comparison 7 Sulphonylureas versus meglitinide, Outcome 14 Retinal photocoagulation.
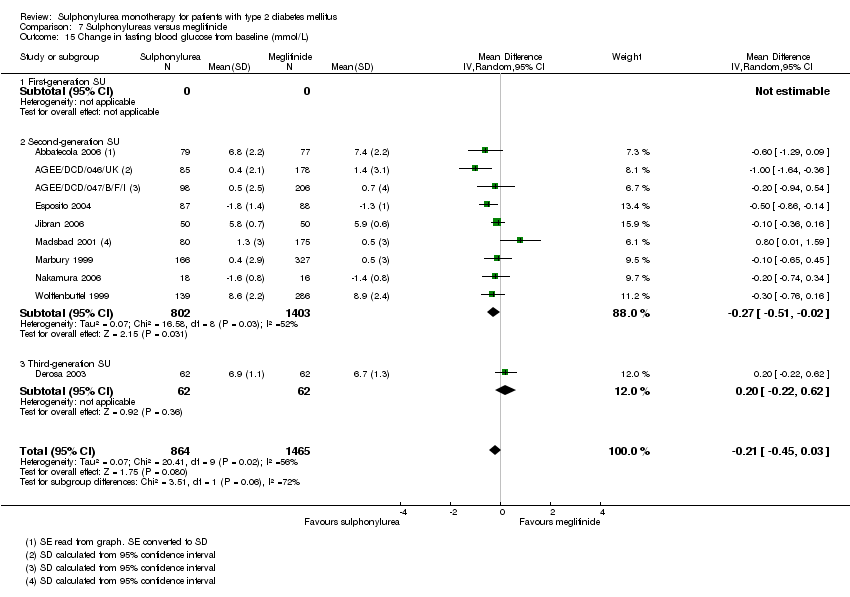
Comparison 7 Sulphonylureas versus meglitinide, Outcome 15 Change in fasting blood glucose from baseline (mmol/L).

Comparison 7 Sulphonylureas versus meglitinide, Outcome 16 Change in HbA1c from baseline (%).

Comparison 7 Sulphonylureas versus meglitinide, Outcome 17 Change in BMI from baseline (kg/m2).

Comparison 7 Sulphonylureas versus meglitinide, Outcome 18 Change in weight from baseline (kg).

Comparison 7 Sulphonylureas versus meglitinide, Outcome 19 Adverse events.

Comparison 7 Sulphonylureas versus meglitinide, Outcome 20 Drop‐outs due to adverse events.

Comparison 7 Sulphonylureas versus meglitinide, Outcome 21 Serious adverse events.

Comparison 7 Sulphonylureas versus meglitinide, Outcome 22 Mild hypoglycaemia.

Comparison 7 Sulphonylureas versus meglitinide, Outcome 23 Moderate hypoglycaemia.

Comparison 7 Sulphonylureas versus meglitinide, Outcome 24 Severe hypoglycaemia.
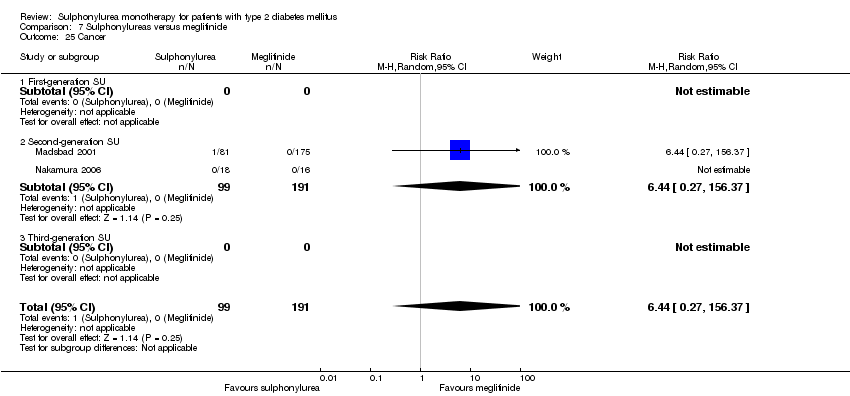
Comparison 7 Sulphonylureas versus meglitinide, Outcome 25 Cancer.

Comparison 7 Sulphonylureas versus meglitinide, Outcome 26 Intervention failure.
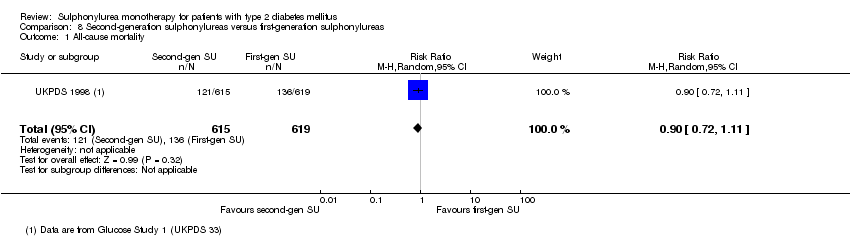
Comparison 8 Second‐generation sulphonylureas versus first‐generation sulphonylureas, Outcome 1 All‐cause mortality.

Comparison 8 Second‐generation sulphonylureas versus first‐generation sulphonylureas, Outcome 2 Cardiovascular mortality.
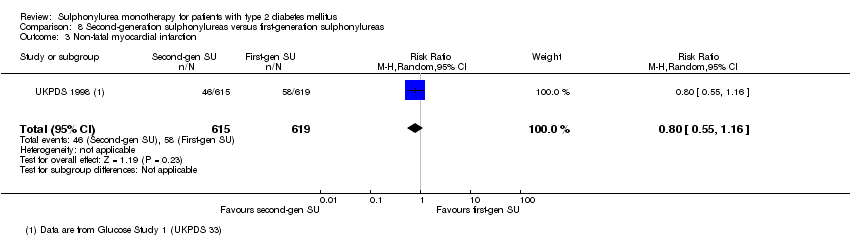
Comparison 8 Second‐generation sulphonylureas versus first‐generation sulphonylureas, Outcome 3 Non‐fatal myocardial infarction.
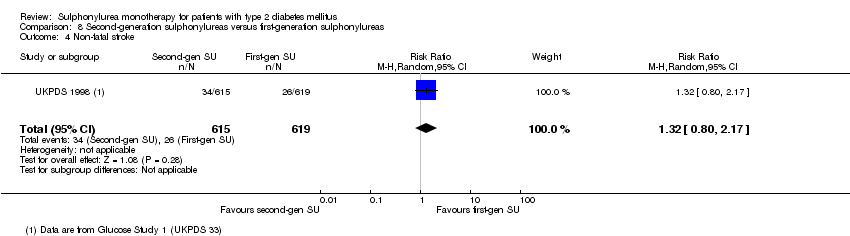
Comparison 8 Second‐generation sulphonylureas versus first‐generation sulphonylureas, Outcome 4 Non‐fatal stroke.

Comparison 8 Second‐generation sulphonylureas versus first‐generation sulphonylureas, Outcome 5 Amputation of lower extremity.
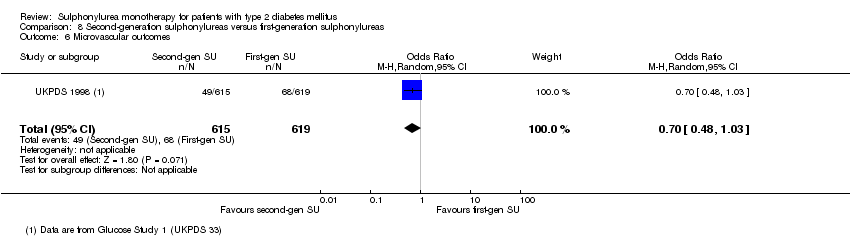
Comparison 8 Second‐generation sulphonylureas versus first‐generation sulphonylureas, Outcome 6 Microvascular outcomes.

Comparison 8 Second‐generation sulphonylureas versus first‐generation sulphonylureas, Outcome 7 Retinal photocoagulation.
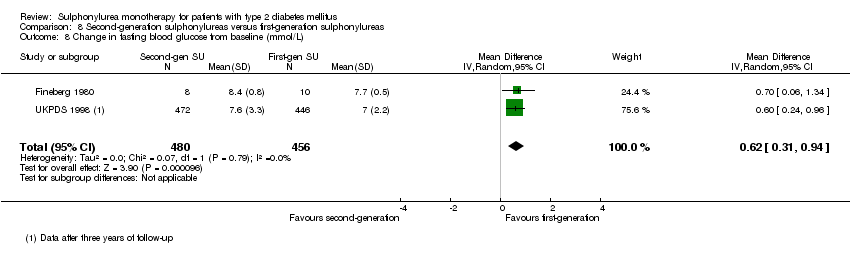
Comparison 8 Second‐generation sulphonylureas versus first‐generation sulphonylureas, Outcome 8 Change in fasting blood glucose from baseline (mmol/L).
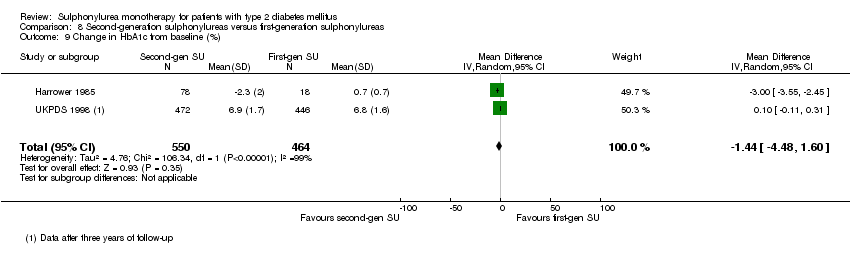
Comparison 8 Second‐generation sulphonylureas versus first‐generation sulphonylureas, Outcome 9 Change in HbA1c from baseline (%).

Comparison 8 Second‐generation sulphonylureas versus first‐generation sulphonylureas, Outcome 10 Change in weight from baseline (kg).

Comparison 8 Second‐generation sulphonylureas versus first‐generation sulphonylureas, Outcome 11 Mild hypoglycaemia.

Comparison 8 Second‐generation sulphonylureas versus first‐generation sulphonylureas, Outcome 12 Severe hypoglycaemia.
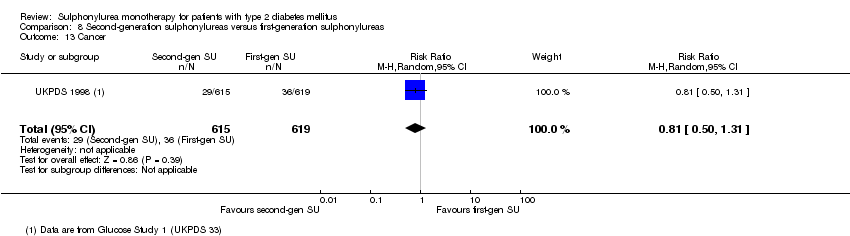
Comparison 8 Second‐generation sulphonylureas versus first‐generation sulphonylureas, Outcome 13 Cancer.

Comparison 8 Second‐generation sulphonylureas versus first‐generation sulphonylureas, Outcome 14 Intervention failure.
| First‐generation sulphonylureas compared with controls for type 2 diabetes mellitus | ||||
| Patient or population: participants with type 2 diabetes mellitus Settings: outpatients Intervention: first‐generation sulphonylureas (acetohexamide, carbutamide, chlorpropamide, tolbutamide, tolazamide) Comparison: placebo, active comparators | ||||
| Outcomes | Relative effect | No of participants | Quality of the evidence | Comments |
| All‐cause mortality a. Intervention vs placebo b. Intervention vs insulin | a.RR 1.46 (0.87 to 2.45) b. RR 1.18 (0.88 to 1.59) | a. 553 (2) b. 1944 (2) | ⊕⊕⊝⊝ | a. Small sample size (1.5% of the diversity‐adjusted required information size) b. Trial sequential analysis showed that 5.7% of the required information size to detect or reject a 10% RRR was accrued |
| Cardiovascular mortality a. Intervention vs placebo b. Intervention vs insulin | a.RR 2.63 (1.32 to 5.22) b. RR 1.36 (0.88 to 1.48) | a. 553 (2) b. 1944 (2) | ⊕⊕⊝⊝ | a. Small sample size (0.7% of the diversity‐adjusted required information size) b. Trial sequential analysis showed that 1.1% of the required information size to detect or reject a 10% RRR was accrued |
| Non‐fatal macrovascular outcomes 1. Composite 2. Non‐fatal myocardial infarction Intervention vs insulin | 1a. not estimable 2b. RR 1.08 (0.81 to 1.45) | 1a. See comment 2b.1944 (2) | 1a. See comment 2b. ⊕⊕⊝⊝ | 1a. No meta‐analysis possible |
| Microvascular outcomes | Not estimable | See comment | See comment | No meta‐analysis possible |
| Cancer Intervention vs insulin | RR 0.81 (0.29 to 2.27) | 1944 (2) | ⊕⊕⊝⊝ | One study reported any cancer and the other death due to cancer |
| Adverse events 1. All adverse events Intervention vs alpha‐glucosidase inhibitors | 1. RR 0.63 (0.52 to 0.76) 2. RR 0.28 (0.12 to 0.67) | 1. 246 (2) | ⊕⊕⊝⊝ | Trial sequential analysis showed that firm evidence was not established |
| Health‐related quality of life | Not estimable | See comment | See comment | Not investigated |
| GRADE Working Group grades of evidence | ||||
| aDue to imprecision and results of trial sequential analysis. RRR: relative risk reduction | ||||
| Second‐generation sulphonylureas compared with controls for type 2 diabetes mellitus | ||||
| Patient or population: participants with type 2 diabetes mellitus Settings: outpatients Intervention: second‐generation sulphonylureas (glibenclamide or glyburide, glibornuride, gliclazide, glipizide) Comparison: placebo, active comparators | ||||
| Outcomes | Relative effect | No of participants | Quality of the evidence | Comments |
| All‐cause mortality a. Intervention vs metformin b. Intervention vs thiazolidinediones c. Intervention vs insulin d. Intervention vs incretin‐based control e. Intervention vs meglitinide [e. 12 months to 17 months] | a. RR 0.98 (0.61 to 1.58) b. RR 0.92 (0.60 to 1.41) c. RR 0.96 (0.79 to 1.18) d. RR 1.39 (0.52 to 3.68) e. RR 1.44 (0.47 to 4.42) | a. 3528 (6) b. 4955 (7) c. 1642 (4) d. 1503 (2) e. 2038 (7) | ⊕⊕⊝⊝ | a. Trial sequential analysis showed that 2.3% of the required information size to detect or reject a 10% RRR was accrued. b. Results of the random‐effects model. Trial sequential analysis showed that 2.5% of the required information size to detect or reject a 10% RRR was accrued. c. Trial sequential analysis showed that 12.8% of the required information size to detect or reject a 10% RRR was accrued. d. Trial sequential analysis showed that 0.5% of the required information size to detect or reject a 10% RRR was accrued. e. Trial sequential analysis showed that only a minor fraction of the required information size to detect or reject a 10% RRR was accrued. |
| Cardiovascular mortality a. Intervention vs metformin b. Intervention vs thiazolidinediones c. Intervention vs insulin d. Intervention vs meglitinide [d. 12 months to 17 months] | a. RR 1.47 (0.54 to 4.01) b. RR 1.30 (0.55 to 3.07) c. RR 0.96 (0.73 to 1.28) d. RR 0.97 (0.27 to 3.53) | a. 3528 (6) b. 4955 (7) c. 1642 (4) d. 2038 (7) | ⊕⊕⊝⊝ | a. Trial sequential analysis showed that 2.7% of the required information size to detect or reject a 10% RRR was accrued. b. Trial sequential analysis showed that 0.3% of the required information size to detect or reject a 10% RRR was accrued. c. Trial sequential analysis showed that 6.6% of the required information size to detect or reject a 10% RRR was accrued. d. Trial sequential analysis showed that only a minor fraction of the required information size to detect or reject a 10% RRR was accrued. |
| Non‐fatal macrovascular outcomes a. Intervention vs metformin b. Intervention vs thiazolidinediones [1b. 52 weeks to 4 years] c. Intervention vs meglitinide [1c. 12 months to 15 months] a. Intervention vs metformin b. Intervention vs thiazolidinediones [2b. 24 weeks to 4 years] c. Intervention vs meglitinide [2c. 12 months to 17 months] | 1a. RR 0.67 (0.48 to 0.93) 1b. RR 0.91 (0.62 to 1.33) 1c. RR 0.50 (0.20 to 1.20) 2a.RR 1.02 (0.37 to 2.85) 2b. RR 0.68 (0.41 to 1.14) 2c. RR 1.03 (0.26 to 4.08) | 1a. 3018 (3) 1b. 4600 (6) 1c. 866 (3) 2a. 3061 (4) 2b. 4956 (7) 2c. 726 (3) | ⊕⊕⊝⊝ | 1a. Non‐fatal macrovascular outcomes as a composite outcome were not reported in the way we predefined to assess this outcome. Trial sequential analysis showed that 5% of the required information size to detect or reject a 10% RRR was accrued. 1c. The definition of non‐fatal macrovascular outcomes was heterogenous. |
| Microvascular outcomes | Not estimable | See comment | See comment | No meta‐analysis possible |
| Adverse events 1. All adverse events a. Intervention vs placebo b. Intervention vs metformin [3b. 24 weeks to 10.4 years] c. Intervention vs thiazolidinediones [3c. 6 months to 4 years] d. Intervention vs alpha‐glucosidase inhibitors [1d. 24 weeks to 12 months] e. Intervention vs incretin‐based control f. Intervention vs meglitinides [3f. 14 months to 17 months] | 1a. RR 0.91 (0.51 to 1.62) 1b. RR 0.99 (0.97 to 1.01) 1c. RR 0.99 (0.97 to 1.01) 1d. RR 0.64 (0.39 to 1.03) 1f. RR 1.0 (0.95 to 1.06) 2a. RR 0.62 (0.24 to 1.57) 2b.RR 1.19 (0.99 to 1.42) 2c. RR 1.15 (0.98 to 1.36) 2d. RR 0.48 (0.24 to 0.96) 2e. RR 1.00 (0.67 to 1.50) 2f. RR 1.01 (0.78 to 1.32) 3b. RR 5.64 (1.22 to 26.00) 3c. RR 6.11 (1.57 to 23.79) 3f. RR 2.17 (0.53 to 8.91) | 1a. 202 (2) 1b. 3042 (2) 1c. 6491 (10) 1d. 646 (8) 1f. 1829 (5) 2a. 510 (5) 2b. 3567 (7) 2c. 7433 (15) 2d. 970 (9) 2e. 1503 (2) 2f. 2019 (7) 3b. 3637 (4) 3c. 5669 (6) 3f. 1863 (6) | ⊕⊕⊝⊝ | 1d. Results of the random‐effects model. Fixed‐effect model: RR 0.67 (0.52 to 0.86) 2c. Results of the random‐effects model. Fixed‐effect model: RR 1.17 (1.01 to 1.35) 2d. Trial sequential analysis showed that only a minor fraction of the required information size to confirm or reject a 10% RRR was accrued 3b. Trial sequential analysis showed that only 0.1% of the required information size was accrued 3c. Trial sequential analysis showed that a minor fraction of the required information size was accrued |
| Cancer a. Intervention vs thiazolidinediones b. Intervention vs insulin | a. RR 1.02 (0.72 to 1.45) b. RR 0.95 (0.61 to 1.49) | a. 4192 (6) b. 1575 (2) | ⊕⊕⊝⊝ | |
| Health‐related quality of life a. Intervention vs thiazolidinediones b. Intervention vs insulin c. Intervention vs alpha‐glucosidase inhibitors | Not estimable | a. 35 (1) b. 49 (1) c. 35 (1) | ⊕⊝⊝⊝ | a. Inadequately reported, no scale provided b. Authors used short‐form 36 (SF 36), but did not find any significant differences between the interventions c. Inadequately reported, no scale provided |
| GRADE Working Group grades of evidence | ||||
| aDue to imprecision and results of trial sequential analysis. bDue to small sample size and risk of bias. RRR: relative risk reduction | ||||
| Third‐generation sulphonylureas compared with controls for type 2 diabetes mellitus | ||||
| Patient or population: participants with type 2 diabetes mellitus Settings: outpatients Intervention: third‐generation sulphonylureas (gliclazide modified release (MR), glimepiride, glipizide gastrointestinal therapeutic system (GITS)) Comparison: active comparators | ||||
| Outcomes | Relative effect | No of Participants | Quality of the evidence | Comments |
| All‐cause mortality | Not estimable | See comment | See comment | No meta‐analysis possible |
| Cardiovascular mortality | Not estimable | See comment | See comment | No meta‐analysis possible |
| Macrovascular outcomes | Not estimable | See comment | See comment | No meta‐analysis possible |
| Microvascular outcomes | Not estimable | See comment | See comment | No meta‐analysis possible |
| Adverse events 1. All adverse events Interventions vs thiazolidinediones [1. 6 months to 12 months] [2. 24 weeks to 52 weeks] | 1. RR 0.88 (0.78 to 0.99) 2. RR 0.54 (0.15 to 1.97) | 1. 510 (3) 2. 423 (2) | ⊕⊕⊝⊝ | 1. Trial sequential analysis showed that firm evidence was not established |
| Cancer | Not estimable | See comment | See comment | No meta‐analysis possible |
| Health‐related quality of life | Not estimable | See comment | See comment | No meta‐analysis possible |
| GRADE Working Group grades of evidence | ||||
| aDue to imprecision/small sample size and results of trial sequential analysis. RRR: relative risk reduction | ||||
| Characteristic Study ID | Intervention(s) and control(s) | [N] screened | [N] randomised | [N] safety | [N] lost to follow‐up (mortality) | [N] finishing study | [%] of randomised participants finishing study |
| Abbatecola 2006 | I1: glibenclamide C1: repaglinide | ‐ | I1: 79 C1: 77 T: 156 | I1: 73 C1: 74 T: 147 | ‐ | I1: 63 C1: 65 T: 128 | I1: 80 C1: 84 T: 82 |
| ADOPT 2006 | I1: glibenclamide C1: rosiglitazone C2: metformin | 6676 | I1: 1447 C1: 1458 C2: 1455 T: 4360 | I1: 1441 C1: 1456 C2: 1455 T: 4351 | ‐ | I1: 807 C1: 917 C2: 903 T: 2627 | I1: 56 C1: 63 C2: 62 T: 60 |
| AGEE/DCD/046/UK | I1:glibenclamide C1: repaglinide | 313 | I1: 86 C1: 178 T: 264 | I1: 85 C1: 178 T: 264 | ‐ | I1: 57 C1: 111 T: 168 | I1:66 C1: 62 T: 64 |
| AGEE/DCD/047/B/F/I | I1: gliclazide C1: repaglinide | 337 | I1: 99 C1: 206 T: 305 | I1: 99 C1: 206 T: 305 | ‐ | I1: 68 C1: 138 T: 206 | I1: 69 C1: 67 T: 68 |
| Alvarsson 2010 | I1: glibenclamide C1: insulin | 56 | I1: 26 C1: 23 T: 49 | ‐ | I1: 7 C1: 5 T: 12 | I1: 18 C1: 16 T: 34 | I1: 69 C1: 70 T: 70 |
| APPROACH 2010 a | I1: glipizide C1: rosiglitazone | 1147 | I1: 339 C1: 333 T: 672 | I1: 337 C1: 331 T: 668 | I1: 22 C1: 17 T: 39 | I1: 264 C1: 259 T: 523 | I1: 78 C1: 78 T: 78 |
| Birkeland 1994 | I1: glibenclamide I2: glipizide C1: placebo | ‐ | I1: 15 I2: 15 C1: 16 T: 46 | ‐ | I1: 0 I2: 0 C1: 0 T: 0 | I1: 15 I2: 13 C1: 12 T: 40 | I1: 100 I2: 87 C1: 75 T: 87 |
| Birkeland 2002 | I1: glibenclamide C1: insulin | 54 | I1: 18 C1: 18 T: 36 | ‐ | ‐ | ‐ | N/A |
| Campbell 1994 | I1: glipizide C1: metformin | 50 (?) | I1: 24 C1: 24 T: 48 | I1: 24 C1: 24 T: 48 | I1: 0 C1: 0 T: 0 | I1: 24 C1: 24 T: 48 | I1: 100 C1: 100 T: 100 |
| Charbonnel 2005 b | I1: gliclazide C1: pioglitazone | 2412 | I1: 626 C1: 624 T: 1270 | ‐ | I1: 4 C1: 4 T: 8 | I1: 525 C1: 530 T: 1055 | I1: ‐ C1: ‐ T: 83 |
| Collier 1989 | I1: gliclazide C1: metformin | ‐ | I1: 12 C1: 12 T: 24 | I1: 12 C1: 12 T: 24 | ‐ | I1: 12 C1: 12 T: 24 | I1: 100 C1: 100 T: 100 |
| Coniff 1995 | I1: tolbutamide C1: acarbose C2: placebo | ‐ | I1: 72 C1: 76 C2: 72 T: 220 | I1: 71 C1: 74 C2: 72 T: 217 | ‐ | ‐ | N/A |
| Dalzell 1986 | I1: tolbutamide C1: metformin | ‐ | I1: 15 C1: 18 T: 33 | ‐ | ‐ | ‐ | N/A |
| DeFronzo 2005 | I1: glibenclamide C1: metformin | 788 | I1: 209 C1: 210 T: 419 | ‐ | ‐ | I1: 174 C1: 157 T: 331 | I1: 83 C1: 75 T: 79 |
| Deng 2003 | I1: glibenclamide C1: Xiaoyaosan | 160 | I1: 80 C1: 80 T: 160 | ‐ | ‐ | ‐ | N/A |
| Derosa 2003 | I1: glimepiride C1: repaglinide | ‐ | I1: 66 C1: 66 T: 132 | I1: 66 C1: 66 T: 132 | I1: 4 C1: 4 T: 8 | I1: 62 C1: 62 T: 124 | I1: 94 C1: 94 T: 94 |
| Derosa 2004 | I1: glimepiride C1: metformin | ‐ | I1: 81 C1: 83 T: 164 | I1: 81 C1: 83 T: 164 | ‐ | I1: 73 C1: 75 T: 148 | I1:90 C1: 90 T: 90 |
| Diehl 1985 | I1: chlorpropamide C1: insulin | 137 | I1: 40 C1: 37 T: 77 | ‐ | ‐ | I1: 30 C1: 28 T: 58 | I1: 75 C1: 77 T: 75 |
| Ebeling 2001 | I1: glibenclamide C1: pioglitazone C2: placebo | ‐ | I1: 10 C1: 9 C2: 10 T: 29 | ‐ | ‐ | ‐ | N/A |
| Esposito 2004 | I1: glibenclamide C1: repaglinide | 210 | I1: 87 C1: 88 T: 175 | I1: 87 C1: 88 T: 175 | I1: 7 C1: 7 T: 14 | I1: 80 C1: 81 T: 161 | I1: 92 C1: 92 T: 92 |
| Feinböck 2003 | I1: glibenclamide C1: acarbose | ‐ | I1: 111 C1: 108 T: 219 | I1: 93 C1: 59 T: 152 | ‐ | I1: 93 C1: 59 T: 152 | I1: 84 C1: 55 T: 69 |
| Fineberg 1980 c | I1: glipizide C1: tolbutamide | ‐ | I1: ‐ C1: ‐ T: 29 | ‐ | ‐ | I1: 8 C1: 10 T: 18 | I1: ‐ C1: ‐ T: 62 |
| Foley 2009 | I1: gliclazide C1: vildagliptin | ‐ | I1: 546 C1: 546 T: 1092 | I1: 402 C1: 409 T: 811 | I1: 13 C1: 17 T: 30 | I1: 402 C1: 409 T: 811 | I1:74 C1: 75 T: 74 |
| Forst 2003 | I1: glibenclamide C1: insulin | 200 | I1: 68 C1: 75 T: 143 | I1: 68 C1: 75 T: 143 | I1: 0 C1: 0 T: 0 | I1: 68 C1: 75 T: 143 | I1: 100 C1: 100 T: 100 |
| Forst 2005 | I1: glimepiride C1: pioglitazone | 192 | I1: 87 C1: 92 T: 179 | I1: 84 C1: 89 T: 173 | I1: 3 C1: 3 T: 6 | I1: 84 C1: 89 T: 173 | I1:97 C1: 97 T: 97 |
| Hanefeld 2005 | I1: glibenclamide C1: rosiglitazone 2 mg C2: rosiglitazone 4 mg | ‐ | I1: 207 C1: 200 C2: 191 T: 598 | ‐ | I1: 0 C1: 0 C2: 0 T: 0 | I1: 173 C1: 153 C2: 158 T: 484 | I1: 84 C1: 77 C2: 83 T: 81 |
| Harrower 1985 | I1: glipizide I2: gliquidone I3: gliclazide I4: glibenclamide C1: chlorpropamide | ‐ | I1: 24 I2: 22 I3: 22 I4: 23 T: 112 | ‐ | I1: 4 I2: 3 I3: 2 I4: 4 T: 16 | I1: 20 I2: 19 I3: 20 I4: 19 T: 96 | I1: 83 I2: 86 I3: 91 I4: 83 T: 86 |
| Hermann 1991 d | I1: glibenclamide C1: metformin | ‐ | I1: ‐ C1: ‐ T: 25 | I1: 10 C1: 12 T: 22 | ‐ | I1: 10 C1: 12 T: 22 | N/A |
| Hermann 1991a | I1: glibenclamide C1: metformin | ‐ | I1: 34 C1: 38 T: 72 | ‐ | I1: 0 C1: 0 T: 0 | I1: 28 C1: 28 T: 56 | I1: 82 C1: 74 T: 78 |
| Hoffmann 1990 | I1: glibenclamide C1: acarbose | ‐ | I1: 47 C1: 48 T: 95 | ‐ | ‐ | ‐ | N/A |
| Hoffmann 1994 | I1: glibenclamide C1: placebo C2: acarbose | 96 | I1: 27 C1: 30 C2: 28 T: 85 | ‐ | I1: 0 C1: 0 T: 0 | I1: 27 C1: 30 C2: 28 T: 85 | I1: 100 C1: 100 C2: 100 |
| Hollander 1992 | I1: glibenclamide C1: insulin | ‐ | I1: 29 C1: 30 T: 59 | ‐ | ‐ | ‐ | N/A |
| Jain 2006 | I1: glibenclamide C1: pioglitazone | ‐ | I1: 251 C1: 251 T: 502 | ‐ | I1: 21 C1: 22 T: 43 | I1: 128 C1: 134 T: 262 | I1: 50 C1: 53 T: 52 |
| Jibran 2006 | I1: glibenclamide C1: repaglinide | ‐ | I1: 50 C1: 50 T: 100 | ‐ | ‐ | ‐ | N/A |
| Johnston 1997 | I1: glibenclamide C1: placebo C2: miglitol 25 mg C3: miglitol 50 mg | ‐ | I1: 104 C1: 101 C2: 104 C3: 102 T: 411 | ‐ | ‐ | ‐ | N/A |
| Kaku 2011 | I1: glibenclamide C1: liraglutide | 464 | I1: 139 C1: 272 T: 411 | I1: 132 C1: 268 T: 400 | ‐ | I1: 110 C1: 225 T: 335 | I1: 79 C1: 83 T: 82 |
| Kamel 1997 | I1: gliclazide I2: glibenclamide C1: acarbose C2: metformin C3: placebo | ‐ | I1: 9 I2: 8 C1: 10 C2: 6 C3: 10 T: 43 | ‐ | ‐ | ‐ | N/A |
| Kanda 1998 | I1: gliclazide C1: acarbose | 25 | I1: 9 C1: 10 T: 19 | ‐ | ‐ | I1: 9 C1: 10 T: 19 | I1: 100 C1: 100 T: 100 |
| Kovacevic 1997 | I1: glibenclamide C1: acarbose C2: placebo | ‐ | I1: 34 C1: 34 C2: 34 T: 102 | I1: 33 C1: 33 C2: 31 T: 97 | ‐ | I1: 33 C1: 33 C2: 31 T: 97 | I1: 97 C1: 97 C2: 91 T: 95 |
| Lawrence 2004 | I1: gliclazide C1: metformin C2: pioglitazone | 67 | I1: 22 C1: 21 C2: 21 T: 64 | ‐ | I1: 0 C1: 0 C2: 0 T: 0 | I1: 20 C1: 20 C2: 20 T: 60 | I1: 91 C1: 95 C2: 95 T: 94 |
| LEAD‐3 2006 e | I1: glimepiride C1: liraglutide 1.2 mg C2: liraglutide 1.8 mg | ‐ | I1: 248 C1: 251 C2: 247 T: 746 | I1: 248 C1: 251 C2: 246 T: 745 | ‐ | I1: 152 C1: 162 C2: 173 T: 487 | I1: 61 C1: 65 C2: 70 T: 65 |
| Madsbad 2001 | I1: glipizide C1: repaglinide | 320 | I1: 81 C1: 175 T: 256 | I1: 81 C1: 175 T: 256 | ‐ | I1: 58 C1: 140 T: 198 | I1: 72 C1: 80 T: 77 |
| Marbury 1999 | I1: glibenclamide C1: repaglinide | ‐ | I1: 193 C1: 383 T: 576 | I1: 193 C1: 383 T: 576 | ‐ | I1: 115 C1: 216 T: 331 | I1: 60 C1: 56 T: 57 |
| Memisogullari 2009 | I1: gliclazide C1: nothing | ‐ | I1: 26 C1: 30 T: 56 | ‐ | I1:0 C1: 0 T: 0 | ‐ | N/A |
| Nakamura 2004 | I1: glibenclamide C1: pioglitazone C2: voglibose | ‐ | I1: 15 C1: 15 C2: 15 T: 45 | I1: 15 C1: 15 C2: 15 T: 45 | I1: 0 C1: 0 C2: 0 T: 0 | I1: 15 C1: 15 C2: 15 T: 45 | I1: 100 C1: 100 C2: 100 T: 100 |
| Nakamura 2006 | I1: glibenclamide C1: pioglitazone C2: voglibose C3: nateglinide | 78 | I1: 18 C1: 17 C2: 17 C3: 16 T: 68 | I1: 18 C1: 17 C2: 17 C3: 16 T: 68 | I1: 0 C1: 0 C2: 0 C3: 0 T: 0 | I1: 18 C1: 17 C2: 17 C3: 16 T: 68 | I1: 100 C1: 100 C2: 100 C3: 100 T: 100 |
| Nathan 1988 | I1: glibenclamide C1: insulin | ‐ | I1: 16 C1: 15 T: 31 | I1: 16 C1: 15 T: 31 | I1: 0 C1: 0 T: 0 | I1: 16 C1: 15 T: 31 | I1: 100 C1: 100 T: 100 |
| Pagano 1995 f | I1: glibenclamide C1: miglitol | ‐ | I1: 47 C1: 50 T: 100 | I1: ‐ C1: ‐ T: 99 | I1: ‐ C1: ‐ T: 3 | I1: 47 C1: 49 T: 96 | I1: ‐ C1: ‐ T: 96 |
| Perriello 2007 | I1: gliclazide C1: pioglitazone | ‐ | I1: 137 C1: 146 T: 283 | ‐ | ‐ | I1: 135 C1: 140 T: 275 | I1: 99 C1: 96 T: 97 |
| Rosenthal 2002 | I1: glibenclamide C1: acarbose | ‐ | I1: 37 C1: 39 T: 76 | I1: 31 C1: 32 T: 63 | ‐ | I1: 31 C1: 32 T: 63 | I1: 84 C1: 82 T: 83 |
| Salman 2001 | I1: gliclazide C1: acarbose | ‐ | I1: 35 C1: 33 T: 68 | I1: 30 C1: 27 T: 57 | ‐ | I1: 30 C1: 27 T: 57 | I1: 86 C1: 82 T: 84 |
| Segal 1997 | I1: glibenclamide C1: miglitol C2: placebo | ‐ | I1: 69 C1: 67 C2: 65 T: 201 | I1: 69 C1: 67 C2: 65 T: 201 | I1: 11 C1: 12 C2: 6 T: 29 | I1: 50 C1: 49 C2: 58 T: 157 | I1: 72 C1: 73 C2: 89 T: 78 |
| Shihara 2011 | I1: glimepiride C1: pioglitazone | 238 | I1: 95 C1: 96 T: 191 | I1: 86 C1: 91 T: 177 | ‐ | I1: 86 C1: 91 T: 177 | I1: 91 C1: 95 T: 93 |
| Spengler 1992 g | I1: glibenclamide C1: acarbose | ‐ | I1: 36 C1: 36 T: 72 | ‐ | ‐ | I1: 29 C1: 26 T: 55 | I1: 81 C1: 72 T: 76 |
| Sung 1999 | I1: glibenclamide C1: troglitazone | ‐ | I1: 12 C1: 10 T: 22 | ‐ | ‐ | ‐ | N/A |
| Sutton 2002 h | I1: glibenclamide C1: rosiglitazone | 351 | I1: 99 C1: 104 T: 203 | I1: 99 C1: 104 T: 203 | I1: 3 C1: 2 T: 5 | I1: 65 C1: 64 T: 129 | I1: 66 C1: 62 T: 64 |
| Tan 2004 | I1: glimepiride C1: pioglitazone | 584 | I1: 123 C1: 121 T: 244 | I1: 92 C1: 100 T: 192 | I1: 11 C1: 6 T: 17 | I1: 89 C1: 87 T: 176 | I1: 72 C1: 72 T: 72 |
| Tan 2004a | I1: glimepiride C1: pioglitazone | ‐ | I1: 109 C1: 91 T: 200 | I1: 109 C1: 91 T: 200 | ‐ | I1: 68 C1: 55 T: 123 | I1: 62 C1: 60 T: 62 |
| Tan 2005 i | I1: gliclazide C1: pioglitazone | 2412 | I1: 297 C1: 270 T: 567 | ‐ | I1: 4 C1: 2 T: 6 | I1: 127 C1: 147 T: 274 | I1: 43 C1: 54 T: 48 |
| Tang 2004 | I1: glimepiride C1: metformin | ‐ | I1: 33 C1: 29 T: 62 | ‐ | ‐ | ‐ | N/A |
| Teramoto 2007 | I1: glibenclamide C1: pioglitazone | 126 | I1: 46 C1: 46 | I1: 41 C1: 39 T: 80 | ‐ | I1: 41 C1: 39 T: 80 | I1: 89 C1: 85 T: 86 |
| Tessier 1999 | I1: gliclazide C1: metformin | ‐ | I1: 19 C1: 20 T: 39 | ‐ | I1: 1 C1: 2 T: 3 | I1: 18 | I1: 94.7 |
| Tosi 2003 | I1: glibenclamide C1: metformin | ‐ | I1: 22 C1: 22 T: 44 | ‐ | ‐ | I1: 20 C1: 19 T: 39 | I1: 91 C1: 86 T: 89 |
| UGDP 1970 | I1: tolbutamide C1: placebo C1: insulin | ‐ | I1: 204 C1: 205 C2: 210 T: 619 | I1: 75% on tolbutamide C1: 75% on placebo C2: ‐ T: ‐ | ‐ | ‐ | N/A |
| UKPDS 1998 j | Study 1: I1: chlorpropamide I2: glibenclamide I3: glipizide C1: insulin | 7616 | I1: 788 I2: 615 I3: 170 C1: 1156 T: 2729 | ‐ | ‐ | ‐ | N/A |
| UKPDS 34 1998 | I1: chlorpropamide I2: glibenclamide C1: metformin C2: insulin | 4209 | I1: 265 I2: 277 C1: 342 C2: 409 T: 1293 | ‐ | I1: ‐ I2: ‐ C1: ‐ C2: ‐ T: 13 | ‐ | N/A |
| van de Laar 2004 | I1: tolbutamide C1: acarbose | 144 | I1: 50 C1: 48 T: 98 | I1: 48 C1: 48 T: 96 | I1: 5 C1: 16 T: 21 | I1: 43 C1: 32 T: 75 | I1: 86 C1: 67 T: 77 |
| Watanabe 2005 | I1: glibenclamide C1: pioglitazone | ‐ | I1: 15 C1: 15 | I1: 14 C1: 13 | I1: 1 C1: 2 | I1: 14 C1: 13 | I1: 93 C1: 87 |
| Wolffenbuttel 1989 | I1: tolbutamide C1: insulin | ‐ | I1: 6 C1: 7 T: 13 | ‐ | ‐ | ‐ | N/A |
| Wolffenbuttel 1999 | I1: glibenclamide C1: repaglinide | 491 | I1: 140 C1: 288 | I1: 139 C1: 286 | ‐ | I1: 109 C1: 211 T: 320 | I1: 78 C1: 74 T: 75 |
| Yamanouchi 2005 | I1: glimepiride C1: pioglitazone C2: metformin | ‐ | I1: 37 C1: 38 C2: 39 T: 114 | ‐ | I1: 3 C1: 0 C2: 1 T: 4 | I1: 34 C1: 35 C2: 37 T: 106 | I1: 92 C1: 92 C2: 95 T: 93 |
| Zhang 2005 | I1: glipizide C1: rosiglitazone 4 mg C2: rosiglitazone 8 mg | 45 | I1: 8 C1: 8 C2: 8 T: 24 | I1: 8 C1: 8 C2: 8 T: 24 | I1: 0 C1: 0 C2: 0 T: 0 | I1: 8 C1: 8 C2: 8 T: 24 | I1: 100 C1: 100 C2: 100 T: 100 |
| Totalk | I: any sulphonylurea C: any comparator | I: 9707 C: 12,805 T:22,589 | I: 4901 C: 6888 T:11,789 | ||||
| "‐" denotes not reported aThe number of participants finishing the trial is taken from clinicaltrials.gov and is the number of individuals who completed the trial as defined by investigator. bTwenty of the randomised participants are not included in the analysis. It is unknown to which group they belong. Therefore the total number of randomised participants does not equal the sum of the number of randomised patients in each intervention group. cThe number of randomised participants to each comparator group is not reported. Only the 18 participants finishing the trial are described in the publication. dIt is reported that 25 participants were randomised, but only the 22 participants who completed the trial are presented. eData after 52 weeks of double‐blind intervention. From the double‐blind intervention period to the open‐label extension of 91 weeks 84 participants discontinued in the glimepiride group, 70 in the liraglutide 1.2 mg group and 71 in the liraglutide 1.8 mg group. fIt is not described in the publication to which group the three patients who were lost to follow‐up belonged. However, it is stated in the publication that 100 participants were randomised. gA total of 72 participants underwent randomisation, but only 55 participants are included in the analyses of the trial. Eleven participants were excluded because they had received sulphonylurea previously, but the authors did not report to which group they initially were randomised. hIn the publication there is a discrepancy in the number of participants finishing the study. iThe number of patients screened is the number screened to the initial 52 weeks (Charbonnel 2005). jThe numbers for chlorpropamide and insulin interventions are the number of participants randomised to 'Glucose Study 1' plus the number of participants randomised to 'Glucose Study 2'. Lost to follow‐up mortality is not explicitly explained for each antidiabetic intervention group. For 'Glucose Study 1' vital status was unknown for 57 participants in the intensive intervention group (chlorpropamide/glibenclamide/insulin). kThe number of total is not the same as the number of I and C together, as some of the trials only reported the total number of participants randomised (Fineberg 1980; Hermann 1991; Pagano 1995). Several trials did not report the number of participants finishing study. ADOPT: A Diabetes Outcome Progression Trial; APPROACH: Assessment on the Prevention of Progression by Rosiglitazone on Atherosclerosis in Type 2 Diabetes Patients with Cardiovascular History; C: control; I: intervention; LEAD‐3: Liraglutide Effect and Action in Diabetes‐3; N/A: not acknowledged; T: total; UKPDS: United Kingdom Prospective Diabetes Study | |||||||
| Outcome or subgroup title | No. of studies | No. of participants | Statistical method | Effect size |
| 1 All‐cause mortality Show forest plot | 5 | 883 | Risk Ratio (M‐H, Random, 95% CI) | 1.51 [0.91, 2.52] |
| 1.1 First‐generation SU | 2 | 553 | Risk Ratio (M‐H, Random, 95% CI) | 1.46 [0.87, 2.45] |
| 1.2 Second‐generation SU | 3 | 330 | Risk Ratio (M‐H, Random, 95% CI) | 4.86 [0.24, 99.94] |
| 1.3 Third‐generation SU | 0 | 0 | Risk Ratio (M‐H, Random, 95% CI) | 0.0 [0.0, 0.0] |
| 2 All‐cause mortality; best‐worst case scenario Show forest plot | 1 | 57 | Risk Ratio (M‐H, Random, 95% CI) | 0.0 [0.0, 0.0] |
| 2.1 First‐generation SU | 0 | 0 | Risk Ratio (M‐H, Random, 95% CI) | 0.0 [0.0, 0.0] |
| 2.2 Second‐generation SU | 1 | 57 | Risk Ratio (M‐H, Random, 95% CI) | 0.0 [0.0, 0.0] |
| 2.3 Third‐generation SU | 0 | 0 | Risk Ratio (M‐H, Random, 95% CI) | 0.0 [0.0, 0.0] |
| 3 All‐cause mortality; worst‐best case scenario Show forest plot | 1 | 57 | Risk Ratio (M‐H, Random, 95% CI) | 0.0 [0.0, 0.0] |
| 3.1 First‐generation SU | 0 | 0 | Risk Ratio (M‐H, Random, 95% CI) | 0.0 [0.0, 0.0] |
| 3.2 Second‐generation SU | 1 | 57 | Risk Ratio (M‐H, Random, 95% CI) | 0.0 [0.0, 0.0] |
| 3.3 Third‐generation SU | 0 | 0 | Risk Ratio (M‐H, Random, 95% CI) | 0.0 [0.0, 0.0] |
| 4 Cardiovascular mortality Show forest plot | 5 | 883 | Risk Ratio (M‐H, Random, 95% CI) | 2.64 [1.35, 5.17] |
| 4.1 First‐generation SU | 2 | 553 | Risk Ratio (M‐H, Random, 95% CI) | 2.63 [1.32, 5.22] |
| 4.2 Second‐generation SU | 3 | 330 | Risk Ratio (M‐H, Random, 95% CI) | 2.91 [0.12, 70.71] |
| 4.3 Third‐generation SU | 0 | 0 | Risk Ratio (M‐H, Random, 95% CI) | 0.0 [0.0, 0.0] |
| 5 Non‐fatal macrovascular outcomes Show forest plot | 1 | 205 | Risk Ratio (M‐H, Random, 95% CI) | 1.32 [0.82, 2.13] |
| 5.1 First‐generation SU | 0 | 0 | Risk Ratio (M‐H, Random, 95% CI) | 0.0 [0.0, 0.0] |
| 5.2 Second‐generation SU | 1 | 205 | Risk Ratio (M‐H, Random, 95% CI) | 1.32 [0.82, 2.13] |
| 5.3 Third‐generation SU | 0 | 0 | Risk Ratio (M‐H, Random, 95% CI) | 0.0 [0.0, 0.0] |
| 6 Non‐fatal myocardial infarction Show forest plot | 1 | 409 | Risk Ratio (M‐H, Random, 95% CI) | 0.80 [0.43, 1.51] |
| 6.1 First‐generation SU | 1 | 409 | Risk Ratio (M‐H, Random, 95% CI) | 0.80 [0.43, 1.51] |
| 6.2 Second‐generation SU | 0 | 0 | Risk Ratio (M‐H, Random, 95% CI) | 0.0 [0.0, 0.0] |
| 6.3 Third‐generation SU | 0 | 0 | Risk Ratio (M‐H, Random, 95% CI) | 0.0 [0.0, 0.0] |
| 7 Amputation of lower extremity Show forest plot | 1 | 409 | Risk Ratio (M‐H, Random, 95% CI) | 0.20 [0.01, 4.16] |
| 7.1 First‐generation SU | 1 | 409 | Risk Ratio (M‐H, Random, 95% CI) | 0.20 [0.01, 4.16] |
| 7.2 Second‐generation SU | 0 | 0 | Risk Ratio (M‐H, Random, 95% CI) | 0.0 [0.0, 0.0] |
| 7.3 Third‐generation SU | 0 | 0 | Risk Ratio (M‐H, Random, 95% CI) | 0.0 [0.0, 0.0] |
| 8 Nephropathy Show forest plot | 1 | 409 | Risk Ratio (M‐H, Random, 95% CI) | 1.26 [0.34, 4.61] |
| 8.1 First‐generation SU | 1 | 409 | Risk Ratio (M‐H, Random, 95% CI) | 1.26 [0.34, 4.61] |
| 8.2 Second‐generation SU | 0 | 0 | Risk Ratio (M‐H, Random, 95% CI) | 0.0 [0.0, 0.0] |
| 8.3 Third‐generation SU | 0 | 0 | Risk Ratio (M‐H, Random, 95% CI) | 0.0 [0.0, 0.0] |
| 9 Retinopathy Show forest plot | 1 | 409 | Risk Ratio (M‐H, Random, 95% CI) | 0.93 [0.67, 1.30] |
| 9.1 First‐generation SU | 1 | 409 | Risk Ratio (M‐H, Random, 95% CI) | 0.93 [0.67, 1.30] |
| 9.2 Second‐generation SU | 0 | 0 | Risk Ratio (M‐H, Random, 95% CI) | 0.0 [0.0, 0.0] |
| 9.3 Third‐generation SU | 0 | 0 | Risk Ratio (M‐H, Random, 95% CI) | 0.0 [0.0, 0.0] |
| 10 Change in fasting blood glucose from baseline (mmol/L) Show forest plot | 6 | 342 | Mean Difference (IV, Random, 95% CI) | ‐1.35 [‐2.00, ‐0.69] |
| 10.1 First‐generation SU | 1 | 128 | Mean Difference (IV, Random, 95% CI) | ‐2.1 [‐3.19, ‐1.01] |
| 10.2 Second‐generation SU | 5 | 214 | Mean Difference (IV, Random, 95% CI) | ‐1.20 [‐1.94, ‐0.46] |
| 10.3 Third‐generation SU | 0 | 0 | Mean Difference (IV, Random, 95% CI) | 0.0 [0.0, 0.0] |
| 11 Change in HbA1c from baseline (%) Show forest plot | 6 | 342 | Mean Difference (IV, Random, 95% CI) | 1.00 [‐1.21, ‐0.79] |
| 11.1 First‐generation SU | 1 | 128 | Mean Difference (IV, Random, 95% CI) | ‐0.94 [‐1.29, ‐0.59] |
| 11.2 Second‐generation SU | 5 | 214 | Mean Difference (IV, Random, 95% CI) | ‐1.02 [‐1.32, ‐0.72] |
| 11.3 Third‐generation SU | 0 | 0 | Mean Difference (IV, Random, 95% CI) | 0.0 [0.0, 0.0] |
| 12 Change in BMI from baseline (kg/m2) Show forest plot | 3 | 141 | Mean Difference (IV, Random, 95% CI) | ‐0.09 [‐0.59, 0.41] |
| 12.1 First‐generation SU | 0 | 0 | Mean Difference (IV, Random, 95% CI) | 0.0 [0.0, 0.0] |
| 12.2 Second‐generation SU | 3 | 141 | Mean Difference (IV, Random, 95% CI) | ‐0.09 [‐0.59, 0.41] |
| 12.3 Third‐generation SU | 0 | 0 | Mean Difference (IV, Random, 95% CI) | 0.0 [0.0, 0.0] |
| 13 Change in weight from baseline (kg) Show forest plot | 1 | 128 | Mean Difference (IV, Random, 95% CI) | ‐0.40 [‐1.36, 0.56] |
| 13.1 First‐generation SU | 1 | 128 | Mean Difference (IV, Random, 95% CI) | ‐0.40 [‐1.36, 0.56] |
| 13.2 Second‐generation SU | 0 | 0 | Mean Difference (IV, Random, 95% CI) | 0.0 [0.0, 0.0] |
| 13.3 Third‐generation SU | 0 | 0 | Mean Difference (IV, Random, 95% CI) | 0.0 [0.0, 0.0] |
| 14 Adverse events Show forest plot | 3 | 346 | Risk Ratio (M‐H, Random, 95% CI) | 1.23 [0.92, 1.64] |
| 14.1 First‐generation SU | 1 | 144 | Risk Ratio (M‐H, Random, 95% CI) | 1.35 [0.97, 1.88] |
| 14.2 Second‐generation SU | 2 | 202 | Risk Ratio (M‐H, Random, 95% CI) | 0.91 [0.51, 1.62] |
| 14.3 Third‐generation SU | 0 | 0 | Risk Ratio (M‐H, Random, 95% CI) | 0.0 [0.0, 0.0] |
| 15 Drop‐outs due to adverse events Show forest plot | 6 | 654 | Risk Ratio (M‐H, Random, 95% CI) | 0.67 [0.33, 1.36] |
| 15.1 First‐generation SU | 1 | 144 | Risk Ratio (M‐H, Random, 95% CI) | 0.75 [0.17, 3.23] |
| 15.2 Second‐generation SU | 5 | 510 | Risk Ratio (M‐H, Random, 95% CI) | 0.62 [0.24, 1.57] |
| 15.3 Third‐generation SU | 0 | 0 | Risk Ratio (M‐H, Random, 95% CI) | 0.0 [0.0, 0.0] |
| 16 Mild hypoglycaemia Show forest plot | 1 | 134 | Risk Ratio (M‐H, Random, 95% CI) | 12.26 [0.70, 213.33] |
| 16.1 First‐generation SU | 0 | 0 | Risk Ratio (M‐H, Random, 95% CI) | 0.0 [0.0, 0.0] |
| 16.2 Second‐generation SU | 1 | 134 | Risk Ratio (M‐H, Random, 95% CI) | 12.26 [0.70, 213.33] |
| 16.3 Third‐generation SU | 0 | 0 | Risk Ratio (M‐H, Random, 95% CI) | 0.0 [0.0, 0.0] |
| 17 Severe hypoglycaemia Show forest plot | 1 | 46 | Risk Ratio (M‐H, Random, 95% CI) | 0.0 [0.0, 0.0] |
| 17.1 First‐generation SU | 0 | 0 | Risk Ratio (M‐H, Random, 95% CI) | 0.0 [0.0, 0.0] |
| 17.2 Second‐generation SU | 1 | 46 | Risk Ratio (M‐H, Random, 95% CI) | 0.0 [0.0, 0.0] |
| 17.3 Third‐generation SU | 0 | 0 | Risk Ratio (M‐H, Random, 95% CI) | 0.0 [0.0, 0.0] |
| 18 Cancer Show forest plot | 2 | 614 | Risk Ratio (M‐H, Random, 95% CI) | 0.54 [0.06, 5.05] |
| 18.1 First‐generation SU | 1 | 409 | Risk Ratio (M‐H, Random, 95% CI) | 0.25 [0.07, 0.88] |
| 18.2 Second‐generation SU | 1 | 205 | Risk Ratio (M‐H, Random, 95% CI) | 2.91 [0.12, 70.71] |
| 18.3 Third‐generation SU | 0 | 0 | Risk Ratio (M‐H, Random, 95% CI) | 0.0 [0.0, 0.0] |
| 19 Intervention failure Show forest plot | 4 | 794 | Risk Ratio (M‐H, Random, 95% CI) | 0.26 [0.07, 0.94] |
| 19.1 First‐generation SU | 1 | 409 | Risk Ratio (M‐H, Random, 95% CI) | 0.72 [0.44, 1.19] |
| 19.2 Second‐generation SU | 3 | 385 | Risk Ratio (M‐H, Random, 95% CI) | 0.13 [0.04, 0.44] |
| 19.3 Third‐generation SU | 0 | 0 | Risk Ratio (M‐H, Random, 95% CI) | 0.0 [0.0, 0.0] |
| Outcome or subgroup title | No. of studies | No. of participants | Statistical method | Effect size |
| 1 All‐cause mortality Show forest plot | 8 | 3768 | Risk Ratio (M‐H, Random, 95% CI) | 0.98 [0.61, 1.58] |
| 1.1 First‐generation SU | 0 | 0 | Risk Ratio (M‐H, Random, 95% CI) | 0.0 [0.0, 0.0] |
| 1.2 Second‐generation SU | 6 | 3528 | Risk Ratio (M‐H, Random, 95% CI) | 0.98 [0.61, 1.58] |
| 1.3 Third‐generation SU | 2 | 240 | Risk Ratio (M‐H, Random, 95% CI) | 0.0 [0.0, 0.0] |
| 2 All‐cause mortality; best‐worst case scenario Show forest plot | 5 | 283 | Risk Ratio (M‐H, Random, 95% CI) | 0.72 [0.12, 4.45] |
| 2.1 First‐generation SU | 0 | 0 | Risk Ratio (M‐H, Random, 95% CI) | 0.0 [0.0, 0.0] |
| 2.2 Second‐generation SU | 4 | 207 | Risk Ratio (M‐H, Random, 95% CI) | 1.02 [0.10, 10.25] |
| 2.3 Third‐generation SU | 1 | 76 | Risk Ratio (M‐H, Random, 95% CI) | 0.35 [0.01, 8.35] |
| 3 All‐cause mortality; worst‐best case scenario Show forest plot | 5 | 283 | Risk Ratio (M‐H, Random, 95% CI) | 1.81 [0.37, 8.71] |
| 3.1 First‐generation SU | 0 | 0 | Risk Ratio (M‐H, Random, 95% CI) | 0.0 [0.0, 0.0] |
| 3.2 Second‐generation SU | 4 | 207 | Risk Ratio (M‐H, Random, 95% CI) | 1.02 [0.10, 10.25] |
| 3.3 Third‐generation SU | 1 | 76 | Risk Ratio (M‐H, Random, 95% CI) | 3.16 [0.34, 29.06] |
| 4 Cardiovascular mortality Show forest plot | 8 | 3768 | Risk Ratio (M‐H, Random, 95% CI) | 1.47 [0.54, 4.01] |
| 4.1 First‐generation SU | 0 | 0 | Risk Ratio (M‐H, Random, 95% CI) | 0.0 [0.0, 0.0] |
| 4.2 Second‐generation SU | 6 | 3528 | Risk Ratio (M‐H, Random, 95% CI) | 1.47 [0.54, 4.01] |
| 4.3 Third‐generation SU | 2 | 240 | Risk Ratio (M‐H, Random, 95% CI) | 0.0 [0.0, 0.0] |
| 5 Non‐fatal macrovascular outcomes Show forest plot | 4 | 3094 | Risk Ratio (M‐H, Random, 95% CI) | 0.67 [0.48, 0.93] |
| 5.1 First‐generation SU | 0 | 0 | Risk Ratio (M‐H, Random, 95% CI) | 0.0 [0.0, 0.0] |
| 5.2 Second‐generation SU | 3 | 3018 | Risk Ratio (M‐H, Random, 95% CI) | 0.67 [0.48, 0.93] |
| 5.3 Third‐generation SU | 1 | 76 | Risk Ratio (M‐H, Random, 95% CI) | 0.0 [0.0, 0.0] |
| 6 Non‐fatal myocardial infarction Show forest plot | 4 | 3061 | Risk Ratio (M‐H, Random, 95% CI) | 1.02 [0.37, 2.85] |
| 6.1 First‐generation SU | 0 | 0 | Risk Ratio (M‐H, Random, 95% CI) | 0.0 [0.0, 0.0] |
| 6.2 Second‐generation SU | 4 | 3061 | Risk Ratio (M‐H, Random, 95% CI) | 1.02 [0.37, 2.85] |
| 6.3 Third‐generation SU | 0 | 0 | Risk Ratio (M‐H, Random, 95% CI) | 0.0 [0.0, 0.0] |
| 7 Non‐fatal stroke Show forest plot | 1 | 44 | Risk Ratio (M‐H, Random, 95% CI) | 0.0 [0.0, 0.0] |
| 7.1 First‐generation SU | 0 | 0 | Risk Ratio (M‐H, Random, 95% CI) | 0.0 [0.0, 0.0] |
| 7.2 Second‐generation SU | 1 | 44 | Risk Ratio (M‐H, Random, 95% CI) | 0.0 [0.0, 0.0] |
| 7.3 Third‐generation SU | 0 | 0 | Risk Ratio (M‐H, Random, 95% CI) | 0.0 [0.0, 0.0] |
| 8 Amputation of lower extremity Show forest plot | 1 | 44 | Risk Ratio (M‐H, Random, 95% CI) | 0.0 [0.0, 0.0] |
| 8.1 First‐generation SU | 0 | 0 | Risk Ratio (M‐H, Random, 95% CI) | 0.0 [0.0, 0.0] |
| 8.2 Second‐generation SU | 1 | 44 | Risk Ratio (M‐H, Random, 95% CI) | 0.0 [0.0, 0.0] |
| 8.3 Third‐generation SU | 0 | 0 | Risk Ratio (M‐H, Random, 95% CI) | 0.0 [0.0, 0.0] |
| 9 Peripheral revascularisation Show forest plot | 2 | 2946 | Risk Ratio (M‐H, Random, 95% CI) | 1.15 [0.69, 1.92] |
| 9.1 First‐generation SU | 0 | 0 | Risk Ratio (M‐H, Random, 95% CI) | 0.0 [0.0, 0.0] |
| 9.2 Second‐generation SU | 2 | 2946 | Risk Ratio (M‐H, Random, 95% CI) | 1.15 [0.69, 1.92] |
| 9.3 Third‐generation SU | 0 | 0 | Risk Ratio (M‐H, Random, 95% CI) | 0.0 [0.0, 0.0] |
| 10 Microvascular outcomes Show forest plot | 1 | 44 | Risk Ratio (M‐H, Random, 95% CI) | 2.0 [0.20, 20.49] |
| 10.1 First‐generation SU | 0 | 0 | Risk Ratio (M‐H, Random, 95% CI) | 0.0 [0.0, 0.0] |
| 10.2 Second‐generation SU | 1 | 44 | Risk Ratio (M‐H, Random, 95% CI) | 2.0 [0.20, 20.49] |
| 10.3 Third‐generation SU | 0 | 0 | Risk Ratio (M‐H, Random, 95% CI) | 0.0 [0.0, 0.0] |
| 11 Nephropathy Show forest plot | 1 | 44 | Risk Ratio (M‐H, Random, 95% CI) | 1.0 [0.07, 15.00] |
| 11.1 First‐generation SU | 0 | 0 | Risk Ratio (M‐H, Random, 95% CI) | 0.0 [0.0, 0.0] |
| 11.2 Second‐generation SU | 1 | 44 | Risk Ratio (M‐H, Random, 95% CI) | 1.0 [0.07, 15.00] |
| 11.3 Third‐generation SU | 0 | 0 | Risk Ratio (M‐H, Random, 95% CI) | 0.0 [0.0, 0.0] |
| 12 Retinal photocoagulation Show forest plot | 1 | 44 | Risk Ratio (M‐H, Random, 95% CI) | 0.0 [0.0, 0.0] |
| 12.1 First‐generation SU | 0 | 0 | Risk Ratio (M‐H, Random, 95% CI) | 0.0 [0.0, 0.0] |
| 12.2 Second‐generation SU | 1 | 44 | Risk Ratio (M‐H, Random, 95% CI) | 0.0 [0.0, 0.0] |
| 12.3 Third‐generation SU | 0 | 0 | Risk Ratio (M‐H, Random, 95% CI) | 0.0 [0.0, 0.0] |
| 13 Change in fasting blood glucose from baseline (mmol/L) Show forest plot | 15 | 4654 | Mean Difference (IV, Random, 95% CI) | 0.20 [‐0.07, 0.48] |
| 13.1 First‐generation SU | 2 | 482 | Mean Difference (IV, Random, 95% CI) | 0.13 [‐0.75, 1.01] |
| 13.2 Second‐generation SU | 11 | 3891 | Mean Difference (IV, Random, 95% CI) | 0.43 [0.10, 0.75] |
| 13.3 Third‐generation SU | 3 | 281 | Mean Difference (IV, Random, 95% CI) | ‐0.22 [‐0.52, 0.08] |
| 14 Change in HbA1c from baseline (%) Show forest plot | 13 | 3632 | Mean Difference (IV, Random, 95% CI) | 0.06 [‐0.16, 0.29] |
| 14.1 First‐generation SU | 0 | 0 | Mean Difference (IV, Random, 95% CI) | 0.0 [0.0, 0.0] |
| 14.2 Second‐generation SU | 10 | 3351 | Mean Difference (IV, Random, 95% CI) | 0.17 [‐0.09, 0.44] |
| 14.3 Third‐generation SU | 3 | 281 | Mean Difference (IV, Random, 95% CI) | ‐0.18 [‐0.43, 0.07] |
| 15 Change in BMI from baseline (kg/m2) Show forest plot | 5 | 322 | Mean Difference (IV, Random, 95% CI) | 0.13 [‐0.69, 0.94] |
| 15.1 First‐generation SU | 0 | 0 | Mean Difference (IV, Random, 95% CI) | 0.0 [0.0, 0.0] |
| 15.2 Second‐generation SU | 3 | 103 | Mean Difference (IV, Random, 95% CI) | 0.25 [‐1.21, 1.70] |
| 15.3 Third‐generation SU | 2 | 219 | Mean Difference (IV, Random, 95% CI) | ‐0.10 [‐1.06, 0.86] |
| 16 Change in weight from baseline (kg) Show forest plot | 7 | 3497 | Mean Difference (IV, Random, 95% CI) | 3.77 [3.06, 4.47] |
| 16.1 First‐generation SU | 0 | 0 | Mean Difference (IV, Random, 95% CI) | 0.0 [0.0, 0.0] |
| 16.2 Second‐generation SU | 7 | 3497 | Mean Difference (IV, Random, 95% CI) | 3.77 [3.06, 4.47] |
| 16.3 Third‐generation SU | 0 | 0 | Mean Difference (IV, Random, 95% CI) | 0.0 [0.0, 0.0] |
| 17 Adverse events Show forest plot | 5 | 3118 | Risk Ratio (M‐H, Random, 95% CI) | 0.99 [0.97, 1.01] |
| 17.1 First‐generation SU | 0 | 0 | Risk Ratio (M‐H, Random, 95% CI) | 0.0 [0.0, 0.0] |
| 17.2 Second‐generation SU | 4 | 3042 | Risk Ratio (M‐H, Random, 95% CI) | 0.99 [0.97, 1.01] |
| 17.3 Third‐generation SU | 1 | 76 | Risk Ratio (M‐H, Random, 95% CI) | 3.16 [0.13, 75.16] |
| 18 Serious adverse events Show forest plot | 5 | 3175 | Risk Ratio (M‐H, Random, 95% CI) | 0.94 [0.82, 1.07] |
| 18.1 First‐generation SU | 0 | 0 | Risk Ratio (M‐H, Random, 95% CI) | 0.0 [0.0, 0.0] |
| 18.2 Second‐generation SU | 4 | 3011 | Risk Ratio (M‐H, Random, 95% CI) | 0.94 [0.82, 1.07] |
| 18.3 Third‐generation SU | 1 | 164 | Risk Ratio (M‐H, Random, 95% CI) | 0.0 [0.0, 0.0] |
| 19 Drop‐outs due to adverse events Show forest plot | 8 | 3731 | Risk Ratio (M‐H, Random, 95% CI) | 1.18 [0.98, 1.41] |
| 19.1 First‐generation SU | 0 | 0 | Risk Ratio (M‐H, Random, 95% CI) | 0.0 [0.0, 0.0] |
| 19.2 Second‐generation SU | 7 | 3567 | Risk Ratio (M‐H, Random, 95% CI) | 1.19 [0.99, 1.42] |
| 19.3 Third‐generation SU | 1 | 164 | Risk Ratio (M‐H, Random, 95% CI) | 0.20 [0.01, 4.20] |
| 20 Mild hypoglycaemia Show forest plot | 6 | 4827 | Risk Ratio (M‐H, Fixed, 95% CI) | 3.16 [2.74, 3.64] |
| 20.1 First‐generation SU | 1 | 607 | Risk Ratio (M‐H, Fixed, 95% CI) | 1.89 [1.00, 3.58] |
| 20.2 Second‐generation SU | 5 | 4056 | Risk Ratio (M‐H, Fixed, 95% CI) | 3.24 [2.80, 3.76] |
| 20.3 Third‐generation SU | 1 | 164 | Risk Ratio (M‐H, Fixed, 95% CI) | 0.0 [0.0, 0.0] |
| 21 Moderate hypoglycaemia Show forest plot | 1 | 44 | Risk Ratio (M‐H, Random, 95% CI) | 3.0 [0.13, 69.87] |
| 21.1 First‐generation SU | 0 | 0 | Risk Ratio (M‐H, Random, 95% CI) | 0.0 [0.0, 0.0] |
| 21.2 Second‐generation SU | 1 | 44 | Risk Ratio (M‐H, Random, 95% CI) | 3.0 [0.13, 69.87] |
| 21.3 Third‐generation SU | 0 | 0 | Risk Ratio (M‐H, Random, 95% CI) | 0.0 [0.0, 0.0] |
| 22 Severe hypoglycaemia Show forest plot | 5 | 4408 | Risk Ratio (M‐H, Random, 95% CI) | 4.50 [1.24, 16.31] |
| 22.1 First‐generation SU | 1 | 607 | Risk Ratio (M‐H, Random, 95% CI) | 2.58 [0.24, 28.31] |
| 22.2 Second‐generation SU | 4 | 3637 | Risk Ratio (M‐H, Random, 95% CI) | 5.64 [1.22, 26.00] |
| 22.3 Third‐generation SU | 1 | 164 | Risk Ratio (M‐H, Random, 95% CI) | 0.0 [0.0, 0.0] |
| 23 Cancer Show forest plot | 1 | 2902 | Risk Ratio (M‐H, Random, 95% CI) | 1.11 [0.76, 1.61] |
| 23.1 First‐generation SU | 0 | 0 | Risk Ratio (M‐H, Random, 95% CI) | 0.0 [0.0, 0.0] |
| 23.2 Second‐generation SU | 1 | 2902 | Risk Ratio (M‐H, Random, 95% CI) | 1.11 [0.76, 1.61] |
| 23.3 Third‐generation SU | 0 | 0 | Risk Ratio (M‐H, Random, 95% CI) | 0.0 [0.0, 0.0] |
| 24 Intervention failure Show forest plot | 9 | 4990 | Risk Ratio (M‐H, Random, 95% CI) | 0.92 [0.60, 1.39] |
| 24.1 First‐generation SU | 1 | 607 | Risk Ratio (M‐H, Random, 95% CI) | 0.63 [0.36, 1.09] |
| 24.2 Second‐generation SU | 7 | 4143 | Risk Ratio (M‐H, Random, 95% CI) | 0.97 [0.60, 1.57] |
| 24.3 Third‐generation SU | 2 | 240 | Risk Ratio (M‐H, Random, 95% CI) | 1.23 [0.43, 3.50] |
| Outcome or subgroup title | No. of studies | No. of participants | Statistical method | Effect size |
| 1 All‐cause mortality Show forest plot | 8 | 5030 | Risk Ratio (M‐H, Random, 95% CI) | 0.92 [0.60, 1.41] |
| 1.1 First‐generation SU | 0 | 0 | Risk Ratio (M‐H, Random, 95% CI) | 0.0 [0.0, 0.0] |
| 1.2 Second‐generation SU | 7 | 4955 | Risk Ratio (M‐H, Random, 95% CI) | 0.92 [0.60, 1.41] |
| 1.3 Third‐generation SU | 1 | 75 | Risk Ratio (M‐H, Random, 95% CI) | 0.0 [0.0, 0.0] |
| 2 All‐cause mortality; best‐worst case scenario Show forest plot | 5 | 1327 | Risk Ratio (M‐H, Random, 95% CI) | 0.18 [0.06, 0.54] |
| 2.1 First‐generation SU | 0 | 0 | Risk Ratio (M‐H, Random, 95% CI) | 0.0 [0.0, 0.0] |
| 2.2 Second‐generation SU | 4 | 1252 | Risk Ratio (M‐H, Random, 95% CI) | 0.18 [0.06, 0.54] |
| 2.3 Third‐generation SU | 1 | 75 | Risk Ratio (M‐H, Random, 95% CI) | 0.0 [0.0, 0.0] |
| 3 All‐cause mortality; worst‐best case scenario Show forest plot | 5 | 1327 | Risk Ratio (M‐H, Random, 95% CI) | 7.49 [1.39, 40.18] |
| 3.1 First‐generation SU | 0 | 0 | Risk Ratio (M‐H, Random, 95% CI) | 0.0 [0.0, 0.0] |
| 3.2 Second‐generation SU | 4 | 1252 | Risk Ratio (M‐H, Random, 95% CI) | 9.76 [0.59, 161.27] |
| 3.3 Third‐generation SU | 1 | 75 | Risk Ratio (M‐H, Random, 95% CI) | 7.18 [0.38, 134.45] |
| 4 Cardiovascular mortality Show forest plot | 8 | 5030 | Risk Ratio (M‐H, Random, 95% CI) | 1.30 [0.55, 3.07] |
| 4.1 First‐generation SU | 0 | 0 | Risk Ratio (M‐H, Random, 95% CI) | 0.0 [0.0, 0.0] |
| 4.2 Second‐generation SU | 7 | 4955 | Risk Ratio (M‐H, Random, 95% CI) | 1.30 [0.55, 3.07] |
| 4.3 Third‐generation SU | 1 | 75 | Risk Ratio (M‐H, Random, 95% CI) | 0.0 [0.0, 0.0] |
| 5 Non‐fatal macrovascular outcomes Show forest plot | 7 | 4675 | Risk Ratio (M‐H, Random, 95% CI) | 0.91 [0.62, 1.33] |
| 5.1 First‐generation SU | 0 | 0 | Risk Ratio (M‐H, Random, 95% CI) | 0.0 [0.0, 0.0] |
| 5.2 Second‐generation SU | 6 | 4600 | Risk Ratio (M‐H, Random, 95% CI) | 0.91 [0.62, 1.33] |
| 5.3 Third‐generation SU | 1 | 75 | Risk Ratio (M‐H, Random, 95% CI) | 0.0 [0.0, 0.0] |
| 6 Non‐fatal myocardial infarction Show forest plot | 7 | 4956 | Risk Ratio (M‐H, Random, 95% CI) | 0.68 [0.41, 1.14] |
| 6.1 First‐generation SU | 0 | 0 | Risk Ratio (M‐H, Random, 95% CI) | 0.0 [0.0, 0.0] |
| 6.2 Second‐generation SU | 7 | 4956 | Risk Ratio (M‐H, Random, 95% CI) | 0.68 [0.41, 1.14] |
| 6.3 Third‐generation SU | 0 | 0 | Risk Ratio (M‐H, Random, 95% CI) | 0.0 [0.0, 0.0] |
| 7 Non‐fatal stroke Show forest plot | 2 | 707 | Risk Ratio (M‐H, Random, 95% CI) | 0.20 [0.02, 1.67] |
| 7.1 First‐generation SU | 0 | 0 | Risk Ratio (M‐H, Random, 95% CI) | 0.0 [0.0, 0.0] |
| 7.2 Second‐generation SU | 2 | 707 | Risk Ratio (M‐H, Random, 95% CI) | 0.20 [0.02, 1.67] |
| 7.3 Third‐generation SU | 0 | 0 | Risk Ratio (M‐H, Random, 95% CI) | 0.0 [0.0, 0.0] |
| 8 Amputation of lower extremity Show forest plot | 2 | 707 | Risk Ratio (M‐H, Random, 95% CI) | 0.0 [0.0, 0.0] |
| 8.1 First‐generation SU | 0 | 0 | Risk Ratio (M‐H, Random, 95% CI) | 0.0 [0.0, 0.0] |
| 8.2 Second‐generation SU | 2 | 707 | Risk Ratio (M‐H, Random, 95% CI) | 0.0 [0.0, 0.0] |
| 8.3 Third‐generation SU | 0 | 0 | Risk Ratio (M‐H, Random, 95% CI) | 0.0 [0.0, 0.0] |
| 9 Cardial revascularisation Show forest plot | 2 | 707 | Risk Ratio (M‐H, Random, 95% CI) | 1.02 [0.61, 1.71] |
| 9.1 First‐generation SU | 0 | 0 | Risk Ratio (M‐H, Random, 95% CI) | 0.0 [0.0, 0.0] |
| 9.2 Second‐generation SU | 2 | 707 | Risk Ratio (M‐H, Random, 95% CI) | 1.02 [0.61, 1.71] |
| 9.3 Third‐generation SU | 0 | 0 | Risk Ratio (M‐H, Random, 95% CI) | 0.0 [0.0, 0.0] |
| 10 Peripheral revascularisation Show forest plot | 3 | 3612 | Risk Ratio (M‐H, Random, 95% CI) | 0.87 [0.54, 1.39] |
| 10.1 First‐generation SU | 0 | 0 | Risk Ratio (M‐H, Random, 95% CI) | 0.0 [0.0, 0.0] |
| 10.2 Second‐generation SU | 3 | 3612 | Risk Ratio (M‐H, Random, 95% CI) | 0.87 [0.54, 1.39] |
| 10.3 Third‐generation SU | 0 | 0 | Risk Ratio (M‐H, Random, 95% CI) | 0.0 [0.0, 0.0] |
| 11 Microvascular outcomes Show forest plot | 2 | 235 | Risk Ratio (M‐H, Random, 95% CI) | 0.83 [0.05, 13.16] |
| 11.1 First‐generation SU | 0 | 0 | Risk Ratio (M‐H, Random, 95% CI) | 0.0 [0.0, 0.0] |
| 11.2 Second‐generation SU | 2 | 235 | Risk Ratio (M‐H, Random, 95% CI) | 0.83 [0.05, 13.16] |
| 11.3 Third‐generation SU | 0 | 0 | Risk Ratio (M‐H, Random, 95% CI) | 0.0 [0.0, 0.0] |
| 12 Nephropathy Show forest plot | 2 | 707 | Risk Ratio (M‐H, Random, 95% CI) | 0.11 [0.01, 2.02] |
| 12.1 First‐generation SU | 0 | 0 | Risk Ratio (M‐H, Random, 95% CI) | 0.0 [0.0, 0.0] |
| 12.2 Second‐generation SU | 2 | 707 | Risk Ratio (M‐H, Random, 95% CI) | 0.11 [0.01, 2.02] |
| 12.3 Third‐generation SU | 0 | 0 | Risk Ratio (M‐H, Random, 95% CI) | 0.0 [0.0, 0.0] |
| 13 Retinopathy Show forest plot | 2 | 707 | Risk Ratio (M‐H, Random, 95% CI) | 0.98 [0.06, 15.64] |
| 13.1 First‐generation SU | 0 | 0 | Risk Ratio (M‐H, Random, 95% CI) | 0.0 [0.0, 0.0] |
| 13.2 Second‐generation SU | 2 | 707 | Risk Ratio (M‐H, Random, 95% CI) | 0.98 [0.06, 15.64] |
| 13.3 Third‐generation SU | 0 | 0 | Risk Ratio (M‐H, Random, 95% CI) | 0.0 [0.0, 0.0] |
| 14 Retinal photocoagulation Show forest plot | 2 | 707 | Risk Ratio (M‐H, Random, 95% CI) | 0.0 [0.0, 0.0] |
| 14.1 First‐generation SU | 0 | 0 | Risk Ratio (M‐H, Random, 95% CI) | 0.0 [0.0, 0.0] |
| 14.2 Second‐generation SU | 2 | 707 | Risk Ratio (M‐H, Random, 95% CI) | 0.0 [0.0, 0.0] |
| 14.3 Third‐generation SU | 0 | 0 | Risk Ratio (M‐H, Random, 95% CI) | 0.0 [0.0, 0.0] |
| 15 Change in fasting blood glucose from baseline (mmol/L) Show forest plot | 18 | 6731 | Mean Difference (IV, Random, 95% CI) | 0.53 [0.31, 0.75] |
| 15.1 First‐generation SU | 0 | 0 | Mean Difference (IV, Random, 95% CI) | 0.0 [0.0, 0.0] |
| 15.2 Second‐generation SU | 14 | 6076 | Mean Difference (IV, Random, 95% CI) | 0.56 [0.33, 0.79] |
| 15.3 Third‐generation SU | 4 | 655 | Mean Difference (IV, Random, 95% CI) | 0.46 [‐0.22, 1.13] |
| 16 Change in HbA1c from baseline (%) Show forest plot | 21 | 7435 | Mean Difference (IV, Random, 95% CI) | 0.03 [‐0.10, 0.16] |
| 16.1 First‐generation SU | 0 | 0 | Mean Difference (IV, Random, 95% CI) | 0.0 [0.0, 0.0] |
| 16.2 Second‐generation SU | 17 | 6776 | Mean Difference (IV, Random, 95% CI) | 0.06 [‐0.09, 0.20] |
| 16.3 Third‐generation SU | 4 | 659 | Mean Difference (IV, Random, 95% CI) | ‐0.09 [‐0.31, 0.14] |
| 17 Change in BMI from baseline (kg/m2) Show forest plot | 7 | 532 | Mean Difference (IV, Random, 95% CI) | ‐0.98 [‐1.18, ‐0.79] |
| 17.1 First‐generation SU | 0 | 0 | Mean Difference (IV, Random, 95% CI) | 0.0 [0.0, 0.0] |
| 17.2 Second‐generation SU | 4 | 121 | Mean Difference (IV, Random, 95% CI) | 1.00 [‐1.20, ‐0.80] |
| 17.3 Third‐generation SU | 3 | 411 | Mean Difference (IV, Random, 95% CI) | ‐0.75 [‐1.58, 0.08] |
| 18 Change in weight from baseline (kg) Show forest plot | 11 | 5948 | Mean Difference (IV, Random, 95% CI) | ‐1.86 [‐2.50, ‐1.21] |
| 18.1 First‐generation SU | 0 | 0 | Mean Difference (IV, Random, 95% CI) | 0.0 [0.0, 0.0] |
| 18.2 Second‐generation SU | 10 | 5779 | Mean Difference (IV, Random, 95% CI) | ‐1.90 [‐2.56, ‐1.25] |
| 18.3 Third‐generation SU | 1 | 169 | Mean Difference (IV, Random, 95% CI) | 0.20 [‐3.75, 4.15] |
| 19 Adverse events Show forest plot | 13 | 7001 | Risk Ratio (M‐H, Random, 95% CI) | 0.98 [0.94, 1.01] |
| 19.1 First‐generation SU | 0 | 0 | Risk Ratio (M‐H, Random, 95% CI) | 0.0 [0.0, 0.0] |
| 19.2 Second‐generation SU | 10 | 6491 | Risk Ratio (M‐H, Random, 95% CI) | 0.99 [0.97, 1.01] |
| 19.3 Third‐generation SU | 3 | 510 | Risk Ratio (M‐H, Random, 95% CI) | 0.88 [0.78, 0.99] |
| 20 Serious adverse events Show forest plot | 11 | 5605 | Risk Ratio (M‐H, Random, 95% CI) | 0.90 [0.80, 1.01] |
| 20.1 First‐generation SU | 0 | 0 | Risk Ratio (M‐H, Random, 95% CI) | 0.0 [0.0, 0.0] |
| 20.2 Second‐generation SU | 8 | 4979 | Risk Ratio (M‐H, Random, 95% CI) | 0.90 [0.80, 1.01] |
| 20.3 Third‐generation SU | 3 | 626 | Risk Ratio (M‐H, Random, 95% CI) | 0.61 [0.21, 1.83] |
| 21 Drop‐outs due to adverse events Show forest plot | 17 | 7856 | Risk Ratio (M‐H, Random, 95% CI) | 1.16 [1.00, 1.34] |
| 21.1 First‐generation SU | 0 | 0 | Risk Ratio (M‐H, Random, 95% CI) | 0.0 [0.0, 0.0] |
| 21.2 Second‐generation SU | 15 | 7433 | Risk Ratio (M‐H, Random, 95% CI) | 1.15 [0.98, 1.36] |
| 21.3 Third‐generation SU | 2 | 423 | Risk Ratio (M‐H, Random, 95% CI) | 0.54 [0.15, 1.97] |
| 22 Mild hypoglycaemia Show forest plot | 9 | 6556 | Risk Ratio (M‐H, Random, 95% CI) | 3.95 [3.08, 5.06] |
| 22.1 First‐generation SU | 0 | 0 | Risk Ratio (M‐H, Random, 95% CI) | 0.0 [0.0, 0.0] |
| 22.2 Second‐generation SU | 8 | 6365 | Risk Ratio (M‐H, Random, 95% CI) | 4.05 [3.28, 5.00] |
| 22.3 Third‐generation SU | 1 | 191 | Risk Ratio (M‐H, Random, 95% CI) | 1.41 [0.47, 4.30] |
| 23 Moderate hypoglycaemia Show forest plot | 1 | 35 | Risk Ratio (M‐H, Random, 95% CI) | 0.0 [0.0, 0.0] |
| 23.1 First‐generation SU | 0 | 0 | Risk Ratio (M‐H, Random, 95% CI) | 0.0 [0.0, 0.0] |
| 23.2 Second‐generation SU | 1 | 35 | Risk Ratio (M‐H, Random, 95% CI) | 0.0 [0.0, 0.0] |
| 23.3 Third‐generation SU | 0 | 0 | Risk Ratio (M‐H, Random, 95% CI) | 0.0 [0.0, 0.0] |
| 24 Severe hypoglycaemia Show forest plot | 8 | 6030 | Risk Ratio (M‐H, Random, 95% CI) | 6.11 [1.57, 23.79] |
| 24.1 First‐generation SU | 0 | 0 | Risk Ratio (M‐H, Random, 95% CI) | 0.0 [0.0, 0.0] |
| 24.2 Second‐generation SU | 6 | 5660 | Risk Ratio (M‐H, Random, 95% CI) | 6.11 [1.57, 23.79] |
| 24.3 Third‐generation SU | 2 | 370 | Risk Ratio (M‐H, Random, 95% CI) | 0.0 [0.0, 0.0] |
| 25 Cancer Show forest plot | 6 | 4912 | Risk Ratio (M‐H, Random, 95% CI) | 1.02 [0.72, 1.45] |
| 25.1 First‐generation SU | 0 | 0 | Risk Ratio (M‐H, Random, 95% CI) | 0.0 [0.0, 0.0] |
| 25.2 Second‐generation SU | 6 | 4912 | Risk Ratio (M‐H, Random, 95% CI) | 1.02 [0.72, 1.45] |
| 25.3 Third‐generation SU | 0 | 0 | Risk Ratio (M‐H, Random, 95% CI) | 0.0 [0.0, 0.0] |
| 26 Intervention failure Show forest plot | 10 | 6757 | Risk Ratio (M‐H, Random, 95% CI) | 0.97 [0.65, 1.45] |
| 26.1 First‐generation SU | 0 | 0 | Risk Ratio (M‐H, Random, 95% CI) | 0.0 [0.0, 0.0] |
| 26.2 Second‐generation SU | 8 | 6438 | Risk Ratio (M‐H, Random, 95% CI) | 1.10 [0.73, 1.65] |
| 26.3 Third‐generation SU | 2 | 319 | Risk Ratio (M‐H, Random, 95% CI) | 0.24 [0.08, 0.75] |
| Outcome or subgroup title | No. of studies | No. of participants | Statistical method | Effect size |
| 1 All‐cause mortality Show forest plot | 5 | 3586 | Risk Ratio (M‐H, Random, 95% CI) | 1.05 [0.92, 1.21] |
| 1.1 First‐generation SU | 2 | 1944 | Risk Ratio (M‐H, Random, 95% CI) | 1.18 [0.88, 1.59] |
| 1.2 Second‐generation SU | 4 | 1642 | Risk Ratio (M‐H, Random, 95% CI) | 0.96 [0.79, 1.18] |
| 1.3 Third‐generation SU | 0 | 0 | Risk Ratio (M‐H, Random, 95% CI) | 0.0 [0.0, 0.0] |
| 2 All‐cause mortality; best‐worst case scenario Show forest plot | 2 | 80 | Risk Ratio (M‐H, Random, 95% CI) | 0.13 [0.02, 0.95] |
| 2.1 First‐generation SU | 0 | 0 | Risk Ratio (M‐H, Random, 95% CI) | 0.0 [0.0, 0.0] |
| 2.2 Second‐generation SU | 2 | 80 | Risk Ratio (M‐H, Random, 95% CI) | 0.13 [0.02, 0.95] |
| 2.3 Third‐generation SU | 0 | 0 | Risk Ratio (M‐H, Random, 95% CI) | 0.0 [0.0, 0.0] |
| 3 All‐cause mortality; worst‐best case scenario Show forest plot | 2 | 80 | Risk Ratio (M‐H, Random, 95% CI) | 3.54 [0.83, 15.00] |
| 3.1 First‐generation SU | 0 | 0 | Risk Ratio (M‐H, Random, 95% CI) | 0.0 [0.0, 0.0] |
| 3.2 Second‐generation SU | 2 | 80 | Risk Ratio (M‐H, Random, 95% CI) | 3.54 [0.83, 15.00] |
| 3.3 Third‐generation SU | 0 | 0 | Risk Ratio (M‐H, Random, 95% CI) | 0.0 [0.0, 0.0] |
| 4 Cardiovascular mortality Show forest plot | 5 | 3586 | Risk Ratio (M‐H, Random, 95% CI) | 1.09 [0.82, 1.44] |
| 4.1 First‐generation SU | 2 | 1944 | Risk Ratio (M‐H, Random, 95% CI) | 1.36 [0.68, 2.71] |
| 4.2 Second‐generation SU | 4 | 1642 | Risk Ratio (M‐H, Random, 95% CI) | 0.96 [0.73, 1.28] |
| 4.3 Third‐generation SU | 0 | 0 | Risk Ratio (M‐H, Random, 95% CI) | 0.0 [0.0, 0.0] |
| 5 Non‐fatal myocardial infarction Show forest plot | 2 | 3470 | Risk Ratio (M‐H, Random, 95% CI) | 0.99 [0.79, 1.23] |
| 5.1 First‐generation SU | 2 | 1944 | Risk Ratio (M‐H, Random, 95% CI) | 1.08 [0.81, 1.45] |
| 5.2 Second‐generation SU | 1 | 1526 | Risk Ratio (M‐H, Random, 95% CI) | 0.86 [0.61, 1.22] |
| 5.3 Third‐generation SU | 0 | 0 | Risk Ratio (M‐H, Random, 95% CI) | 0.0 [0.0, 0.0] |
| 6 Non‐fatal stroke Show forest plot | 2 | 3470 | Risk Ratio (M‐H, Random, 95% CI) | 1.45 [1.02, 2.06] |
| 6.1 First‐generation SU | 2 | 1944 | Risk Ratio (M‐H, Random, 95% CI) | 1.23 [0.74, 2.05] |
| 6.2 Second‐generation SU | 1 | 1526 | Risk Ratio (M‐H, Random, 95% CI) | 1.68 [1.04, 2.71] |
| 6.3 Third‐generation SU | 0 | 0 | Risk Ratio (M‐H, Random, 95% CI) | 0.0 [0.0, 0.0] |
| 7 Amputation of lower extremity Show forest plot | 2 | 3470 | Risk Ratio (M‐H, Random, 95% CI) | 0.49 [0.24, 1.00] |
| 7.1 First‐generation SU | 2 | 1944 | Risk Ratio (M‐H, Random, 95% CI) | 0.49 [0.18, 1.34] |
| 7.2 Second‐generation SU | 1 | 1526 | Risk Ratio (M‐H, Random, 95% CI) | 0.49 [0.18, 1.35] |
| 7.3 Third‐generation SU | 0 | 0 | Risk Ratio (M‐H, Random, 95% CI) | 0.0 [0.0, 0.0] |
| 8 Microvascular outcomes Show forest plot | 1 | 3056 | Risk Ratio (M‐H, Random, 95% CI) | 1.12 [0.82, 1.53] |
| 8.1 First‐generation SU | 1 | 1530 | Risk Ratio (M‐H, Random, 95% CI) | 1.30 [0.95, 1.77] |
| 8.2 Second‐generation SU | 1 | 1526 | Risk Ratio (M‐H, Random, 95% CI) | 0.94 [0.67, 1.33] |
| 8.3 Third‐generation SU | 0 | 0 | Risk Ratio (M‐H, Random, 95% CI) | 0.0 [0.0, 0.0] |
| 9 Nephropathy Show forest plot | 1 | 414 | Risk Ratio (M‐H, Random, 95% CI) | 11.32 [0.63, 203.45] |
| 9.1 First‐generation SU | 1 | 414 | Risk Ratio (M‐H, Random, 95% CI) | 11.32 [0.63, 203.45] |
| 9.2 Second‐generation SU | 0 | 0 | Risk Ratio (M‐H, Random, 95% CI) | 0.0 [0.0, 0.0] |
| 9.3 Third‐generation SU | 0 | 0 | Risk Ratio (M‐H, Random, 95% CI) | 0.0 [0.0, 0.0] |
| 10 Retinopathy Show forest plot | 1 | 414 | Risk Ratio (M‐H, Random, 95% CI) | 0.99 [0.71, 1.39] |
| 10.1 First‐generation SU | 1 | 414 | Risk Ratio (M‐H, Random, 95% CI) | 0.99 [0.71, 1.39] |
| 10.2 Second‐generation SU | 0 | 0 | Risk Ratio (M‐H, Random, 95% CI) | 0.0 [0.0, 0.0] |
| 10.3 Third‐generation SU | 0 | 0 | Risk Ratio (M‐H, Random, 95% CI) | 0.0 [0.0, 0.0] |
| 11 Retinal photocoagulation Show forest plot | 1 | 3056 | Risk Ratio (M‐H, Random, 95% CI) | 1.03 [0.80, 1.31] |
| 11.1 First‐generation SU | 1 | 1530 | Risk Ratio (M‐H, Random, 95% CI) | 1.12 [0.80, 1.57] |
| 11.2 Second‐generation SU | 1 | 1526 | Risk Ratio (M‐H, Random, 95% CI) | 0.93 [0.65, 1.32] |
| 11.3 Third‐generation SU | 0 | 0 | Risk Ratio (M‐H, Random, 95% CI) | 0.0 [0.0, 0.0] |
| 12 Change in fasting blood glucose from baseline (mmol/L) Show forest plot | 5 | 2423 | Mean Difference (IV, Random, 95% CI) | 0.12 [‐0.37, 0.61] |
| 12.1 First‐generation SU | 1 | 1122 | Mean Difference (IV, Random, 95% CI) | ‐0.40 [‐0.69, ‐0.11] |
| 12.2 Second‐generation SU | 5 | 1301 | Mean Difference (IV, Random, 95% CI) | 0.29 [‐0.02, 0.61] |
| 12.3 Third‐generation SU | 0 | 0 | Mean Difference (IV, Random, 95% CI) | 0.0 [0.0, 0.0] |
| 13 Change in HbA1c from baseline (%) Show forest plot | 6 | 2566 | Mean Difference (IV, Random, 95% CI) | ‐0.09 [‐0.20, 0.03] |
| 13.1 First‐generation SU | 1 | 1122 | Mean Difference (IV, Random, 95% CI) | ‐0.20 [‐0.38, ‐0.02] |
| 13.2 Second‐generation SU | 6 | 1444 | Mean Difference (IV, Random, 95% CI) | ‐0.03 [‐0.17, 0.10] |
| 13.3 Third‐generation SU | 0 | 0 | Mean Difference (IV, Random, 95% CI) | 0.0 [0.0, 0.0] |
| 14 Change in BMI from baseline (kg/m2) Show forest plot | 1 | 34 | Mean Difference (IV, Random, 95% CI) | ‐1.70 [‐4.10, 0.70] |
| 14.1 First‐generation SU | 0 | 0 | Mean Difference (IV, Random, 95% CI) | 0.0 [0.0, 0.0] |
| 14.2 Second‐generation SU | 1 | 34 | Mean Difference (IV, Random, 95% CI) | ‐1.70 [‐4.10, 0.70] |
| 14.3 Third‐generation SU | 0 | 0 | Mean Difference (IV, Random, 95% CI) | 0.0 [0.0, 0.0] |
| 15 Change in weight from baseline (kg) Show forest plot | 5 | 2514 | Mean Difference (IV, Random, 95% CI) | 1.00 [‐2.82, 0.83] |
| 15.1 First‐generation SU | 1 | 1122 | Mean Difference (IV, Random, 95% CI) | ‐2.30 [‐4.11, ‐0.49] |
| 15.2 Second‐generation SU | 5 | 1392 | Mean Difference (IV, Random, 95% CI) | ‐0.37 [‐2.39, 1.65] |
| 15.3 Third‐generation SU | 0 | 0 | Mean Difference (IV, Random, 95% CI) | 0.0 [0.0, 0.0] |
| 16 Adverse events Show forest plot | 1 | 143 | Risk Ratio (M‐H, Random, 95% CI) | 1.06 [0.68, 1.65] |
| 16.1 First‐generation SU | 0 | 0 | Risk Ratio (M‐H, Random, 95% CI) | 0.0 [0.0, 0.0] |
| 16.2 Second‐generation SU | 1 | 143 | Risk Ratio (M‐H, Random, 95% CI) | 1.06 [0.68, 1.65] |
| 16.3 Third‐generation SU | 0 | 0 | Risk Ratio (M‐H, Random, 95% CI) | 0.0 [0.0, 0.0] |
| 17 Drop‐outs due to adverse events Show forest plot | 2 | 192 | Risk Ratio (M‐H, Random, 95% CI) | 3.54 [0.43, 29.43] |
| 17.1 First‐generation SU | 0 | 0 | Risk Ratio (M‐H, Random, 95% CI) | 0.0 [0.0, 0.0] |
| 17.2 Second‐generation SU | 2 | 192 | Risk Ratio (M‐H, Random, 95% CI) | 3.54 [0.43, 29.43] |
| 17.3 Third‐generation SU | 0 | 0 | Risk Ratio (M‐H, Random, 95% CI) | 0.0 [0.0, 0.0] |
| 18 Mild hypoglycaemia Show forest plot | 2 | 3105 | Risk Ratio (M‐H, Random, 95% CI) | 0.94 [0.45, 1.95] |
| 18.1 First‐generation SU | 1 | 1530 | Risk Ratio (M‐H, Random, 95% CI) | 0.57 [0.42, 0.78] |
| 18.2 Second‐generation SU | 2 | 1575 | Risk Ratio (M‐H, Random, 95% CI) | 1.41 [1.13, 1.76] |
| 18.3 Third‐generation SU | 0 | 0 | Risk Ratio (M‐H, Random, 95% CI) | 0.0 [0.0, 0.0] |
| 19 Severe hypoglycaemia Show forest plot | 4 | 3172 | Risk Ratio (M‐H, Random, 95% CI) | 1.27 [0.38, 4.24] |
| 19.1 First‐generation SU | 1 | 1530 | Risk Ratio (M‐H, Random, 95% CI) | 0.59 [0.11, 3.02] |
| 19.2 Second‐generation SU | 4 | 1642 | Risk Ratio (M‐H, Random, 95% CI) | 2.07 [0.66, 6.50] |
| 19.3 Third‐generation SU | 0 | 0 | Risk Ratio (M‐H, Random, 95% CI) | 0.0 [0.0, 0.0] |
| 20 Cancer Show forest plot | 3 | 3519 | Risk Ratio (M‐H, Random, 95% CI) | 1.01 [0.75, 1.36] |
| 20.1 First‐generation SU | 2 | 1944 | Risk Ratio (M‐H, Random, 95% CI) | 0.81 [0.29, 2.27] |
| 20.2 Second‐generation SU | 2 | 1575 | Risk Ratio (M‐H, Random, 95% CI) | 0.95 [0.61, 1.49] |
| 20.3 Third‐generation SU | 0 | 0 | Risk Ratio (M‐H, Random, 95% CI) | 0.0 [0.0, 0.0] |
| 21 Intervention failure Show forest plot | 4 | 3200 | Risk Ratio (M‐H, Random, 95% CI) | 1.24 [0.67, 2.27] |
| 21.1 First‐generation SU | 1 | 1530 | Risk Ratio (M‐H, Random, 95% CI) | 0.62 [0.44, 0.89] |
| 21.2 Second‐generation SU | 4 | 1670 | Risk Ratio (M‐H, Random, 95% CI) | 1.96 [0.80, 4.76] |
| 21.3 Third‐generation SU | 0 | 0 | Risk Ratio (M‐H, Random, 95% CI) | 0.0 [0.0, 0.0] |
| Outcome or subgroup title | No. of studies | No. of participants | Statistical method | Effect size |
| 1 All‐cause mortality Show forest plot | 6 | 714 | Risk Ratio (M‐H, Random, 95% CI) | 2.25 [0.43, 11.84] |
| 1.1 First‐generation SU | 2 | 246 | Risk Ratio (M‐H, Random, 95% CI) | 3.16 [0.13, 76.44] |
| 1.2 Second‐generation SU | 4 | 468 | Risk Ratio (M‐H, Random, 95% CI) | 1.98 [0.28, 13.86] |
| 1.3 Third‐generation SU | 0 | 0 | Risk Ratio (M‐H, Random, 95% CI) | 0.0 [0.0, 0.0] |
| 2 All‐cause mortality; best‐worst case scenario Show forest plot | 2 | 90 | Risk Ratio (M‐H, Random, 95% CI) | 0.0 [0.0, 0.0] |
| 2.1 First‐generation SU | 0 | 0 | Risk Ratio (M‐H, Random, 95% CI) | 0.0 [0.0, 0.0] |
| 2.2 Second‐generation SU | 2 | 90 | Risk Ratio (M‐H, Random, 95% CI) | 0.0 [0.0, 0.0] |
| 2.3 Third‐generation SU | 0 | 0 | Risk Ratio (M‐H, Random, 95% CI) | 0.0 [0.0, 0.0] |
| 3 All‐cause mortality; worst‐best case scenario Show forest plot | 2 | 90 | Risk Ratio (M‐H, Random, 95% CI) | 0.0 [0.0, 0.0] |
| 3.1 First‐generation SU | 0 | 0 | Risk Ratio (M‐H, Random, 95% CI) | 0.0 [0.0, 0.0] |
| 3.2 Second‐generation SU | 2 | 90 | Risk Ratio (M‐H, Random, 95% CI) | 0.0 [0.0, 0.0] |
| 3.3 Third‐generation SU | 0 | 0 | Risk Ratio (M‐H, Random, 95% CI) | 0.0 [0.0, 0.0] |
| 4 Cardiovascular mortality Show forest plot | 6 | 708 | Risk Ratio (M‐H, Random, 95% CI) | 2.39 [0.30, 19.28] |
| 4.1 First‐generation SU | 2 | 242 | Risk Ratio (M‐H, Random, 95% CI) | 3.0 [0.12, 72.44] |
| 4.2 Second‐generation SU | 4 | 466 | Risk Ratio (M‐H, Random, 95% CI) | 2.02 [0.13, 31.96] |
| 4.3 Third‐generation SU | 0 | 0 | Risk Ratio (M‐H, Random, 95% CI) | 0.0 [0.0, 0.0] |
| 5 Non‐fatal macrovascular outcomes Show forest plot | 2 | 345 | Risk Ratio (M‐H, Random, 95% CI) | 1.61 [1.06, 2.44] |
| 5.1 First‐generation SU | 0 | 0 | Risk Ratio (M‐H, Random, 95% CI) | 0.0 [0.0, 0.0] |
| 5.2 Second‐generation SU | 2 | 345 | Risk Ratio (M‐H, Random, 95% CI) | 1.61 [1.06, 2.44] |
| 5.3 Third‐generation SU | 0 | 0 | Risk Ratio (M‐H, Random, 95% CI) | 0.0 [0.0, 0.0] |
| 6 Non‐fatal myocardial infarction Show forest plot | 2 | 133 | Risk Ratio (M‐H, Random, 95% CI) | 0.96 [0.06, 14.92] |
| 6.1 First‐generation SU | 1 | 98 | Risk Ratio (M‐H, Random, 95% CI) | 0.96 [0.06, 14.92] |
| 6.2 Second‐generation SU | 1 | 35 | Risk Ratio (M‐H, Random, 95% CI) | 0.0 [0.0, 0.0] |
| 6.3 Third‐generation SU | 0 | 0 | Risk Ratio (M‐H, Random, 95% CI) | 0.0 [0.0, 0.0] |
| 7 Non‐fatal stroke Show forest plot | 1 | 35 | Risk Ratio (M‐H, Random, 95% CI) | 0.0 [0.0, 0.0] |
| 7.1 First‐generation SU | 0 | 0 | Risk Ratio (M‐H, Random, 95% CI) | 0.0 [0.0, 0.0] |
| 7.2 Second‐generation SU | 1 | 35 | Risk Ratio (M‐H, Random, 95% CI) | 0.0 [0.0, 0.0] |
| 7.3 Third‐generation SU | 0 | 0 | Risk Ratio (M‐H, Random, 95% CI) | 0.0 [0.0, 0.0] |
| 8 Amputation of lower extremity Show forest plot | 1 | 35 | Risk Ratio (M‐H, Random, 95% CI) | 0.0 [0.0, 0.0] |
| 8.1 First‐generation SU | 0 | 0 | Risk Ratio (M‐H, Random, 95% CI) | 0.0 [0.0, 0.0] |
| 8.2 Second‐generation SU | 1 | 35 | Risk Ratio (M‐H, Random, 95% CI) | 0.0 [0.0, 0.0] |
| 8.3 Third‐generation SU | 0 | 0 | Risk Ratio (M‐H, Random, 95% CI) | 0.0 [0.0, 0.0] |
| 9 Cardial revascularisation Show forest plot | 1 | 35 | Risk Ratio (M‐H, Random, 95% CI) | 0.0 [0.0, 0.0] |
| 9.1 First‐generation SU | 0 | 0 | Risk Ratio (M‐H, Random, 95% CI) | 0.0 [0.0, 0.0] |
| 9.2 Second‐generation SU | 1 | 35 | Risk Ratio (M‐H, Random, 95% CI) | 0.0 [0.0, 0.0] |
| 9.3 Third‐generation SU | 0 | 0 | Risk Ratio (M‐H, Random, 95% CI) | 0.0 [0.0, 0.0] |
| 10 Peripheral revascularisation Show forest plot | 1 | 35 | Risk Ratio (M‐H, Random, 95% CI) | 0.0 [0.0, 0.0] |
| 10.1 First‐generation SU | 0 | 0 | Risk Ratio (M‐H, Random, 95% CI) | 0.0 [0.0, 0.0] |
| 10.2 Second‐generation SU | 1 | 35 | Risk Ratio (M‐H, Random, 95% CI) | 0.0 [0.0, 0.0] |
| 10.3 Third‐generation SU | 0 | 0 | Risk Ratio (M‐H, Random, 95% CI) | 0.0 [0.0, 0.0] |
| 11 Microvascular outcomes Show forest plot | 1 | 35 | Risk Ratio (M‐H, Random, 95% CI) | 0.0 [0.0, 0.0] |
| 11.1 First‐generation SU | 0 | 0 | Risk Ratio (M‐H, Random, 95% CI) | 0.0 [0.0, 0.0] |
| 11.2 Second‐generation SU | 1 | 35 | Risk Ratio (M‐H, Random, 95% CI) | 0.0 [0.0, 0.0] |
| 11.3 Third‐generation SU | 0 | 0 | Risk Ratio (M‐H, Random, 95% CI) | 0.0 [0.0, 0.0] |
| 12 Nephropathy Show forest plot | 1 | 35 | Risk Ratio (M‐H, Random, 95% CI) | 0.0 [0.0, 0.0] |
| 12.1 First‐generation SU | 0 | 0 | Risk Ratio (M‐H, Random, 95% CI) | 0.0 [0.0, 0.0] |
| 12.2 Second‐generation SU | 1 | 35 | Risk Ratio (M‐H, Random, 95% CI) | 0.0 [0.0, 0.0] |
| 12.3 Third‐generation SU | 0 | 0 | Risk Ratio (M‐H, Random, 95% CI) | 0.0 [0.0, 0.0] |
| 13 Retinopathy Show forest plot | 1 | 35 | Risk Ratio (M‐H, Random, 95% CI) | 0.0 [0.0, 0.0] |
| 13.1 First‐generation SU | 0 | 0 | Risk Ratio (M‐H, Random, 95% CI) | 0.0 [0.0, 0.0] |
| 13.2 Second‐generation SU | 1 | 35 | Risk Ratio (M‐H, Random, 95% CI) | 0.0 [0.0, 0.0] |
| 13.3 Third‐generation SU | 0 | 0 | Risk Ratio (M‐H, Random, 95% CI) | 0.0 [0.0, 0.0] |
| 14 Retinal photocoagulation Show forest plot | 1 | 35 | Risk Ratio (M‐H, Random, 95% CI) | 0.0 [0.0, 0.0] |
| 14.1 First‐generation SU | 0 | 0 | Risk Ratio (M‐H, Random, 95% CI) | 0.0 [0.0, 0.0] |
| 14.2 Second‐generation SU | 1 | 35 | Risk Ratio (M‐H, Random, 95% CI) | 0.0 [0.0, 0.0] |
| 14.3 Third‐generation SU | 0 | 0 | Risk Ratio (M‐H, Random, 95% CI) | 0.0 [0.0, 0.0] |
| 15 Change in fasting blood glucose from baseline (mmol/L) Show forest plot | 11 | 915 | Mean Difference (IV, Random, 95% CI) | ‐0.46 [‐0.80, ‐0.11] |
| 15.1 First‐generation SU | 2 | 208 | Mean Difference (IV, Random, 95% CI) | ‐1.16 [‐1.92, ‐0.41] |
| 15.2 Second‐generation SU | 8 | 488 | Mean Difference (IV, Random, 95% CI) | ‐0.16 [‐0.42, 0.11] |
| 15.3 Third‐generation SU | 1 | 219 | Mean Difference (IV, Random, 95% CI) | ‐1.20 [‐1.92, ‐0.48] |
| 16 Change in HbA1c from baseline (%) Show forest plot | 13 | 968 | Mean Difference (IV, Random, 95% CI) | ‐0.20 [‐0.46, 0.06] |
| 16.1 First‐generation SU | 2 | 208 | Mean Difference (IV, Random, 95% CI) | ‐0.50 [‐0.79, ‐0.20] |
| 16.2 Second‐generation SU | 10 | 541 | Mean Difference (IV, Random, 95% CI) | ‐0.06 [‐0.36, 0.24] |
| 16.3 Third‐generation SU | 1 | 219 | Mean Difference (IV, Random, 95% CI) | ‐0.7 [‐1.28, ‐0.12] |
| 17 Change in BMI from baseline (kg/m2) Show forest plot | 5 | 232 | Mean Difference (IV, Random, 95% CI) | ‐0.02 [‐0.20, 0.16] |
| 17.1 First‐generation SU | 0 | 0 | Mean Difference (IV, Random, 95% CI) | 0.0 [0.0, 0.0] |
| 17.2 Second‐generation SU | 5 | 232 | Mean Difference (IV, Random, 95% CI) | ‐0.02 [‐0.20, 0.16] |
| 17.3 Third‐generation SU | 0 | 0 | Mean Difference (IV, Random, 95% CI) | 0.0 [0.0, 0.0] |
| 18 Change in weight from baseline (kg) Show forest plot | 7 | 689 | Mean Difference (IV, Random, 95% CI) | 0.81 [‐0.61, 2.23] |
| 18.1 First‐generation SU | 1 | 132 | Mean Difference (IV, Random, 95% CI) | 3.2 [2.29, 4.11] |
| 18.2 Second‐generation SU | 5 | 338 | Mean Difference (IV, Random, 95% CI) | ‐0.22 [‐0.47, 0.03] |
| 18.3 Third‐generation SU | 1 | 219 | Mean Difference (IV, Random, 95% CI) | 1.5 [0.28, 2.72] |
| 19 Adverse events Show forest plot | 11 | 1111 | Risk Ratio (M‐H, Random, 95% CI) | 0.65 [0.51, 0.82] |
| 19.1 First‐generation SU | 2 | 246 | Risk Ratio (M‐H, Random, 95% CI) | 0.63 [0.52, 0.76] |
| 19.2 Second‐generation SU | 8 | 646 | Risk Ratio (M‐H, Random, 95% CI) | 0.64 [0.39, 1.03] |
| 19.3 Third‐generation SU | 1 | 219 | Risk Ratio (M‐H, Random, 95% CI) | 0.64 [0.53, 0.78] |
| 20 Serious adverse events Show forest plot | 3 | 229 | Risk Ratio (M‐H, Random, 95% CI) | 0.52 [0.09, 3.03] |
| 20.1 First‐generation SU | 1 | 98 | Risk Ratio (M‐H, Random, 95% CI) | 0.96 [0.14, 6.55] |
| 20.2 Second‐generation SU | 2 | 131 | Risk Ratio (M‐H, Random, 95% CI) | 0.15 [0.01, 2.81] |
| 20.3 Third‐generation SU | 0 | 0 | Risk Ratio (M‐H, Random, 95% CI) | 0.0 [0.0, 0.0] |
| 21 Drop‐outs due to adverse events Show forest plot | 12 | 1335 | Risk Ratio (M‐H, Random, 95% CI) | 0.37 [0.22, 0.63] |
| 21.1 First‐generation SU | 2 | 246 | Risk Ratio (M‐H, Random, 95% CI) | 0.28 [0.12, 0.67] |
| 21.2 Second‐generation SU | 9 | 870 | Risk Ratio (M‐H, Random, 95% CI) | 0.48 [0.24, 0.96] |
| 21.3 Third‐generation SU | 1 | 219 | Risk Ratio (M‐H, Random, 95% CI) | 0.19 [0.02, 1.64] |
| 22 Mild hypoglycaemia Show forest plot | 6 | 636 | Risk Ratio (M‐H, Random, 95% CI) | 8.59 [2.62, 28.12] |
| 22.1 First‐generation SU | 1 | 98 | Risk Ratio (M‐H, Random, 95% CI) | 2.88 [0.12, 69.07] |
| 22.2 Second‐generation SU | 4 | 319 | Risk Ratio (M‐H, Random, 95% CI) | 12.63 [0.73, 219.86] |
| 22.3 Third‐generation SU | 1 | 219 | Risk Ratio (M‐H, Random, 95% CI) | 9.73 [2.33, 40.63] |
| 23 Moderate hypoglycaemia Show forest plot | 3 | 183 | Risk Ratio (M‐H, Random, 95% CI) | 0.0 [0.0, 0.0] |
| 23.1 First‐generation SU | 0 | 0 | Risk Ratio (M‐H, Random, 95% CI) | 0.0 [0.0, 0.0] |
| 23.2 Second‐generation SU | 3 | 183 | Risk Ratio (M‐H, Random, 95% CI) | 0.0 [0.0, 0.0] |
| 23.3 Third‐generation SU | 0 | 0 | Risk Ratio (M‐H, Random, 95% CI) | 0.0 [0.0, 0.0] |
| 24 Severe hypoglycaemia Show forest plot | 5 | 500 | Risk Ratio (M‐H, Random, 95% CI) | 0.0 [0.0, 0.0] |
| 24.1 First‐generation SU | 1 | 98 | Risk Ratio (M‐H, Random, 95% CI) | 0.0 [0.0, 0.0] |
| 24.2 Second‐generation SU | 3 | 183 | Risk Ratio (M‐H, Random, 95% CI) | 0.0 [0.0, 0.0] |
| 24.3 Third‐generation SU | 1 | 219 | Risk Ratio (M‐H, Random, 95% CI) | 0.0 [0.0, 0.0] |
| 25 Cancer Show forest plot | 3 | 443 | Risk Ratio (M‐H, Random, 95% CI) | 0.90 [0.11, 7.27] |
| 25.1 First‐generation SU | 1 | 98 | Risk Ratio (M‐H, Random, 95% CI) | 0.32 [0.01, 7.67] |
| 25.2 Second‐generation SU | 2 | 345 | Risk Ratio (M‐H, Random, 95% CI) | 1.98 [0.13, 31.35] |
| 25.3 Third‐generation SU | 0 | 0 | Risk Ratio (M‐H, Random, 95% CI) | 0.0 [0.0, 0.0] |
| 26 Intervention failure Show forest plot | 5 | 831 | Risk Ratio (M‐H, Random, 95% CI) | 0.32 [0.18, 0.57] |
| 26.1 First‐generation SU | 1 | 98 | Risk Ratio (M‐H, Random, 95% CI) | 0.32 [0.01, 7.67] |
| 26.2 Second‐generation SU | 3 | 514 | Risk Ratio (M‐H, Random, 95% CI) | 0.25 [0.07, 0.92] |
| 26.3 Third‐generation SU | 1 | 219 | Risk Ratio (M‐H, Random, 95% CI) | 0.34 [0.17, 0.65] |
| Outcome or subgroup title | No. of studies | No. of participants | Statistical method | Effect size |
| 1 All‐cause mortality Show forest plot | 3 | 2249 | Risk Ratio (M‐H, Random, 95% CI) | 1.57 [0.62, 4.00] |
| 1.1 First‐generation SU | 0 | 0 | Risk Ratio (M‐H, Random, 95% CI) | 0.0 [0.0, 0.0] |
| 1.2 Second‐generation SU | 2 | 1503 | Risk Ratio (M‐H, Random, 95% CI) | 1.39 [0.52, 3.68] |
| 1.3 Third‐generation SU | 1 | 746 | Risk Ratio (M‐H, Random, 95% CI) | 6.01 [0.25, 147.05] |
| 2 All‐cause mortality; best‐worst case scenario Show forest plot | 1 | 1092 | Risk Ratio (M‐H, Random, 95% CI) | 0.39 [0.18, 0.84] |
| 2.1 First‐generation SU | 0 | 0 | Risk Ratio (M‐H, Random, 95% CI) | 0.0 [0.0, 0.0] |
| 2.2 Second‐generation SU | 1 | 1092 | Risk Ratio (M‐H, Random, 95% CI) | 0.39 [0.18, 0.84] |
| 2.3 Third‐generation SU | 0 | 0 | Risk Ratio (M‐H, Random, 95% CI) | 0.0 [0.0, 0.0] |
| 3 All‐cause mortality; worst‐best case scenario Show forest plot | 1 | 1092 | Risk Ratio (M‐H, Random, 95% CI) | 3.67 [1.50, 8.97] |
| 3.1 First‐generation SU | 0 | 0 | Risk Ratio (M‐H, Random, 95% CI) | 0.0 [0.0, 0.0] |
| 3.2 Second‐generation SU | 1 | 1092 | Risk Ratio (M‐H, Random, 95% CI) | 3.67 [1.50, 8.97] |
| 3.3 Third‐generation SU | 0 | 0 | Risk Ratio (M‐H, Random, 95% CI) | 0.0 [0.0, 0.0] |
| 4 Cardiovascular mortality Show forest plot | 2 | 1157 | Risk Ratio (M‐H, Random, 95% CI) | 6.01 [0.25, 147.05] |
| 4.1 First‐generation SU | 0 | 0 | Risk Ratio (M‐H, Random, 95% CI) | 0.0 [0.0, 0.0] |
| 4.2 Second‐generation SU | 1 | 411 | Risk Ratio (M‐H, Random, 95% CI) | 0.0 [0.0, 0.0] |
| 4.3 Third‐generation SU | 1 | 746 | Risk Ratio (M‐H, Random, 95% CI) | 6.01 [0.25, 147.05] |
| 5 Non‐fatal macrovascular outcomes Show forest plot | 1 | 411 | Risk Ratio (M‐H, Random, 95% CI) | 1.61 [0.82, 3.17] |
| 5.1 First‐generation SU | 0 | 0 | Risk Ratio (M‐H, Random, 95% CI) | 0.0 [0.0, 0.0] |
| 5.2 Second‐generation SU | 1 | 411 | Risk Ratio (M‐H, Random, 95% CI) | 1.61 [0.82, 3.17] |
| 5.3 Third‐generation SU | 0 | 0 | Risk Ratio (M‐H, Random, 95% CI) | 0.0 [0.0, 0.0] |
| 6 Non‐fatal myocardial infarction Show forest plot | 2 | 1157 | Risk Ratio (M‐H, Random, 95% CI) | 0.66 [0.10, 4.19] |
| 6.1 First‐generation SU | 0 | 0 | Risk Ratio (M‐H, Random, 95% CI) | 0.0 [0.0, 0.0] |
| 6.2 Second‐generation SU | 1 | 411 | Risk Ratio (M‐H, Random, 95% CI) | 0.65 [0.03, 15.85] |
| 6.3 Third‐generation SU | 1 | 746 | Risk Ratio (M‐H, Random, 95% CI) | 0.67 [0.07, 6.40] |
| 7 Non‐fatal stroke Show forest plot | 1 | 411 | Risk Ratio (M‐H, Random, 95% CI) | 3.91 [0.36, 42.79] |
| 7.1 First‐generation SU | 0 | 0 | Risk Ratio (M‐H, Random, 95% CI) | 0.0 [0.0, 0.0] |
| 7.2 Second‐generation SU | 1 | 411 | Risk Ratio (M‐H, Random, 95% CI) | 3.91 [0.36, 42.79] |
| 7.3 Third‐generation SU | 0 | 0 | Risk Ratio (M‐H, Random, 95% CI) | 0.0 [0.0, 0.0] |
| 8 Amputation of lower extremity Show forest plot | 1 | 411 | Risk Ratio (M‐H, Random, 95% CI) | 0.0 [0.0, 0.0] |
| 8.1 First‐generation SU | 0 | 0 | Risk Ratio (M‐H, Random, 95% CI) | 0.0 [0.0, 0.0] |
| 8.2 Second‐generation SU | 1 | 411 | Risk Ratio (M‐H, Random, 95% CI) | 0.0 [0.0, 0.0] |
| 8.3 Third‐generation SU | 0 | 0 | Risk Ratio (M‐H, Random, 95% CI) | 0.0 [0.0, 0.0] |
| 9 Cardial revascularisation Show forest plot | 1 | 411 | Risk Ratio (M‐H, Random, 95% CI) | 0.0 [0.0, 0.0] |
| 9.1 First‐generation SU | 0 | 0 | Risk Ratio (M‐H, Random, 95% CI) | 0.0 [0.0, 0.0] |
| 9.2 Second‐generation SU | 1 | 411 | Risk Ratio (M‐H, Random, 95% CI) | 0.0 [0.0, 0.0] |
| 9.3 Third‐generation SU | 0 | 0 | Risk Ratio (M‐H, Random, 95% CI) | 0.0 [0.0, 0.0] |
| 10 Peripheral revascularisation Show forest plot | 1 | 411 | Risk Ratio (M‐H, Random, 95% CI) | 0.0 [0.0, 0.0] |
| 10.1 First‐generation SU | 0 | 0 | Risk Ratio (M‐H, Random, 95% CI) | 0.0 [0.0, 0.0] |
| 10.2 Second‐generation SU | 1 | 411 | Risk Ratio (M‐H, Random, 95% CI) | 0.0 [0.0, 0.0] |
| 10.3 Third‐generation SU | 0 | 0 | Risk Ratio (M‐H, Random, 95% CI) | 0.0 [0.0, 0.0] |
| 11 Microvascular outcomes Show forest plot | 1 | 411 | Risk Ratio (M‐H, Random, 95% CI) | 1.09 [0.52, 2.29] |
| 11.1 First‐generation SU | 0 | 0 | Risk Ratio (M‐H, Random, 95% CI) | 0.0 [0.0, 0.0] |
| 11.2 Second‐generation SU | 1 | 411 | Risk Ratio (M‐H, Random, 95% CI) | 1.09 [0.52, 2.29] |
| 11.3 Third‐generation SU | 0 | 0 | Risk Ratio (M‐H, Random, 95% CI) | 0.0 [0.0, 0.0] |
| 12 Nephropathy Show forest plot | 1 | 411 | Risk Ratio (M‐H, Random, 95% CI) | 0.98 [0.09, 10.70] |
| 12.1 First‐generation SU | 0 | 0 | Risk Ratio (M‐H, Random, 95% CI) | 0.0 [0.0, 0.0] |
| 12.2 Second‐generation SU | 1 | 411 | Risk Ratio (M‐H, Random, 95% CI) | 0.98 [0.09, 10.70] |
| 12.3 Third‐generation SU | 0 | 0 | Risk Ratio (M‐H, Random, 95% CI) | 0.0 [0.0, 0.0] |
| 13 Retinopathy Show forest plot | 1 | 411 | Risk Ratio (M‐H, Random, 95% CI) | 1.10 [0.50, 2.43] |
| 13.1 First‐generation SU | 0 | 0 | Risk Ratio (M‐H, Random, 95% CI) | 0.0 [0.0, 0.0] |
| 13.2 Second‐generation SU | 1 | 411 | Risk Ratio (M‐H, Random, 95% CI) | 1.10 [0.50, 2.43] |
| 13.3 Third‐generation SU | 0 | 0 | Risk Ratio (M‐H, Random, 95% CI) | 0.0 [0.0, 0.0] |
| 14 Retinal photocoagulation Show forest plot | 1 | 411 | Risk Ratio (M‐H, Random, 95% CI) | 0.0 [0.0, 0.0] |
| 14.1 First‐generation SU | 0 | 0 | Risk Ratio (M‐H, Random, 95% CI) | 0.0 [0.0, 0.0] |
| 14.2 Second‐generation SU | 1 | 411 | Risk Ratio (M‐H, Random, 95% CI) | 0.0 [0.0, 0.0] |
| 14.3 Third‐generation SU | 0 | 0 | Risk Ratio (M‐H, Random, 95% CI) | 0.0 [0.0, 0.0] |
| 15 Change in fasting blood glucose from baseline (mmol/L) Show forest plot | 3 | 1948 | Mean Difference (IV, Random, 95% CI) | 0.34 [‐0.44, 1.13] |
| 15.1 First‐generation SU | 0 | 0 | Mean Difference (IV, Random, 95% CI) | 0.0 [0.0, 0.0] |
| 15.2 Second‐generation SU | 2 | 1202 | Mean Difference (IV, Random, 95% CI) | 0.11 [‐1.07, 1.28] |
| 15.3 Third‐generation SU | 1 | 746 | Mean Difference (IV, Random, 95% CI) | 0.8 [0.34, 1.26] |
| 16 Change in HbA1c from baseline (%) Show forest plot | 3 | 1950 | Mean Difference (IV, Random, 95% CI) | 0.35 [0.05, 0.64] |
| 16.1 First‐generation SU | 0 | 0 | Mean Difference (IV, Random, 95% CI) | 0.0 [0.0, 0.0] |
| 16.2 Second‐generation SU | 2 | 1204 | Mean Difference (IV, Random, 95% CI) | 0.26 [‐0.23, 0.75] |
| 16.3 Third‐generation SU | 1 | 746 | Mean Difference (IV, Random, 95% CI) | 0.5 [0.32, 0.68] |
| 17 Change in BMI from baseline (kg/m2) Show forest plot | 1 | 400 | Mean Difference (IV, Random, 95% CI) | 0.7 [0.52, 0.88] |
| 17.1 First‐generation SU | 0 | 0 | Mean Difference (IV, Random, 95% CI) | 0.0 [0.0, 0.0] |
| 17.2 Second‐generation SU | 1 | 400 | Mean Difference (IV, Random, 95% CI) | 0.7 [0.52, 0.88] |
| 17.3 Third‐generation SU | 0 | 0 | Mean Difference (IV, Random, 95% CI) | 0.0 [0.0, 0.0] |
| 18 Change in weight from baseline (kg) Show forest plot | 3 | 1952 | Mean Difference (IV, Random, 95% CI) | 1.96 [0.63, 3.28] |
| 18.1 First‐generation SU | 0 | 0 | Mean Difference (IV, Random, 95% CI) | 0.0 [0.0, 0.0] |
| 18.2 Second‐generation SU | 2 | 1206 | Mean Difference (IV, Random, 95% CI) | 1.31 [0.33, 2.29] |
| 18.3 Third‐generation SU | 1 | 746 | Mean Difference (IV, Random, 95% CI) | 3.30 [2.64, 3.96] |
| 19 Adverse events Show forest plot | 2 | 1157 | Risk Ratio (M‐H, Random, 95% CI) | 0.89 [0.74, 1.08] |
| 19.1 First‐generation SU | 0 | 0 | Risk Ratio (M‐H, Random, 95% CI) | 0.0 [0.0, 0.0] |
| 19.2 Second‐generation SU | 1 | 411 | Risk Ratio (M‐H, Random, 95% CI) | 0.97 [0.90, 1.04] |
| 19.3 Third‐generation SU | 1 | 746 | Risk Ratio (M‐H, Random, 95% CI) | 0.82 [0.73, 0.92] |
| 20 Serious adverse events Show forest plot | 2 | 1157 | Risk Ratio (M‐H, Random, 95% CI) | 1.22 [0.77, 1.94] |
| 20.1 First‐generation SU | 0 | 0 | Risk Ratio (M‐H, Random, 95% CI) | 0.0 [0.0, 0.0] |
| 20.2 Second‐generation SU | 1 | 411 | Risk Ratio (M‐H, Random, 95% CI) | 1.37 [0.71, 2.63] |
| 20.3 Third‐generation SU | 1 | 746 | Risk Ratio (M‐H, Random, 95% CI) | 1.09 [0.56, 2.10] |
| 21 Drop‐outs due to adverse events Show forest plot | 3 | 2249 | Risk Ratio (M‐H, Random, 95% CI) | 0.89 [0.64, 1.24] |
| 21.1 First‐generation SU | 0 | 0 | Risk Ratio (M‐H, Random, 95% CI) | 0.0 [0.0, 0.0] |
| 21.2 Second‐generation SU | 2 | 1503 | Risk Ratio (M‐H, Random, 95% CI) | 1.00 [0.67, 1.50] |
| 21.3 Third‐generation SU | 1 | 746 | Risk Ratio (M‐H, Random, 95% CI) | 0.70 [0.40, 1.24] |
| 22 Mild hypoglycaemia Show forest plot | 3 | 2249 | Risk Ratio (M‐H, Random, 95% CI) | 2.07 [1.44, 2.97] |
| 22.1 First‐generation SU | 0 | 0 | Risk Ratio (M‐H, Random, 95% CI) | 0.0 [0.0, 0.0] |
| 22.2 Second‐generation SU | 2 | 1503 | Risk Ratio (M‐H, Random, 95% CI) | 1.99 [1.02, 3.87] |
| 22.3 Third‐generation SU | 1 | 746 | Risk Ratio (M‐H, Random, 95% CI) | 2.41 [1.71, 3.40] |
| 23 Severe hypoglycaemia Show forest plot | 3 | 2249 | Risk Ratio (M‐H, Random, 95% CI) | 0.0 [0.0, 0.0] |
| 23.1 First‐generation SU | 0 | 0 | Risk Ratio (M‐H, Random, 95% CI) | 0.0 [0.0, 0.0] |
| 23.2 Second‐generation SU | 2 | 1503 | Risk Ratio (M‐H, Random, 95% CI) | 0.0 [0.0, 0.0] |
| 23.3 Third‐generation SU | 1 | 746 | Risk Ratio (M‐H, Random, 95% CI) | 0.0 [0.0, 0.0] |
| 24 Intervention failure Show forest plot | 3 | 2249 | Risk Ratio (M‐H, Random, 95% CI) | 1.31 [0.56, 3.05] |
| 24.1 First‐generation SU | 0 | 0 | Risk Ratio (M‐H, Random, 95% CI) | 0.0 [0.0, 0.0] |
| 24.2 Second‐generation SU | 2 | 1503 | Risk Ratio (M‐H, Random, 95% CI) | 1.00 [0.41, 2.43] |
| 24.3 Third‐generation SU | 1 | 746 | Risk Ratio (M‐H, Random, 95% CI) | 2.09 [1.22, 3.59] |
| Outcome or subgroup title | No. of studies | No. of participants | Statistical method | Effect size |
| 1 All‐cause mortality Show forest plot | 7 | 2038 | Risk Ratio (M‐H, Random, 95% CI) | 1.44 [0.47, 4.42] |
| 1.1 First‐generation SU | 0 | 0 | Risk Ratio (M‐H, Random, 95% CI) | 0.0 [0.0, 0.0] |
| 1.2 Second‐generation SU | 7 | 2038 | Risk Ratio (M‐H, Random, 95% CI) | 1.44 [0.47, 4.42] |
| 1.3 Third‐generation SU | 0 | 0 | Risk Ratio (M‐H, Random, 95% CI) | 0.0 [0.0, 0.0] |
| 2 All‐cause mortality; best‐worst case scenario Show forest plot | 2 | 209 | Risk Ratio (M‐H, Random, 95% CI) | 0.07 [0.00, 1.16] |
| 2.1 First‐generation SU | 0 | 0 | Risk Ratio (M‐H, Random, 95% CI) | 0.0 [0.0, 0.0] |
| 2.2 Second‐generation SU | 2 | 209 | Risk Ratio (M‐H, Random, 95% CI) | 0.07 [0.00, 1.16] |
| 2.3 Third‐generation SU | 0 | 0 | Risk Ratio (M‐H, Random, 95% CI) | 0.0 [0.0, 0.0] |
| 3 All‐cause mortality; worst‐best case scenario Show forest plot | 2 | 209 | Risk Ratio (M‐H, Random, 95% CI) | 15.17 [0.88, 261.61] |
| 3.1 First‐generation SU | 0 | 0 | Risk Ratio (M‐H, Random, 95% CI) | 0.0 [0.0, 0.0] |
| 3.2 Second‐generation SU | 2 | 209 | Risk Ratio (M‐H, Random, 95% CI) | 15.17 [0.88, 261.61] |
| 3.3 Third‐generation SU | 0 | 0 | Risk Ratio (M‐H, Random, 95% CI) | 0.0 [0.0, 0.0] |
| 4 Cardiovascular mortality Show forest plot | 7 | 2038 | Risk Ratio (M‐H, Random, 95% CI) | 0.97 [0.27, 3.53] |
| 4.1 First‐generation SU | 0 | 0 | Risk Ratio (M‐H, Random, 95% CI) | 0.0 [0.0, 0.0] |
| 4.2 Second‐generation SU | 7 | 2038 | Risk Ratio (M‐H, Random, 95% CI) | 0.97 [0.27, 3.53] |
| 4.3 Third‐generation SU | 0 | 0 | Risk Ratio (M‐H, Random, 95% CI) | 0.0 [0.0, 0.0] |
| 5 Non‐fatal macrovascular outcomes Show forest plot | 3 | 866 | Risk Ratio (M‐H, Random, 95% CI) | 0.50 [0.20, 1.20] |
| 5.1 First‐generation SU | 0 | 0 | Risk Ratio (M‐H, Random, 95% CI) | 0.0 [0.0, 0.0] |
| 5.2 Second‐generation SU | 3 | 866 | Risk Ratio (M‐H, Random, 95% CI) | 0.50 [0.20, 1.20] |
| 5.3 Third‐generation SU | 0 | 0 | Risk Ratio (M‐H, Random, 95% CI) | 0.0 [0.0, 0.0] |
| 6 Non‐fatal myocardial infarction Show forest plot | 3 | 726 | Risk Ratio (M‐H, Random, 95% CI) | 1.03 [0.26, 4.08] |
| 6.1 First‐generation SU | 0 | 0 | Risk Ratio (M‐H, Random, 95% CI) | 0.0 [0.0, 0.0] |
| 6.2 Second‐generation SU | 3 | 726 | Risk Ratio (M‐H, Random, 95% CI) | 1.03 [0.26, 4.08] |
| 6.3 Third‐generation SU | 0 | 0 | Risk Ratio (M‐H, Random, 95% CI) | 0.0 [0.0, 0.0] |
| 7 Non‐fatal stroke Show forest plot | 1 | 34 | Risk Ratio (M‐H, Random, 95% CI) | 0.0 [0.0, 0.0] |
| 7.1 First‐generation SU | 0 | 0 | Risk Ratio (M‐H, Random, 95% CI) | 0.0 [0.0, 0.0] |
| 7.2 Second‐generation SU | 1 | 34 | Risk Ratio (M‐H, Random, 95% CI) | 0.0 [0.0, 0.0] |
| 7.3 Third‐generation SU | 0 | 0 | Risk Ratio (M‐H, Random, 95% CI) | 0.0 [0.0, 0.0] |
| 8 Amputation of lower extremity Show forest plot | 1 | 34 | Risk Ratio (M‐H, Random, 95% CI) | 0.0 [0.0, 0.0] |
| 8.1 First‐generation SU | 0 | 0 | Risk Ratio (M‐H, Random, 95% CI) | 0.0 [0.0, 0.0] |
| 8.2 Second‐generation SU | 1 | 34 | Risk Ratio (M‐H, Random, 95% CI) | 0.0 [0.0, 0.0] |
| 8.3 Third‐generation SU | 0 | 0 | Risk Ratio (M‐H, Random, 95% CI) | 0.0 [0.0, 0.0] |
| 9 Cardial revascularisation Show forest plot | 1 | 34 | Risk Ratio (M‐H, Random, 95% CI) | 0.0 [0.0, 0.0] |
| 9.1 First‐generation SU | 0 | 0 | Risk Ratio (M‐H, Random, 95% CI) | 0.0 [0.0, 0.0] |
| 9.2 Second‐generation SU | 1 | 34 | Risk Ratio (M‐H, Random, 95% CI) | 0.0 [0.0, 0.0] |
| 9.3 Third‐generation SU | 0 | 0 | Risk Ratio (M‐H, Random, 95% CI) | 0.0 [0.0, 0.0] |
| 10 Peripheral revascularisation Show forest plot | 1 | 34 | Risk Ratio (M‐H, Random, 95% CI) | 0.0 [0.0, 0.0] |
| 10.1 First‐generation SU | 0 | 0 | Risk Ratio (M‐H, Random, 95% CI) | 0.0 [0.0, 0.0] |
| 10.2 Second‐generation SU | 1 | 34 | Risk Ratio (M‐H, Random, 95% CI) | 0.0 [0.0, 0.0] |
| 10.3 Third‐generation SU | 0 | 0 | Risk Ratio (M‐H, Random, 95% CI) | 0.0 [0.0, 0.0] |
| 11 Microvascular outcomes Show forest plot | 1 | 34 | Risk Ratio (M‐H, Random, 95% CI) | 0.0 [0.0, 0.0] |
| 11.1 First‐generation SU | 0 | 0 | Risk Ratio (M‐H, Random, 95% CI) | 0.0 [0.0, 0.0] |
| 11.2 Second‐generation SU | 1 | 34 | Risk Ratio (M‐H, Random, 95% CI) | 0.0 [0.0, 0.0] |
| 11.3 Third‐generation SU | 0 | 0 | Risk Ratio (M‐H, Random, 95% CI) | 0.0 [0.0, 0.0] |
| 12 Nephropathy Show forest plot | 1 | 34 | Risk Ratio (M‐H, Random, 95% CI) | 0.0 [0.0, 0.0] |
| 12.1 First‐generation SU | 0 | 0 | Risk Ratio (M‐H, Random, 95% CI) | 0.0 [0.0, 0.0] |
| 12.2 Second‐generation SU | 1 | 34 | Risk Ratio (M‐H, Random, 95% CI) | 0.0 [0.0, 0.0] |
| 12.3 Third‐generation SU | 0 | 0 | Risk Ratio (M‐H, Random, 95% CI) | 0.0 [0.0, 0.0] |
| 13 Retinopathy Show forest plot | 1 | 34 | Risk Ratio (M‐H, Random, 95% CI) | 0.0 [0.0, 0.0] |
| 13.1 First‐generation SU | 0 | 0 | Risk Ratio (M‐H, Random, 95% CI) | 0.0 [0.0, 0.0] |
| 13.2 Second‐generation SU | 1 | 34 | Risk Ratio (M‐H, Random, 95% CI) | 0.0 [0.0, 0.0] |
| 13.3 Third‐generation SU | 0 | 0 | Risk Ratio (M‐H, Random, 95% CI) | 0.0 [0.0, 0.0] |
| 14 Retinal photocoagulation Show forest plot | 1 | 34 | Risk Ratio (M‐H, Random, 95% CI) | 0.0 [0.0, 0.0] |
| 14.1 First‐generation SU | 0 | 0 | Risk Ratio (M‐H, Random, 95% CI) | 0.0 [0.0, 0.0] |
| 14.2 Second‐generation SU | 1 | 34 | Risk Ratio (M‐H, Random, 95% CI) | 0.0 [0.0, 0.0] |
| 14.3 Third‐generation SU | 0 | 0 | Risk Ratio (M‐H, Random, 95% CI) | 0.0 [0.0, 0.0] |
| 15 Change in fasting blood glucose from baseline (mmol/L) Show forest plot | 10 | 2329 | Mean Difference (IV, Random, 95% CI) | ‐0.21 [‐0.45, 0.03] |
| 15.1 First‐generation SU | 0 | 0 | Mean Difference (IV, Random, 95% CI) | 0.0 [0.0, 0.0] |
| 15.2 Second‐generation SU | 9 | 2205 | Mean Difference (IV, Random, 95% CI) | ‐0.27 [‐0.51, ‐0.02] |
| 15.3 Third‐generation SU | 1 | 124 | Mean Difference (IV, Random, 95% CI) | 0.20 [‐0.22, 0.62] |
| 16 Change in HbA1c from baseline (%) Show forest plot | 10 | 2345 | Mean Difference (IV, Random, 95% CI) | 0.05 [‐0.09, 0.19] |
| 16.1 First‐generation SU | 0 | 0 | Mean Difference (IV, Random, 95% CI) | 0.0 [0.0, 0.0] |
| 16.2 Second‐generation SU | 9 | 2221 | Mean Difference (IV, Random, 95% CI) | 0.07 [‐0.08, 0.22] |
| 16.3 Third‐generation SU | 1 | 124 | Mean Difference (IV, Random, 95% CI) | ‐0.10 [‐0.40, 0.20] |
| 17 Change in BMI from baseline (kg/m2) Show forest plot | 3 | 333 | Mean Difference (IV, Random, 95% CI) | ‐0.05 [‐0.25, 0.14] |
| 17.1 First‐generation SU | 0 | 0 | Mean Difference (IV, Random, 95% CI) | 0.0 [0.0, 0.0] |
| 17.2 Second‐generation SU | 2 | 209 | Mean Difference (IV, Random, 95% CI) | 0.00 [‐0.19, 0.20] |
| 17.3 Third‐generation SU | 1 | 124 | Mean Difference (IV, Random, 95% CI) | ‐0.30 [‐0.66, 0.06] |
| 18 Change in weight from baseline (kg) Show forest plot | 5 | 1176 | Mean Difference (IV, Random, 95% CI) | 0.05 [‐0.40, 0.51] |
| 18.1 First‐generation SU | 0 | 0 | Mean Difference (IV, Random, 95% CI) | 0.0 [0.0, 0.0] |
| 18.2 Second‐generation SU | 4 | 1052 | Mean Difference (IV, Random, 95% CI) | 0.13 [‐0.50, 0.76] |
| 18.3 Third‐generation SU | 1 | 124 | Mean Difference (IV, Random, 95% CI) | 0.10 [‐1.77, 1.97] |
| 19 Adverse events Show forest plot | 5 | 1829 | Risk Ratio (M‐H, Random, 95% CI) | 1.00 [0.95, 1.06] |
| 19.1 First‐generation SU | 0 | 0 | Risk Ratio (M‐H, Random, 95% CI) | 0.0 [0.0, 0.0] |
| 19.2 Second‐generation SU | 5 | 1829 | Risk Ratio (M‐H, Random, 95% CI) | 1.00 [0.95, 1.06] |
| 19.3 Third‐generation SU | 0 | 0 | Risk Ratio (M‐H, Random, 95% CI) | 0.0 [0.0, 0.0] |
| 20 Drop‐outs due to adverse events Show forest plot | 8 | 2151 | Risk Ratio (M‐H, Random, 95% CI) | 1.03 [0.79, 1.33] |
| 20.1 First‐generation SU | 0 | 0 | Risk Ratio (M‐H, Random, 95% CI) | 0.0 [0.0, 0.0] |
| 20.2 Second‐generation SU | 7 | 2019 | Risk Ratio (M‐H, Random, 95% CI) | 1.01 [0.78, 1.32] |
| 20.3 Third‐generation SU | 1 | 132 | Risk Ratio (M‐H, Random, 95% CI) | 5.0 [0.24, 102.19] |
| 21 Serious adverse events Show forest plot | 5 | 1829 | Risk Ratio (M‐H, Random, 95% CI) | 1.02 [0.74, 1.39] |
| 21.1 First‐generation SU | 0 | 0 | Risk Ratio (M‐H, Random, 95% CI) | 0.0 [0.0, 0.0] |
| 21.2 Second‐generation SU | 5 | 1829 | Risk Ratio (M‐H, Random, 95% CI) | 1.02 [0.74, 1.39] |
| 21.3 Third‐generation SU | 0 | 0 | Risk Ratio (M‐H, Random, 95% CI) | 0.0 [0.0, 0.0] |
| 22 Mild hypoglycaemia Show forest plot | 6 | 1863 | Risk Ratio (M‐H, Random, 95% CI) | 1.20 [0.96, 1.49] |
| 22.1 First‐generation SU | 0 | 0 | Risk Ratio (M‐H, Random, 95% CI) | 0.0 [0.0, 0.0] |
| 22.2 Second‐generation SU | 6 | 1863 | Risk Ratio (M‐H, Random, 95% CI) | 1.20 [0.96, 1.49] |
| 22.3 Third‐generation SU | 0 | 0 | Risk Ratio (M‐H, Random, 95% CI) | 0.0 [0.0, 0.0] |
| 23 Moderate hypoglycaemia Show forest plot | 1 | 34 | Risk Ratio (M‐H, Random, 95% CI) | 0.0 [0.0, 0.0] |
| 23.1 First‐generation SU | 0 | 0 | Risk Ratio (M‐H, Random, 95% CI) | 0.0 [0.0, 0.0] |
| 23.2 Second‐generation SU | 1 | 34 | Risk Ratio (M‐H, Random, 95% CI) | 0.0 [0.0, 0.0] |
| 23.3 Third‐generation SU | 0 | 0 | Risk Ratio (M‐H, Random, 95% CI) | 0.0 [0.0, 0.0] |
| 24 Severe hypoglycaemia Show forest plot | 6 | 1863 | Risk Ratio (M‐H, Fixed, 95% CI) | 2.87 [0.91, 8.99] |
| 24.1 First‐generation SU | 0 | 0 | Risk Ratio (M‐H, Fixed, 95% CI) | 0.0 [0.0, 0.0] |
| 24.2 Second‐generation SU | 6 | 1863 | Risk Ratio (M‐H, Fixed, 95% CI) | 2.87 [0.91, 8.99] |
| 24.3 Third‐generation SU | 0 | 0 | Risk Ratio (M‐H, Fixed, 95% CI) | 0.0 [0.0, 0.0] |
| 25 Cancer Show forest plot | 2 | 290 | Risk Ratio (M‐H, Random, 95% CI) | 6.44 [0.27, 156.37] |
| 25.1 First‐generation SU | 0 | 0 | Risk Ratio (M‐H, Random, 95% CI) | 0.0 [0.0, 0.0] |
| 25.2 Second‐generation SU | 2 | 290 | Risk Ratio (M‐H, Random, 95% CI) | 6.44 [0.27, 156.37] |
| 25.3 Third‐generation SU | 0 | 0 | Risk Ratio (M‐H, Random, 95% CI) | 0.0 [0.0, 0.0] |
| 26 Intervention failure Show forest plot | 5 | 1656 | Risk Ratio (M‐H, Random, 95% CI) | 0.96 [0.69, 1.35] |
| 26.1 First‐generation SU | 0 | 0 | Risk Ratio (M‐H, Random, 95% CI) | 0.0 [0.0, 0.0] |
| 26.2 Second‐generation SU | 4 | 1524 | Risk Ratio (M‐H, Random, 95% CI) | 0.98 [0.69, 1.38] |
| 26.3 Third‐generation SU | 1 | 132 | Risk Ratio (M‐H, Random, 95% CI) | 0.67 [0.12, 3.86] |
| Outcome or subgroup title | No. of studies | No. of participants | Statistical method | Effect size |
| 1 All‐cause mortality Show forest plot | 1 | 1234 | Risk Ratio (M‐H, Random, 95% CI) | 0.90 [0.72, 1.11] |
| 2 Cardiovascular mortality Show forest plot | 1 | 1234 | Risk Ratio (M‐H, Random, 95% CI) | 0.98 [0.72, 1.34] |
| 3 Non‐fatal myocardial infarction Show forest plot | 1 | 1234 | Risk Ratio (M‐H, Random, 95% CI) | 0.80 [0.55, 1.16] |
| 4 Non‐fatal stroke Show forest plot | 1 | 1234 | Risk Ratio (M‐H, Random, 95% CI) | 1.32 [0.80, 2.17] |
| 5 Amputation of lower extremity Show forest plot | 1 | 1234 | Risk Ratio (M‐H, Random, 95% CI) | 1.01 [0.29, 3.46] |
| 6 Microvascular outcomes Show forest plot | 1 | 1234 | Odds Ratio (M‐H, Random, 95% CI) | 0.70 [0.48, 1.03] |
| 7 Retinal photocoagulation Show forest plot | 1 | 1234 | Risk Ratio (M‐H, Random, 95% CI) | 0.82 [0.56, 1.20] |
| 8 Change in fasting blood glucose from baseline (mmol/L) Show forest plot | 2 | 936 | Mean Difference (IV, Random, 95% CI) | 0.62 [0.31, 0.94] |
| 9 Change in HbA1c from baseline (%) Show forest plot | 2 | 1014 | Mean Difference (IV, Random, 95% CI) | ‐1.44 [‐4.48, 1.60] |
| 10 Change in weight from baseline (kg) Show forest plot | 2 | 1014 | Mean Difference (IV, Random, 95% CI) | 1.80 [‐0.63, 4.23] |
| 11 Mild hypoglycaemia Show forest plot | 1 | 1234 | Risk Ratio (M‐H, Random, 95% CI) | 2.51 [1.83, 3.42] |
| 12 Severe hypoglycaemia Show forest plot | 1 | 1234 | Risk Ratio (M‐H, Random, 95% CI) | 3.52 [0.73, 16.89] |
| 13 Cancer Show forest plot | 1 | 1234 | Risk Ratio (M‐H, Random, 95% CI) | 0.81 [0.50, 1.31] |
| 14 Intervention failure Show forest plot | 3 | 1364 | Risk Ratio (M‐H, Random, 95% CI) | 1.96 [0.67, 5.75] |