Sulphonylurea monotherapy for patients with type 2 diabetes mellitus
Abstract
Background
Type 2 diabetes mellitus (T2DM) is a growing health problem worldwide. Whether sulphonylureas show better, equal or worse therapeutic effects in comparison with other antidiabetic interventions for patients with T2DM remains controversial.
Objectives
To assess the effects of sulphonylurea monotherapy versus placebo, no intervention or other antidiabetic interventions for patients with T2DM.
Search methods
We searched publications in The Cochrane Library, MEDLINE, EMBASE, Science Citation Index Expanded, LILACS and CINAHL (all until August 2011) to obtain trials fulfilling the inclusion criteria for our review.
Selection criteria
We included clinical trials that randomised patients 18 years old or more with T2DM to sulphonylurea monotherapy with a duration of 24 weeks or more.
Data collection and analysis
Two authors independently assessed the risk of bias. The primary outcomes were all‐cause and cardiovascular mortality. Secondary outcomes were other patient‐important outcomes and metabolic variables. Where possible, we used risk ratios (RR) with 95% confidence intervals (95% CI) to analyse the treatment effect of dichotomous outcomes. We used mean differences with 95% CI to analyse the treatment effect of continuous outcomes. We evaluated the risk of bias. We conducted trial sequential analyses to assess whether firm evidence could be established for a 10% relative risk reduction (RRR) between intervention groups.
Main results
We included 72 randomised controlled trials (RCTs) with 22,589 participants; 9707 participants randomised to sulphonylureas versus 12,805 participants randomised to control interventions. The duration of the interventions varied from 24 weeks to 10.7 years. We judged none of the included trials as low risk of bias for all bias domains. Patient‐important outcomes were seldom reported.
First‐generation sulphonylureas (FGS) versus placebo or insulin did not show statistical significance for all‐cause mortality (versus placebo: RR 1.46, 95% CI 0.87 to 2.45; P = 0.15; 2 trials; 553 participants; high risk of bias (HRB); versus insulin: RR 1.18, 95% CI 0.88 to 1.59; P = 0.26; 2 trials; 1944 participants; HRB). FGS versus placebo showed statistical significance for cardiovascular mortality in favour of placebo (RR 2.63, 95% CI 1.32 to 5.22; P = 0.006; 2 trials; 553 participants; HRB). FGS versus insulin did not show statistical significance for cardiovascular mortality (RR 1.36, 95% CI 0.68 to 2.71; P = 0.39; 2 trials; 1944 participants; HRB). FGS versus alpha‐glucosidase inhibitors showed statistical significance in favour of FGS for adverse events (RR 0.63, 95% CI 0.52 to 0.76; P = 0.01; 2 trials; 246 participants; HRB) and for drop‐outs due to adverse events (RR 0.28, 95% CI 0.12 to 0.67; P = 0.004; 2 trials; 246 participants; HRB).
Second‐generation sulphonylureas (SGS) versus metformin (RR 0.98, 95% CI 0.61 to 1.58; P = 0.68; 6 trials; 3528 participants; HRB), thiazolidinediones (RR 0.92, 95% CI 0.60 to 1.41; P = 0.70; 7 trials; 4955 participants; HRB), insulin (RR 0.96, 95% CI 0.79 to 1.18; P = 0.72; 4 trials; 1642 participants; HRB), meglitinides (RR 1.44, 95% CI 0.47 to 4.42; P = 0.52; 7 trials; 2038 participants; HRB), or incretin‐based interventions (RR 1.39, 95% CI 0.52 to 3.68; P = 0.51; 2 trials; 1503 participants; HRB) showed no statistically significant effects regarding all‐cause mortality in a random‐effects model. SGS versus metformin (RR 1.47; 95% CI 0.54 to 4.01; P = 0.45; 6 trials; 3528 participants; HRB), thiazolidinediones (RR 1.30, 95% CI 0.55 to 3.07; P = 0.55; 7 trials; 4955 participants; HRB), insulin (RR 0.96, 95% CI 0.73 to 1.28; P = 0.80; 4 trials; 1642 participants; HRB) or meglitinide (RR 0.97, 95% CI 0.27 to 3.53; P = 0.97; 7 trials, 2038 participants, HRB) showed no statistically significant effects regarding cardiovascular mortality. Mortality data for the SGS versus placebo were sparse. SGS versus thiazolidinediones and meglitinides did not show statistically significant differences for a composite of non‐fatal macrovascular outcomes. SGS versus metformin showed statistical significance in favour of SGS for a composite of non‐fatal macrovascular outcomes (RR 0.67, 95% CI 0.48 to 0.93; P = 0.02; 3018 participants; 3 trials; HRB). The definition of non‐fatal macrovascular outcomes varied among the trials. SGS versus metformin, thiazolidinediones and meglitinides showed no statistical significance for non‐fatal myocardial infarction. No meta‐analyses could be performed for microvascular outcomes. SGS versus placebo, metformin, thiazolidinediones, alpha‐glucosidase inhibitors or meglitinides showed no statistical significance for adverse events. SGS versus alpha‐glucosidase inhibitors showed statistical significance in favour of SGS for drop‐outs due to adverse events (RR 0.48, 95% CI 0.24 to 0.96; P = 0.04; 9 trials; 870 participants; HRB). SGS versus meglitinides showed no statistical significance for the risk of severe hypoglycaemia. SGS versus metformin and thiazolidinediones showed statistical significance in favour of metformin (RR 5.64, 95% CI 1.22 to 26.00; P = 0.03; 4 trials; 3637 participants; HRB) and thiazolidinediones (RR 6.11, 95% CI 1.57 to 23.79; P = 0.009; 6 trials; 5660 participants; HRB) for severe hypoglycaemia.
Third‐generation sulphonylureas (TGS) could not be included in any meta‐analysis of all‐cause mortality, cardiovascular mortality or non‐fatal macro‐ or microvascular outcomes. TGS versus thiazolidinediones showed statistical significance regarding adverse events in favour of TGS (RR 0.88, 95% CI 0.78 to 0.99; P = 0.03; 3 trials; 510 participants; HRB). TGS versus thiazolidinediones did not show any statistical significance for drop‐outs due to adverse events. TGS versus other comparators could not be performed due to lack of data.
For the comparison of SGS versus FGS no meta‐analyses of all‐cause mortality, cardiovascular mortality, non‐fatal macro‐ or microvascular outcomes, or adverse events could be performed.
Health‐related quality of life and costs of intervention could not be meta‐analysed due to lack of data.
In trial sequential analysis, none of the analyses of mortality outcomes, vascular outcomes or severe hypoglycaemia met the criteria for firm evidence of a RRR of 10% between interventions.
Authors' conclusions
There is insufficient evidence from RCTs to support the decision as to whether to initiate sulphonylurea monotherapy. Data on patient‐important outcomes are lacking. Therefore, large‐scale and long‐term randomised clinical trials with low risk of bias, focusing on patient‐important outcomes are required.
Plain language summary
Sulphonylurea as sole therapy for patients with type 2 diabetes mellitus
Sulphonylureas are widely used for patients with type 2 diabetes mellitus. Sulphonylureas lower blood glucose by stimulating insulin secretion from the pancreas thereby increasing the insulin levels in the blood. Seventy‐two trials were included in the systematic review assessing the effects of sulphonylurea as sole therapy versus other comparators in patients with type 2 diabetes mellitus. A total of 22,589 participants were included. The number of participants randomised to a sulphonylurea was 9707 and the number of participants randomised to a comparator was 12,805. The duration of the interventions varied from 24 weeks to 10.7 years. All trials had deficiencies (risk of bias) and for the individual comparisons the number of participants were small, resulting in a high risk of random errors (play of chance). Data on mortality and diabetic complications were sparse and inconclusive. Stopping taking the antidiabetic drug due to adverse events were more common with alpha‐glucosidase inhibitors (for example acarbose) compared with second‐generation sulphonylureas (for example glibenclamide, glipizide, glibornuride and gliclazide), but the data were sparse. Severe hypoglycaemia was more common with second‐generation sulphonylureas compared with metformin and thiazolidinediones (for example pioglitazone), but again the data were sparse. Due to lack of data we could not adequately evaluate health‐related quality of life and costs.
There is insufficient evidence regarding patient‐important outcomes from high‐quality randomised controlled trials (RCTs) to support the decision as to whether to initiate sulphonylurea as sole therapy. Large‐scale and long‐lasting randomised clinical trials with low risk of bias, which focus on mortality, diabetic complications, adverse events and health‐related quality of life, are needed.
Authors' conclusions
Summary of findings
| First‐generation sulphonylureas compared with controls for type 2 diabetes mellitus | ||||
| Patient or population: participants with type 2 diabetes mellitus Settings: outpatients Intervention: first‐generation sulphonylureas (acetohexamide, carbutamide, chlorpropamide, tolbutamide, tolazamide) Comparison: placebo, active comparators | ||||
| Outcomes | Relative effect | No of participants | Quality of the evidence | Comments |
| All‐cause mortality a. Intervention vs placebo b. Intervention vs insulin | a.RR 1.46 (0.87 to 2.45) b. RR 1.18 (0.88 to 1.59) | a. 553 (2) b. 1944 (2) | ⊕⊕⊝⊝ | a. Small sample size (1.5% of the diversity‐adjusted required information size) b. Trial sequential analysis showed that 5.7% of the required information size to detect or reject a 10% RRR was accrued |
| Cardiovascular mortality a. Intervention vs placebo b. Intervention vs insulin | a.RR 2.63 (1.32 to 5.22) b. RR 1.36 (0.88 to 1.48) | a. 553 (2) b. 1944 (2) | ⊕⊕⊝⊝ | a. Small sample size (0.7% of the diversity‐adjusted required information size) b. Trial sequential analysis showed that 1.1% of the required information size to detect or reject a 10% RRR was accrued |
| Non‐fatal macrovascular outcomes 1. Composite 2. Non‐fatal myocardial infarction Intervention vs insulin | 1a. not estimable 2b. RR 1.08 (0.81 to 1.45) | 1a. See comment 2b.1944 (2) | 1a. See comment 2b. ⊕⊕⊝⊝ | 1a. No meta‐analysis possible |
| Microvascular outcomes | Not estimable | See comment | See comment | No meta‐analysis possible |
| Cancer Intervention vs insulin | RR 0.81 (0.29 to 2.27) | 1944 (2) | ⊕⊕⊝⊝ | One study reported any cancer and the other death due to cancer |
| Adverse events 1. All adverse events Intervention vs alpha‐glucosidase inhibitors | 1. RR 0.63 (0.52 to 0.76) 2. RR 0.28 (0.12 to 0.67) | 1. 246 (2) | ⊕⊕⊝⊝ | Trial sequential analysis showed that firm evidence was not established |
| Health‐related quality of life | Not estimable | See comment | See comment | Not investigated |
| GRADE Working Group grades of evidence | ||||
| aDue to imprecision and results of trial sequential analysis. RRR: relative risk reduction | ||||
| Second‐generation sulphonylureas compared with controls for type 2 diabetes mellitus | ||||
| Patient or population: participants with type 2 diabetes mellitus Settings: outpatients Intervention: second‐generation sulphonylureas (glibenclamide or glyburide, glibornuride, gliclazide, glipizide) Comparison: placebo, active comparators | ||||
| Outcomes | Relative effect | No of participants | Quality of the evidence | Comments |
| All‐cause mortality a. Intervention vs metformin b. Intervention vs thiazolidinediones c. Intervention vs insulin d. Intervention vs incretin‐based control e. Intervention vs meglitinide [e. 12 months to 17 months] | a. RR 0.98 (0.61 to 1.58) b. RR 0.92 (0.60 to 1.41) c. RR 0.96 (0.79 to 1.18) d. RR 1.39 (0.52 to 3.68) e. RR 1.44 (0.47 to 4.42) | a. 3528 (6) b. 4955 (7) c. 1642 (4) d. 1503 (2) e. 2038 (7) | ⊕⊕⊝⊝ | a. Trial sequential analysis showed that 2.3% of the required information size to detect or reject a 10% RRR was accrued. b. Results of the random‐effects model. Trial sequential analysis showed that 2.5% of the required information size to detect or reject a 10% RRR was accrued. c. Trial sequential analysis showed that 12.8% of the required information size to detect or reject a 10% RRR was accrued. d. Trial sequential analysis showed that 0.5% of the required information size to detect or reject a 10% RRR was accrued. e. Trial sequential analysis showed that only a minor fraction of the required information size to detect or reject a 10% RRR was accrued. |
| Cardiovascular mortality a. Intervention vs metformin b. Intervention vs thiazolidinediones c. Intervention vs insulin d. Intervention vs meglitinide [d. 12 months to 17 months] | a. RR 1.47 (0.54 to 4.01) b. RR 1.30 (0.55 to 3.07) c. RR 0.96 (0.73 to 1.28) d. RR 0.97 (0.27 to 3.53) | a. 3528 (6) b. 4955 (7) c. 1642 (4) d. 2038 (7) | ⊕⊕⊝⊝ | a. Trial sequential analysis showed that 2.7% of the required information size to detect or reject a 10% RRR was accrued. b. Trial sequential analysis showed that 0.3% of the required information size to detect or reject a 10% RRR was accrued. c. Trial sequential analysis showed that 6.6% of the required information size to detect or reject a 10% RRR was accrued. d. Trial sequential analysis showed that only a minor fraction of the required information size to detect or reject a 10% RRR was accrued. |
| Non‐fatal macrovascular outcomes a. Intervention vs metformin b. Intervention vs thiazolidinediones [1b. 52 weeks to 4 years] c. Intervention vs meglitinide [1c. 12 months to 15 months] a. Intervention vs metformin b. Intervention vs thiazolidinediones [2b. 24 weeks to 4 years] c. Intervention vs meglitinide [2c. 12 months to 17 months] | 1a. RR 0.67 (0.48 to 0.93) 1b. RR 0.91 (0.62 to 1.33) 1c. RR 0.50 (0.20 to 1.20) 2a.RR 1.02 (0.37 to 2.85) 2b. RR 0.68 (0.41 to 1.14) 2c. RR 1.03 (0.26 to 4.08) | 1a. 3018 (3) 1b. 4600 (6) 1c. 866 (3) 2a. 3061 (4) 2b. 4956 (7) 2c. 726 (3) | ⊕⊕⊝⊝ | 1a. Non‐fatal macrovascular outcomes as a composite outcome were not reported in the way we predefined to assess this outcome. Trial sequential analysis showed that 5% of the required information size to detect or reject a 10% RRR was accrued. 1c. The definition of non‐fatal macrovascular outcomes was heterogenous. |
| Microvascular outcomes | Not estimable | See comment | See comment | No meta‐analysis possible |
| Adverse events 1. All adverse events a. Intervention vs placebo b. Intervention vs metformin [3b. 24 weeks to 10.4 years] c. Intervention vs thiazolidinediones [3c. 6 months to 4 years] d. Intervention vs alpha‐glucosidase inhibitors [1d. 24 weeks to 12 months] e. Intervention vs incretin‐based control f. Intervention vs meglitinides [3f. 14 months to 17 months] | 1a. RR 0.91 (0.51 to 1.62) 1b. RR 0.99 (0.97 to 1.01) 1c. RR 0.99 (0.97 to 1.01) 1d. RR 0.64 (0.39 to 1.03) 1f. RR 1.0 (0.95 to 1.06) 2a. RR 0.62 (0.24 to 1.57) 2b.RR 1.19 (0.99 to 1.42) 2c. RR 1.15 (0.98 to 1.36) 2d. RR 0.48 (0.24 to 0.96) 2e. RR 1.00 (0.67 to 1.50) 2f. RR 1.01 (0.78 to 1.32) 3b. RR 5.64 (1.22 to 26.00) 3c. RR 6.11 (1.57 to 23.79) 3f. RR 2.17 (0.53 to 8.91) | 1a. 202 (2) 1b. 3042 (2) 1c. 6491 (10) 1d. 646 (8) 1f. 1829 (5) 2a. 510 (5) 2b. 3567 (7) 2c. 7433 (15) 2d. 970 (9) 2e. 1503 (2) 2f. 2019 (7) 3b. 3637 (4) 3c. 5669 (6) 3f. 1863 (6) | ⊕⊕⊝⊝ | 1d. Results of the random‐effects model. Fixed‐effect model: RR 0.67 (0.52 to 0.86) 2c. Results of the random‐effects model. Fixed‐effect model: RR 1.17 (1.01 to 1.35) 2d. Trial sequential analysis showed that only a minor fraction of the required information size to confirm or reject a 10% RRR was accrued 3b. Trial sequential analysis showed that only 0.1% of the required information size was accrued 3c. Trial sequential analysis showed that a minor fraction of the required information size was accrued |
| Cancer a. Intervention vs thiazolidinediones b. Intervention vs insulin | a. RR 1.02 (0.72 to 1.45) b. RR 0.95 (0.61 to 1.49) | a. 4192 (6) b. 1575 (2) | ⊕⊕⊝⊝ | |
| Health‐related quality of life a. Intervention vs thiazolidinediones b. Intervention vs insulin c. Intervention vs alpha‐glucosidase inhibitors | Not estimable | a. 35 (1) b. 49 (1) c. 35 (1) | ⊕⊝⊝⊝ | a. Inadequately reported, no scale provided b. Authors used short‐form 36 (SF 36), but did not find any significant differences between the interventions c. Inadequately reported, no scale provided |
| GRADE Working Group grades of evidence | ||||
| aDue to imprecision and results of trial sequential analysis. bDue to small sample size and risk of bias. RRR: relative risk reduction | ||||
| Third‐generation sulphonylureas compared with controls for type 2 diabetes mellitus | ||||
| Patient or population: participants with type 2 diabetes mellitus Settings: outpatients Intervention: third‐generation sulphonylureas (gliclazide modified release (MR), glimepiride, glipizide gastrointestinal therapeutic system (GITS)) Comparison: active comparators | ||||
| Outcomes | Relative effect | No of Participants | Quality of the evidence | Comments |
| All‐cause mortality | Not estimable | See comment | See comment | No meta‐analysis possible |
| Cardiovascular mortality | Not estimable | See comment | See comment | No meta‐analysis possible |
| Macrovascular outcomes | Not estimable | See comment | See comment | No meta‐analysis possible |
| Microvascular outcomes | Not estimable | See comment | See comment | No meta‐analysis possible |
| Adverse events 1. All adverse events Interventions vs thiazolidinediones [1. 6 months to 12 months] [2. 24 weeks to 52 weeks] | 1. RR 0.88 (0.78 to 0.99) 2. RR 0.54 (0.15 to 1.97) | 1. 510 (3) 2. 423 (2) | ⊕⊕⊝⊝ | 1. Trial sequential analysis showed that firm evidence was not established |
| Cancer | Not estimable | See comment | See comment | No meta‐analysis possible |
| Health‐related quality of life | Not estimable | See comment | See comment | No meta‐analysis possible |
| GRADE Working Group grades of evidence | ||||
| aDue to imprecision/small sample size and results of trial sequential analysis. RRR: relative risk reduction | ||||
Background
Description of the condition
The prevalence of type 2 diabetes mellitus (T2DM) is increasing worldwide (King 1998). Insulin resistance in peripheral tissues and inadequate compensatory insulin secretion are essential elements in the pathogenesis of T2DM. Reduced insulin secretion is caused by a decrease in the β‐cell mass, a dysfunction of existing β‐cells, or both (LeRoith 2002). A consequence of these defects is chronic hyperglycaemia (elevated levels of plasma glucose) with disturbances of carbohydrate, fat and protein metabolism. Long‐term complications of diabetes mellitus include retinopathy, nephropathy, neuropathy and the risk of cardiovascular disease.
For a detailed overview of diabetes mellitus, please see under 'Additional information' in the information on the Metabolic and Endocrine Disorders Group in The Cochrane Library (see 'About', 'Cochrane Review Groups (CRGs)'; MEDG 2007). For an explanation of methodological terms, please see the main glossary in The Cochrane Library.
Description of the intervention
All insulin secretagogues lower blood glucose by enhancing insulin secretion from β‐cells. The insulin secretagogues are divided into different classes. The first‐generation sulphonylureas (carbutamide, tolbutamide, acetohexamide, tolazamide and chlorpropamide) were introduced in diabetes treatment in the 1950s, but are now rarely used (Henquin 1992; Markkanen 1960; Nathan 2009). However, chlorpropamide was used in the United Kingdom Prospective Diabetes Study (UKPDS) (UKPDS‐33 1998). The second‐generation sulphonylureas (e.g. glibenclamide, glipizide, glibornuride and gliclazide) and third‐generation sulphonylureas (glimepiride, gliclazide modified release (MR) and glipizide gastrointestinal therapeutic system (GITS)) have almost replaced the first‐generation sulphonylureas, as they are preferred because of their perceived greater potency and better safety profiles (Henquin 1992; Nathan 2009). The meglitinide analogues (repaglinide and nateglinide) are a relatively new class of oral hypoglycaemic agents. They are designed primarily to augment the early‐phase insulin release from the β‐cells and therefore target postprandial glucose levels (Dornhorst 2001). Despite different chemical structures, the mechanisms of action of the meglitinide analogues and sulphonylureas are very similar in binding to and activating the sulphonylurea receptor on the β‐cell.
As T2DM is a progressive disease, the glucose‐lowering intervention will be adjusted over time to achieve and maintain glycaemic control (UKPDS‐33 1998). All patients with T2DM are initially advised to follow 'lifestyle' interventions including weight loss and increased physical activity. However, with time, the large majority of the patients will need addition of pharmacological glucose‐lowering interventions to control blood glucose levels. In the early stages of the disease the most commonly used glucose‐lowering medications are metformin (which reduces hepatic glucose production and may increase insulin sensitivity) and insulin secretagogues (sulphonylureas, meglitinide analogues or incretin therapies ‐ which stimulate insulin secretion) (Inzucchi 2012; Nathan 2009). Thus, sulphonylurea monotherapy is considered an option if dietary and exercise interventions fail.
If lifestyle changes and maximum tolerated doses of an oral glucose‐lowering drug given as monotherapy fail to achieve the glycaemic goal, other oral glucose‐lowering drugs may be added. The most often recommended choice of a combined intervention is metformin plus an insulin secretagogue or insulin (Inzucchi 2012; Nathan 2009).
In case of sub‐optimal glycaemic control by use of oral glucose‐lowering drugs, insulin can be initiated (Inzucchi 2012; Nathan 2009). In contrast to other glucose‐lowering medications, theoretically there is no upper limit of the dose of insulin above which further glucose‐lowering effects will be absent. Hence, insulin may be used at all stages of the disease.
Adverse effects of the intervention
All sulphonylureas have a potential to cause hypoglycaemia. The risk of hypoglycaemia seems more pronounced for the first‐generation sulphonylureas than the newer generations of sulphonylureas (Harrower 2000). Other specific adverse effects are known, e.g. hyponatraemia with chlorpropamide treatment (Fine 1970; Harrower 2000). All sulphonylureas are bound to plasma proteins, which might cause interactions with other medical interventions. This is primarily seen in first‐generation sulphonylureas (Gerich 1989). The University Group Diabetes Program (UGDP) trial reported an increased all‐cause and cardiovascular mortality in patients treated with tolbutamide compared with placebo and insulin (UGDP 1970). The results gave rise to a debate whether sulphonylureas should be used in patients with T2DM with known ischaemic heart disease. Sulphonylureas increase pancreatic insulin release by closing of adenosine triphosphate‐sensitive K+ channels (KATP). Opening of the cardiac KATP channels is a key transduction pathway for heart ischaemic preconditioning, in which brief episodes of ischaemia and reperfusion renders the heart more resistant to a subsequent sustained ischaemic insult (i.e. reduction of infarct size). As individual sulphonylurea drugs differ in their affinities to extrapancreatic KATP channels, their effects on the signalling pathways of pre‐ and post‐conditioning may differ. Cardioprotection with sulphonylurea, in terms of reducing infarct size in the acute setting of myocardial ischaemia, is theoretically possible through opening of KATP channels. However, it is unknown if chronic therapy with sulphonylurea can protect the myocardium (i.e. reduced ischaemia‐reperfusion injury) after acute myocardial infarction (Henquin 1992; UGDP 1970; Yellon 2007). For example, the initial analysis from the UKPDS trial did not find any statistically significant differences in the risk of myocardial infarction between the groups treated with insulin, chlorpropamide or glibenclamide (UKPDS‐33 1998). However, the risk of angina was more reduced in the glibenclamide group compared with the insulin or chlorpropamide groups (UKPDS‐33 1998). Patients assigned to chlorpropamide did not have the same risk reduction as those assigned to glibenclamide or insulin for the progression of retinopathy. Also, combined intervention with metformin and sulphonylurea versus sulphonylurea monotherapy showed a significant increase in mortality (UKPDS‐34 1998). However, in the 10‐year post‐study follow‐up from the UKPDS trial, a statistically significant reduction in the risk of myocardial infarction was observed in the group with prior allocation to intensive therapy with either sulphonylurea or insulin versus conventional therapy with diet alone (Holman 2008).
How the intervention might work
In 1942 the efficacy of a sulphonamide was evaluated in the treatment of typhoid fever (Henquin 1992). It was noted that some of the patients died of hypoglycaemia. In the mid‐1950s a sulphonamide was tested as treatment against bacterial infections. Hypoglycaemia was reported among the trial participants, and the drug was shortly thereafter tested in patients with T2DM (Henquin 1992). Tolbutamide was thereafter synthesised for use in patients with diabetes mellitus. In 1966 the second‐generation sulphonamide, glibenclamide (in the United States: glyburide) was available for patients with T2DM. In the 1970s the first non‐sulphonylurea insulin secretagogue was discovered. Shortly thereafter the first non‐sulphonylurea rapid‐acting insulin secretagogues, repaglinide and nateglinide, were developed for T2DM (Henquin 1992). This class of drug produces a rapid, short‐acting insulin response (Landgraf 2000).
The differences in the pharmacokinetic profiles of the insulin secretagogues are primarily explained by different binding affinities to the KATP channels in the β‐cells. The meglitinide analogues bind to the KATP channel at a distinct different site than the sulphonylureas (Landgraf 2000).
A relatively new class of antidiabetic intervention, the incretins, control blood glucose by increasing glucose‐dependent insulin secretion and inhibition of glucagon secretion. This class of drugs works by a different mechanism than the other insulin secretagogues, and stimulate insulin secretion in a glucose‐dependent manner (Drucker 2005).
Why it is important to do this review
Sulphonylureas are widely used in daily clinical practice (Nathan 2009). A Cochrane review investigated the effect of meglitinide analogues in patients with T2DM, but they did not find any trials assessing mortality and morbidity (Black 2007). A meta‐analysis compared glibenclamide with other insulin secretagogues and with insulin (Gangji 2007). The conclusion from the authors was that glibenclamide caused more hypoglycaemia than the other sulphonylureas. This meta‐analysis did only include trials published in English. Moreover, this meta‐analysis only made comparisons of glibenclamide with other antidiabetic interventions and was unable to draw conclusions on the benefits and harms of the other sulphonylureas. We are unaware of any up‐to‐date systematic reviews looking into the effect of all sulphonylureas on clinical relevant outcomes in patients with T2DM. A Cochrane review compared metformin monotherapy with any other antidiabetic interventions (Saenz 2005). The authors concluded that metformin monotherapy may prevent some vascular complications and mortality in patients with T2DM with overweight. Three recent meta‐analyses published outside The Cochrane Collaboration investigated the effect of oral glucose‐lowering drugs (Bennett 2011; Bolen 2007; Selvin 2008). Selvin et al concluded that metformin seemed superior to other oral glucose‐lowering drugs (Selvin 2008). Bolen et al concluded that older oral glucose‐lowering agents (second‐generation sulphonylurea and metformin) had equivalent or superior effects regarding glycaemic control compared with newer oral glucose‐lowering drugs (Bolen 2007). Bolen et al and Selvin et al did not include studies published after January 2006. Therefore, the landmark study, the 'A Diabetes Outcome Progression Trial' (ADOPT) investigating time to treatment failure of glibenclamide, metformin and rosiglitazone during about four years in 4360 drug‐naive patients with T2DM and published in December 2006, was not included in either of the reviews by Bolen et al and Selvin et al (ADOPT 2006). Bennett et al only found very sparse data on patient‐important outcomes, and only included trials published in English (Bennett 2011). The ADOPT trial is the largest trial to date of monotherapy with oral glucose‐lowering agents. In fact, the ADOPT trial suggested less cardiovascular risk with glibenclamide than with either metformin or rosiglitazone. An up‐to‐date review including the ADOPT trial might therefore add important information to existing reviews about oral glucose‐lowering agents. Also, neither Bennett et al, Bolen et al nor Selvin et al used the 'Risk of bias' tools recommended by The Cochrane Collaboration (Bennett 2011; Bolen 2007; Selvin 2008). Cochrane reviews have also been published on both pioglitazone and rosiglitazone versus other antidiabetic interventions (Richter 2006; Richter 2007). Both reviews concluded that further knowledge about the glitazones should become available, to assess the benefit‐harm risk ratio properly. None of the reviews or meta‐analyses so far have estimated the required information size needed to draw sensible conclusions on the effect on patient‐important outcomes.
Objectives
To assess the effects of sulphonylurea monotherapy versus placebo, no intervention or other antidiabetic interventions for patients with type 2 diabetes mellitus (T2DM).
Methods
Criteria for considering studies for this review
Types of studies
Randomised clinical trials.
Types of participants
Adults of 18 years or more with T2DM.
Diagnostic criteria
To be consistent with changes in classification and diagnostic criteria of T2DM through the years, the diagnosis of T2DM should have been established using the standard criteria valid at the time of the beginning of the trial (e.g. ADA 1997; ADA 1999; ADA 2003; ADA 2008; NDDG 1979; WHO 1980; WHO 1985; WHO 1998). Ideally, diagnostic criteria should have been described. If necessary, we used the authors' definition of diabetes mellitus. We subjected diagnostic criteria to a sensitivity analysis.
Types of interventions
We investigated the allocation to sulphonylurea monotherapy (irrespective of whether the subsequent addition of other glucose‐lowering drugs was permitted after randomisation, e.g. escape medicine).
First‐generation sulphonylureas are carbutamide, tolbutamide, acetohexamide, tolazamide and chlorpropamide. Second‐generation sulphonylureas are glibenclamide, glipizide, glibornuride and gliclazide. Third‐generation sulphonylureas are glimepiride, gliclazide modified release (MR) and glipizide gastrointestinal therapeutic system (GITS).
Experimental intervention and control intervention
-
First‐, second‐ or third‐generation sulphonylureas versus placebo, diet, metformin, thiazolidinediones, insulin or any other antidiabetic comparator.
-
Second‐ or third‐generation sulphonylureas versus first‐generation sulphonylureas.
Other comparisons are being undertaken by other review teams within the Cochrane Metabolic and Endocrine Disorder Review Group. Their results are referenced in this review, in order to give a comprehensive overview. We did not conduct a predefined comparison of second‐generation sulphonylureas versus third‐generation sulphonylureas in order to reduce the number of comparisons.
Types of outcome measures
Primary outcomes
-
All‐cause mortality (death from any cause).
-
Cardiovascular mortality (death from myocardial infarction, stroke, peripheral vascular disease and sudden death without known cause).
Secondary outcomes
-
Non‐fatal macrovascular outcomes assessed together and separately: non‐fatal myocardial infarction, non‐fatal stroke, amputation of lower extremity and cardial or peripheral revascularisation.
-
Microvascular outcomes assessed together and separately: manifestation of nephropathy, manifestation and progression of retinopathy and retinal photocoagulation.
-
Glycaemic control (as measured by the level of fasting plasma glucose and glycosylated haemoglobin A1c (HbA1c)).
-
Body mass index (BMI).
-
Weight.
-
Adverse events (e.g. hypoglycaemia. Definitions may be heterogeneous between trials. Hypoglycaemia was defined as mild (controlled by patient), moderate (daily activities interrupted but self managed) or severe (requiring assistance)).
-
Serious adverse events (ICH 1997).
-
Health‐related quality of life measured with validated instruments.
-
Costs of treatment.
-
Cancer.
-
Need for an additional glucose‐lowering drug (i.e. intervention failure).
Covariates, effect modifiers and confounders
-
Disease duration.
Timing of outcome measurement
We divided the trials according to their intervention periods into short duration (equal to or greater than 24 weeks to less than two years) and long duration (equal to or greater than two years).
Search methods for identification of studies
Electronic searches
We used the following sources from inception until specified date for the identification of trials.
-
The Cochrane Library (2011, Issue 3).
-
MEDLINE (until August 2011).
-
EMBASE (until August 2011).
-
Science Citation Index Expanded (until August 2011).
-
Latin American Caribbean Health Sciences Literature (LILACS) (until August 2011).
-
Cumulative Index to Nursing & Allied Health Literature (CINAHL) (until August 2011).
For detailed search strategies please see under Appendix 1.
Additional key words of relevance were not detected during any of the electronic or other searches. If this had been the case, we would have modified the electronic search strategies to incorporate these terms. Trials published in any language were included.
Searching other resources
In addition, we handsearched abstracts of major diabetes conferences (American Diabetes Association (ADA), European Association for the Study of Diabetes (EASD)) and checked the references from included trials and (systematic) reviews, meta‐analyses and health technology assessment reports. The US Food and Drug Administration web site was searched for unpublished trials.
We obtained evaluations of all relevant non‐English articles.
Data collection and analysis
Selection of studies
To determine the studies to be assessed further, two authors (BH and LL, TA or JS) independently scanned the abstract, title or both sections of every record retrieved. We investigated all potentially relevant articles as full text.
We measured interrater agreement for selection of potentially relevant studies using the kappa statistic (Cohen 1960). Where differences in opinion existed, they were resolved by a third party (JW or CG). If resolving disagreement was not possible, we contacted the authors for clarification.
The PRISMA (Preferred Reporting Items for Systematic reviews and Meta‐Analyses) flow‐chart of study selection (Liberati 2009) is attached (Figure 1).

Study flow diagram.
N = number of references
Data extraction and management
For studies that fulfilled the inclusion criteria, two review authors (BH and LL, TA, JS or DS) independently abstracted relevant population and intervention characteristics using standard data extraction templates (for details see Characteristics of included studies and Table 1, Appendix 2, Appendix 3, Appendix 4, Appendix 5, Appendix 6, Appendix 7, Appendix 8, Appendix 9). Any disagreements were resolved by discussion, or if required by a third party (JW or CG). We sought any relevant missing information on the trial from the original author(s) of the article, if required.
| Characteristic Study ID | Intervention(s) and control(s) | [N] screened | [N] randomised | [N] safety | [N] lost to follow‐up (mortality) | [N] finishing study | [%] of randomised participants finishing study |
| Abbatecola 2006 | I1: glibenclamide C1: repaglinide | ‐ | I1: 79 C1: 77 T: 156 | I1: 73 C1: 74 T: 147 | ‐ | I1: 63 C1: 65 T: 128 | I1: 80 C1: 84 T: 82 |
| ADOPT 2006 | I1: glibenclamide C1: rosiglitazone C2: metformin | 6676 | I1: 1447 C1: 1458 C2: 1455 T: 4360 | I1: 1441 C1: 1456 C2: 1455 T: 4351 | ‐ | I1: 807 C1: 917 C2: 903 T: 2627 | I1: 56 C1: 63 C2: 62 T: 60 |
| AGEE/DCD/046/UK | I1:glibenclamide C1: repaglinide | 313 | I1: 86 C1: 178 T: 264 | I1: 85 C1: 178 T: 264 | ‐ | I1: 57 C1: 111 T: 168 | I1:66 C1: 62 T: 64 |
| AGEE/DCD/047/B/F/I | I1: gliclazide C1: repaglinide | 337 | I1: 99 C1: 206 T: 305 | I1: 99 C1: 206 T: 305 | ‐ | I1: 68 C1: 138 T: 206 | I1: 69 C1: 67 T: 68 |
| Alvarsson 2010 | I1: glibenclamide C1: insulin | 56 | I1: 26 C1: 23 T: 49 | ‐ | I1: 7 C1: 5 T: 12 | I1: 18 C1: 16 T: 34 | I1: 69 C1: 70 T: 70 |
| APPROACH 2010 a | I1: glipizide C1: rosiglitazone | 1147 | I1: 339 C1: 333 T: 672 | I1: 337 C1: 331 T: 668 | I1: 22 C1: 17 T: 39 | I1: 264 C1: 259 T: 523 | I1: 78 C1: 78 T: 78 |
| Birkeland 1994 | I1: glibenclamide I2: glipizide C1: placebo | ‐ | I1: 15 I2: 15 C1: 16 T: 46 | ‐ | I1: 0 I2: 0 C1: 0 T: 0 | I1: 15 I2: 13 C1: 12 T: 40 | I1: 100 I2: 87 C1: 75 T: 87 |
| Birkeland 2002 | I1: glibenclamide C1: insulin | 54 | I1: 18 C1: 18 T: 36 | ‐ | ‐ | ‐ | N/A |
| Campbell 1994 | I1: glipizide C1: metformin | 50 (?) | I1: 24 C1: 24 T: 48 | I1: 24 C1: 24 T: 48 | I1: 0 C1: 0 T: 0 | I1: 24 C1: 24 T: 48 | I1: 100 C1: 100 T: 100 |
| Charbonnel 2005 b | I1: gliclazide C1: pioglitazone | 2412 | I1: 626 C1: 624 T: 1270 | ‐ | I1: 4 C1: 4 T: 8 | I1: 525 C1: 530 T: 1055 | I1: ‐ C1: ‐ T: 83 |
| Collier 1989 | I1: gliclazide C1: metformin | ‐ | I1: 12 C1: 12 T: 24 | I1: 12 C1: 12 T: 24 | ‐ | I1: 12 C1: 12 T: 24 | I1: 100 C1: 100 T: 100 |
| Coniff 1995 | I1: tolbutamide C1: acarbose C2: placebo | ‐ | I1: 72 C1: 76 C2: 72 T: 220 | I1: 71 C1: 74 C2: 72 T: 217 | ‐ | ‐ | N/A |
| Dalzell 1986 | I1: tolbutamide C1: metformin | ‐ | I1: 15 C1: 18 T: 33 | ‐ | ‐ | ‐ | N/A |
| DeFronzo 2005 | I1: glibenclamide C1: metformin | 788 | I1: 209 C1: 210 T: 419 | ‐ | ‐ | I1: 174 C1: 157 T: 331 | I1: 83 C1: 75 T: 79 |
| Deng 2003 | I1: glibenclamide C1: Xiaoyaosan | 160 | I1: 80 C1: 80 T: 160 | ‐ | ‐ | ‐ | N/A |
| Derosa 2003 | I1: glimepiride C1: repaglinide | ‐ | I1: 66 C1: 66 T: 132 | I1: 66 C1: 66 T: 132 | I1: 4 C1: 4 T: 8 | I1: 62 C1: 62 T: 124 | I1: 94 C1: 94 T: 94 |
| Derosa 2004 | I1: glimepiride C1: metformin | ‐ | I1: 81 C1: 83 T: 164 | I1: 81 C1: 83 T: 164 | ‐ | I1: 73 C1: 75 T: 148 | I1:90 C1: 90 T: 90 |
| Diehl 1985 | I1: chlorpropamide C1: insulin | 137 | I1: 40 C1: 37 T: 77 | ‐ | ‐ | I1: 30 C1: 28 T: 58 | I1: 75 C1: 77 T: 75 |
| Ebeling 2001 | I1: glibenclamide C1: pioglitazone C2: placebo | ‐ | I1: 10 C1: 9 C2: 10 T: 29 | ‐ | ‐ | ‐ | N/A |
| Esposito 2004 | I1: glibenclamide C1: repaglinide | 210 | I1: 87 C1: 88 T: 175 | I1: 87 C1: 88 T: 175 | I1: 7 C1: 7 T: 14 | I1: 80 C1: 81 T: 161 | I1: 92 C1: 92 T: 92 |
| Feinböck 2003 | I1: glibenclamide C1: acarbose | ‐ | I1: 111 C1: 108 T: 219 | I1: 93 C1: 59 T: 152 | ‐ | I1: 93 C1: 59 T: 152 | I1: 84 C1: 55 T: 69 |
| Fineberg 1980 c | I1: glipizide C1: tolbutamide | ‐ | I1: ‐ C1: ‐ T: 29 | ‐ | ‐ | I1: 8 C1: 10 T: 18 | I1: ‐ C1: ‐ T: 62 |
| Foley 2009 | I1: gliclazide C1: vildagliptin | ‐ | I1: 546 C1: 546 T: 1092 | I1: 402 C1: 409 T: 811 | I1: 13 C1: 17 T: 30 | I1: 402 C1: 409 T: 811 | I1:74 C1: 75 T: 74 |
| Forst 2003 | I1: glibenclamide C1: insulin | 200 | I1: 68 C1: 75 T: 143 | I1: 68 C1: 75 T: 143 | I1: 0 C1: 0 T: 0 | I1: 68 C1: 75 T: 143 | I1: 100 C1: 100 T: 100 |
| Forst 2005 | I1: glimepiride C1: pioglitazone | 192 | I1: 87 C1: 92 T: 179 | I1: 84 C1: 89 T: 173 | I1: 3 C1: 3 T: 6 | I1: 84 C1: 89 T: 173 | I1:97 C1: 97 T: 97 |
| Hanefeld 2005 | I1: glibenclamide C1: rosiglitazone 2 mg C2: rosiglitazone 4 mg | ‐ | I1: 207 C1: 200 C2: 191 T: 598 | ‐ | I1: 0 C1: 0 C2: 0 T: 0 | I1: 173 C1: 153 C2: 158 T: 484 | I1: 84 C1: 77 C2: 83 T: 81 |
| Harrower 1985 | I1: glipizide I2: gliquidone I3: gliclazide I4: glibenclamide C1: chlorpropamide | ‐ | I1: 24 I2: 22 I3: 22 I4: 23 T: 112 | ‐ | I1: 4 I2: 3 I3: 2 I4: 4 T: 16 | I1: 20 I2: 19 I3: 20 I4: 19 T: 96 | I1: 83 I2: 86 I3: 91 I4: 83 T: 86 |
| Hermann 1991 d | I1: glibenclamide C1: metformin | ‐ | I1: ‐ C1: ‐ T: 25 | I1: 10 C1: 12 T: 22 | ‐ | I1: 10 C1: 12 T: 22 | N/A |
| Hermann 1991a | I1: glibenclamide C1: metformin | ‐ | I1: 34 C1: 38 T: 72 | ‐ | I1: 0 C1: 0 T: 0 | I1: 28 C1: 28 T: 56 | I1: 82 C1: 74 T: 78 |
| Hoffmann 1990 | I1: glibenclamide C1: acarbose | ‐ | I1: 47 C1: 48 T: 95 | ‐ | ‐ | ‐ | N/A |
| Hoffmann 1994 | I1: glibenclamide C1: placebo C2: acarbose | 96 | I1: 27 C1: 30 C2: 28 T: 85 | ‐ | I1: 0 C1: 0 T: 0 | I1: 27 C1: 30 C2: 28 T: 85 | I1: 100 C1: 100 C2: 100 |
| Hollander 1992 | I1: glibenclamide C1: insulin | ‐ | I1: 29 C1: 30 T: 59 | ‐ | ‐ | ‐ | N/A |
| Jain 2006 | I1: glibenclamide C1: pioglitazone | ‐ | I1: 251 C1: 251 T: 502 | ‐ | I1: 21 C1: 22 T: 43 | I1: 128 C1: 134 T: 262 | I1: 50 C1: 53 T: 52 |
| Jibran 2006 | I1: glibenclamide C1: repaglinide | ‐ | I1: 50 C1: 50 T: 100 | ‐ | ‐ | ‐ | N/A |
| Johnston 1997 | I1: glibenclamide C1: placebo C2: miglitol 25 mg C3: miglitol 50 mg | ‐ | I1: 104 C1: 101 C2: 104 C3: 102 T: 411 | ‐ | ‐ | ‐ | N/A |
| Kaku 2011 | I1: glibenclamide C1: liraglutide | 464 | I1: 139 C1: 272 T: 411 | I1: 132 C1: 268 T: 400 | ‐ | I1: 110 C1: 225 T: 335 | I1: 79 C1: 83 T: 82 |
| Kamel 1997 | I1: gliclazide I2: glibenclamide C1: acarbose C2: metformin C3: placebo | ‐ | I1: 9 I2: 8 C1: 10 C2: 6 C3: 10 T: 43 | ‐ | ‐ | ‐ | N/A |
| Kanda 1998 | I1: gliclazide C1: acarbose | 25 | I1: 9 C1: 10 T: 19 | ‐ | ‐ | I1: 9 C1: 10 T: 19 | I1: 100 C1: 100 T: 100 |
| Kovacevic 1997 | I1: glibenclamide C1: acarbose C2: placebo | ‐ | I1: 34 C1: 34 C2: 34 T: 102 | I1: 33 C1: 33 C2: 31 T: 97 | ‐ | I1: 33 C1: 33 C2: 31 T: 97 | I1: 97 C1: 97 C2: 91 T: 95 |
| Lawrence 2004 | I1: gliclazide C1: metformin C2: pioglitazone | 67 | I1: 22 C1: 21 C2: 21 T: 64 | ‐ | I1: 0 C1: 0 C2: 0 T: 0 | I1: 20 C1: 20 C2: 20 T: 60 | I1: 91 C1: 95 C2: 95 T: 94 |
| LEAD‐3 2006 e | I1: glimepiride C1: liraglutide 1.2 mg C2: liraglutide 1.8 mg | ‐ | I1: 248 C1: 251 C2: 247 T: 746 | I1: 248 C1: 251 C2: 246 T: 745 | ‐ | I1: 152 C1: 162 C2: 173 T: 487 | I1: 61 C1: 65 C2: 70 T: 65 |
| Madsbad 2001 | I1: glipizide C1: repaglinide | 320 | I1: 81 C1: 175 T: 256 | I1: 81 C1: 175 T: 256 | ‐ | I1: 58 C1: 140 T: 198 | I1: 72 C1: 80 T: 77 |
| Marbury 1999 | I1: glibenclamide C1: repaglinide | ‐ | I1: 193 C1: 383 T: 576 | I1: 193 C1: 383 T: 576 | ‐ | I1: 115 C1: 216 T: 331 | I1: 60 C1: 56 T: 57 |
| Memisogullari 2009 | I1: gliclazide C1: nothing | ‐ | I1: 26 C1: 30 T: 56 | ‐ | I1:0 C1: 0 T: 0 | ‐ | N/A |
| Nakamura 2004 | I1: glibenclamide C1: pioglitazone C2: voglibose | ‐ | I1: 15 C1: 15 C2: 15 T: 45 | I1: 15 C1: 15 C2: 15 T: 45 | I1: 0 C1: 0 C2: 0 T: 0 | I1: 15 C1: 15 C2: 15 T: 45 | I1: 100 C1: 100 C2: 100 T: 100 |
| Nakamura 2006 | I1: glibenclamide C1: pioglitazone C2: voglibose C3: nateglinide | 78 | I1: 18 C1: 17 C2: 17 C3: 16 T: 68 | I1: 18 C1: 17 C2: 17 C3: 16 T: 68 | I1: 0 C1: 0 C2: 0 C3: 0 T: 0 | I1: 18 C1: 17 C2: 17 C3: 16 T: 68 | I1: 100 C1: 100 C2: 100 C3: 100 T: 100 |
| Nathan 1988 | I1: glibenclamide C1: insulin | ‐ | I1: 16 C1: 15 T: 31 | I1: 16 C1: 15 T: 31 | I1: 0 C1: 0 T: 0 | I1: 16 C1: 15 T: 31 | I1: 100 C1: 100 T: 100 |
| Pagano 1995 f | I1: glibenclamide C1: miglitol | ‐ | I1: 47 C1: 50 T: 100 | I1: ‐ C1: ‐ T: 99 | I1: ‐ C1: ‐ T: 3 | I1: 47 C1: 49 T: 96 | I1: ‐ C1: ‐ T: 96 |
| Perriello 2007 | I1: gliclazide C1: pioglitazone | ‐ | I1: 137 C1: 146 T: 283 | ‐ | ‐ | I1: 135 C1: 140 T: 275 | I1: 99 C1: 96 T: 97 |
| Rosenthal 2002 | I1: glibenclamide C1: acarbose | ‐ | I1: 37 C1: 39 T: 76 | I1: 31 C1: 32 T: 63 | ‐ | I1: 31 C1: 32 T: 63 | I1: 84 C1: 82 T: 83 |
| Salman 2001 | I1: gliclazide C1: acarbose | ‐ | I1: 35 C1: 33 T: 68 | I1: 30 C1: 27 T: 57 | ‐ | I1: 30 C1: 27 T: 57 | I1: 86 C1: 82 T: 84 |
| Segal 1997 | I1: glibenclamide C1: miglitol C2: placebo | ‐ | I1: 69 C1: 67 C2: 65 T: 201 | I1: 69 C1: 67 C2: 65 T: 201 | I1: 11 C1: 12 C2: 6 T: 29 | I1: 50 C1: 49 C2: 58 T: 157 | I1: 72 C1: 73 C2: 89 T: 78 |
| Shihara 2011 | I1: glimepiride C1: pioglitazone | 238 | I1: 95 C1: 96 T: 191 | I1: 86 C1: 91 T: 177 | ‐ | I1: 86 C1: 91 T: 177 | I1: 91 C1: 95 T: 93 |
| Spengler 1992 g | I1: glibenclamide C1: acarbose | ‐ | I1: 36 C1: 36 T: 72 | ‐ | ‐ | I1: 29 C1: 26 T: 55 | I1: 81 C1: 72 T: 76 |
| Sung 1999 | I1: glibenclamide C1: troglitazone | ‐ | I1: 12 C1: 10 T: 22 | ‐ | ‐ | ‐ | N/A |
| Sutton 2002 h | I1: glibenclamide C1: rosiglitazone | 351 | I1: 99 C1: 104 T: 203 | I1: 99 C1: 104 T: 203 | I1: 3 C1: 2 T: 5 | I1: 65 C1: 64 T: 129 | I1: 66 C1: 62 T: 64 |
| Tan 2004 | I1: glimepiride C1: pioglitazone | 584 | I1: 123 C1: 121 T: 244 | I1: 92 C1: 100 T: 192 | I1: 11 C1: 6 T: 17 | I1: 89 C1: 87 T: 176 | I1: 72 C1: 72 T: 72 |
| Tan 2004a | I1: glimepiride C1: pioglitazone | ‐ | I1: 109 C1: 91 T: 200 | I1: 109 C1: 91 T: 200 | ‐ | I1: 68 C1: 55 T: 123 | I1: 62 C1: 60 T: 62 |
| Tan 2005 i | I1: gliclazide C1: pioglitazone | 2412 | I1: 297 C1: 270 T: 567 | ‐ | I1: 4 C1: 2 T: 6 | I1: 127 C1: 147 T: 274 | I1: 43 C1: 54 T: 48 |
| Tang 2004 | I1: glimepiride C1: metformin | ‐ | I1: 33 C1: 29 T: 62 | ‐ | ‐ | ‐ | N/A |
| Teramoto 2007 | I1: glibenclamide C1: pioglitazone | 126 | I1: 46 C1: 46 | I1: 41 C1: 39 T: 80 | ‐ | I1: 41 C1: 39 T: 80 | I1: 89 C1: 85 T: 86 |
| Tessier 1999 | I1: gliclazide C1: metformin | ‐ | I1: 19 C1: 20 T: 39 | ‐ | I1: 1 C1: 2 T: 3 | I1: 18 | I1: 94.7 |
| Tosi 2003 | I1: glibenclamide C1: metformin | ‐ | I1: 22 C1: 22 T: 44 | ‐ | ‐ | I1: 20 C1: 19 T: 39 | I1: 91 C1: 86 T: 89 |
| UGDP 1970 | I1: tolbutamide C1: placebo C1: insulin | ‐ | I1: 204 C1: 205 C2: 210 T: 619 | I1: 75% on tolbutamide C1: 75% on placebo C2: ‐ T: ‐ | ‐ | ‐ | N/A |
| UKPDS 1998 j | Study 1: I1: chlorpropamide I2: glibenclamide I3: glipizide C1: insulin | 7616 | I1: 788 I2: 615 I3: 170 C1: 1156 T: 2729 | ‐ | ‐ | ‐ | N/A |
| UKPDS 34 1998 | I1: chlorpropamide I2: glibenclamide C1: metformin C2: insulin | 4209 | I1: 265 I2: 277 C1: 342 C2: 409 T: 1293 | ‐ | I1: ‐ I2: ‐ C1: ‐ C2: ‐ T: 13 | ‐ | N/A |
| van de Laar 2004 | I1: tolbutamide C1: acarbose | 144 | I1: 50 C1: 48 T: 98 | I1: 48 C1: 48 T: 96 | I1: 5 C1: 16 T: 21 | I1: 43 C1: 32 T: 75 | I1: 86 C1: 67 T: 77 |
| Watanabe 2005 | I1: glibenclamide C1: pioglitazone | ‐ | I1: 15 C1: 15 | I1: 14 C1: 13 | I1: 1 C1: 2 | I1: 14 C1: 13 | I1: 93 C1: 87 |
| Wolffenbuttel 1989 | I1: tolbutamide C1: insulin | ‐ | I1: 6 C1: 7 T: 13 | ‐ | ‐ | ‐ | N/A |
| Wolffenbuttel 1999 | I1: glibenclamide C1: repaglinide | 491 | I1: 140 C1: 288 | I1: 139 C1: 286 | ‐ | I1: 109 C1: 211 T: 320 | I1: 78 C1: 74 T: 75 |
| Yamanouchi 2005 | I1: glimepiride C1: pioglitazone C2: metformin | ‐ | I1: 37 C1: 38 C2: 39 T: 114 | ‐ | I1: 3 C1: 0 C2: 1 T: 4 | I1: 34 C1: 35 C2: 37 T: 106 | I1: 92 C1: 92 C2: 95 T: 93 |
| Zhang 2005 | I1: glipizide C1: rosiglitazone 4 mg C2: rosiglitazone 8 mg | 45 | I1: 8 C1: 8 C2: 8 T: 24 | I1: 8 C1: 8 C2: 8 T: 24 | I1: 0 C1: 0 C2: 0 T: 0 | I1: 8 C1: 8 C2: 8 T: 24 | I1: 100 C1: 100 C2: 100 T: 100 |
| Totalk | I: any sulphonylurea C: any comparator | I: 9707 C: 12,805 T:22,589 | I: 4901 C: 6888 T:11,789 | ||||
"‐" denotes not reported
aThe number of participants finishing the trial is taken from clinicaltrials.gov and is the number of individuals who completed the trial as defined by investigator.
bTwenty of the randomised participants are not included in the analysis. It is unknown to which group they belong. Therefore the total number of randomised participants does not equal the sum of the number of randomised patients in each intervention group.
cThe number of randomised participants to each comparator group is not reported. Only the 18 participants finishing the trial are described in the publication.
dIt is reported that 25 participants were randomised, but only the 22 participants who completed the trial are presented.
eData after 52 weeks of double‐blind intervention. From the double‐blind intervention period to the open‐label extension of 91 weeks 84 participants discontinued in the glimepiride group, 70 in the liraglutide 1.2 mg group and 71 in the liraglutide 1.8 mg group.
fIt is not described in the publication to which group the three patients who were lost to follow‐up belonged. However, it is stated in the publication that 100 participants were randomised.
gA total of 72 participants underwent randomisation, but only 55 participants are included in the analyses of the trial. Eleven participants were excluded because they had received sulphonylurea previously, but the authors did not report to which group they initially were randomised.
hIn the publication there is a discrepancy in the number of participants finishing the study.
iThe number of patients screened is the number screened to the initial 52 weeks (Charbonnel 2005).
jThe numbers for chlorpropamide and insulin interventions are the number of participants randomised to 'Glucose Study 1' plus the number of participants randomised to 'Glucose Study 2'. Lost to follow‐up mortality is not explicitly explained for each antidiabetic intervention group. For 'Glucose Study 1' vital status was unknown for 57 participants in the intensive intervention group (chlorpropamide/glibenclamide/insulin).
kThe number of total is not the same as the number of I and C together, as some of the trials only reported the total number of participants randomised (Fineberg 1980; Hermann 1991; Pagano 1995). Several trials did not report the number of participants finishing study.
ADOPT: A Diabetes Outcome Progression Trial; APPROACH: Assessment on the Prevention of Progression by Rosiglitazone on Atherosclerosis in Type 2 Diabetes Patients with Cardiovascular History; C: control; I: intervention; LEAD‐3: Liraglutide Effect and Action in Diabetes‐3; N/A: not acknowledged; T: total; UKPDS: United Kingdom Prospective Diabetes Study
We converted standard errors and confidence intervals to standard deviations (SD) (Higgins 2008). When no differences in means and SDs were reported from baseline, we used the end‐of follow‐up values (Higgins 2008).
Dealing with duplicate publications
In the case of companion papers of a primary trial, we simultaneously evaluated all available papers together to maximise the information. In cases of doubt, we contacted the corresponding author(s). If no reply or explanation was given, we prioritised the original publication (usually the oldest version).
Assessment of risk of bias in included studies
Methodological quality is defined as the confidence that the design and the report of the randomised clinical trial will restrict bias in the comparisons of the intervention with controls (Moher 1998). According to empirical evidence, the methodological quality of trials is based on sequence generation, allocation concealment, blinding (participants, personnel and outcome assessors), incomplete outcome data, selective outcome reporting and other sources of bias (Gluud 2006; Higgins 2008; Kjaergard 2001; Lundh 2012; Moher 1998; Savovic 2012; Schulz 1995; Wood 2008).
Since there is no sufficiently well‐designed formal statistical method to combine the results of trials with high and low risk of bias, the major approach to incorporating risk of bias assessments in Cochrane reviews is to restrict meta‐analyses to trials at low (or lower) risk of bias (Higgins 2008).
Two authors (BH and LL, TA, JS or DS) independently assessed the risk of bias in each trial (see Figure 2; Figure 3). Any differences in opinion were resolved through discussion with CG, AV, SL or JW. We calculated interrater agreement for allocation concealment.
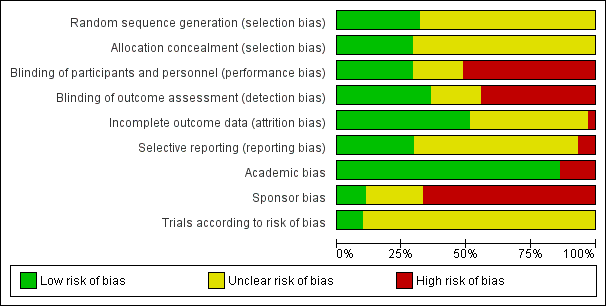
'Risk of bias' graph: review authors' judgements about each risk of bias item presented as percentages across all included studies.

'Risk of bias' summary: review authors' judgements about each risk of bias item for each included study.
We classified risk of bias components as follows:
Sequence generation
-
Low risk of bias, if the allocation sequence is generated by a computer or random number table or similar.
-
Uncertain risk of bias, if the trial is described as randomised, but the method used for the allocation sequence generation was not described.
-
High risk of bias, if a system involving dates, names or admittance numbers is used for the allocation of patients (quasi‐randomised). Such studies were excluded.
Allocation concealment
-
Low risk of bias, if the allocation of patients involves a central independent unit, on‐site locked computer or consecutively numbered sealed envelopes.
-
Uncertain risk of bias, if the trial is described as randomised, but the method used to conceal the allocation is not described.
-
High risk of bias, if the allocation sequence is known to the investigators who assigned participants or if the study is quasi‐randomised. Such studies were excluded.
Blinding
-
Low risk of bias, if the method of blinding is described.
-
Uncertain risk of bias, if the method of blinding is not described.
-
High risk of bias, if the participants or investigators are not blinded.
Incomplete data outcomes
-
Low risk of bias, if it is clearly described if there are any post‐randomisation drop‐outs or withdrawals and the reasons for these drop‐outs are described.
-
Uncertain risk of bias, if it is not clear whether there are any drop‐outs or withdrawals or if the reasons for these drop‐outs are not clear.
-
High risk of bias, if the reasons for missing data are likely to be related to true outcomes, 'as‐treated' analysis is performed, there is potentially inappropriate application of simple imputation, or the potential for patients with missing outcomes to induce clinically relevant bias in effect estimate or effect size.
Selective outcome reporting
-
Low risk of bias, if all the pre‐defined (primary and secondary) outcomes are mentioned in the trial's protocol or in a design article have been reported in the pre‐specified way.
-
Uncertain risk of bias, if there is insufficient information to assess whether the risk of selective outcome reporting is present.
-
High risk of bias, if not all the pre‐specified outcomes are reported or if the primary outcomes are changed or if some of the important outcomes are incompletely reported.
Academic bias
-
Low risk of bias, if the author of the trial has not conducted previous trials addressing the same interventions.
-
Uncertain risk of bias, if it is not clear if the author has conducted previous trials addressing the same interventions.
-
High risk of bias, if the author of the trial has conducted previous trials addressing the same interventions.
Sponsor bias
-
Low risk of bias, if the trial is unfunded or is not funded by an instrument or equipment or drug manufacturer.
-
Uncertain risk of bias, if the source of funding is not clear.
-
High risk of bias, if the trial is funded by an instrument or equipment or drug manufacturer.
Unit of analysis issues
The unit of analysis was patient groups randomised to the interventions in the individual trials. We subjected different units of analysis to subgroup analyses or sensitivity analyses.
Dealing with missing data
We attempted to find missing data by contacting the trial authors and discussed the impact of any missing data.
Intention‐to‐treat analysis is recommended in order to minimise bias in design, follow‐up and analysis of the efficacy of randomised clinical trials. It estimates pragmatically the benefit of a change in treatment policy rather than the potential benefit in patients who receive the treatment exactly as planned (Hollis 1999). Full application of intention‐to‐treat is possible when complete outcome data are available for all randomised participants. Despite the fact that about half of all published reports of randomised clinical trials state that intention‐to‐treat is used, handling of deviations from randomised allocation varies widely and many trials have missing data on the primary outcome variable (Hollis 1999). The methods used to deal with deviations from randomised allocation are generally inadequate, potentially leading to bias (Hollis 1999).
Performing an intention‐to‐treat analysis in a systematic review is not straightforward in practice since review authors must decide how to handle missing outcome data in the contributing trials (Gamble 2005). No consensus exists about how missing data should be handled in intention‐to‐treat analysis, and different approaches may be appropriate in different situations (Higgins 2008; Hollis 1999).
We considered the potential impact of the missing data on the primary outcomes by applying the best‐worst case scenario and the worst‐best case scenario. The 'best‐case' scenario is that all participants with missing outcomes in the experimental intervention group had good outcomes, and all those with missing outcomes in the control intervention group had poor outcomes; the 'worst‐case' scenario is the converse (Higgins 2008).
Assessment of heterogeneity
We evaluated the clinical diversity of the included trials. We identified heterogeneity by visual inspection of the forest plots and by using a standard Chi2 test with a significance level of α = 0.1. We specifically examined heterogeneity with diversity (D2) (Wetterslev 2009) and inconsistency factor ( I2 statistic) (Higgins 2008), where I2 values of 50% and more indicate a substantial level of heterogeneity (Higgins 2008). When heterogeneity was found, we attempted to determine potential reasons for it by examining individual trial characteristics and those of subgroups of the main body of evidence. Diversity (D2) is different from the common quantification of heterogeneity (I2). We used D2 for heterogeneity adjustment of the information size as it leads to a correct and robust estimate of the required information size, whereas I2 used for this purpose may underestimate the required information size (Wetterslev 2009).
We assessed clinical heterogeneity by comparing the trials with regard to different clinical variables: patient characteristics, duration of disease, glycaemic target, targets of other metabolic variables and assessment of outcomes.
When significant clinical, methodological or statistical heterogeneity was found, we surveyed the individual trial in trying to determine potential reasons for it.
We used both the random‐effects model (DerSimonian 1986) and the fixed‐effect model (DeMets 1987). We reported the results for the random‐ and fixed‐effect models for all outcomes. However, when heterogeneity was absent, we only reported the random‐effects model.
Assessment of reporting biases
We used funnel plots to assess for the potential existence of small study bias for the primary outcomes. There are a number of explanations for the asymmetry of a funnel plot (Sterne 2001). Therefore, we carefully interpreted results (Lau 2006).
Data synthesis
We summarised data statistically if they were available, sufficiently similar and of sufficient quality. We performed statistical analysis according to the statistical guidelines referenced in the newest version of the Cochrane Handbook for Systematic Reviews of Interventions (Higgins 2008).
Trial sequential analysis
Cumulative meta‐analyses are subject to random errors due to sparse data and repetitive testing of data (TSA Manual 2011). Trial sequential analysis is a methodology that combines an information size calculation for a meta‐analysis with thresholds of statistical significance as data accumulate. Trial sequential analysis is a tool for quantifying the statistical reliability of data in a cumulative meta‐analysis adjusting statistical significance levels for sparse data and repetitive testing on accumulating data. We conducted trial sequential analysis on the primary outcomes and the secondary outcomes showing statistical significance in both the random‐effects model and fixed‐effect model (Brok 2009; Pogue 1997; Pogue 1998; Thorlund 2009; Wetterslev 2008).
Meta‐analysis may result in type I errors due to random errors due to sparse data or repeated significance testing when updating meta‐analysis with new trials (Brok 2009; Wetterslev 2008). Bias (systematic error) from trials with low methodological quality, outcome measure bias, publication bias and small trial bias may also result in spurious P values (Brok 2009; Higgins 2008; Wetterslev 2008).
In a single trial, interim analysis increases the risk of type I errors. To avoid type I errors, group sequential monitoring boundaries are applied to decide whether a trial could be terminated early because of a sufficiently small P value that is the cumulative Z‐curve crosses the monitoring boundaries (Lan 1983). Sequential monitoring boundaries can be applied to meta‐analysis as well, called trial sequential monitoring boundaries (Wetterslev 2008).
The idea in trial sequential analysis is that if the cumulative Z‐curve crosses the trial sequential alpha‐spending boundary, a sufficient level of evidence is reached and no further trials may be needed (firm evidence). If the Z‐curve does not cross the alpha‐spending boundary then there is insufficient evidence to reach a conclusion about the difference between the interventions. Here the Z‐curve may not reach or may cross the trial sequential beta‐spending monitoring boundary. In the latter case futility may be declared. To construct the trial sequential monitoring boundaries, the required information size is needed and is calculated as the least number of participants needed in a well‐powered single trial (Brok 2009; Pogue 1997; Pogue 1998; TSA Manual 2011; TSA Program 2011; Wetterslev 2008). Additionally, trial sequential analysis provides information regarding the need for additional trials and the sample size of such trials.
We applied trial sequential monitoring boundaries according to a diversity‐adjusted required information size (Wetterslev 2009) suggested by the intervention effect estimated with a 10% relative risk reduction (RRR) employing α = 0.05, ß = 0.20 and the incidence in the control intervention group (binary outcomes) from the cumulative meta‐analysis. For the continuous outcomes we tested the evidence of the achieved difference in the cumulative meta‐analysis. We used the diversity measured in the traditional meta‐analysis to adjust the required information size.
Subgroup analysis and investigation of heterogeneity
We conducted subgroup analyses if one of the primary outcome measures demonstrated statistically significant differences between intervention groups. Subgroup analyses were clearly marked as a hypothesis‐generating exercise.
We conducted the following subgroup analyses.
-
Duration of the intervention (short (equal to or greater than 24 weeks and less than two years) compared to long (equal to or greater than two years)).
-
Drug‐naive patients compared to patients who had previously received glucose‐lowering drugs.
-
Trials with adequate sequence generation, allocation concealment and blinding compared to trials with inadequate sequence generation, allocation concealment or blinding.
-
Trials not allowing the addition of other glucose‐lowering drugs during follow‐up compared to trials allowing addition of other glucose‐lowering drugs during follow‐up.
Tests of interaction determined the difference in intervention effects of subgroups (Altman 2003).
Sensitivity analysis
We planned to perform sensitivity analyses for the primary outcomes.
-
Repeating the analysis excluding the trial with longest duration or the largest trial to establish how much they influence the results.
-
Repeating the analysis using the following filters: diagnostic criteria, language of publication, source of funding (industry versus other).
-
Repeating the analysis excluding unpublished trials.
Results
Description of studies
Results of the search
The initial search of the databases identified 7409 records after duplicates were removed. Most of the references were excluded on the basis of their titles and abstracts because they clearly did not meet the inclusion criteria (Figure 1). Two hundred and twenty‐five of the references were evaluated as full text. After screening the full text, 72 randomised trials described in 121 publications met our inclusion criteria. One of the references was an approval letter (FDA 2000), which identified two unpublished trials (AGEE/DCD/046/UK; AGEE/DCD/047/B/F/I). Sixty‐two trials were exclusively published in English. The remaining trials were exclusively or partly published in other languages: three in German (Hoffmann 1990; Rosenthal 2002; Spengler 1992), three in Chinese (Deng 2003; Tang 2004; Zhang 2005), one in Japanese (Kanda 1998) and one in Italian (Pagano 1995). For the two unpublished trials, we received a description from the sponsor in English (AGEE/DCD/046/UK; AGEE/DCD/047/B/F/I).
Abstracts from the American Diabetes Association (ADA) and European Association for the Study of Diabetes (EASD) conferences provided no additional references. One additional reference was obtained from the US Food and Drug Administration (FDA) homepage (FDA 2000). The reference referred to an approval letter for repaglinide. Five phase III trials were described in the letter and were conducted by a pharmaceutical company comparing second‐generation sulphonylureas with repaglinide. We asked the company for additional information. Three of the five trials described in the approval letter were already published and identified through the search in the databases (Madsbad 2001; Marbury 1999; Wolffenbuttel 1999). The remaining two trials were never published (AGEE/DCD/046/UK; AGEE/DCD/047/B/F/I).
No health technology assessment report was found for sulphonylureas. No previous meta‐analysis has focused on the effects of sulphonylurea monotherapy. We screened a meta‐analysis focusing on sulphonylureas for additional references (Gangji 2007), but no additional references were found. We retrieved one meta‐analysis in Chinese about glimepiride (Liu 2009). This meta‐analysis did not provide any additional information. We searched one comprehensive meta‐analysis comparing all antidiabetic interventions, which did not provide additional references (Bolen 2007). We searched Cochrane reviews about antidiabetic interventions for additional references (Black 2007; Liu 2002; Ooi 2010; Richter 2006; Richter 2007; Richter 2008; Saenz 2005; Van de Laar 2005). Van de Laar et al provided an additional reference to one included trial (Mauersberger 2001), which described the trial from Rosenthal 2002 (Rosenthal 2002). Moreover, an additional reference to Spengler 1992 was retrieved (Spengler 1992) from van de Laar et al (Van de Laar 2005). The Cochrane review by Liu et al, which focused on the effects of Chinese herbs in T2DM (Liu 2002) provided a trial in Chinese comparing glibenclamide monotherapy with a Chinese herb (Deng 2003). Only the Cochrane review from van de Laar gave supplemental information, as they had retrieved some unpublished data from trials, where we could not get any (Van de Laar 2005). Van de Laar et al had extracted two publications as one trial, as they had information from the authors of the publications that they were describing the same trial (Hoffmann 1990). The review from Saenz et al provided data from the United Kingdom Prospective Diabetes Study (UKPDS) 34 for end of follow‐up values of fasting blood glucose, HbA1c and weight (Saenz 2005). We could not find these data, and through correspondence we were informed that they were read from a figure. We could, however, not find the same numbers in the figure, and the numbers were therefore not included.
We tried to retrieve protocols of all included trials from ClinicalTrials.gov (www.clinicaltrials.gov). Protocols for six trials were retrieved by this search or by a reference in the publication (ADOPT 2006; APPROACH 2010; Foley 2009; Kaku 2011; LEAD‐3 2006; Shihara 2011).
A total of 225 references were finally evaluated in full text. Of these, 121 references described 72 included trials. One hundred and four references described 103 excluded trials (Figure 1). The remaining references could be excluded based on title or abstract (n = 7184).
We sent all authors of the included trials a reference list and a request for information on additional trials of relevance, if possible.
Inter‐rater agreement between the two trial selectors was 80.8%, using a kappa statistic (Cohen 1960).
Included studies
We included 72 trials, of which 70 trials provided data for meta‐analyses. All were randomised clinical trials assessing the effect of sulphonylurea monotherapy versus a comparator in patients with T2DM. A total of 22,589 participants were included, of which 9707 were randomised to sulphonylurea monotherapy and 12,805 were randomised to a comparator (Table 1). For full details please see the table Characteristics of included studies.
Trial designs
All 72 included trials were randomised clinical trials. Four of the trials had a cross‐over design (Diehl 1985; Hermann 1991; Tosi 2003; Wolffenbuttel 1989). The remaining trials had a parallel design. Twenty‐eight of the trials were described as open‐labelled (Alvarsson 2010; Birkeland 2002; Campbell 1994; Collier 1989; Derosa 2004; Esposito 2004; Feinböck 2003; Fineberg 1980; Forst 2003; Forst 2005; Harrower 1985; Hermann 1991; Hoffmann 1990; Hollander 1992; Kanda 1998; Lawrence 2004; Memisogullari 2009; Salman 2001; Shihara 2011; Spengler 1992; Sutton 2002; Tang 2004; Teramoto 2007; Tessier 1999; UKPDS 1998; UKPDS 34 1998; Wolffenbuttel 1989; Zhang 2005) and 28 trials were designed to blind investigators and participants (ADOPT 2006; AGEE/DCD/046/UK; AGEE/DCD/047/B/F/I; APPROACH 2010; Birkeland 1994; Charbonnel 2005; Coniff 1995; DeFronzo 1995; Deng 2003; Derosa 2003; Ebeling 2001; Foley 2009; Hanefeld 2011; Hermann 1991a; Jain 2006; Johnston 1997; Madsbad 2001; Marbury 1999; Nakamura 2006; Nathan 1988; Pagano 1995; Perriello 2007; Segal 1997; Tan 2004; Tan 2004a; Tosi 2003; van de Laar 2004; Wolffenbuttel 1999). Ten of the trials did not describe blinding (Abbatecola 2006; Dalzell 1986; Diehl 1985; Jibran 2006; Kamel 1997; Nakamura 2004; Rosenthal 2002; Sung 1999; Watanabe 2005; Yamanouchi 2005). One of the trials involved a placebo group, and we judged this trial to have blinded investigators and participants (Kamel 1997). We classified the remaining trials as open‐label based on the interventions and how they were applied (Abbatecola 2006; Dalzell 1986; Diehl 1985; Jibran 2006; Nakamura 2004; Rosenthal 2002; Sung 1999; Watanabe 2005; Yamanouchi 2005).
Two trials had different blinding of the comparisons (glibenclamide, placebo and acarbose) (Hoffmann 1994; Kovacevic 1997). In both trials the participants and the investigators were blinded for the comparison of acarbose versus placebo, but the investigators were not blinded for glibenclamide (Hoffmann 1994; Kovacevic 1997). The University Group Diabetes Program (UGDP) trial had both investigators and participants blinded for the evaluation of tolbutamide versus placebo, but insulin was applied in an open‐label design (UGDP 1970). One trial consisted of a trial period with blinding of investigators and participants for 24 weeks, followed by an open‐label period (28 weeks) (Kaku 2011). Charbonnel blinded investigators and participants for 52 weeks (Charbonnel 2005). Some of the included trial centres in the Charbonnel 2005 trial were invited to continue for an additional 52 weeks (Tan 2005). The baseline data we report from Tan 2005 are taken after the participants have been included for 52 weeks of Charbonnel 2005 (Charbonnel 2005; Tan 2005). The Liraglutide Effect and Action in Diabetes‐3 (LEAD‐3) trial had investigators and participants blinded for the first 52 weeks and had a 91‐week open‐label extension period (LEAD‐3 2006). Because of a large number of participants lost to follow‐up during the extension period, we choose only to include data from the blinded period. A few of the outcomes were only reported after 104 weeks: non‐fatal myocardial infarction, mild hypoglycaemic and adverse events.
The trials were primarily conducted in Europe. The number of clinical sites varied from 1 to 488 in the individual trials.
The duration of the intervention period varied from 24 weeks to 10.7 years (UKPDS 1998).
Trial participants
The definition of T2DM was not reported in most trials. In the UGDP trial, T2DM diagnosis was based on the sum of four glucose values from a glucose tolerance test. As a result of this definition, participants with impaired glucose tolerance were included in the trial (UGDP 1970). The main criterion for diagnosis in the UKPDS was based on two fasting glucose values (UKPDS 1998). This definition of T2DM was less stringent than the World Health Organization (WHO) criteria (WHO 1985). All participants in the UGDP and UKPDS had a dietary run‐in period of four weeks and three months, respectively. In the UGDP trial, participants who developed symptomatic hyperglycaemia were excluded. In the UKPDS trial, the participants with fasting blood glucose of 6.1 to 15.0 mmol/L after three months on a diet were randomised to the trial interventions (UKPDS 1998). The ADOPT trial did not clearly describe how the diagnosis of T2DM was established, but it had to be established within three years from screening to participation to the trial. Eligibility was determined on the fasting blood glucose, and if it was between 7 to 13 mmol/L, then the patient entered a four‐week run‐in period with diet and exercise reinforcement. If the fasting blood glucose was between 7 to 10 mmol/L after the four‐week run‐in period, then the participants were eligible for randomisation (ADOPT 2006).
The duration of T2DM at entry into the trials ranged from newly diagnosed diabetes to a mean disease duration of 17 years (Nakamura 2004).
Most exclusion criteria consisted of liver disease, kidney disease or other severe concurrent illnesses.
The mean age of the participants of the included trials varied from 40.3 years to 74.4 years (Abbatecola 2006; Kanda 1998).
Characteristics of the interventions
First‐generation sulphonylureas were applied either as tolbutamide (six trials) (Coniff 1995; Dalzell 1986; Fineberg 1980; UGDP 1970; van de Laar 2004; Wolffenbuttel 1989) or chlorpropamide (four trials) (Diehl 1985; Harrower 1985; UKPDS 1998; UKPDS 34 1998).
A second‐generation sulphonylurea was used in most trials (Abbatecola 2006; ADOPT 2006; AGEE/DCD/046/UK; AGEE/DCD/047/B/F/I; Alvarsson 2010; APPROACH 2010; Birkeland 1994; Birkeland 2002; Campbell 1994; Charbonnel 2005; DeFronzo 1995; Deng 2003; Ebeling 2001; Esposito 2004; Fineberg 1980; Foley 2009; Hanefeld 2011; Harrower 1985; Hermann 1991; Hermann 1991a; Hoffmann 1990; Hoffmann 1994; Hollander 1992; Jain 2006; Jibran 2006; Johnston 1997; Kaku 2011; Kanda 1998; Kamel 1997; Kovacevic 1997; Lawrence 2004; Madsbad 2001; Marbury 1999; Memisogullari 2009; Nakamura 2004; Nakamura 2006; Nathan 1988; Pagano 1995; Perriello 2007; Rosenthal 2002; Salman 2001; Segal 1997; Spengler 1992; Sung 1999; Sutton 2002; Tan 2004a; Tan 2005; Teramoto 2007; Tessier 1999; Tosi 2003; UKPDS 1998; UKPDS 34 1998; Watanabe 2005; Wolffenbuttel 1999; Zhang 2005). Glibenclamide was applied in most trials (Abbatecola 2006; ADOPT 2006; AGEE/DCD/046/UK; Alvarsson 2010; Birkeland 1994; Birkeland 2002; DeFronzo 1995; Deng 2003; Ebeling 2001; Esposito 2004; Forst 2003; Hanefeld 2011; Harrower 1985; Hermann 1991; Hermann 1991a; Hoffmann 1990; Hoffmann 1994; Hollander 1992; Jain 2006; Jibran 2006; Johnston 1997; Kaku 2011; Kamel 1997; Kovacevic 1997; Marbury 1999; Nakamura 2004; Nakamura 2006; Nathan 1988; Pagano 1995; Rosenthal 2002; Segal 1997; Spengler 1992; Sung 1999; Sutton 2002; Tan 2004a; Teramoto 2007 ; Tosi 2003; UKPDS 1998; UKPDS 34 1998; Watanabe 2005; Wolffenbuttel 1999). Glipizide was applied in nine trials (APPROACH 2010; Birkeland 1994; Campbell 1994; Feinböck 2003; Fineberg 1980; Harrower 1985; Madsbad 2001; UKPDS 1998; Zhang 2005). Gliclazide was applied in 13 trials (AGEE/DCD/047/B/F/I; Charbonnel 2005; Collier 1989; Foley 2009; Harrower 1985; Kamel 1997; Kanda 1998; Lawrence 2004; Memisogullari 2009; Perriello 2007; Salman 2001; Tan 2005; Tessier 1999). Four trials had more than one intervention group with a second‐generation sulphonylurea (Birkeland 1994; Harrower 1985; Kamel 1997; UKPDS 1998).
A third‐generation sulphonylurea was applied in nine trials (Derosa 2003; Derosa 2004; Feinböck 2003; Forst 2005; LEAD‐3 2006; Shihara 2011; Tan 2004; Tang 2004; Yamanouchi 2005). All trials applied glimepiride as the third‐generation sulphonylurea.
For the UKPDS trial we only included data from the intensive intervention group (allocated treatment with chlorpropamide, glibenclamide, glipizide, metformin or insulin), as the conventional intervention group had another glycaemic target. However, the fasting plasma glucose target was less than 6 mmol/L for the peroral antidiabetic intervention groups in the intensive intervention group, but the insulin‐treated participants had a pre‐meal glucose target of 4 to 7 mmol/L. We concluded that this difference was of minor importance (UKPDS 1998; UKPDS 34 1998).
The UKPDS 34 trial included overweight/obese participants with T2DM comparing intensive glycaemic control with metformin versus intensive glycaemic control with other antidiabetic interventions (chlorpropamide, glibenclamide and insulin) (UKPDS 34 1998). All the data were only reported as metformin versus the other interventions together in the main publication. However, data after three years of follow‐up were included from another publication (UKPDS 34 1998). Data after one year of follow‐up were used in the meta‐analyses of mild and severe hypoglycaemia for both the UKPDS 33 and UKPDS 34 (UKPDS 1998; UKPDS 34 1998). . We included five different comparisons from the UKPDS trial: first‐generation sulphonylurea versus metformin (UKPDS 34 1998), first‐generation sulphonylurea versus insulin (UKPDS 1998), second‐generation sulphonylurea versus metformin (UKPDS 34 1998), second‐generation sulphonylurea versus insulin (UKPDS 1998) and second‐generation sulphonylurea versus first‐generation sulphonylurea (UKPDS 1998).
All the included trials randomised the participants to sulphonylurea monotherapy. Most of the included trials did not allow addition of glucose‐lowering interventions to maintain the glycaemic intervention target and excluded such participants (ADOPT 2006; AGEE/DCD/046/UK; AGEE/DCD/047/B/F/I; Alvarsson 2010; Birkeland 1994; Birkeland 2002; Charbonnel 2005; Coniff 1995; DeFronzo 1995; Derosa 2003; Derosa 2004; Feinböck 2003; Fineberg 1980; Hanefeld 2011; Jain 2006; Johnston 1997; Kaku 2011; Lawrence 2004; LEAD‐3 2006; Madsbad 2001; Marbury 1999; Segal 1997; Sutton 2002; Tan 2004; Tan 2004a; Tan 2005; Teramoto 2007; Tosi 2003; van de Laar 2004; Wolffenbuttel 1999; Yamanouchi 2005). However, some trials allowed the addition of an escape medicine of varying degrees (APPROACH 2010; Hermann 1991a; Hollander 1992; UGDP 1970; UKPDS 1998; UKPDS 34 1998; Wolffenbuttel 1989). In the UGDP trial addition of escape medicine was only allowed if the hyperglycaemia was associated with other clinical signs or symptoms, and the escape was one or more prescriptions for insulin during the trial (UGDP 1970). The sulphonylurea was continued unchanged. For the Glucose I trial half of the participants randomised to sulphonylurea were allocated to chlorpropamide (maximum 500 mg daily) and half to glibenclamide (maximum 10 mg twice daily) (UKPDS 1998). Until 1989, monotherapy was used if feasible but when maximal sulphonylurea doses were given and either the fasting plasma glucose rose to more than 15 mmol/L or symptoms developed, metformin was then added. From 1990 an amendment was made to maintain improved blood glucose control for a longer time in symptom‐free sulphonylurea‐allocated patients who developed fasting plasma glucose greater than 6 mmol/L on the maximal dose in the Glucose I trial. These patients were randomly allocated, half to the addition of metformin aiming for less than 6 mmol/L while the other half continued on sulphonylurea alone until the fasting plasma glucose was elevated to greater than 15 mmol/L or symptoms developed (UKPDS 1998). If the participants allocated to metformin monotherapy developed marked hyperglycaemia, glibenclamide was added with the aim of maintaining fasting plasma glucose below 6.0 mmol/L. If marked hyperglycaemia again developed, the patient was changed to insulin. For the participants in the Glucose II trial ultralente insulin was added if a patient on maximal sulphonylurea dose (chlorpropamide 500 mg once daily, glipizide 20 mg twice daily) had a mean of three successive fasting plasma glucose values above 108 mg/dl (6.0 mmol/L) (UKPDS 1998). In the Hollander 1992 trial, seven patients in the sulphonylurea group were switched to insulin due to poor glycaemic control (Hollander 1992). For the Hermann et al trial, 13 patients in both the sulphonylurea group and the metformin group required add‐on therapy, but it was not further specified (Hermann 1991a). In the Assessment on the Prevention of Progression by Rosiglitazone on Atherosclerosis in Type 2 Diabetes Patients with Cardiovascular History (APPROACH) trial, 153 patients in the sulphonylurea and 152 in the pioglitazone group had metformin added (APPROACH 2010).
For the remaining included trials it was not clearly described if any of the participants had intervention failure to monotherapy, and what happened or would have happened in such case.
The APPROACH trial titrated all prior oral antidiabetic medications down by 50% at randomisation and they were discontinued one month after randomisation. The participants were therefore not exclusively treated with monotherapy at entry into the trial (APPROACH 2010).
The UGDP trial had a biguanide (phenformin) group that was not included in our analyses (UGDP 1970). The reason for not including the phenformin group from the UGDP trial was that this intervention was initiated later in the trial (after 18 months). The only insulin group included from the UGDP trial is the one from the 'insulin standard', as the 'insulin variable' was targeting a lower blood glucose level (UGDP 1970).
Excluded studies
Reasons for exclusion of studies are given in Characteristics of excluded studies. One hundred and three studies, described in 104 references, were excluded after further evaluation. The main reasons for exclusions were: the trial was not randomised (n = 37), not comparing interventions of interest (n = 31), duration of intervention less than 24 weeks (n = 31), participants were not patients with T2DM or we could not separate data on those patients with T2DM (n = 5). In three cases, we contacted the authors of the articles for clarification and received information (Chandra 2008; Mazzone 2006; Nissen 2008). For three other excluded studies we contacted the corresponding author to confirm the decision for exclusion, but never received an answer (Langenfeld 2005; Omrani 2005; Shinoda 2009). One of the trials was excluded because the duration of intervention was less than 24 weeks; the author wrote in the publication that data would be reported after one year, but we could not find the publication (Fuchs 1973).
Risk of bias in included studies
We performed the 'Risk of bias' assessment of the included trials using the previously described criteria (please see section, Assessment of risk of bias in included studies). For details of the judgements made for the individual trials, please see Risk of bias in included studies, Figure 2 and Figure 3. When a 'Risk of bias' domain could not be judged as low risk of bias, we asked the authors for additional information.
Random sequence generation
The generation of the allocation sequence was adequately described in 23 trials (ADOPT 2006; APPROACH 2010; Birkeland 1994; Diehl 1985; Esposito 2004; Fineberg 1980; Harrower 1985; Hermann 1991; Hermann 1991a; Hoffmann 1994; Kaku 2011; LEAD‐3 2006; Nakamura 2006; Nathan 1988; Shihara 2011; Spengler 1992; Tan 2004; Tosi 2003; UGDP 1970; UKPDS 1998; UKPDS 34 1998; van de Laar 2004; Yamanouchi 2005). The remaining 49 trials were described as randomised but the method for sequence generation was not adequately described.
Allocation
The method used to conceal allocation was adequately described in 21 trials (ADOPT 2006; APPROACH 2010; Birkeland 1994; Derosa 2003; Diehl 1985; Esposito 2004; Fineberg 1980; Hermann 1991a; Kanda 1998; LEAD‐3 2006; Nakamura 2004; Nakamura 2006; Nathan 1988; Tan 2004; Tosi 2003; UGDP 1970; UKPDS 1998; UKPDS 34 1998; van de Laar 2004; Watanabe 2005; Yamanouchi 2005). We judged the method for allocation concealment as unclear in the remaining 51 trials. There was agreement between the authors evaluating allocation concealment.
Blinding
The method of blinding of participants and investigators was adequate in 21 trials (ADOPT 2006; AGEE/DCD/046/UK; AGEE/DCD/047/B/F/I; APPROACH 2010; Birkeland 1994; Charbonnel 2005; Derosa 2003; Hanefeld 2011; Hermann 1991a; Johnston 1997; Madsbad 2001; Marbury 1999; Nakamura 2006; Nathan 1988; Pagano 1995; Perriello 2007; Tan 2004a; Tan 2005; Tosi 2003; van de Laar 2004; Wolffenbuttel 1999). We judged the method of blinding of participants and investigators as unclear or inadequate in the remaining 51 trials.
We judged the method of blinding of outcome assessors as adequate in 26 trials (ADOPT 2006; AGEE/DCD/046/UK; AGEE/DCD/047/B/F/I; APPROACH 2010; Charbonnel 2005; Derosa 2003; Diehl 1985; Esposito 2004; Hanefeld 2011; Harrower 1985; Hermann 1991a; Johnston 1997; Lawrence 2004; Madsbad 2001; Marbury 1999; Nakamura 2006; Nathan 1988; Pagano 1995; Perriello 2007; Tan 2005; Tosi 2003; UGDP 1970; UKPDS 1998; UKPDS 34 1998; van de Laar 2004; Wolffenbuttel 1999). For the remaining 46 trials we judged the blinding of outcome assessors as unclear or inadequate.
Incomplete outcome data
Incomplete data were addressed adequately in 37 trials (Abbatecola 2006; ADOPT 2006; AGEE/DCD/046/UK; AGEE/DCD/047/B/F/I; Alvarsson 2010; APPROACH 2010; Birkeland 1994; Campbell 1994; Coniff 1995; Derosa 2003; Derosa 2004; Feinböck 2003; Foley 2009; Forst 2003; Harrower 1985; Hermann 1991a; Hoffmann 1994; Jain 2006; Kaku 2011; Lawrence 2004; Madsbad 2001; Marbury 1999; Nakamura 2004; Nakamura 2006; Nathan 1988; Perriello 2007; Rosenthal 2002; Shihara 2011; Tan 2004; Tan 2004a; Tan 2005; Tessier 1999; van de Laar 2004; Watanabe 2005; Wolffenbuttel 1999; Yamanouchi 2005; Zhang 2005). For the remaining 35 trials we judged incomplete outcome data as unclear or inadequate.
Selective reporting
We judged selective outcome reporting as adequate in 21 trials (ADOPT 2006; AGEE/DCD/046/UK; AGEE/DCD/047/B/F/I; APPROACH 2010; Birkeland 1994; Diehl 1985; Esposito 2004; Foley 2009; Hermann 1991a; Kaku 2011; LEAD‐3 2006; Madsbad 2001; Marbury 1999; Nakamura 2004; Segal 1997; Tan 2004; Tan 2004a; Tosi 2003; UGDP 1970; van de Laar 2004; Wolffenbuttel 1999). We judged five of the trials as high risk of selective outcome reporting (Birkeland 2002; Nakamura 2006; Shihara 2011; UKPDS 1998; UKPDS 34 1998). We judged the remaining 46 trials as unclear regarding selective outcome reporting.
Other potential sources of bias
We judged 62 of the trials as low risk of academic bias. We judged the risk of academic bias as high in 10 trials (AGEE/DCD/046/UK; AGEE/DCD/047/B/F/I; Hermann 1991a; Hoffmann 1994; Marbury 1999; Nakamura 2004; Nakamura 2006; Tan 2004; Tan 2004a; Tan 2005).
Only eight trials had not received funding from the pharmaceutical industry and we judged them as low risk of sponsor bias (Esposito 2004; Harrower 1985; Kanda 1998; Nakamura 2006; Sung 1999; Tang 2004; UGDP 1970; Zhang 2005). Sixteen of the trials did not report funding source and we judged them as unclear risk of sponsor bias (Abbatecola 2006; Campbell 1994; Dalzell 1986; Deng 2003; Derosa 2003; Derosa 2004; Hoffmann 1990; Hollander 1992; Jibran 2006; Kamel 1997; Kovacevic 1997; Memisogullari 2009; Nakamura 2004; Teramoto 2007; Watanabe 2005; Yamanouchi 2005). More than half of the trials received funding from the pharmaceutical industry (ADOPT 2006; AGEE/DCD/046/UK; AGEE/DCD/047/B/F/I; Alvarsson 2010; APPROACH 2010; Birkeland 1994; Birkeland 2002; Charbonnel 2005; Collier 1989; Coniff 1995; DeFronzo 1995; Diehl 1985; Ebeling 2001; Feinböck 2003; Fineberg 1980; Foley 2009; Forst 2003; Forst 2005; Hanefeld 2011; Hermann 1991; Hermann 1991a; Hoffmann 1994; Jain 2006; Johnston 1997; Kaku 2011; Lawrence 2004; LEAD‐3 2006; Madsbad 2001; Marbury 1999; Nathan 1988; Pagano 1995; Perriello 2007; Rosenthal 2002; Salman 2001; Segal 1997; Shihara 2011; Spengler 1992; Sutton 2002; Tan 2004; Tan 2004a; Tan 2005; Tessier 1999; Tosi 2003; UKPDS 1998; UKPDS 34 1998; van de Laar 2004; Wolffenbuttel 1989; Wolffenbuttel 1999).
Overall risk of bias
None of the trials was assessed as low risk of bias on all bias domains. We divided the trials according to our protocol into those with a lower risk of bias and those with high risk of bias based on the assessment of sequence generation, allocation concealment and blinding (participants, investigators and outcome assessors) ‐ see 'Trials according to risk of bias' in Figure 2. These bias domains were all assessed as low risk of bias in only seven trials (ADOPT 2006; APPROACH 2010; Hermann 1991a; Nakamura 2006; Nathan 1988; Tosi 2003; van de Laar 2004).
Effects of interventions
See: Summary of findings for the main comparison Summary of findings (first‐generation sulphonylureas); Summary of findings 2 Summary of findings (second‐generation sulphonylureas); Summary of findings 3 Summary of findings (third‐generation sulphonylureas)
First‐generation sulphonylureas versus placebo
Two trials included a comparison of a first‐generation sulphonylurea versus placebo (Coniff 1995; UGDP 1970). Both trials were judged as high risk of bias (Coniff 1995; UGDP 1970). Both applied tolbutamide as the first‐generation sulphonylurea. All‐cause mortality was not significantly influenced by tolbutamide (random relative risk (RR) 1.46, 95% confidence interval (CI) 0.87 to 2.45; 553 participants, 2 trials, Analysis 1.1: subgroup 1). Heterogeneity was absent (I2 = 0%; P = 0.65). Trial sequential analysis showed that only 1.5% of the diversity‐adjusted required information size to detect or reject a 10% relative risk reduction (RRR) was accrued. Funnel plots could not be drawn. Best‐worst case and worst‐best case scenarios for all‐cause mortality could not be performed, as it was not reported how many participants had unknown mortality status at the end of follow‐up (Coniff 1995; UGDP 1970).
Cardiovascular mortality showed benefit in favour of placebo (random RR 2.63, 95% CI 1.32 to 5.22; P = 0.006; 553 participants, 2 trials, Analysis 1.4: subgroup 1). Heterogeneity was absent (I2 = 0%; P = 0.93). Trial sequential analysis showed that only 0.7% of the diversity‐adjusted required information size to detect or reject a 10% RRR was accrued. Funnel plots could not be drawn. Best‐worst case and worst‐best case scenarios could not be performed for cardiovascular mortality, as it was not reported how many participants had unknown mortality status at the end of follow‐up (Coniff 1995; UGDP 1970).
We did not conduct subgroup analyses due to lack of data. Sensitivity analyses could not be performed due to lack of data.
Meta‐analyses of the remaining outcomes could not be conducted due to lack of data. The UGDP trial reported 16 non‐fatal myocardial infarctions in 204 participants allocated to tolbutamide and 20 non‐fatal myocardial infarctions in 205 participants allocated to placebo (UGDP 1970). No participants in the tolbutamide or placebo group had any stroke (UGDP 1970). None of the participants from the tolbutamide group in the UGDP trial had amputation of lower extremity, whereas two participants in the placebo group had (UGDP 1970). In the UGDP trial five participants in the sulphonylurea group versus four participants in the placebo group had nephropathy during the trial (UGDP 1970). Fifty participants developed retinopathy in the sulphonylurea group and 54 developed retinopathy in the placebo group (UGDP 1970). Coniff 1995 reported a larger reduction in fasting blood glucose and HbA1c with tolbutamide compared with placebo (fasting blood glucose: mean ‐2.0 mmol/L; standard deviation (SD) 3.1 versus mean 0.1 mmol/L; SD 3.2; HbA1c: mean ‐0.9%; SD 1.04 versus 0.04%; SD 1.02) (Coniff 1995). The UGDP trial reported a rise in blood glucose for both the tolbutamide and the placebo group, but no SDs were provided, so the data could not be included in the analysis (UGDP 1970). The UGDP trial reported more participants with intervention failure from the placebo group (32 participants out of 205) compared with the sulphonylurea group (23 participants out of 204).
First‐generation sulphonylureas versus diet
No trials assessed the effect of first‐generation sulphonylureas versus diet.
First‐generation sulphonylureas versus metformin
Three trials involved a comparison of first‐generation sulphonylurea and a biguanide (Dalzell 1986; UGDP 1970; UKPDS 34 1998). Dalzell 1986 and UKPDS 34 were judged as high risk of bias (Dalzell 1986; UKPDS 34 1998). The only outcome reported from Dalzell 1986 was the fasting blood glucose (Dalzell 1986). The UKPDS trial reported data on the subgroup of overweight/obese participants randomised to chlorpropamide versus metformin (UKPDS 34 1998). Data from the UKPDS 34 are reported after three years of follow‐up. The change in fasting blood glucose from baseline did not show any statistical significance (random mean difference (MD) 0.13 mmol/L, 95% CI ‐0.75 to 1.01; fixed MD 0.03 mmol/L, 95% CI ‐0.31 to 0.37; 482 participants; 2 trials; Analysis 2.13: subgroup 1). Heterogeneity was present (I2 = 84%; P = 0.01). The UKPDS 34 did not report the total number of participants who experienced a mild or severe hypoglycaemic episode at the end of the follow‐up period. We therefore used the number of participants with hypoglycaemic episodes after one year of follow‐up (UKPDS 34 1998). There were two patients experiencing severe hypoglycaemia in the chlorpropamide group and one patient in the metformin group (UKPDS 34 1998). The UGDP trial had a phenformin group, which is not included in the analysis, as this intervention group was implemented in the trial 18 months after the other intervention groups (UGDP 1970).
First‐generation sulphonylureas versus thiazolidinediones
No trials assessed the effect of first‐generation sulphonylureas versus thiazolidinediones.
First‐generation sulphonylureas versus insulin
Four trials investigated the effect of a first‐generation sulphonylurea compared with insulin (Diehl 1985; UGDP 1970; UKPDS 1998; Wolffenbuttel 1989). All four trials were judged as high risk of bias (Diehl 1985; UGDP 1970; UKPDS 1998; Wolffenbuttel 1989). Two of the trials could not contribute any data to the meta‐analysis, as none of the outcomes were reported (Diehl 1985; Wolffenbuttel 1989). The UGDP trial applied tolbutamide and the UKPDS trial applied chlorpropamide as the first‐generation sulphonylurea.
All‐cause mortality was not significantly influenced by the interventions (random RR 1.18, 95% CI 0.88 to 1.59; fixed RR 1.14, 95% CI 0.95 to 1.37; 1944 participants, 2 trials, Analysis 4.1: subgroup 1). Funnel plots could not be drawn. Heterogeneity was moderate (I2 = 32%; P = 0.23). D2 was 61%. Trial sequential analysis showed that only 5.7% of the required information size to detect or reject a 10% RRR was accrued. Best‐worst case and worst‐best case scenarios for all‐cause mortality could not be performed, as it was not reported how many participants had unknown mortality status at the end of follow‐up (UGDP 1970; UKPDS 1998).
Cardiovascular mortality was not significantly influenced by the interventions (random RR 1.36, 95% CI 0.68 to 2.71; fixed RR 1.14, 95% CI 0.88 to 1.48; 1944 participants, 2 trials, Analysis 4.4: subgroup 1). Funnel plots could not be drawn. Heterogeneity was present (I2 = 75%; P = 0.04). D2 was 86%. Trial sequential analysis showed that only 1.1% of the required information size to detect or reject a 10% RRR was accrued. Best‐worst case and worst‐best case scenarios could not be performed for cardiovascular mortality, as it was not reported how many participants had unknown mortality status at the end of follow‐up (UGDP 1970; UKPDS 1998).
We did not conduct subgroup analyses, as none of the primary outcome measures demonstrated statistically significant differences between the intervention groups. Sensitivity analysis could not be performed due to lack of data.
Non‐fatal myocardial infarction was not significantly influenced by the interventions (random RR 1.08, 95% CI 0.81 to 1.45; 1944 participants, 2 trials, Analysis 4.5: subgroup 1). Heterogeneity was absent (I2 = 0; P = 0.97). Non‐fatal stroke was reported in 56 participants in the UKPDS trial and one participant in the UGDP trial. Meta‐analysis did not show statistical significance (random RR 1.23, 95% CI 0.74 to 2.05; 1944 participants, 2 trials, Analysis 4.6; subgroup 1). Heterogeneity was absent (I2 = 0%; P = 0.43). None of the participants in the tolbutamide and insulin groups of the UGDP trial experienced amputation of the lower extremity, and therefore only the UKPDS trial provided data (five amputations in 619 participants allocated to chlorpropamide versus 15 amputations in 911 participants allocated to insulin) (UGDP 1970; UKPDS 1998). A composite microvascular outcome was reported in the UKPDS trial in 68 participants out of 619 randomised to chlorpropamide and in 77 participants out of 911 participants randomised to insulin (UKPDS 1998). Nephropathy was reported in the UGDP in five participants out of 204 in the tolbutamide group and in no participants of the 210 randomised to insulin (UGDP 1970). In the UGDP trial retinopathy was reported in 50 participants out of 204 randomised to tolbutamide and in 52 participants out of 210 randomised to insulin (UGDP 1970). In the UKPDS trial 55 participants out of 619 randomised to chlorpropamide and 72 participants out of 911 randomised to insulin experienced retinal photocoagulation (UKPDS 1998). The UKPDS trial reported the end of follow‐up value after three years intervention for fasting blood glucose, HbA1c and weight (fasting blood glucose: mean 7.0 mmol/L; standard deviation (SD) 2.2 versus mean 7.4 mmol/L; SD 2.7; HbA1c: mean 6.8%; SD 1.6 versus 7.0%; SD 1.3; weight: mean 77.9 kg; SD 15.1 versus 80.2 kg; SD 15.3). The number of participants with one or more severe hypoglycaemic episodes during the first year of intervention were 2 participants for chlorpropamide and 5 participants for insulin. The UGDP trial reported any cancer and the UKPDS trial reported death due to cancer. The effect estimate of cancer when meta‐analysing the data did not show significant differences in the effect estimate (random RR 0.81, 95% CI 0.29 to 2.27; fixed RR 1.04, 95% CI 0.70 to 1.55; 1944 participants, 2 trials, Analysis 4.20: subgroup 1). The remaining outcomes could not be meta‐analysed due to lack of data.
First‐generation sulphonylureas versus other comparators
Alpha‐glucosidase inhibitor
Two trials assessed the effect of tolbutamide versus an alpha‐glucosidase inhibitor (Coniff 1995; van de Laar 2004). One trial was assessed as high risk of bias (Coniff 1995) and one trial was assessed as lower risk of bias (van de Laar 2004). One death was reported in 246 participants. The death was reported in Coniff 1995. No participants died in the van de Laar trial (van de Laar 2004). Meta‐analysis could not be performed as only one trial reported fatal events. The same was the case for cardiovascular mortality.
The change in fasting blood glucose from baseline was significantly lower with tolbutamide compared with alpha‐glucosidase inhibitor (random MD ‐1.16 mmol/L, 95% CI ‐1.92 to ‐0.41; P = 0.003; 208 participants, 2 trials, Analysis 5.15: subgroup 1). Heterogeneity was absent (I2 = 0%; P = 0.53). Trial sequential analysis showed that firm evidence was established disregarding risk of bias. The change in HbA1c was also in favour of tolbutamide (random MD ‐0.50%, 95% CI ‐0.79 to ‐0.20; P = 0.0009; 208 participants, 2 trials, Analysis 5.16: subgroup 1). Heterogeneity was absent (I2 = 0%; P = 0.35). Trial sequential analysis showed that firm evidence was established disregarding risk of bias.
The risk of adverse events was in favour of tolbutamide (random RR 0.63, 95% CI 0.52 to 0.76; P < 0.00001; 246 participants, 2 trials, Analysis 5.19: subgroup 1). Heterogeneity was absent (I2 = 0%; P = 0.49). The risk of drop‐outs due to adverse events was also increased in favour of the first‐generation sulphonylurea (RR 0.28, 95% CI 0.12 to 0.67; P = 0.004; 246 participants, 2 trials, Analysis 5.21: subgroup 1). Heterogeneity was absent (I2 = 0%; P = 0.34). Trial sequential analysis showed that firm evidence for a 10% RRR was not established.
The remaining outcomes could not be meta‐analysed due to lack of data.
We did not identify other trials comparing first‐generation sulphonylureas with other comparators.
Second‐generation sulphonylureas versus placebo
Seven trials compared a second‐generation sulphonylurea with placebo (Birkeland 1994; Ebeling 2001; Hoffmann 1994; Johnston 1997; Kamel 1997; Kovacevic 1997; Segal 1997). All of the trials were judged as high risk of bias. Two of the trials applied two second‐generation sulphonylureas, which were combined. Birkeland 1994 had two groups with sulphonylureas (a glibenclamide group and a glipizide group) (Birkeland 1994), and Kamel 1997 had a gliclazide and glibenclamide group (Kamel 1997). Glibenclamide was used as the only second‐generation sulphonylurea in the remaining trials (Ebeling 2001; Hoffmann 1994; Johnston 1997; Kovacevic 1997; Segal 1997).
Three trials reported all‐cause mortality (Hoffmann 1994; Johnston 1997; Kovacevic 1997), but only one of the trials reported two deaths in the second‐generation sulphonylurea group, and meta‐analysis could therefore not be performed (Johnston 1997). Meta‐analysis could not be performed for cardiovascular mortality for the same reason (only one death in one trial, Johnston 1997).
The macrovascular and microvascular outcomes could not be meta‐analysed due to lack of data.
Fasting blood glucose was significantly lowered with second‐generation sulphonylureas compared with placebo (random MD ‐1.20 mmol/L, 95% CI ‐1.94 to ‐0.46; P = 0.002; fixed MD ‐1.28 mmol/L, 95% CI ‐1.61 to ‐0.95; P < 0.00001, 214 participants, 5 trials, Analysis 1.10: subgroup 2). Heterogeneity was present (I2 = 65%; P = 0.02). D2 was 80%. Trial sequential analysis showed that firm evidence was established disregarding risk of bias. HbA1c was also significantly reduced with a second‐generation sulphonylurea compared with placebo (random MD ‐1.02%, 95% CI ‐1.32 to ‐0.72; P < 0.00001; fixed MD ‐1.01%, 95% CI ‐1.19 to ‐0.83; P < 0.00001; 214 participants, 5 trials, Analysis 1.11: subgroup 2). Heterogeneity was present (I2 = 39%; P = 0.16). D2 was 66%. Trial sequential analysis showed that firm evidence was established disregarding risk of bias. There was no significant influence on the change of body mass index (BMI) from baseline with a second‐generation sulphonylurea compared with placebo (random MD ‐0.09 kg/m2, 95% CI ‐0.59 to 0.41; fixed MD ‐0.16 kg/m2, 95% CI ‐0.45 to 0.14; 141 participants, 3 trials, Analysis 1.12: subgroup 2). Heterogeneity was present (I2 = 8%, P = 0.34).
Two trials reported adverse events (Kovacevic 1997; Segal 1997). There was no significant difference in the incidence of adverse events between the interventions (random RR 0.91, 95% CI 0.51 to 1.62; 202 participants, 2 trials, Analysis 1.14: subgroup 2). Heterogeneity was absent (I2 = 0%; P = 0.84). The number of drop‐outs due to adverse events did not significantly differ between the interventions (random RR 0.62, 95% CI 0.24 to 1.57; fixed RR 0.62, 95% 0.29 to 1.31; 510 participants, 5 trials, Analysis 1.15: subgroup 2). Heterogeneity was present (I2 = 15%; P = 0.32). Intervention failure was significantly changed in favour of second‐generation sulphonylureas (RR 0.13, 95% CI 0.04 to 0.44; P = 0.001; 385 participants, 3 trials, Analysis 1.19: subgroup 2). Trial sequential analysis showed that firm evidence for a 10% RRR was not established. Heterogeneity was absent (I2 = 0%; P = 0.80). The remaining meta‐analyses could not be performed due to lack of data.
Second‐generation sulphonylureas versus diet
Only one trial compared sulphonylurea therapy (gliclazide) versus diet (Memisogullari 2009). The trial was judged as high risk of bias (Memisogullari 2009). Meta‐analyses for this comparison could not be performed. Both the participants in the intervention group and control group received diet. No participants in any of the intervention groups died. There were no data reported on any of the other outcomes of interest for our systematic review.
Second‐generation sulphonylureas versus metformin
Eleven trials investigated the effect of second‐generation sulphonylureas versus metformin (ADOPT 2006; Campbell 1994; Collier 1989; DeFronzo 1995; Hermann 1991; Hermann 1991a; Kamel 1997; Lawrence 2004; Tessier 1999; Tosi 2003; UKPDS 34 1998). Eight of the trials were judged as high risk of bias (Campbell 1994; Collier 1989; DeFronzo 1995; Hermann 1991; Kamel 1997; Lawrence 2004; Tessier 1999; UKPDS 34 1998) and only three of the trials were judged as lower risk of bias (ADOPT 2006; Hermann 1991a; Tosi 2003). Most of the trials applied glibenclamide as the second‐generation sulphonylurea (ADOPT 2006; Hermann 1991; Hermann 1991a; DeFronzo 1995; Kamel 1997; Tosi 2003; UKPDS 34 1998). Four trials used gliclazide (Collier 1989; Kamel 1997; Lawrence 2004; Tessier 1999). One trial used glipizide (Campbell 1994). From the UKPDS 34 trial data were included after three years of follow‐up, except for hypoglycaemia which were after one year of follow‐up (UKPDS 34 1998). Data from the end of the intervention period of the UKPDS 34 trial could not be included in the analyses (UKPDS 34 1998).
The effect estimate of all‐cause mortality was dominated by the A Diabetes Outcome Progression Trial (ADOPT) trial, which contributed 62 out of 65 fatal events (ADOPT 2006). All‐cause mortality was not significantly influenced by the intervention (random RR 0.98, 95% CI 0.61 to 1.58; 6 trials, 3528 participants, Analysis 2.1: subgroup 2). Heterogeneity was absent (I2 = 0%; P = 0.68). Funnel plots could not be drawn. Sensitivity analysis excluding the trial with the longest duration (ADOPT 2006) did not change the significance of the effect estimate (random RR 0.71, 95% CI 0.11 to 4.42; fixed RR 0.73, 95% CI 0.15 to 3.58). Analysis of the trials not describing how the diagnosis of type 2 diabetes mellitus (T2DM) was established did not show any significance in the effect estimate (random RR 1.01, 95% CI 0.62 to 1.63). Heterogeneity was absent (I2 = 0%; P = 0.59). Only one trial with fatal events stated how the diagnosis of T2DM was established (DeFronzo 1995). Sensitivity analysis according to the language of publication could not be performed, as all trials were published in English. All trials had received funding from the pharmaceutical industry or did not describe how they were funded. Sensitivity analysis according to funding source could therefore not be performed. None of the trials were unpublished, so sensitivity analysis according to publication status could not be performed. Trial sequential analysis showed that only 2.3% of the required information size to detect or reject a 10% RRR was accrued.
The best‐worst case‐scenario and worst‐best case‐scenario analyses were only based on two fatal events from two trials in which all participants had known vital status at the end of follow‐up (Hermann 1991a; Lawrence 2004). The effect estimate did not show any statistical significance (best‐worst case scenario and worst‐best case scenario: random RR 1.02, 95% CI 0.10 to 10.25; fixed RR 1.03, 95% CI 0.15 to 6.87; 4 trials, 207 participants, Analysis 2.2: Analysis 2.3: subgroup 2). Heterogeneity was present (I2 = 6%; P = 0.30).
The comparison of second‐generation sulphonylurea versus metformin did not show statistical significance for cardiovascular mortality (random RR 1.47, 95% CI 0.54 to 4.01; 6 trials, 3528 participants, Analysis 2.4: subgroup 2). The total number of deaths due to cardiovascular disease was 15, of which 12 were from the ADOPT trial (ADOPT 2006). Heterogeneity was absent (I2 = 0%; P = 0.52). Sensitivity analysis excluding the trial with the longest duration (ADOPT 2006) did not change the significance of the effect estimate (random RR 0.71, 95% CI 0.11 to 4.42). Heterogeneity was absent (I2 = 0%; P = 0.50). Analysis of the trials not describing how the diagnosis of T2DM was established did not show any significance in the effect estimate (random RR 1.73, 95% CI 0.60 to 4.97). Heterogeneity was absent (I2 = 0%; P = 0.51). Only one trial with fatal events due to cardiovascular disease stated how the diagnosis of T2DM was established (DeFronzo 1995). Sensitivity analysis according to the language of publication could not be performed, as all trials were published in English. All trials had received funding from the pharmaceutical industry or did not describe how they were funded. Sensitivity analysis according to funding source could therefore not be performed. None of the trials were unpublished, so sensitivity analysis according to publication status could not be performed. Trial sequential analysis showed that 2.7% of the required information size to detect or reject a 10% RRR was accrued.
Subgroup analyses were not conducted, as none of the primary outcome measures demonstrated statistically significant differences between the intervention groups.
Non‐fatal macrovascular outcomes as a composite outcome were not reported in the way we predefined to assess the outcome. The ADOPT trial and Hermann 1991a were reported in a way which may involve other cardiac outcomes than those with arterioslerotic origin (ADOPT 2006; Hermann 1991a). Tosi 2003 reported that no cardiovascular events were recorded during the trial (Tosi 2003). We meta‐analysed the data as non‐fatal macrovascular outcomes and found a statistical significance of the effect estimate in favour of second‐generation sulphonylureas (random RR 0.67, 95% CI 0.48 to 0.93; P = 0.02; 3 trials, 3018 participants, Analysis 2.5: subgroup 2). Heterogeneity was absent (I2 = 0%; P = 0.53). However, the macrovascular outcomes from the ADOPT trial included congestive heart failure (19 participants in the metformin group and nine participants in the glibenclamide group), which might not have an arteriosclerotic origin. Due to the way that 'cardiovascular disease' is reported in the ADOPT trial it is not possible to exclude the number with congestive heart failure. Trial sequential analysis showed that only 5% of the required information size to detect or reject a 10% RRR has been accrued. Thirty‐nine non‐fatal myocardial infarctions were reported, of which 36 were from the ADOPT trial (ADOPT 2006). The effect estimate did not show statistically significant differences (random RR 1.02, 95% CI 0.37 to 2.85; fixed RR 0.87, 95% CI 0.48 to 1.60; 4 trials, 3061 participants, Analysis 2.6: subgroup 2). Heterogeneity was present (I2 = 15%; P = 0.31). The remaining macrovascular and microvascular outcomes could not be meta‐analysed due to lack of data.
The change in fasting blood glucose from baseline showed statistical significance(random MD 0.43 mmol/L, 95% CI 0.10 to 0.75; P = 0.009; fixed MD 0.42 mmol/L, 95% CI 0.28 to 0.56; P < 0.00001; 11 trials, 3891 participants, Analysis 2.13: subgroup 2). Heterogeneity was present (I2 = 44%; P = 0.06). Diversity was 81%. Trial sequential analysis showed that firm evidence for the achieved changes was not present. The change in HbA1c from baseline did not show statistical significance in the random‐effects model, but showed statistical significance in favour of metformin in the fixed‐effect model (random MD 0.17%, 95% CI ‐0.09 to 0.44; fixed MD 0.25%, 95% CI 0.18 to 0.33; P < 0.00001; 10 trials, 3351 participants; Analysis 2.14: subgroup 2). Heterogeneity was present (I2 = 72%; P = 0.0002). One of the trials in the analyses of fasting blood glucose and HbA1c change from baseline allowed the addition of escape medicine when monotherapy failed, but we included only data on the participants who remained on monotherapy (Hermann 1991a). The UKPDS 34 trial also allowed addition of escape medicine in case of monotherapy failure (UKPDS 34 1998). Elimination of this trial from the analysis did not change the significance of the effect estimate for fasting blood glucose.
Change in BMI from baseline did not show statistical significance in the random‐effects model, but showed statistical significance in favour of metformin in the fixed‐effect model (random MD 0.25 kg/m2, 95% CI ‐1.21 to 1.70; fixed MD 0.54 kg/m2, 95% CI 0.06 to 1.03; P = 0.03; 3 trials, 103 participants, Analysis 2.15: subgroup 2). Heterogeneity was present (I2 = 71%; P = 0.03). However, only one of the trials included in the meta‐analysis of changes in BMI from baseline reported the actual change of the mean and standard deviation in each of the intervention groups (Tosi 2003). For the remaining two trials the end of follow‐up values were used (Collier 1989; Lawrence 2004). Both of these trials had relatively small sample size and the sulphonylurea group had lower BMI compared with the metformin group at baseline and at the end of follow‐up. The change in weight from baseline showed statistical significance in favour of metformin (random MD 3.77 kg, 95% CI 3.06 to 4.47; P < 0.00001; fixed MD 3.76, 95% CI 3.35 to 4.48; P < 0.00001; 7 trials, 3497 participants, Analysis 2.16: subgroup 2). Heterogeneity was present (I2 = 39%; P = 0.13); diversity was 65%. Trial sequential analysis showed firm evidence for the achieved reduction of weight disregarding risk of bias.
The effect estimate for adverse events was not significantly influenced by the interventions (random RR 0.99, 95% CI 0.97 to 1.01; 4 trials, 3042 participants, Analysis 2.17: subgroup 2). Heterogeneity was absent (I2 = 0%; P = 0.71). The effect estimate of serious adverse events did not show any significance (random RR 0.94, 95% CI 0.82 to 1.07; 4 trials, 3011 participants, Analysis 2.18: subgroup 2). Six hundred and forty‐one participants reported a serious adverse event, of which 639 were from the ADOPT trial. Heterogeneity was absent (I2 = 0%; P = 0.99). Drop‐outs due to adverse events were not significantly influenced by the interventions, but showed a tendency to favour metformin (random RR 1.19, 95% CI 0.99 to 1.42, 7 trials, 3567 participants, Analysis 2.19: subgroup 2). Heterogeneity was absent (I2 = 0%; P = 0.54).
Mild hypoglycaemia was significantly increased in favour of metformin (random RR 2.95, 95% CI 2.13 to 4.07; P < 0.00001; fixed RR 3.24, 95% CI 2.80 to 3.76; P < 0.00001; 5 trials, 4056 participants, Analysis 2.20: subgroup 2). Heterogeneity was present (I2 = 29%; P = 0.23). D2 was 79%. Trial sequential analysis showed that only 2.9% of the required information size to detect or reject a 10% RRR was accrued so far. Severe hypoglycaemia showed statistical significant differences in favour of metformin (random RR 5.64, 95% CI 1.22 to 26.00; P = 0.03; 4 trials, 3637 participants, Analysis 2.22: subgroup 2). Heterogeneity was absent (I2 = 0%; P = 0.62). Trial sequential analysis showed that only 0.1% of the required information size to detect or reject a 10% RRR was accrued. Due to a relatively large number of participants lost to follow‐up for the hypoglycaemia data in the UKPDS trial, available case analysis was also performed with the UKPDS trial data, which did not change the statistical significance of mild or severe hypoglycaemia.
Intervention failure with monotherapy was not significantly influenced by the interventions in the random‐effects model (random RR 0.97, 95% CI 0.60 to 1.57; 7 trials, 4143 participants, Analysis 2.24: subgroup 2), but showed significance in the fixed‐effect model favouring metformin (fixed RR 1.35, 95% CI 1.17 to 1.55; P < 0.0001). Heterogeneity was present (I2 = 69%; P = 0.006).
Second‐generation sulphonylureas versus thiazolidinediones
Seventeen trials assessed the effect of a second‐generation sulphonylurea versus thiazolidinediones (ADOPT 2006; APPROACH 2010; Charbonnel 2005; Ebeling 2001; Hanefeld 2011; Jain 2006; Lawrence 2004; Nakamura 2004; Nakamura 2006; Perriello 2007; Sung 1999; Sutton 2002; Tan 2004a; Tan 2005; Teramoto 2007; Watanabe 2005; Zhang 2005). Fourteen of the trials were assessed as high risk of bias (Charbonnel 2005; Ebeling 2001; Hanefeld 2011; Jain 2006; Lawrence 2004; Nakamura 2004; Perriello 2007; Sung 1999; Sutton 2002; Tan 2004a; Tan 2005; Teramoto 2007; Watanabe 2005; Zhang 2005). Only three of the trials were judged as lower risk of bias (ADOPT 2006; APPROACH 2010; Nakamura 2006). Charbonnel 2005 was a double‐blind trial lasting for 52 weeks (Charbonnel 2005). Some of the included trial centres in Charbonnel were invited to continue the trial in double‐blind manner for an additional 52 weeks (Tan 2005). The baseline data we report from Tan 2005 are taken after the participants have been included for 52 weeks of Charbonnel 2005 (Tan 2005). For outcomes where both Charbonnel 2005 and Tan 2005 were included, we conducted a sensitivity analysis, excluding Tan 2005 (Charbonnel 2005; Tan 2005).
Most of the trials applied glibenclamide as the second‐generation sulphonylurea (ADOPT 2006; Ebeling 2001; Hanefeld 2011; Jain 2006; Nakamura 2004; Nakamura 2006; Sung 1999; Sutton 2002; Tan 2004a; Teramoto 2007; Watanabe 2005). Four of the trials applied gliclazide (Charbonnel 2005; Lawrence 2004; Perriello 2007; Tan 2005). However, Tan 2005 is an extension of Charbonnel 2005. Two trials applied glipizide (APPROACH 2010; Zhang 2005).
Three different kinds of thiazolidinediones were applied. Most of the trials applied pioglitazone (Charbonnel 2005; Ebeling 2001; Jain 2006; Lawrence 2004; Nakamura 2004; Nakamura 2006; Perriello 2007; Tan 2004a; Tan 2005; Teramoto 2007; Watanabe 2005). Five trials applied rosiglitazone (ADOPT 2006; APPROACH 2010; Hanefeld 2011; Sutton 2002; Zhang 2005) and one trial troglitazone (Sung 1999).
Most of the fatal events were reported by two trials (ADOPT 2006; APPROACH 2010). There was no statistically significant difference of second‐generation sulphonylureas versus thiazolidinediones in the effect estimate of all‐cause mortality (random RR 0.92, 95% CI 0.60 to 1.41; 7 trials, 4955 participants, Analysis 3.1: subgroup 2). Heterogeneity was absent (I2 = 0%; P = 0.62). Sensitivity analysis excluding the trial with the longest duration (ADOPT 2006) did not change the effect estimate (random RR 0.92, 95% CI 0.37 to 2.29). Heterogeneity was absent (I2 = 0%; P = 0.41). Only one trial described how the diagnosis of T2DM was established (APPROACH 2010). Excluding this trial from the analysis did not change the significance of the effect estimates (random RR 0.93, 95% CI 0.58 to 1.49). Heterogeneity was absent (I2 = 0%; P = 0.42). All trials reporting all‐cause mortality were published in English, so sensitivity analysis according to language of publication could not be performed. Sensitivity analysis according to source of funding could not be performed, as all trials were either funded by the pharmaceutical industry or did not report their funding source. Sensitivity analysis according to publication status could not be performed as all trials were published. Trial sequential analysis showed that only 2.5% of the required information size to detect or reject a 10% RRR was accrued. Separate analysis for all‐cause mortality of the trials applying rosiglitazone showed no statistical significance (random RR 0.91, 95% CI 0.59 to 1.40). Heterogeneity was absent (I2 = 0%; P = 0.59). Three trials provided data for this analysis (ADOPT 2006; APPROACH 2010; Hanefeld 2011). For the analysis of the trials applying pioglitazone, only three fatal events were reported. The effect estimate did not show significance (random RR 1.23, 95% CI 0.07 to 20.96; fixed RR 1.39, 95% CI 0.24 to 7.88). Funnel plots could not be drawn. Best‐worst case scenario analysis showed significance in favour of second‐generation sulphonylurea (random RR 0.18, 95% CI 0.06 to 0.54; P = 0.002; fixed RR 0.19, 95% CI 0.09 to 0.38; P < 0.00001; 4 trials, 1252 participants, Analysis 3.2: subgroup 2). Worst‐best case scenario analysis only showed statistical significance in the fixed‐effect model (random RR 9.76, 95% CI 0.59 to 161.27; P = 11; fixed RR 6.09, 95% CI 2.98 to 12.45; P < 0.00001; 4 trials, 1252 participants, Analysis 3.3: subgroup 2).
Twenty‐one events of cardiovascular mortality were reported. There was no statistical significance of second‐generation sulphonylurea versus thiazolidinediones in the effect estimate of cardiovascular mortality (random RR 1.30, 95% CI 0.55 to 3.07; 7 trials, 4955 participants, Analysis 3.4: subgroup 2). Heterogeneity was absent (I2 = 0%; P = 0.62). Analysis according to type of thiazolidinediones applied could not be performed as only one trial applying pioglitazone reported one event (Jain 2006). Sensitivity analysis excluding the longest trial (ADOPT 2006) did not change the significance of the effect estimate (random RR 0.95, 95% CI 0.25 to 3.65). Heterogeneity was absent (I2 = 0%; P = 0.43). Only one trial described how the diagnosis of T2DM was established (APPROACH 2010). Excluding this trial from the analysis did not change the significance of the effect estimate (random RR 1.72, 95% CI 0.60 to 4.94). Heterogeneity was absent (I2 = 0%; P = 0.72). All trials reporting cardiovascular mortality were published in English, so sensitivity analysis according to language of publication could not be performed. Sensitivity analysis according to source of funding could not be performed, as all trials were either funded by the pharmaceutical industry or did not report their funding source. Sensitivity analysis according to publication status could not be performed as all trials were published. Trial sequential analysis showed that only 0.3% of the required information size to detect or reject a 10% RRR was accrued.
We did not perform subgroup analyses.
The definition of the macrovascular outcome from the APPROACH trial included all‐cause mortality; the remaining outcomes in the composite outcome were of atherosclerotic origin (APPROACH 2010). Data from the remaining trials were reported as cardiovascular events (ADOPT 2006; Jain 2006; Perriello 2007; Sutton 2002) (please see Appendix 7). The meta‐analysis of the trials did not show statistical significance in the effect estimate of the interventions (random RR 0.91, 95% CI 0.62 to 1.33; fixed RR 0.87, 95% CI 0.68 to 1.11; 6 trials, 4600 participants, Analysis 3.5: subgroup 2). Heterogeneity was present (I2 = 50%; P = 0.09). The risk of non‐fatal myocardial infarction was not statistically significantly influenced by the interventions (random RR 0.68, 95% CI 0.41 to 1.14; 7 trials, 4956 participants, Analysis 3.6: subgroup 2). Heterogeneity was absent (I2 = 0%; P = 0.94). Separate analysis of the trials applying rosiglitazone (ADOPT 2006; APPROACH 2010; Hanefeld 2011) did not change the statistical significance of the effect estimate (random RR 0.66, 95% CI 0.38 to 1.13). Heterogeneity was absent (I2 = 0%; P = 0.87). The APPROACH trial reported one participant with non‐fatal stroke in 339 participants randomised to sulphonylurea and five participants with non‐fatal stroke in 333 participants randomised to thiazolidinediones (APPROACH 2010). Nakamura 2006 reported zero participants with non‐fatal stroke in both intervention groups (Nakamura 2006). Meta‐analysis of non‐fatal stroke could therefore not be performed. Two trials reported zero participants in both intervention groups for amputation of lower extremity (APPROACH 2010; Nakamura 2006). Cardial revascularisation was reported in 27 participants out of 339 randomised to sulphonylurea and in 26 participants out of 333 randomised to thiazolidinediones in the APPROACH trial (APPROACH 2010). Nakamura reported zero participants with cardial revascularisation in both intervention groups (Nakamura 2006). The ADOPT trial reported 31 participants with peripheral revascularisation out of 1447 participants randomised to sulphonylurea and 36 participants with need of peripheral revascularisation in 1458 participants randomised to thiazolidinediones (ADOPT 2006). Two other trials reported zero participants with peripheral revascularisation in both intervention groups (APPROACH 2010; Nakamura 2006). Only one trial reported data for the composite microvascular outcome with one participant experiencing a microvascular outcome in each intervention group (Tan 2004a). Another trial reported zero participants in each intervention group exploring any microvascular outcomes (Nakamura 2006). Nephropathy was reported in zero of the 339 participants randomised to sulphonylurea and in four of the 333 participants randomised to thiazolidinediones in the APPROACH trial (APPROACH 2010). One participant in each intervention group of the APPROACH trial experienced diabetic retinopathy (APPROACH 2010). None of the participants in any of the intervention groups of the APPROACH trial had any retinal photocoagulation (APPROACH 2010).
The change in fasting blood glucose from baseline showed statistical significance of the effect estimate in favour of thiazolidinediones (random MD 0.56 mmol/L, 95% CI 0.33 to 0.79; P < 0.00001; fixed MD 0.75 mmol/L, 95% CI 0.64 to 0.85; P < 0.00001; 14 trials, 6076 participants, Analysis 3.15: subgroup 2). Heterogeneity was present (I2 = 66%; P = 0.0002). Diversity was 79%. Trial sequential analysis showed that firm evidence was established disregarding risk of bias. Excluding Tan 2005, so that the participants who are analysed in Charbonnel 2005 were not counted twice did not change the statistical significance of the effect estimate (Charbonnel 2005; Tan 2005). Removing the APPROACH trial, which applied additional glucose‐lowering drugs in case of intervention failure did also not change the statistical significance of the effect estimate (APPROACH 2010). The changes in HbA1c did not show statistical significance in the random‐effects model (random MD 0.06%, 95% CI ‐0.090 to 0.20; 17 trials, 6776 participants, Analysis 3.16: subgroup 2). Statistical significance was present in the fixed‐effect model in favour of thiazolidinediones (fixed MD 0.19%, 95% CI 0.14 to 0.24; P < 0.00001). Removing the APPROACH trial, which allowed addition of escape medicine did not change the significance of the effect estimate (APPROACH 2010). Heterogeneity was present (I2 = 85%; P < 0.00001). Excluding Tan 2005, so that the participants in Charbonnel 2005 were not counted twice, did not change the statistical significance of the effect estimate (Charbonnel 2005; Tan 2005).
The change in BMI from baseline was changed in favour of second‐generation sulphonylureas (random MD ‐1.00 kg/m2, 95% CI ‐1.20 to ‐0.80; P < 0.00001; 4 trials, 121 participants, Analysis 3.17: subgroup 2). Heterogeneity was absent (I2 = 0%; P = 0.98). Trial sequential analysis showed that firm evidence was not established. Weight change from baseline was changed in favour of second‐generation sulphonylureas (random MD ‐1.90 kg, 95% CI ‐2.56 to ‐1.25; P < 0.00001; fixed MD ‐2.00 kg, 95% CI ‐2.24 to ‐1.76; P < 0.00001; 10 trials, 5779 participants, Analysis 3.18: subgroup 2). Heterogeneity was present (I2 = 82%; P = 0.00001). Diversity was 87%. Trial sequential analysis showed firm evidence for the achieved reductions of weight disregarding risk of bias. As Tan 2005 is an extension for some of the participants in Charbonnel 2005 we performed a sensitivity analysis with and without the data from Tan 2005 (Charbonnel 2005; Tan 2005), which did not change the significance of the effect estimate.
A total of 5141 participants reported an adverse event. Adverse events did not show significant differences in the effect estimate between the two interventions (random RR 0.99, 95% CI 0.97 to 1.01; fixed RR 0.98, 95% CI 0.96 to 1.01; 10 trials, 6491 participants, Analysis 3.19: subgroup 2). Heterogeneity was low (I2 = 2%; P = 0.42). Most of the participants reporting serious adverse events were from the ADOPT trial (654 out of 909). The effect estimate showed a non‐significant effect in favour of second‐generation sulphonylureas (random RR 0.90, 95% CI 0.80 to 1.01; 8 trials, 4979 participants, Analysis 3.20: subgroup 2). Heterogeneity was absent (I2 = 0%; P = 0.81). Drop‐outs due to adverse events did not show significant differences in the effect estimate in the random‐effects model (random RR 1.15, 95% CI 0.98 to 1.36; 15 trials, 7433 participants, Analysis 3.21: subgroup 2), but showed significant differences in the fixed‐effect model (fixed RR 1.17, 95% CI 1.01 to 1.35; P = 0.03). Heterogeneity was present (I2 = 5%; P = 0.39).
Mild hypoglycaemia was experienced by more participants receiving second‐generation sulphonylureas compared with thiazolidinediones (random RR 4.05, 95% 3.28 to 5.00; P < 0.00001; fixed RR 4.01, 95% CI 3.48 to 4.61; P < 0.00001; 8 trials, 6365 participants, Analysis 3.22: subgroup 2). Heterogeneity was present (I2 = 21%; P = 0.27). Diversity was 55%. Trial sequential analysis showed firm evidence for a 10% RRR in favour of thiazolidinediones disregarding risk of bias. Severe hypoglycaemia was only reported in one participant receiving thiazolidinediones (ADOPT 2006). The risk of severe hypoglycaemia was significantly elevated for the participants receiving a second‐generation sulphonylurea (random RR 6.11, 95% CI 1.57 to 23.79; P = 0.009; 6 trials, 5660 participants, Analysis 3.24: subgroup 2). Heterogeneity was absent (I2 = 0%; P = 0.97). Trial sequential analysis showed that only a minor fraction of the required information size to detect or reject a 10% RRR was accrued.
Cancer was not significantly different between the two interventions (random RR 1.02, 95% CI 0.72 to 1.45; 6 trials, 4912 participants, Analysis 3.25: subgroup 2). Most cancers were reported from the ADOPT trial (110 out of 119), which besides being the largest trial also had a reporting of cancer that might have led to more events being reported compared with APPROACH trial which only reported death due to cancer (ADOPT 2006; APPROACH 2010). Heterogeneity was absent (I2 = 0%; P = 0.79).
The incidence of intervention failure did not significantly differ between the thiazolidinediones and the second‐generation sulphonylureas in the random‐effects model (random RR 1.10, 95% CI 0.73 to 1.65; 8 trials, 6438 participants, Analysis 3.26: subgroup 2), but favoured thiazolidinediones in the fixed‐effect model (fixed RR 1.43, 95% CI 1.28 to 1.59; P < 0.00001).
Nakamura 2006 reported that quality of life was improved in all intervention groups during the trial, but no scale was provided (Nakamura 2006).
Second‐generation sulphonylureas versus insulin
Six trials included a comparison between a second‐generation sulphonylurea versus insulin (Alvarsson 2010; Birkeland 2002; Forst 2003; Hollander 1992; Nathan 1988; UKPDS 1998). Five of the trials were judged as high risk of bias (Alvarsson 2010; Birkeland 2002; Forst 2003; Hollander 1992; UKPDS 1998) and only one of the trials was judged as lower risk of bias (Nathan 1988).
Four trials reported 309 fatal events, of which 98.7% were reported from the UKPDS trial. There was no statistically significant difference between second‐generation sulphonylureas versus insulin in the effect estimate of all‐cause mortality (random RR 0.96, 95% CI 0.79 to 1.18; 4 trials, 1642 participants, Analysis 4.1: subgroup 2). Heterogeneity was absent (I2 = 0%; P = 0.64). Funnel plots could not be drawn. Sensitivity analysis excluding the largest trial (UKPDS 1998) did not change the statistical significance of the effect estimate (random RR 0.40, 95% CI 0.06 to 2.60). Heterogeneity was absent (I2 = 0%; P = 0.89). Only one trial did not report how the diagnosis of T2DM was established (Alvarsson 2010). Excluding this trial did not change the significance of the effect estimate (RR 0.97, 95% CI 0.79 to 1.19). Heterogeneity was absent (I2 = 0%; P = 0.50). All trials reporting all‐cause mortality were published in English, so sensitivity analysis according to language of publication could not be performed. Sensitivity analysis according to source of funding could not be performed, as all the trials were funded by the pharmaceutical industry. Sensitivity analysis according to publication status could not be performed as all trials were published. Trial sequential analysis showed that only 12.8% of the required information size to detect or reject a 10% RRR for all‐cause mortality was accrued. Worst‐best case and best‐worst case scenario analyses could not be performed due to lack of data.
There was no statistical significance of second‐generation sulphonylurea versus insulin in the effect estimate of cardiovascular mortality (random RR 0.96, 95% CI 0.73 to 1.28; 4 trials, 1642 participants, Analysis 4.4: subgroup 2). Heterogeneity was absent (I2 = 0%; P = 0.61). Sensitivity analysis excluding the largest trial (UKPDS 1998) did not change the significance of the effect estimate (random RR 0.31, 95% CI 0.03 to 2.91). Heterogeneity was absent (I2 = 0%; P = 0.89). Only one trial did not report how the diagnosis of T2DM was established (Alvarsson 2010). Excluding this trial with one cardiovascular death did not change the significance of the effect estimate (RR 0.97, 95% CI 0.73 to 1.30). Heterogeneity was absent (I2 = 0%; P = 0.50). All trials reporting cardiovascular mortality were published in English, so sensitivity analysis according to language of publication could not be performed. Sensitivity analysis according to source of funding could not be performed, as all the trials were funded by the pharmaceutical industry. Sensitivity analysis according to publication status could not be performed as all trials were published. Trial sequential analysis showed that only 6.6% of the required information size to detect or reject a 10% RRR was accrued. Funnel plots could not be drawn. Worst‐best case and best‐worst case scenario analyses could not be performed due to lack of data.
We did not conduct subgroup analyses, as none of the primary outcome measures demonstrated statistically significant differences between the intervention groups.
Only one trial reported macrovascular and microvascular outcomes (UKPDS 1998). Therefore, meta‐analyses could not be performed.
Change in fasting blood glucose from baseline showed no statistical significance (random MD 0.29 mmol/L, 95% CI ‐0.02 to 0.61; 5 trials, 1301 participants, Analysis 4.12: subgroup 2). Heterogeneity was absent (I2 = 0%; P = 0.56). Change in HbA1c from baseline also did not show significant differences (random MD ‐0.03%, 95% CI ‐0.17 to 0.10; 6 trials, 1444 participants, Analysis 4.13: subgroup 2). Heterogeneity was absent (I2 = 0%; P = 0.51). Excluding the only trial that allowed addition of escape medicine did not change the statistical significance of the effect estimates for the changes in fasting blood glucose and HbA1c (UKPDS 1998). Change in weight from baseline showed no statistical significance (random MD ‐0.37 kg, 95% CI ‐2.39 to 1.65; fixed MD ‐0.02 kg, 95% CI ‐1.45 to 1.40; 5 trials, 1392 participants, Analysis 4.15: subgroup 2). Heterogeneity was present (I2 = 27%; P = 0.24).
Meta‐analyses of adverse events, serious adverse events and drop‐outs due to adverse events could not be performed due to lack of data. Mild hypoglycaemia was significantly changed in favour of insulin (random RR 1.41, 95% CI 1.13 to 1.76; P = 0.002; Analysis 4.18: subgroup 2). Heterogeneity was absent (I2 = 0%; P = 0.50). However, the meta‐analysis of mild hypoglycaemia was primarily based on data from the UKPDS 1998 trial, which only provided data after 1 year of follow‐up. The number of participants with mild hypoglycaemia was 129 in the glibenclamide group the first year. However, the third year of the intervention period 71 participants experienced an mild hypoglycaemic episode in the glibenclamide group. Trial sequential analysis showed that only 8.6% of the required information size to confirm or reject a 10% RRR was accrued. Due to a relatively large number of participants lost to follow‐up for the hypoglycaemia data in the UKPDS trial, available case analysis was also performed with the UKPDS trial data, which did not change the statistical significance of mild or severe hypoglycaemia.. Three trials reported zero events for severe hypoglycaemia (Alvarsson 2010; Birkeland 2002; Nathan 1988). As only one trial contributed with data, meta‐analysis could not be performed (UKPDS 1998). Two trials provided data on cancer (Alvarsson 2010; UKPDS 1998). Alvarsson 2010 only reported one cancer in each intervention group, so this analysis was primarily based on the data from the UKPDS trial (random RR 0.95, 95% CI 0.61 to 1.49; 2 trials, 1575 participants, Analysis 4.20: subgroup 2). Heterogeneity was absent (I2 = 0%; P = 0.96). Intervention failure was not statistically significant (random RR 1.96, 95% CI 0.80 to 4.76; fixed RR 1.21, 95% CI 0.97 to 1.63; 4 trials, 1670 participants, Analysis 4.21: subgroup 2). Heterogeneity was 65% (P = 0.04). If intervention failure occurred in the insulin intervention group in both of the included trials, the participants were treated with a more complex insulin regime (Birkeland 2002; UKPDS 1998).
Alvarsson assessed quality of life using the short‐form 36 (SF 36), but did not find any significant differences between the interventions (Alvarsson 2010). The UKPDS trial reported quality of life for the intensive intervention versus the conventional interventions, but not for the different antidiabetic medications applied in the intensive regimen (UKPDS 1998).
Second‐generation sulphonylureas versus other comparators
Alpha‐glucosidase inhibitor
Twelve trials compared a second‐generation sulphonylurea versus an alpha‐glucosidase inhibitor (Hoffmann 1990; Hoffmann 1994; Kamel 1997; Kanda 1998; Kovacevic 1997; Nakamura 2004; Nakamura 2006; Pagano 1995; Rosenthal 2002; Salman 2001; Segal 1997; Spengler 1992). All of the trials, except one (Nakamura 2006), were judged as high risk of bias. Glibenclamide was applied in most trials (Hoffmann 1990; Hoffmann 1994; Kovacevic 1997; Nakamura 2004; Nakamura 2006; Pagano 1995; Rosenthal 2002; Spengler 1992). Gliclazide was applied in the remaining trials (Kanda 1998; Salman 2001; Segal 1997). One trial applied both glibenclamide and gliclazide (Kamel 1997).
All‐cause mortality and cardiovascular mortality could not be meta‐analysed due to lack of data. Only one trial reported any deaths, and the number of events was the same (two in each intervention group for all‐cause mortality and one in each intervention group for cardiovascular mortality) (Johnston 1997).
None of the macrovascular or microvascular outcomes could be meta‐analysed due to lack of data.
Change in fasting blood glucose from baseline showed no statistically significant difference (random MD ‐0.16 mmol/L, 95% CI ‐0.42 to 0.11; fixed MD ‐0.14 mmol/L, 95% CI ‐0.37 to 0.09; 8 trials, 488 participants, Analysis 5.15: subgroup 2). Heterogeneity was 15% (P = 0.31). Change in HbA1c from baseline did not show statistically significant differences (random MD ‐0.06%, 95% CI ‐0.36 to 0.24; fixed MD ‐0.05%, 95% CI ‐0.18 to 0.08; 10 trials, 541 participants, Analysis 5.16: subgroup 2). Heterogeneity was 74% (P < 0.0001).
Neither the changes in BMI or in weight from baseline showed significant differences (BMI: random MD ‐0.02 kg/m2, 95% CI ‐0.20 to 0.16; I2 = 10%; P = 0.35; fixed MD ‐0.04 kg/m2, 95% CI ‐0.18 to 0.11; 5 trials, 232 participants, Analysis 5.17: subgroup 2; weight: random MD ‐0.22 kg, 95% CI ‐0.47 to 0.03; I2 = 0%; P = 0.96; 5 trials, 338 participants, Analysis 5.18: subgroup 2).
The number of participants reporting adverse events was significantly lower in favour of second‐generation sulphonylureas in a fixed‐effect model, but not in a random‐effects model (random RR 0.64, 95% CI 0.39 to 1.03; fixed RR 0.67, 95% CI 0.52 to 0.86; P = 0.002; 8 trials, 646 participants, Analysis 5.19: subgroup 2). Heterogeneity was 64% (P = 0.006). Serious adverse events could not be meta‐analysed due to lack of data. Drop‐outs due to adverse events were significantly changed in favour of second‐generation sulphonylurea (random RR 0.48, 95% CI 0.24 to 0.96; P = 0.04; 9 trials, 870 participants, Analysis 5.21: subgroup 2). Heterogeneity was absent (I2 = 0%; P = 0.90). Trial sequential analysis showed that only a minor fraction of the required information size to confirm or reject a 10% RRR was accrued.
Four trials reported data on mild hypoglycaemia, of which three reported zero events (Nakamura 2006; Rosenthal 2002; Spengler 1992). Meta‐analysis could therefore not be performed. The three trials reporting severe hypoglycaemia had zero events in both intervention groups (Nakamura 2006; Rosenthal 2002; Spengler 1992).
Cancer could not be meta‐analysed due to lack of data.
Intervention failure was significantly more common with alpha‐glucosidase inhibitors than with second‐generation sulphonylurea (random RR 0.25, 95% CI 0.07 to 0.92; P = 0.04; 3 trials, 514 participants, Analysis 5.26: subgroup 2). Heterogeneity was absent (I2 = 0%; P = 0.85). Trial sequential analysis showed that only a minor fraction of the required information size to detect or reject a 10% RRR was accrued.
Nakamura 2006 reported that quality of life was improved in all intervention groups during the trial, but no scale was provided so the intervention effects could not be assessed (Nakamura 2006).
Incretin‐based intervention
Two trials involved comparisons of second‐generation sulphonylureas versus incretin‐based interventions (Foley 2009; Kaku 2011). Both trials were judged as high risk of bias (Foley 2009; Kaku 2011). One trial applied glibenclamide (Kaku 2011) and one gliclazide (Foley 2009).
One of the trials involved a dipeptidyl peptidase‐4 (DDP‐4) inhibitor (Foley 2009) and the other a glucagon‐like peptide 1 (GLP‐1) analogue (Kaku 2011). All‐cause mortality was not significantly influenced by the intervention (random RR 1.39, 95% CI 0.52 to 3.68; 2 trials, 1503 participants, Analysis 6.1: subgroup 2). Sensitivity and subgroup analyses were not performed due to lack of data. Funnel plots could not be drawn. Heterogeneity was absent (I2 = 0%; P = 0.63). Trial sequential analysis showed that only 0.5% of the required information size to detect or reject a 10% RRR was accrued. Sensitivity and subgroup analysis could not be performed due to lack of data. The same was the case for best‐worst case scenario and worst‐best case scenario analyses.
Cardiovascular mortality, non‐fatal macrovascular outcomes and microvascular outcomes could not be meta‐analysed due to lack of data.
The change in fasting blood glucose from baseline was not significantly different (random MD 0.11 mmol/L, 95% CI ‐1.07 to 1.28; fixed MD 0.15 mmol/L, 95% CI ‐0.22 to 0.52; 2 trials, 1202 participants, Analysis 6.15: subgroup 2). Heterogeneity was present (I2 = 90%; P = 0.002). Change in HbA1c from baseline did also not show significant differences in the random‐effects model (random MD 0.26%, 95% CI ‐0.23 to 0.75; 2 trials, 1204 participants, Analysis 6.16: subgroup 2), but did so in favour of incretin‐based therapies in the fixed‐effect model (fixed MD 0.29%, 95% CI 0.12 to 0.47; P = 0.001). Heterogeneity was high (I2 = 86%; P = 0.007).
Statistically significant change in weight from baseline was observed in favour of incretin‐based interventions (random MD 1.31 kg, 95% CI 0.33 to 2.29; P = 0.009; fixed MD 1.34 kg, 95% CI 0.96 to 1.71; P < 0.0001; 2 trials, 1206 participants, Analysis 6.18: subgroup 2). Heterogeneity was high (I2 = 85%; P = 0.009). Diversity was 85%. Trial sequential analysis showed that firm evidence was not established. Change in BMI from baseline could not be meta‐analysed due to lack of data.
Adverse events and serious adverse events could not be meta‐analysed due to lack of data. Drop‐outs due to adverse events did not differ significantly between the interventions (random RR 1.00, 95% CI 0.67 to 1.50; 2 trials, 1503 participants, Analysis 6.21: subgroup 2). Heterogeneity was absent (I2 = 0%; P = 0.48).
Mild hypoglycaemia was registered in more participants receiving a second‐generation sulphonylurea compared with incretin‐based intervention (random RR 1.99, 95% CI 1.02 to 3.87; P = 0.04; fixed RR 1.78, 95% CI 1.34 to 2.38; 2 trials, 1503 participants, Analysis 6.22: subgroup 2). Heterogeneity was present (I2 = 44%; P = 0.18). D2 = 81%. Trial sequential analysis showed that only a minor fraction has been accrued so far before firm evidence for a 10% RRR can be established. The trials reported zero events of severe hypoglycaemia in both intervention groups (Foley 2009; Kaku 2011). In Kaku 2011 seven participants in the second‐generation sulphonylurea group and three participants in the GLP‐1 group experienced nocturnal hypoglycaemia (Kaku 2011).
The number of participants with intervention failure did not significantly differ between the interventions in the random‐effects model (random RR 1.00, 95% CI 0.41 to 2.43; 2 trials, 1503 participants, Analysis 6.24: subgroup 2), but showed statistically significant differences in favour of second‐generation sulphonylurea in the fixed‐effect model (fixed RR 0.74, 95% CI 0.60 to 0.91; P = 0.004). Heterogeneity was 75% (P = 0.04).
Meglitinides
Nine trials compared second‐generation sulphonylureas with meglitinide (Abbatecola 2006; AGEE/DCD/046/UK; AGEE/DCD/047/B/F/I; Esposito 2004; Jibran 2006; Madsbad 2001; Marbury 1999; Nakamura 2006; Wolffenbuttel 1999). All of the trials, except for one (Nakamura 2006), were judged as high risk of bias. All of the trials, except for one using glipizide (Madsbad 2001) and one using gliclazide (AGEE/DCD/047/B/F/I), applied glibenclamide as the second‐generation sulphonylurea. Two of the trials were unpublished (AGEE/DCD/046/UK; AGEE/DCD/047/B/F/I).
Thirteen fatal events were reported in seven trials (AGEE/DCD/046/UK; AGEE/DCD/047/B/F/I; Esposito 2004; Madsbad 2001; Marbury 1999; Nakamura 2006; Wolffenbuttel 1999). Statistical significance was not present (RR 1.44, 95% CI 0.47 to 4.42; 7 trials, 2038 participants, Analysis 7.1: subgroup 2). Heterogeneity was absent (I2 = 0%; P = 0.70). The trial with the longest duration applied the intervention for 14 months and had a three‐month post‐intervention observational period (AGEE/DCD/047/B/F/I). Sensitivity analysis excluding the trial with the longest duration did not change the statistical significance of the effect estimate (RR 1.34, 95% CI 0.40 to 4.56). Heterogeneity was absent (I2 = 0%; P = 0.55). Two of the trials reporting fatal events reported how the diagnosis of T2DM was established (Marbury 1999; Wolffenbuttel 1999). Excluding these trials from the meta‐analysis of all‐cause mortality did not change the significance of the effect estimate (RR 2.60, 95% CI 0.63 to 10.77). Heterogeneity was absent (I2 = 0%; P = 0.82). Sensitivity analysis according to the language of publication could not be performed, as all trials were published in English. Two of the trials, both reporting zero fatal events, did not receive any funding from a pharmaceutical company (Esposito 2004; Nakamura 2006). Sensitivity analysis according to funding source could therefore not be performed. Sensitivity analysis only including data from the published trials did not change the significance of the effect estimate (RR 1.01, 95% CI 0.21 to 4.88). Heterogeneity was absent (I2 = 0%; P = 0.41). Trial sequential analysis showed that 0.06% of the required information size to detect or reject a 10% RRR for all‐cause mortality was accrued.
Ten fatal events due to cardiovascular disease were reported in seven trials (AGEE/DCD/046/UK; AGEE/DCD/047/B/F/I; Esposito 2004; Madsbad 2001; Marbury 1999; Nakamura 2006; Wolffenbuttel 1999). Statistical significance was not present (RR 0.97, 95% CI 0.27 to 3.53; 7 trials, 2038 participants, Analysis 7.4: subgroup 2). Heterogeneity was absent (I2 = 0%; P = 0.93). The trial with the longest duration applied the intervention for 14 months and had a three‐month post‐intervention observational period (AGEE/DCD/047/B/F/I). Sensitivity analysis excluding the trial with the longest duration did not change the statistical significance of the effect estimate (RR 0.74, 95% CI 0.18 to 3.39). Heterogeneity was absent (I2 = 0%; P = 0.96). Two of the trials reporting fatal events reported how the diagnosis of T2DM was established (Marbury 1999; Wolffenbuttel 1999). Excluding these trials from the meta‐analysis of cardiovascular mortality did not change the significance of the effect estimate (RR 1.40, 95% CI 0.23 to 8.49). Heterogeneity was absent (I2 = 0%; P = 0.71). Sensitivity analysis according to the language of publication could not be performed, as all trials were published in English. Two of the trials, both reporting zero fatal events, did not receive any funding from a pharmaceutical company (Esposito 2004; Nakamura 2006). Sensitivity analysis according to funding source could therefore not be performed. Sensitivity analysis only including data from the published trials did not change the significance of the effect estimate (RR 0.67, 95% CI 0.11 to 4.22). Heterogeneity was absent (I2 = 0%; P = 0.99). Trial sequential analysis showed that only a minor fraction of the required information size to detect or reject a 10% RRR for cardiovascular mortality was accrued.
Funnel plots for the primary outcomes could not be drawn.
Best‐worst case and worst‐best case scenarios could not be performed for any of the primary outcomes due to lack of data.
We did not conduct subgroup analyses, as none of the primary outcome measures demonstrated statistically significant differences between the intervention groups.
Data for the composite non‐fatal macrovascular outcome were reported in three trials (Madsbad 2001; Marbury 1999; Nakamura 2006), of which one reported zero events (Nakamura 2006). The definition of the reported composite outcome varied; one reported vascular extracardiac disorders (Madsbad 2001) and the other reported adverse cardiac events (Marbury 1999). Statistical significance was not shown (RR 0.50, 95% CI 0.20 to 1.20; 3 trials, 866 participants, Analysis 7.5: subgroup 2). Heterogeneity was absent (I2 = 0%; P = 0.57).
Non‐fatal myocardial infarction did not show any statistical significance (RR 1.03, 95% CI 0.26 to 4.08; 3 trials, 726 participants, Analysis 7.6: subgroup 2). An unpublished trial contributed with six out of nine events (AGEE/DCD/046/UK).
The remaining components of the non‐fatal macrovascular outcome and the microvascular outcomes could not be meta‐analysed as only one of the included trials reported data on these (Nakamura 2006). The trial reported zero events for all the macrovascular and microvascular outcomes in both intervention groups (Nakamura 2006).
The change in fasting blood glucose from baseline was significantly different between the interventions in favour of sulphonylurea (random MD ‐0.27 mmol/L, 95% CI ‐0.51 to ‐0.02; P = 0.03; fixed MD ‐0.25 mmol/L, 95% CI ‐0.40 to ‐0.10; P = 0.001; 9 trials, 2205 participants, Analysis 7.15: subgroup 2). Heterogeneity was present (I2 = 52%; P = 0.03). Diversity was 60%. Trial sequential analysis showed that firm evidence for the achieved changes in fasting blood glucose from baseline was not established. Excluding data from the two unpublished trials changed the statistical significance of the effect estimate to non‐significant values (random MD ‐0.20 mmol/L, 95% CI ‐0.44 to 0.04). The change in HbA1c from baseline was not significantly different between the interventions (random MD 0.07%, 95% CI ‐0.08 to 0.22; fixed MD 0.06%, 95% CI ‐0.04 to 0.15; 9 trials, 2221 participants, Analysis 7.16: subgroup 2). Heterogeneity was present (I2 = 52%; P = 0.03). Excluding data from the two unpublished trials did not change the statistical significance of the effect estimate.
Two trials were included in the analysis of change in BMI from baseline, which did not show statistically significant differences (random MD 0.0 kg/m2, 95% CI ‐0.19 to 0.20; fixed MD 0.02 kg/m2, 95% CI ‐0.07 to 0.11; 2 trials, 209 participants, Analysis 7.17: subgroup 2). Heterogeneity was present (I2 = 77%; P = 0.04). The change in weight from baseline did also not show significant differences (random MD 0.13 kg, 95% CI ‐0.50 to 0.76; fixed MD ‐0.05 kg, 95% CI ‐0.30 to 0.21; 4 trials, 1052 participants, Analysis 7.18: subgroup 2). Heterogeneity was present (I2 = 38%; P = 0.19).
The number of participants reporting adverse events did not significantly differ (random RR 1.00, 95% CI 0.95 to 1.06; 5 trials, 1829 participants, Analysis 7.19: subgroup 2). Heterogeneity was absent (I2 = 0%; P = 0.89). Excluding data from the two unpublished trials did not change the statistical significance of the effect estimate. Drop‐outs due to adverse events did not show statistically significant differences (random RR 1.01, 95% CI 0.78 to 1.32; fixed RR 0.98, 95% CI 0.77 to 1.25; 7 trials, 2019 participants, Analysis 7.20: subgroup 2). Heterogeneity was 10% (P = 0.35). Excluding data from the two unpublished trials did not change the statistical significance of the effect estimate. None of the data in the meta‐analysis of serious adverse events were published. Data from the three published trials in the meta‐analysis of serious adverse events did not report the number of participants with a serious adverse event in each intervention group in the publication, and these data were provided by the sponsor (Madsbad 2001; Marbury 1999; Wolffenbuttel 1999). The effect estimate for serious adverse events did not show any statistical significance (random RR 1.02, 95% CI 0.74 to 1.39; fixed RR 0.99, 95% CI 0.74 to 1.32; 5 trials, 1829 participants, Analysis 7.21: subgroup 2).
The risk of mild hypoglycaemia was not significantly changed (random RR 1.20, 95% CI 0.96 to 1.49; 6 trials, 196 participants, Analysis 7.22: subgroup 2). Heterogeneity was absent (I2 = 0%; P = 0.50). Excluding data from the two unpublished trials did not change the statistical significance of the effect estimate. The risk of severe hypoglycaemia did not show statistical significance (random RR 2.17, 95% CI 0.53 to 8.91; fixed RR 2.87, 95% CI 0.91 to 8.99; 6 trials, 1863 participants, Analysis 7.24: subgroup 2). Heterogeneity was low (I2 = 4%; P = 0.37). Excluding data from the two unpublished trials did not change the statistical significance of the effect estimate.
Most of the participants reporting an intervention failure were from Marbury 1999 (96 out of 132) (Marbury 1999). The effect estimate did not show significant differences (random RR 0.98, 95% CI 0.69 to 1.38; 4 trials, 1524 participants, Analysis 7.26: subgroup 2). Heterogeneity was absent (I2 = 0%; P = 0.40).
Cancer, quality of life and cost of intervention could not be meta‐analysed due to lack of data.
Herbal medicine
One trial investigating the effect of glibenclamide versus a Chinese herb (xiaoyasan) was included (Deng 2003). Only the outcomes change in fasting blood glucose and change in HbA1c from baseline could be assessed. The observed decrease in both of these variables was very similar (fasting blood glucose from mean 10.28 mmol/L; standard deviation (SD) 1.01 to mean 6.08 mmol/L SD 0.32 for glibenclamide and mean 10.36 mmol/L SD 1.02 to mean 5.98 mmol/L SD 0.26 for Chinese herb; HbA1c from mean 8.98% SD 1.71 to mean 7.12% SD 0.59 for glibenclamide and mean 9.02% SD 1.62 to 7.12% SD 0.59 for Chinese herb). Meta‐analysis was not possible due to lack of data.
Third‐generation sulphonylureas versus placebo
No trials assessed the effects of a third‐generation sulphonylurea versus placebo.
Third‐generation sulphonylureas versus diet
No trials assessed the effects of a third‐generation sulphonylurea versus diet.
Third‐generation sulphonylureas versus metformin
Three trials compared the effect of monotherapy with a third‐generation sulphonylurea versus metformin (Derosa 2004; Tang 2004; Yamanouchi 2005). One of the included trials reported that no participants experienced non‐fatal macrovascular outcomes during the trial in both intervention groups (Yamanouchi 2005). Meta‐analyses of non‐fatal macrovascular outcomes and microvascular outcomes could not be meta‐analysed due to lack of data. The reduction in fasting blood glucose and HbA1c from baseline showed no statistical significance (fasting blood glucose: random MD ‐0.22 mmol/L, 95% CI ‐0.52 to 0.08, I2 = 0%; P = 0.42; 3 trials, 281 participants, Analysis 2.13: subgroup 3; HbA1c: random MD ‐0.18%, 95% CI ‐0.43 to 0.07; fixed MD ‐0.16%, 95% CI ‐0.37 to 0.04; I2 = 19%; P = 0.29; 3 trials, 281 participants, Analysis 2.14: subgroup 3). Change in BMI from baseline did not show statistical significance (random MD ‐0.10 kg/m2, 95% CI ‐1.06 to 0.86; I2 = 0%; P = 0.1.00; 2 trials, 219 participants, Analysis 2.15: subgroup 3). The effect estimate for intervention failure showed no statistical significance (random RR 1.23, 95% CI 0.43 to 3.50; 2 trials, 240 participants, Analysis 2.24: subgroup 3).
Third‐generation sulphonylureas versus thiazolidinediones
Four trials compared the effects of third‐generation sulphonylureas versus thiazolidinediones (Forst 2005; Shihara 2011; Tan 2004; Yamanouchi 2005). All trials were judged as high risk of bias.
One of the included trials reported that no participants experienced non‐fatal macrovascular outcomes during the trial in both intervention groups (Yamanouchi 2005). Meta‐analyses for all‐cause mortality, cardiovascular mortality, non‐fatal macrovascular outcomes and microvascular outcomes could not be performed due to lack of data.
The changes in fasting blood glucose was not significantly different in the random‐effects model (random MD 0.46 mmol/L, 95% CI ‐0.22 to 1.13; 4 trials, 655 participants, Analysis 3.15: subgroup 3), but showed significant differences in the fixed‐effect model in favour of thiazolidinediones (fixed MD 0.40 mmol/L, 95% CI 0.07 to 0.73; P = 0.02). Heterogeneity was present (I2 = 70%; P = 0.02). The change in HbA1c from baseline was not statistically significant (random MD ‐0.095%, 95% CI ‐0.31 to 0.14; fixed MD ‐0.10 %, 95% CI ‐0.26 to 0.07; 4 trials, 659 participants, Analysis 3.16: subgroup 3). Heterogeneity was present (I2 = 44%; P = 0.15).
The effect estimate showed no significance for the change in BMI from baseline (random MD ‐0.75 kg/m2, 95% CI ‐1.58 to 0.08; fixed MD ‐0.75 kg/m2, 95% CI ‐1.56 to 0.07; 3 trials, 411 participants, Analysis 3.17: subgroup 3). Heterogeneity was present (I2 = 4%; P = 0.35). Change in weight analysis could not be performed due to lack of data.
One hundred and ninety‐nine of the 207 patients who reported an adverse event were from Tan 2004. Meta‐analysis showed a significant difference in favour of third‐generation sulphonylureas (random RR 0.88, 95% CI 0.78 to 0.99; P = 0.03; 3 trials, 510 participants, Analysis 3.19: subgroup 3). Heterogeneity was absent (I2 = 0%; P = 0.43). Trial sequential analysis showed that firm evidence was not established. Serious adverse events could not be meta‐analysed due to lack of data. Drop‐outs due to adverse events were not significantly influenced by the interventions (random RR 0.54, 95% CI 0.15 to 1.97; 2 trials, 423 participants, Analysis 1.4: subgroup 3). Heterogeneity was absent (I2 = 0%; P = 0.77).
We could not meta‐analyse hypoglycaemic episodes due to lack of data.
The effect estimate of intervention failure showed significance in favour of third‐generation sulphonylureas (random RR 0.24, 95% CI 0.08 to 0.75; P = 0.01; 2 trials, 319 participants, Analysis 3.26: subgroup 3). Heterogeneity was absent (I2 = 0%; P = 0.81). Trial sequential analysis showed that firm evidence for a 10% RRR was not achieved.
Third‐generation sulphonylureas versus other comparators
Alpha‐glucosidase inhibitor
One trial compared third‐generation sulphonylurea monotherapy with an alpha‐glucosidase inhibitor (Feinböck 2003). The trial was judged as high risk of bias. The trial reported that 10 out of 111 participants in the glimepiride group versus 29 out of 108 in the acabose group had intervention failure. Mild hypoglycaemia was reported in 20 out of 111 participants in the glimepiride group versus 2 out of 108 in the acarbose group. The reductions in fasting blood glucose and HbA1c from baseline were greater in the glimepiride group than in the acarbose group (fasting blood glucose: mean ‐2.6 mmol/L SD 2.6 versus mean ‐1.4 mmol/L SD 2.8; HbA1c: mean ‐2.5% SD 2.2 versus mean ‐1.8% SD 2.2). The change in weight from baseline was changed in favour of acarbose (mean ‐0.4 kg SD 5.2 versus mean ‐1.9 kg SD 3.9). Meta‐analyses could not be performed.
Incretin‐based intervention
One trial compared third‐generation sulphonylurea monotherapy with an incretin‐based intervention (GLP‐1 analogue) (LEAD‐3 2006). The trial was judged as high risk of bias (LEAD‐3 2006). Two hundred and forty‐eight participants were randomised to a third‐generation sulphonylurea versus 498 receiving an incretin‐based intervention. The trial reported one cardiovascular death in the group receiving a third‐generation sulphonylurea. Non‐fatal myocardial infarction was reported in three participants in the incretin‐based intervention group and in one participant in the third‐generation sulphonylurea group. Adverse events were reported in 364/498 participants receiving incretin‐based intervention compared with 148/248 receiving third‐generation sulphonylurea. The reporting of serious adverse events between the interventions was very similar (13 participants allocated to glimepiride reported serious adverse events out of 248, and 24 participants allocated to incretin‐based intervention out of 498). The observed changes for fasting blood glucose, HbA1c and weight were in favour to incretin‐based intervention (fasting blood glucose: mean ‐0.3 mmol/L SD 2.9 for third‐generation sulphonylurea and mean ‐1.1 mmol/L SD 3 for incretin‐based intervention; HbA1c: mean ‐0.5% SD 1.2 for third‐generation sulphonylurea and mean ‐1% SD 1.2 for incretin‐based intervention; weight: 1.1 kg SD 0.3 for third‐generation sulphonylurea and mean ‐2.05 kg SD 4.4). Mild hypoglycaemia and intervention failure were more common in the participants receiving third‐generation sulphonylurea compared with incretin‐based intervention. Meta‐analyses could not be performed.
Meglitinides
One trial compared third‐generation sulphonylurea monotherapy with a meglitinide (Derosa 2003). The trial was judged as high risk of bias (Derosa 2003). The end of follow‐up values for fasting blood glucose, HbA1c, BMI and weight were reported (fasting blood glucose: mean 6.9 mmol/L SD 1.1 for third‐generation sulphonylurea and mean 6.7 mmol/L SD 1.3 for meglitinide; HbA1c: mean 6.7% SD 0.9 for third‐generation sulphonylurea and mean 6.8% SD 0.8 for meglitinide; BMI: mean 25.9 kg/m2 SD 1.2 for third‐generation sulphonylurea and mean 26.2 kg/m2; SD 0.8 for meglitinide; weight: mean 76.6 kg SD 5.3 for third‐generation sulphonylurea and mean 76.5 kg SD 5.3 for meglitinide). Two drop‐outs were reported in the trial (both in the third‐generation sulphonylurea group). Intervention failure was experienced in two participants receiving a third‐generation sulphonylurea and in three participants receiving a meglitinide. Meta‐analysis could not be performed.
Second‐generation sulphonylureas versus first‐generation sulphonylureas
Three of the included trials compared a second‐generation sulphonylurea versus a first‐generation sulphonylurea (Fineberg 1980; Harrower 1985; UKPDS 1998). All of the trials were judged as high risk of bias.
In the UKPDS trial all‐cause mortality was reported in 121 participants out of 615 participants randomised to second‐generation sulphonylurea versus 136 participants out of 619 participants randomised to first‐generation sulphonylurea (UKPDS 1998). Cardiovascular mortality was reported in 69 participants out of 615 participants randomised to second‐generation sulphonylurea versus 71 participants out of 619 participants randomised to first‐generation sulphonylurea (UKPDS 1998). In the UKPDS trial non‐fatal myocardial infarction was reported in 46 participants out of 615 participants randomised to second‐generation sulphonylurea versus 58 participants out of 619 participants randomised to first‐generation sulphonylurea (UKPDS 1998). Non‐fatal stroke was reported in 34 participants out of 615 participants randomised to second‐generation sulphonylurea versus 26 participants out of 619 participants randomised to first‐generation sulphonylurea (UKPDS 1998). The UKPDS trial reported five participants in each intervention group with an amputation of lower extremity (UKPDS 1998). The composite microvascular outcome was in the UKPDS trial reported in 49 participants out of 615 participants randomised to second‐generation sulphonylurea versus 68 participants out of 619 participants randomised to first‐generation sulphonylurea (UKPDS 1998). In the UKPDS trial retinal photocoagulation was reported in 45 participants out of 615 participants randomised to second‐generation sulphonylurea versus 55 participants out of 619 participants randomised to first‐generation sulphonylurea (UKPDS 1998). All‐cause mortality, cardiovascular mortality, non‐fatal macrovascular outcomes and microvascular outcomes could not be meta‐analysed due to lack of data.
The change in fasting blood glucose from baseline was significantly changed in favour of first‐generation sulphonylurea (random MD 0.62 mmol/L, 95% CI 0.31 to 0.94; P < 0.0001; 2 trials, 936 participants, Analysis 8.9). Heterogeneity was absent (I2 = 0; P = 0.79). The analysis was primarily based on data from the UKPDS trial (UKPDS 1998). Trial sequential analysis disregarding risk of bias showed that firm evidence for the achieved changes were established. The change in HbA1c from baseline was not statistical significant in random‐effects model, but showed statistical significance in fixed‐effect model (random MD ‐1.44%, 95% CI ‐4.48 to 1.60; fixed MD ‐0.31%, 95% CI ‐0.51 to ‐0.11; P = 0.002; 2 trials, 1014 participants, Analysis 8.9). Heterogeneity was high (I2 = 99%; P < 0.00001). .
No trials reported change in BMI from baseline. Change in weight from baseline showed no significant differences in the random‐effects model, but showed statistical significance in favour of first‐generation sulphonylurea in the fixed‐effect model (random MD 1.80 kg, 95% CI ‐0.63 to 4.23; fixed MD 1.21 kg, 95% CI 0.32 to 2.11; 2 trials, 1014 participants, Analysis 8.10).
Meta‐analyses of adverse events and hypoglycaemic episodes could not be done due to lack of data. The UKPDS trial reported death due to cancer in 29 participants out of 615 participants randomised to second‐generation sulphonylurea versus 36 participants out of 619 participants randomised to first‐generation sulphonylurea (UKPDS 1998).
Intervention failure was not significantly changed in random‐effects model, but was significantly changed in favour of first‐generation sulphonylurea in fixed‐effect model (random RR 1.96, 95% CI 0.67 to 5.75; fixed RR 1.62, 95% CI 1.62 to 3.29; P < 0.00001; 3 trials, 1364 participants, Analysis 8.14). Heterogeneity was present (I2 = 20%; P = 0.26). Diversity was 89%. Trial sequential analysis showed that 0.3% of the required information size to confirm or reject a 10% RRR was accrued.
Third‐generation sulphonylureas versus first‐generation sulphonylureas
No trials assessed the effects of a third‐generation sulphonylurea versus a first‐generation sulphonylurea.
Sulphonylureas versus the included comparators
Due to lack of data for several outcomes in the systematic review, we decided post hoc to compare all generations of sulphonylureas with each of the included comparators. As the analyses of most of the outcomes were dominated by the second‐generation sulphonylureas, there was only a few comparisons for which the significance for the second‐generation sulphonylurea was different from an analysis of all classes of sulphonylureas. The change in fasting blood glucose from baseline, which showed significance for the comparison second‐generation sulphonylurea versus metformin in a random‐effects model (random MD 0.43 mmol/L, 95% CI 0.10 to 0.75; P = 0.009; 11 trials, 3891 participants), but showed no significance when all classes of sulphonylurea were compared with metformin in a random‐effects model (random MD 0.20 mmol/L, 95% CI ‐0.07 to 0.48; 16 trials, 4654 participants). Mild hypoglycaemia for the comparison second‐generation sulphonylurea versus insulin showed statistical significance (random RR 1.37, 95% CI 1.10 to 1.69; P = 0.004; 2 trials, 1197 participants), but no significance was present when all classes of sulphonylureas were combined (random RR 0.94, 95% CI 0.45 to 1.95; 3 trials, 3105 participants). No changes in the significance of the effect estimates from the analyses of second‐generation sulphonylureas were observed for the remaining comparisons.
For several outcomes there were no data available and no meta‐analysis could be performed. Please see Appendix 10; Appendix 11; Appendix 12 for a complete overview of each outcome for each comparison.
Discussion
Summary of main results
This Cochrane review is the first systematic review including all randomised trials assessing allocation to sulphonylurea monotherapy versus placebo or no intervention, or allocation to sulphonylurea monotherapy versus other comparators in patients with type 2 diabetes mellitus (T2DM). We included 72 trials with a total of 22,589 participants. All trials had an uncertain or high risk of bias in one or more risk of bias domain. Overall the amount of evidence on patient‐important outcomes was low. For an overview of intervention effects please see Appendix 10; Appendix 11; Appendix 12.
Our two primary outcomes were all‐cause mortality and cardiovascular mortality. After publication of the protocol, it was decided to meta‐analyse change of weight from baseline, as it might be an important variable for most patients with T2DM.
We list below the comparisons showing statistically significant differences in the random‐effects model.
-
Cardiovascular mortality: for the comparison of first‐generation sulphonylurea versus placebo, the effect estimate showed statistical significance in favour of placebo. However, this did not hold in the trial sequential analysis for a 10% relative risk reduction (RRR) as only 0.7% of the required information size has been accrued so far.
-
Non‐fatal macrovascular outcomes: for the comparison of second‐generation sulphonylureas versus metformin, statistical significance in favour of second‐generation sulphonylurea was found. However, the trials included in this meta‐analysis also reported events of non‐arteriosclerotic origin as cardiovascular disease. A trial sequential analysis did not confirm a 10% RRR.
-
Fasting blood glucose: for the comparison of first‐generation sulphonylureas versus alpha‐glucosidase inhibitors, statistical significance in favour of first‐generation sulphonylureas was observed. The result was confirmed in the trial sequential analysis disregarding risk of bias. For the comparison of second‐generation sulphonylureas versus placebo, statistical significance was present in favour of second‐generation sulphonylurea. The result was confirmed in the trial sequential analysis disregarding risk of bias. For the comparison of second‐generation sulphonylurea versus metformin statistical significance was present in favour of metformin. The result was not confirmed in the trial sequential analysis. For the comparisons of second‐generation sulphonylurea versus thiazolidinediones statistical significance was present in favour of the thiazolidinediones. The result was confirmed in the trial sequential analysis disregarding risk of bias. For the comparison of second‐generation sulphonylureas versus meglitinides statistical significance was present in favour of second‐generation sulphonylurea. The result was not confirmed in the trial sequential analysis. For the comparison of second‐generation sulphonylurea versus first‐generation sulphonylurea statistical significance was present in favour of first‐generation sulphonylurea. The result was confirmed in the trial sequential analysis disregarding risk of bias.
-
HbA1c: for the comparison of first‐generation sulphonylurea versus alpha‐glucosidase inhibitors, statistical significance was shown in favour of first‐generation sulphonylureas. The result was confirmed in the trial sequential analysis disregarding risk of bias. For the comparison of second‐generation sulphonylureas versus placebo, statistical significance was present in favour of second‐generation sulphonylurea. The result was confirmed in the trial sequential analysis disregarding risk of bias.
-
BMI: For the comparison of second‐generation sulphonylureas versus thiazolidinediones statistical significance was present in favour of second‐generation sulphonylureas. The result was not confirmed in the trial sequential analysis disregarding risk of bias.
-
Weight: for the comparison of second‐generation sulphonylureas versus metformin, statistical significance was present in favour of metformin. The result was confirmed in the trial sequential analysis disregarding risk of bias. For the comparison of second‐generation sulphonylureas versus thiazolidinediones, statistical significance was present in favour of second‐generation sulphonylureas. The result was confirmed in the trial sequential analysis disregarding risk of bias. For the comparison second‐generation sulphonylurea versus incretin‐based interventions statistical significance was found in favour of incretin‐based intervention. The result was not confirmed in the trial sequential analysis..
-
Adverse events: for the comparison of first‐generation sulphonylureas versus alpha‐glucosidase inhibitors, statistical significance was present in favour of first‐generation sulphonylureas. However, this did not hold in the trial sequential analysis for a 10% RRR. For the comparison of third‐generation sulphonylureas versus thiazolidinediones, statistical significance was present in favour of third‐generation sulphonylureas. However, this did not hold in the trial sequential analysis for a 10% RRR.
-
Drop‐out due to adverse events: for the comparison of first‐generation sulphonylureas versus alpha‐glucosidase inhibitors, statistical significance was present in favour of first‐generation sulphonylureas. However, this did not hold in the trial sequential analysis for a 10% RRR. For the comparison of second‐generation sulphonylureas versus alpha‐glucosidase inhibitors, statistical significance was present in favour of second‐generation sulphonylureas. However, this did not hold in the trial sequential analysis for a 10% RRR.
-
Mild hypoglycaemia: for the comparison of second‐generation sulphonylureas versus metformin, statistical significance was present in favour of metformin. However, this did not hold in the trial sequential analysis for a 10% RRR. For the comparison of second‐generation sulphonylureas versus thiazolidinediones, statistical significance was present in favour of thiazolidinediones. A 10% RRR was confirmed in the trial sequential analysis disregarding risk of bias. For the comparison of second‐generation sulphonylureas versus insulin, statistical significance was present in favour of insulin. However, this did not hold in the trial sequential analysis for a 10% RRR. For the comparison of second‐generation sulphonylureas versus incretin‐based intervention, statistical significance was present in favour of incretin‐based intervention. However, this did not hold in the trial sequential analysis for a 10% RRR.
-
Severe hypoglycaemia: for the comparison of second‐generation sulphonylureas versus metformin, statistical significance was present in favour of metformin. However, this did not hold in the trial sequential analysis for a 10% RRR. For the comparison of second‐generation sulphonylureas versus thiazolidinediones, statistical significance was present in favour of thiazolidinediones. However, this did not hold in the trial sequential analysis for a 10% RRR.
-
Intervention failure: for the comparison of second‐generation sulphonylureas versus placebo, statistical significance was present in favour of second‐generation sulphonylureas. However, this did not hold in the trial sequential analysis for a 10% RRR. For the comparison of second‐generation sulphonylureas versus alpha‐glucosidase inhibitors, statistical significance was present in favour of second‐generation sulphonylureas. However, this did not hold in the trial sequential analysis for a 10% RRR. For the comparison of third‐generation sulphonylureas versus thiazolidinediones, statistical significance was present in favour of third‐generation sulphonylureas. However, this did not hold in the trial sequential analysis for a 10% RRR. For the comparison second‐generation sulphonylurea versus first‐generation sulphonylurea statistical significance was present in favour of first‐generation sulphonylurea. However, this did not hold in the trial sequential analysis for a 10% RRR. As for the definition of intervention failure to monotherapy, the strategy between the included trials varied (please see Included studies).
Conclusions when all sulphonylurea groups (first‐, second‐ and third‐generation) were analysed together were similar to those of second‐generation sulphonylurea. The only exceptions were the change in fasting blood glucose from baseline, which in a random‐effects model did not show statistical significance when all classes of sulphonylureas were combined compared with metformin, and mild hypoglycaemia for the comparison of second‐generation sulphonylurea versus insulin, which showed statistical significance in favour of insulin in the random‐effects model, but no statistical significance was present when all sulphonylureas were combined..
Overall completeness and applicability of evidence
We conducted an extensive search for trials, included publications in all languages and had no restriction on the outcomes reported in the trials. We have included trials with large variation in duration of T2DM and interventions, age and glycaemic targets in trials. Our primary objective was to assess all‐cause as well as cardiovascular mortality. We cross‐checked our data with the data from other meta‐analyses and Cochrane reviews of relevance (Black 2007; Bolen 2007; Liu 2002; Liu 2009; Ooi 2010; Richter 2006; Richter 2007; Richter 2008; Saenz 2005; Selvin 2008).
The participants of the included trials represented a very diverse sample of the population with T2DM. The results of our review should therefore be interpreted with caution. The diagnosis of T2DM varied among trials and some trials used a definition of T2DM which may have included participants with impaired glucose tolerance. Some of the trials only included participants with newly diagnosed T2DM, whereas others included patients with a longer duration of T2DM. The inclusion criteria varied among the trials, but almost all trials excluded participants with existing co‐morbidities, especially renal or hepatic disease. Detailed information about the participants was presented in most trials. The majority of trials were conducted in Europe or North America. A potential selection bias exists as more healthy and motivated patients may participate in a clinical trial. However, a Cochrane systematic review has observed that clinical outcomes in patients that participate in randomised trials are comparable to similar patients outside trials (Vist 2008). All together, the participants of the included trials represented a heterogenous sample of the population with T2DM and the results should therefore be interpreted with some caution. However, the diversity of patient characteristics mirrors that seen in real life, which may justify the clinical relevance of the results.
The included trials applied sulphonylurea monotherapy with different intensities and with different types of sulphonylureas. All trials primarily focused on sulphonylurea monotherapy, however, a few trials allowed varying degrees of add‐on to monotherapy in case of intervention failure. The fact that escape medicine was allowed to a varying degree makes it difficult to decide whether the intervention effects or adverse effects are ascribed to the intended (mono)therapy or arise from combination therapy.
Quality of the evidence
Among the 72 trials included in this analysis, we classified none of the trials as having low risk of bias according to all bias domains and we only classified seven trials as having a lower risk of bias according to a combined evaluation of sequence generation, allocation concealment and blinding. We would have stratified the trials according to risk of bias for our primary outcomes if statistical significance was present, but due to lack of statistical significance these analyses were not performed. Several of the included trials had an open‐label design, which might have influenced the reporting from both the participants and the investigators. We were able to assess some of the predefined outcomes in 70 included trials. The outcome reporting in the individual trials varied grossly suggesting a high risk of outcome selection bias.
Certain potential limitations of this review warrant special consideration, one being that we were dealing with a very heterogeneous group of trials. The meta‐analyses are limited by an inability to use individual patient data to assess whether distinct clinical characteristics may have influenced the effect estimates of the intervention effects. We tried to explore heterogeneity using sensitivity analyses for the primary outcomes. Diagnostic criteria and definitions of outcomes differed among trials and were not always well defined. Besides our primary outcomes (all‐cause and cardiovascular mortality), we assessed other patient‐important outcomes such as non‐fatal macro‐ and microvascular outcomes. However, due to lack of data very few comparisons could be performed for these outcomes. Many of the included trials were not designed or powered to detect our predefined outcomes, which might have resulted in insufficient data from these trials. Cardiovascular outcomes were collected as adverse events in most trials. Additionally, when pre‐specifying a certain primary outcome, this outcome might be more systematically and uniformly collected in the trial. In all cases we asked for supplementary information from the authors. However, as stated above, outcome reporting bias could influence the results of our meta‐analyses.
Several trials received funding from the pharmaceutical industry. We would have stratified all‐cause and cardiovascular mortality by source of funding to see if it influenced the effect estimates, but were unable to do this.
The way sulphonylurea monotherapy or another comparator was applied to the participants varied among the trials. Some trials excluded the participants who could not achieve adequate glycaemic control on monotherapy, whereas other trials allowed varying degrees of escape medicine in order to maintain glycaemic control. Again, some trials did not describe what happened to the participants who could not maintain adequately glycaemic control on monotherapy. In our opinion, trials that permitted escape medicine, as well as those that did not, were relevant to include in the present meta‐analysis. Thus, both types of trials allow for inferences regarding initial allocation to monotherapy. Taking into consideration whether or not escape medicine was allowed, we meta‐analysed the trials for changes in fasting blood glucose levels and HbA1c for second‐generation sulphonylurea versus metformin and for second‐generation sulphonylurea versus thiazolidinediones.
Some of the included trials reported continuous outcomes by last observation carried forward, which is considered an outdated way of imputing missing data as this kind of single value imputation exaggerates the precision of the overall estimate in the analysis (Fleming 2011). Several trials did not report the changes from baseline for the continuous outcomes during the intervention period and in that case we entered the end of follow‐up value into the meta‐analyses. However, as several of the trials were relatively small it might be that the groups were not well‐balanced at baseline.
Some of the included trials had a relatively small number of participants, and the resulting information size in the meta‐analyses was equally small. This increases the risk of providing a more unrealistic estimate of the intervention effects due to bias (systematic errors) and chance (random errors) (Savovic 2012; Thorlund 2011; Wetterslev 2008; Wood 2008). We have tried to clarify systematic errors. We contacted all authors for clarification if one of the bias domains was not adequately reported. We would have divided the analyses for the primary outcomes into high risk of bias trials versus lower risk of bias trials to reveal any influence of bias on the effect estimates of our primary outcomes, if the primary outcome had shown significance. To reduce the risk of random errors, we conducted trial sequential analysis on the primary outcomes and on those secondary outcomes showing statistical significance in both random‐effects and fixed‐effect models.
There was heterogeneity due to differences in patient characteristics, intervention targets and quality of the trials. For the continuous variables we preferably reported the change from baseline, and if the change was not reported, we applied the end of follow‐up value. Heterogeneity was high, but we decided to perform the meta‐analyses anyway. We conducted all meta‐analyses using both the random‐effects and the fixed‐effect model. Due to expected large heterogeneity, we predefined by default that we would report the outcomes using the random‐effects model, and only use the fixed‐effect model if the results differed. The fixed‐effect model assumes that the true intervention effect is the same in every randomised trial; that is, the effect is fixed across trials. On the contrary, the random‐effects model allows for the effects being estimated to differ across trials. When the heterogeneity increases, the estimated intervention effect may differ between the random‐effects model and the fixed‐effect model, and the confidence interval increases in the random‐effects model. In case of no heterogeneity (I2 = 0%), the two models tend to give the same result, and we only reported the random‐effects model. By adopting the random‐effects model, we were therefore able to pool a broader population of trials than by only relying on the results of the fixed‐effect model. On the other hand, the random‐effects model reduces the weight of the large trials, which might be more representative of a true intervention effect.
Potential biases in the review process
We searched conference proceedings and contacted authors in order to obtain unpublished trials. On the US Food and Drug Administration homepage, we found an approval letter for repaglinide, in which five potential relevant phase III trials are described (FDA 2000). Through contact with the sponsor of the trials, it was clarified that two of them were unpublished (AGEE/DCD/046/UK; AGEE/DCD/047/B/F/I). A strength of our systematic review is that several authors kindly provided unpublished data. We were therefore able to include unpublished data for 18 of the included trials (please see Included studies).
Several trials were published in more than one publication, which for some trials made it difficult to separate the primary publication from companion papers (for details see Included studies).
The data extraction was done independently by two authors. However, the authors extracting the data were not blinded regarding which trial they were extracting.
We included trials with a minimum duration of 24 weeks of sulphonylurea monotherapy in order to have a chance to detect clinically relevant differences for the outcomes. Unfortunately, we had a severe lack of long‐term trial data in this review. Especially, the reporting from the UKPDS trials was very poor and several outcomes were not reported to the longest follow‐up (UKPDS 1998; UKPDS 34 1998).
The main limitations for interpreting the results of this review relate to the, in general, poor quality of the trials, such as including insufficient reporting of randomisation, allocation and blinding. In addition, several of the trials were funded by the pharmaceutical industry, which might influence the reported results.
Agreements and disagreements with other studies or reviews
The University Group Diabetes Program (UGDP) trial was one of the first multicentre clinical trials designed to evaluate widely used methods for T2DM in the late 1950s and early 1960s (UGDP 1970). The sulphonylurea explored in the UGDP trial was tolbutamide, which was discontinued in June 1969 due to excess of all‐cause as well as cardiovascular mortality compared with placebo and insulin. A total of 89 deaths were reported in four intervention groups and it was decided to discontinue prescription of tolbutamide. To explore the reasons for the increased mortality, further analyses of the UGDP trial data have been done. Most of the excess mortality observed in the tolbutamide group appeared to be a result of increased mortality due to myocardial infarction (UGDP 1970). When monotherapy failed, one or more prescriptions of insulin were allowed to reduce blood glucose. At the time the UGDP trial was designed, there was no single definition of T2DM that had general acceptance. However, according to modern diagnostic criteria, the participants of the UGDP trial were more likely to be diagnosed with impaired glucose tolerance. Since the UGDP trial, only very few trials have compared first‐generation sulphonylurea with placebo or insulin. Our results show that only two trials could be included in the meta‐analysis of first‐generation sulphonylurea versus placebo and in the analysis of first‐generation sulphonylureas versus insulin. Besides, it is interesting that no meta‐analysis of patient‐important outcomes could be performed for the comparison of second‐generation sulphonylurea versus first‐generation sulphonylurea. The increased risk of adverse effects suggested with intervention of first‐generation sulphonylurea compared with newer generation of sulphonylurea is primarily based on animal studies and non‐randomised human studies (Fine 1970; Harrower 2000; Henquin 1992).
The United Kingdom Prospective Diabetes Study (UKPDS) trial started in 1977 (UKPDS 1998). By using the fasting plasma glucose criterion of 6.0 mmol/L, about 85% of all UKPDS participants would have fulfilled the 1985 World Health Organization (WHO) criteria for T2DM (fasting plasma glucose above 7.8 mmol/L). The UKPDS trial was a multicentre trial designed to assess the effect of intensive versus conventional glycaemic control. The participants in the intensive group were randomised to open‐label intervention with first‐generation sulphonylurea (chlorpropamide), second‐generation sulphonylurea (glibenclamide and glipizide) or insulin as monotherapy as well as a goal of fasting plasma glucose below 6 mmol/L, and those in the conventional group to diet only and a goal of fasting blood glucose below 15 mmol/L. In a subgroup of overweight patients intensive glycaemic control was achieved with metformin and a goal of fasting plasma glucose below 6.0 mmol/L (UKPDS 34 1998). In case of monotherapy failure addition of other antidiabetic drugs was allowed when persistent hyperglycaemia was present. A subgroup of patients with asymptomatic failure with sulphonylurea alone was randomly allocated to addition of metformin or continued sulphonylurea. There was no evidence of any major detrimental effect on mortality of the drugs or insulin in monotherapy. Notably, increased mortality was not seen with first‐generation sulphonylurea although the comparison against metformin was not reported. Unfortunately none of the outcomes for the comparison between sulphonylurea and metformin from the UKPDS trial could be included to the longest follow‐up in our meta‐analysis due to the way of reporting (UKPDS 34 1998). In the design article of the UKPDS trial it is stated that the obese participants allocated to metformin and sulphonylurea will be compared. However, these data are unfortunately not published, but would probably increase the number of patient‐important meta‐analyses (UKPDS 34 1998). Metformin appeared to have a favourable effect on mortality and cardiovascular outcomes compared with either the conventional group or with a combined group of the other intensive therapies (first and second‐generation sulphonylureas and insulin). However, combined therapy of metformin and sulphonylurea appeared to have a harmful effect on mortality compared with sulphonylureas alone (UKPDS 34 1998). Neither are the patient‐important outcomes from the participants randomised to glipizide and chlorpropamide in the Glucose II trial published (UKPDS 1998).
Recently, a large‐scale, double‐blind, randomised clinical trial, the A Diabetes Outcome Progression Trial (ADOPT), was published. The participants were randomised to monotherapy with metformin, glibenclamide or rosiglitazone (ADOPT 2006). If monotherapy failed, escape medicine was not allowed. The ADOPT trial demonstrated fewer macrovascular events with glibenclamide monotherapy compared with thiazolidinedione monotherapy. There were also nominally fewer events with glibenclamide than metformin, however, the statistical comparison of these groups was not reported for vascular outcomes. In addition, it should be noted that time to treatment failure, and not vascular outcomes, was the primary outcome in the ADOPT trial.
Besides the fear of cardiovascular adverse effects, other concerns have been raised regarding sulphonylurea intervention: the risk of beta‐cell exhaustion with time, the risk of severe hypoglycaemia and weight gain. For the comparisons where we were able to meta‐analyse intervention failure, none of them showed significance in favour of the comparators. On the other hand, the comparisons of second‐generation sulphonylureas versus placebo, second‐generation sulphonylurea versus alpha‐glucosidase inhibitors and third‐generation sulphonylureas versus thiazolidinediones, significantly favoured sulphonylurea. However, few trials were included in these meta‐analyses and trial sequential analyses showed that firm evidence was far from being present. The ADOPT trial suggested, as its primary outcome, rosiglitazone treatment to be significantly better than glibenclamide (or metformin) in terms of intervention failure. However, we could only confirm such an effect of thiazolidinediones versus sulphonylurea in the fixed‐effect model, and not in the random‐effects model. Weight gain was more pronounced with a second‐generation sulphonylurea compared with metformin, incretin‐based interventions and first‐generation sulphonylurea. However, it was less pronounced for second‐generation sulphonylureas compared with thiazolidinediones. For the remaining comparisons in which meta‐analyses were applicable, there was no significant difference in change of weight from baseline. The change in BMI from baseline did not show statistical significance for the comparison of second‐generation sulphonylurea with metformin. We would have expected that change in BMI from baseline was in favour of metformin. The reason for lack of statistical significance is probably due to only a few trials contributing with data (Collier 1989; Lawrence 2004; Tosi 2003). Besides, two of these trials did not report change from baseline, but end of follow‐up values (Collier 1989; Lawrence 2004). Both of these trials had a small sample size and a duration of six months and a higher BMI at baseline in the metformin group. This may explain the lack of statistical significance in this analysis.
For the comparison second‐generation sulphonylurea versus metformin and thiazolidinediones we found statistical significant changes in fasting blood glucose from baseline and lower risk of mild as well as severe hypoglycaemia in favour of the comparators. However, the magnitude of the achieved differences in fasting blood glucose for the comparators compared with second‐generation sulphonylurea was minor, and of doubtful clinical importance (second‐generation sulphonylurea versus metformin: 0.43 mmol/L; second‐generation sulphonylurea versus thiazolidinediones: 0.56 mmol/L). A Cochrane review of metformin monotherapy also found less hypoglycaemia with metformin compared with sulphonylurea and improved glycaemic control in terms of fasting blood glucose and HbA1c (Saenz 2005). However, we did only find statistical significance for a lower HbA1c in favour of metformin in the fixed‐effect model. A Cochrane review about rosiglitazone also reported a lower risk of hypoglycaemia with rosiglitazone compared with sulphonylurea (Richter 2007). However, this Cochrane review did not report the changes in fasting blood glucose between rosiglitazone and sulphonylurea (Richter 2007).
The conclusions in other Cochrane reviews about glucose‐lowering interventions in patients with T2DM did also find sparse reporting of patient‐important outcomes (Black 2007; Liu 2002; Ooi 2010; Richter 2006; Richter 2007; Richter 2008; Saenz 2005; Van de Laar 2005). Unlike our present review, a the Cochrane review of metformin monotherapy could include mortality and vascular outcomes from UKPDS – however, like our review, not for metformin versus sulphonylurea (Saenz 2005). The Cochrane review of metformin monotherapy made a pooled analysis of non‐UKPDS trials having various comparators, which showed no significant difference for mortality or vascular outcomes as well as a separate analysis of UKPDS, which corroborated most of the previous conclusions from the UKPDS. The conclusion from that Cochrane review was that metformin might be beneficial regarding cardiovascular outcomes in obese patients with T2DM (Saenz 2005).
A Danish retrospective cohort study compared patients receiving monotherapy with insulin secretagogues, including the meglitinides, to metformin monotherapy (Schramm 2011). The median duration of follow‐up was 3.3 years and a total of 107,806 patients were included in the analysis. The conclusion from the study was that monotherapy with most first‐ and second‐generation sulphonylureas seems to be associated with increased mortality and cardiovascular risk compared to metformin (Schramm 2011). However, we could not confirm this finding in our analysis of prospective randomised trials, which could be due to low power in our analyses. On the other hand, there may be several confounding factors some of which may be undetected in the observational study (Deeks 2003).
The evidence supporting the use of sulphonylureas as monotherapy in patients with T2DM is limited, as is the case in fact with all existing glucose‐lowering interventions. Current guidelines recommending metformin as first‐line monotherapy are based mainly on the reduced risk of hypoglycaemia and weight gain with metformin compared to sulphonylureas (Inzucchi 2012; Nathan 2009). The rationale for recommending metformin monotherapy as first‐line intervention is to a large extent based on the UKPDS trial, which allocated 342 overweight/obese participants to metformin monotherapy. However, the UKPDS trial having the longest follow‐up comparing metformin with other comparators (including sulphonylureas and insulin) does not present cardiovascular outcomes allowing the differentiation between classes of sulphonylureas (UKPDS 34 1998). Moreover, there seems to be very limited evidence for announcing any intervention in this systematic review to be superior to another on patient‐important outcomes.
Study flow diagram.
N = number of references
'Risk of bias' graph: review authors' judgements about each risk of bias item presented as percentages across all included studies.
'Risk of bias' summary: review authors' judgements about each risk of bias item for each included study.

Comparison 1 Sulphonylureas versus placebo, Outcome 1 All‐cause mortality.

Comparison 1 Sulphonylureas versus placebo, Outcome 2 All‐cause mortality; best‐worst case scenario.

Comparison 1 Sulphonylureas versus placebo, Outcome 3 All‐cause mortality; worst‐best case scenario.
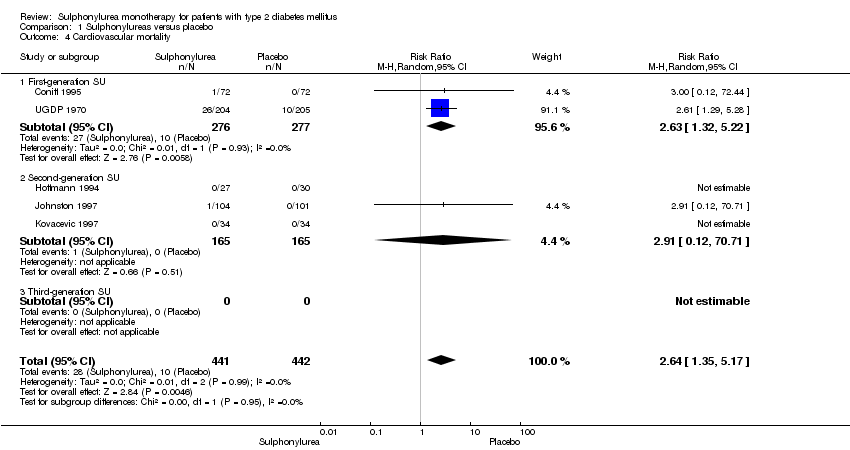
Comparison 1 Sulphonylureas versus placebo, Outcome 4 Cardiovascular mortality.

Comparison 1 Sulphonylureas versus placebo, Outcome 5 Non‐fatal macrovascular outcomes.
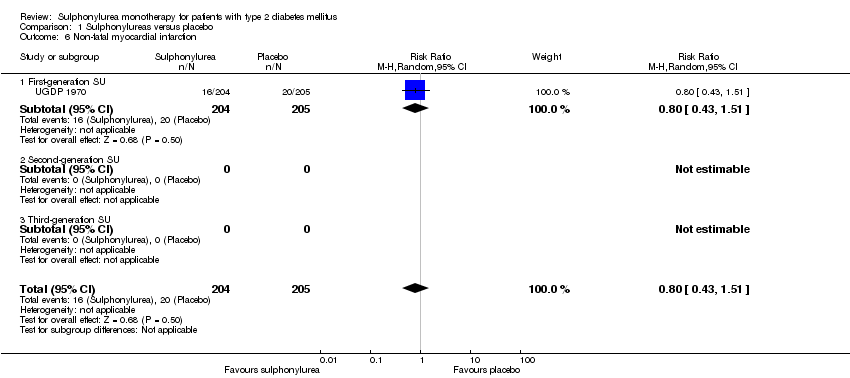
Comparison 1 Sulphonylureas versus placebo, Outcome 6 Non‐fatal myocardial infarction.

Comparison 1 Sulphonylureas versus placebo, Outcome 7 Amputation of lower extremity.
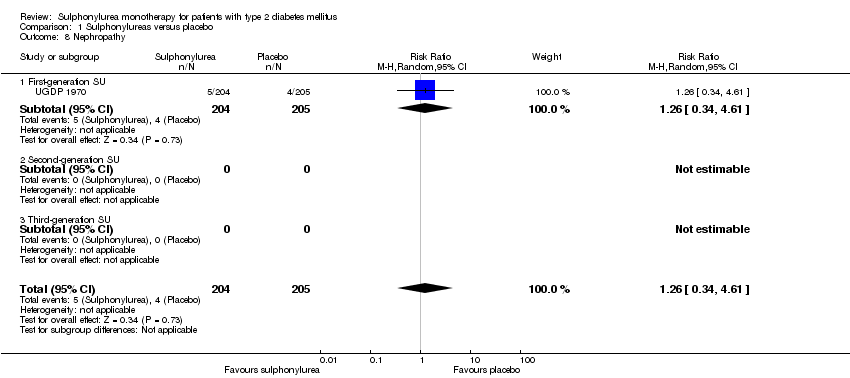
Comparison 1 Sulphonylureas versus placebo, Outcome 8 Nephropathy.
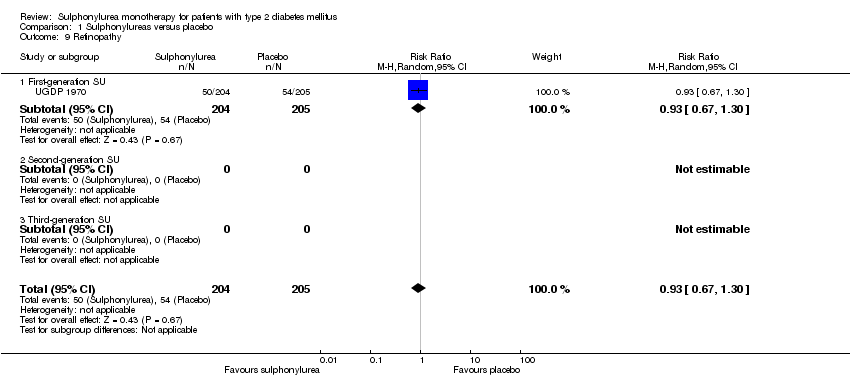
Comparison 1 Sulphonylureas versus placebo, Outcome 9 Retinopathy.

Comparison 1 Sulphonylureas versus placebo, Outcome 10 Change in fasting blood glucose from baseline (mmol/L).

Comparison 1 Sulphonylureas versus placebo, Outcome 11 Change in HbA1c from baseline (%).

Comparison 1 Sulphonylureas versus placebo, Outcome 12 Change in BMI from baseline (kg/m2).
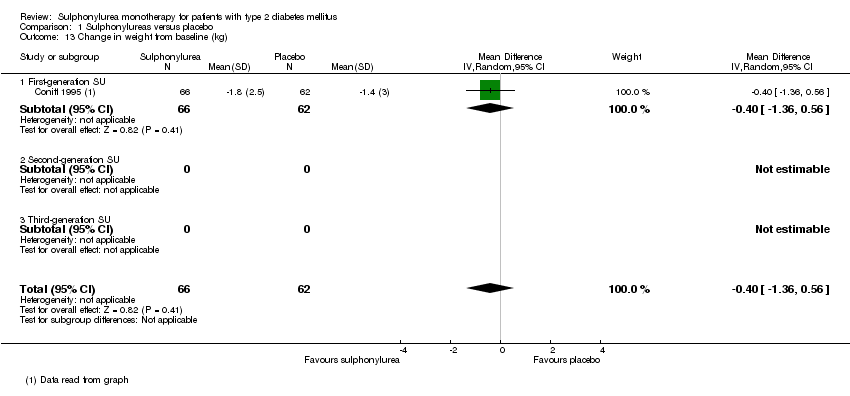
Comparison 1 Sulphonylureas versus placebo, Outcome 13 Change in weight from baseline (kg).
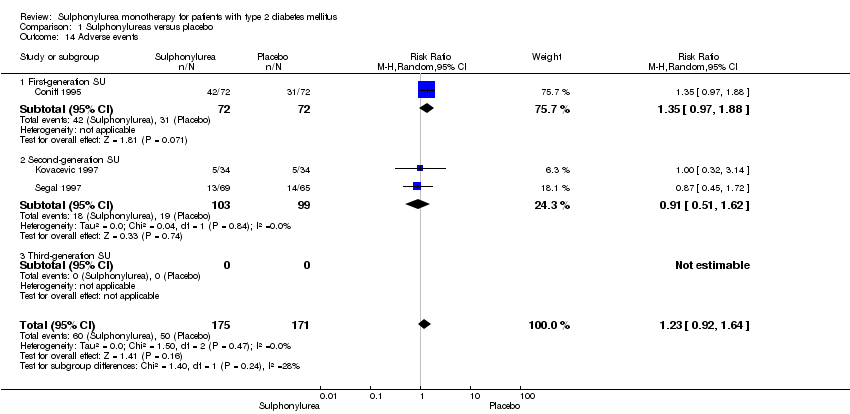
Comparison 1 Sulphonylureas versus placebo, Outcome 14 Adverse events.

Comparison 1 Sulphonylureas versus placebo, Outcome 15 Drop‐outs due to adverse events.
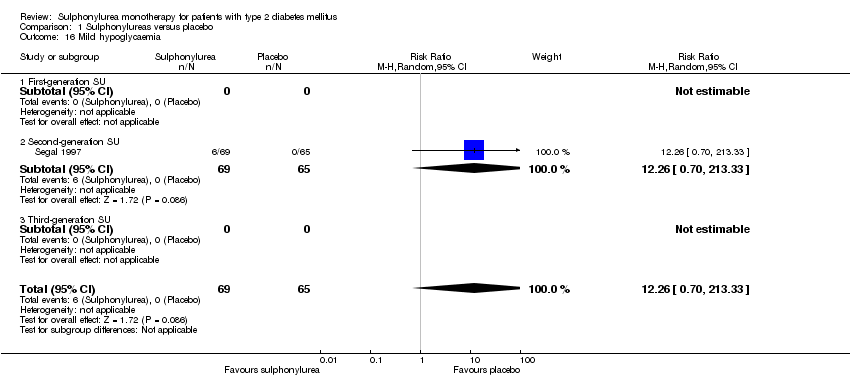
Comparison 1 Sulphonylureas versus placebo, Outcome 16 Mild hypoglycaemia.

Comparison 1 Sulphonylureas versus placebo, Outcome 17 Severe hypoglycaemia.
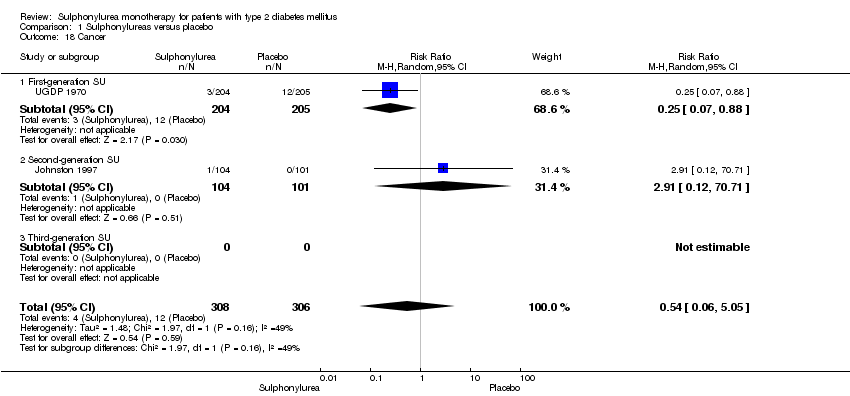
Comparison 1 Sulphonylureas versus placebo, Outcome 18 Cancer.
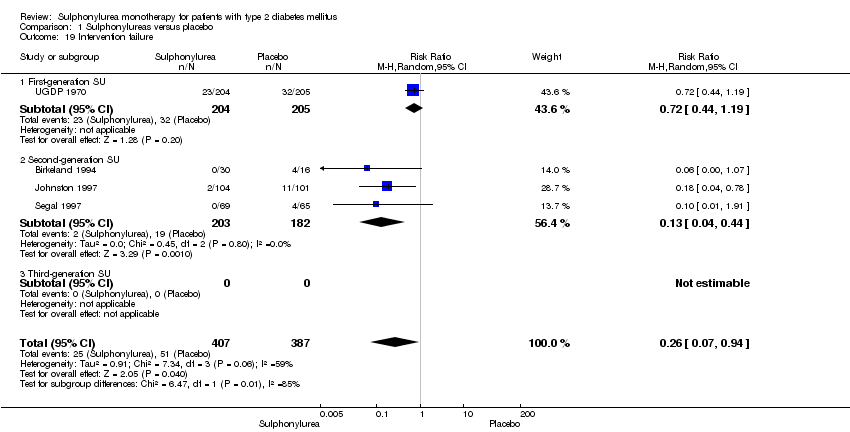
Comparison 1 Sulphonylureas versus placebo, Outcome 19 Intervention failure.

Comparison 2 Sulphonylureas versus metformin, Outcome 1 All‐cause mortality.

Comparison 2 Sulphonylureas versus metformin, Outcome 2 All‐cause mortality; best‐worst case scenario.
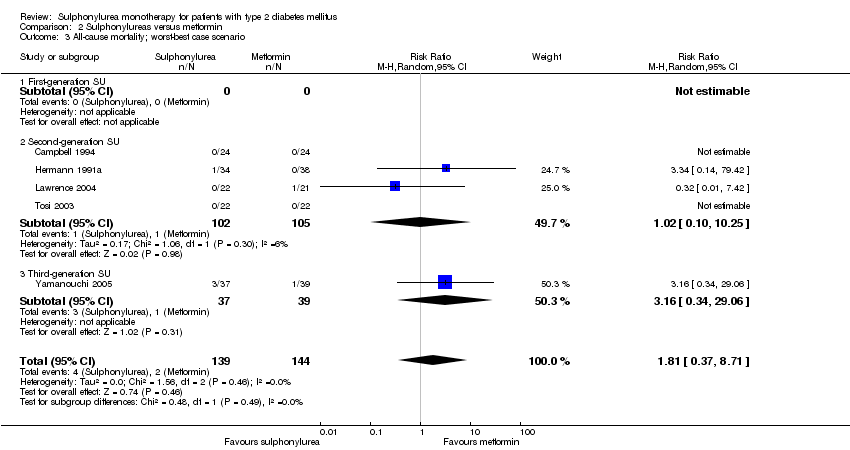
Comparison 2 Sulphonylureas versus metformin, Outcome 3 All‐cause mortality; worst‐best case scenario.
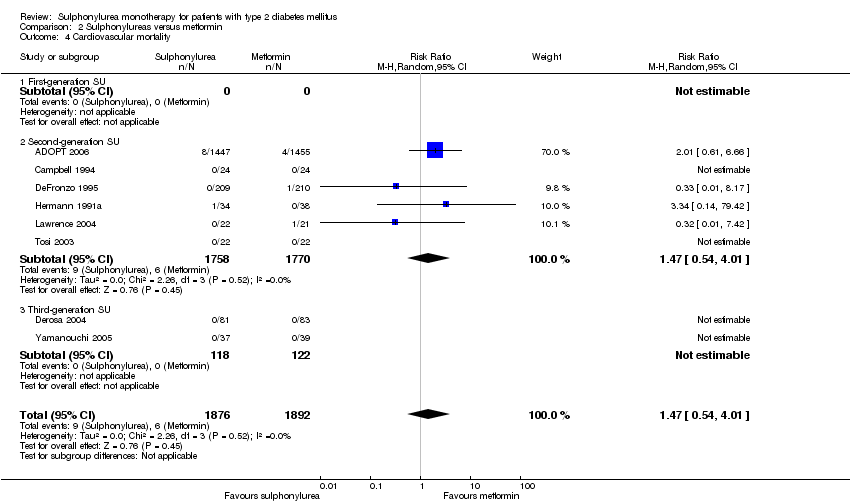
Comparison 2 Sulphonylureas versus metformin, Outcome 4 Cardiovascular mortality.

Comparison 2 Sulphonylureas versus metformin, Outcome 5 Non‐fatal macrovascular outcomes.

Comparison 2 Sulphonylureas versus metformin, Outcome 6 Non‐fatal myocardial infarction.

Comparison 2 Sulphonylureas versus metformin, Outcome 7 Non‐fatal stroke.

Comparison 2 Sulphonylureas versus metformin, Outcome 8 Amputation of lower extremity.

Comparison 2 Sulphonylureas versus metformin, Outcome 9 Peripheral revascularisation.

Comparison 2 Sulphonylureas versus metformin, Outcome 10 Microvascular outcomes.
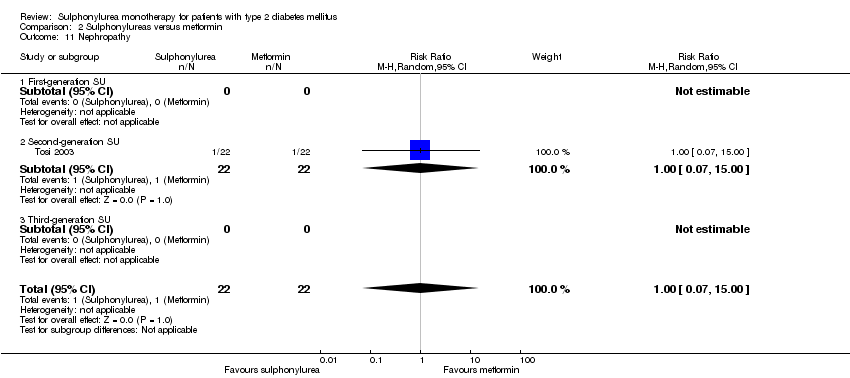
Comparison 2 Sulphonylureas versus metformin, Outcome 11 Nephropathy.

Comparison 2 Sulphonylureas versus metformin, Outcome 12 Retinal photocoagulation.
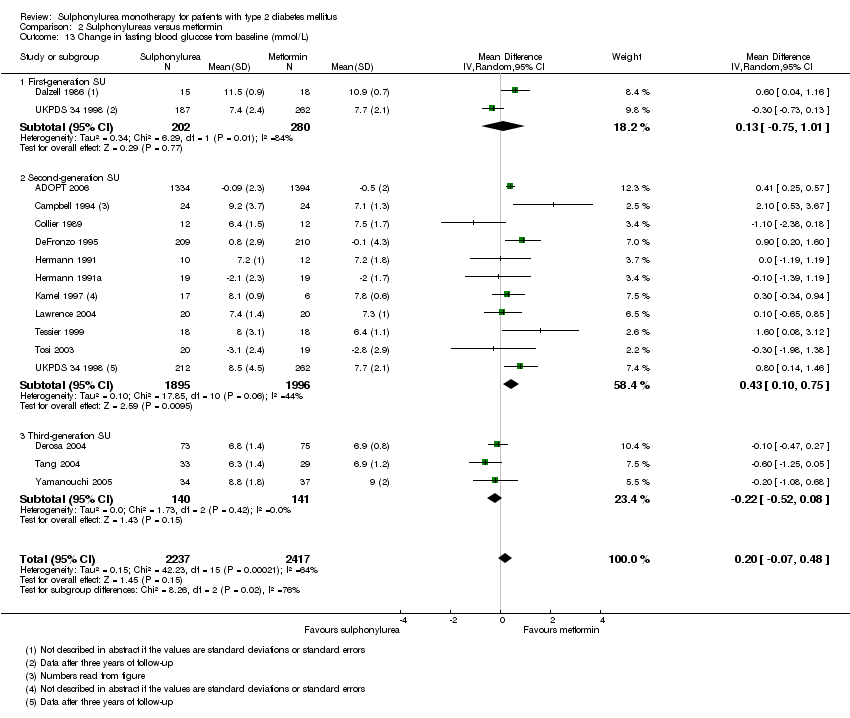
Comparison 2 Sulphonylureas versus metformin, Outcome 13 Change in fasting blood glucose from baseline (mmol/L).

Comparison 2 Sulphonylureas versus metformin, Outcome 14 Change in HbA1c from baseline (%).
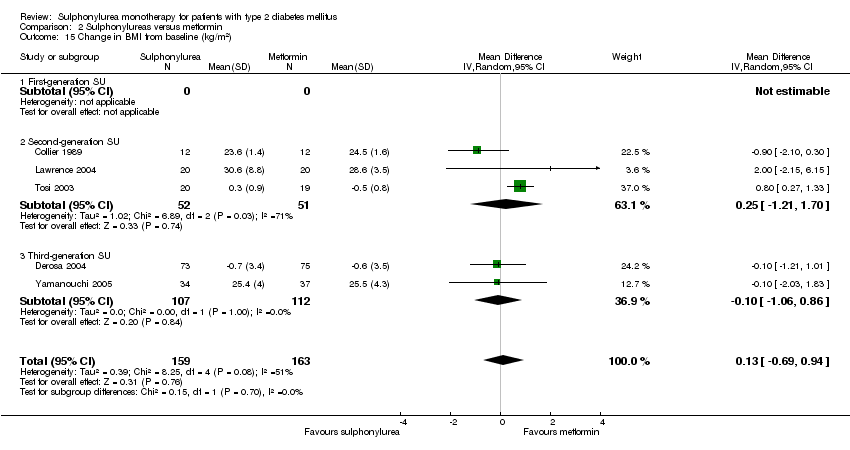
Comparison 2 Sulphonylureas versus metformin, Outcome 15 Change in BMI from baseline (kg/m2).

Comparison 2 Sulphonylureas versus metformin, Outcome 16 Change in weight from baseline (kg).
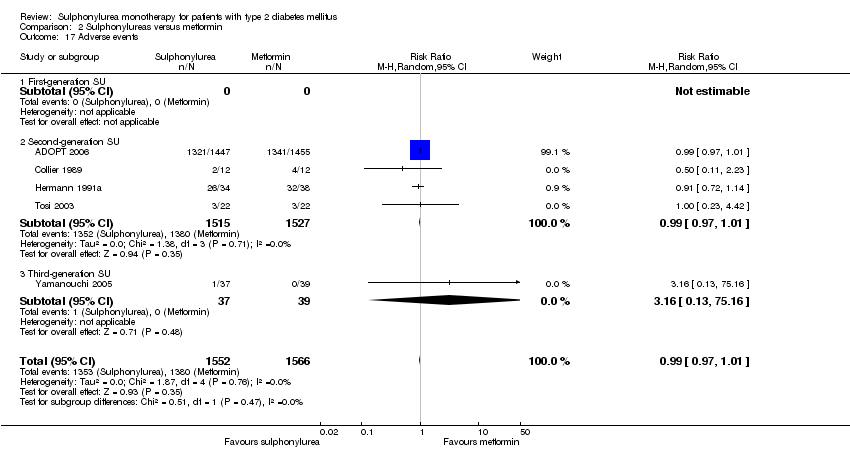
Comparison 2 Sulphonylureas versus metformin, Outcome 17 Adverse events.

Comparison 2 Sulphonylureas versus metformin, Outcome 18 Serious adverse events.

Comparison 2 Sulphonylureas versus metformin, Outcome 19 Drop‐outs due to adverse events.
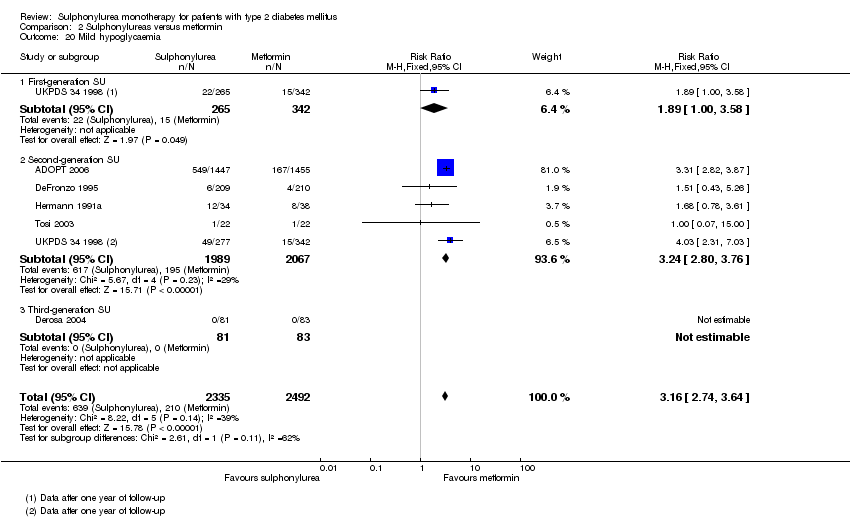
Comparison 2 Sulphonylureas versus metformin, Outcome 20 Mild hypoglycaemia.

Comparison 2 Sulphonylureas versus metformin, Outcome 21 Moderate hypoglycaemia.
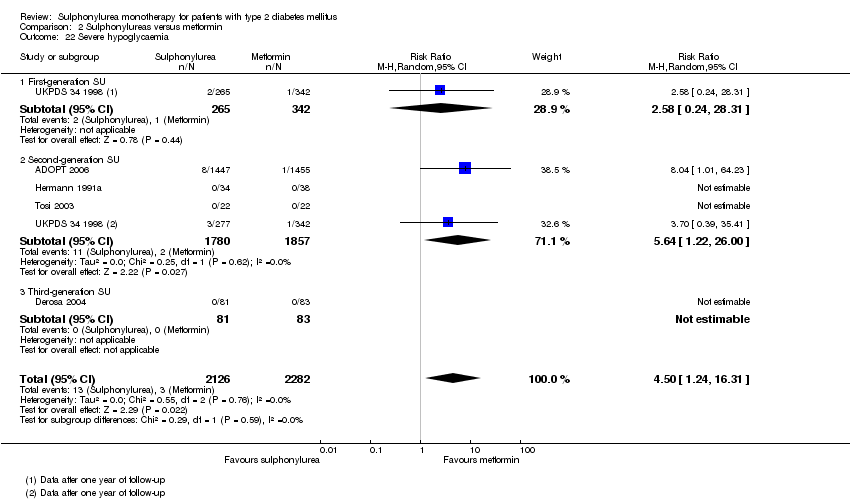
Comparison 2 Sulphonylureas versus metformin, Outcome 22 Severe hypoglycaemia.

Comparison 2 Sulphonylureas versus metformin, Outcome 23 Cancer.
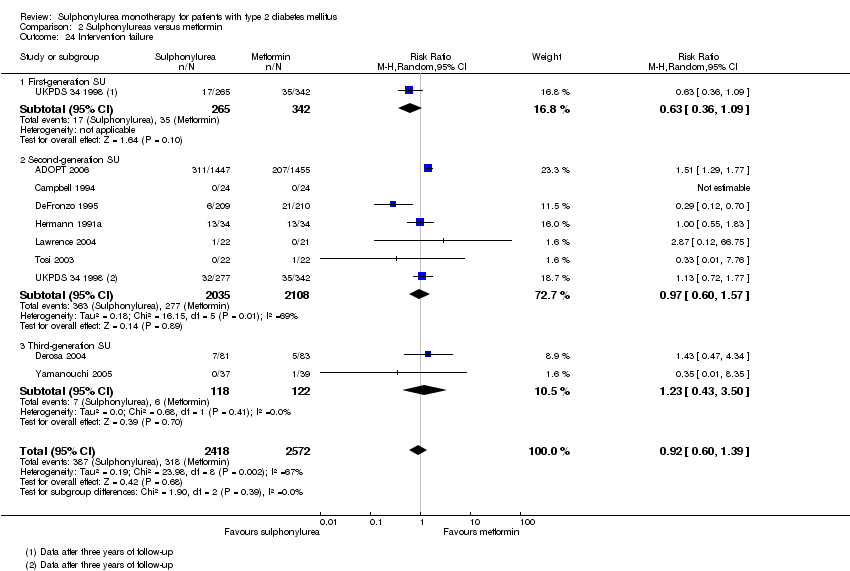
Comparison 2 Sulphonylureas versus metformin, Outcome 24 Intervention failure.

Comparison 3 Sulphonylureas versus thiazolidinediones, Outcome 1 All‐cause mortality.

Comparison 3 Sulphonylureas versus thiazolidinediones, Outcome 2 All‐cause mortality; best‐worst case scenario.

Comparison 3 Sulphonylureas versus thiazolidinediones, Outcome 3 All‐cause mortality; worst‐best case scenario.
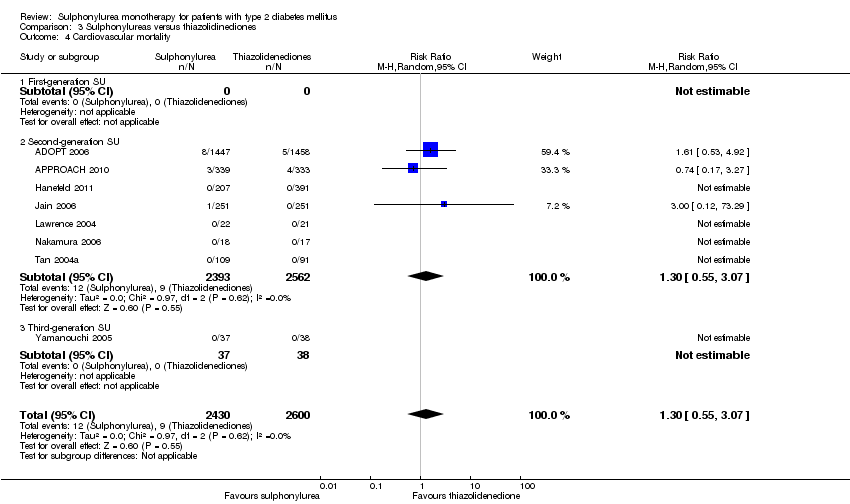
Comparison 3 Sulphonylureas versus thiazolidinediones, Outcome 4 Cardiovascular mortality.
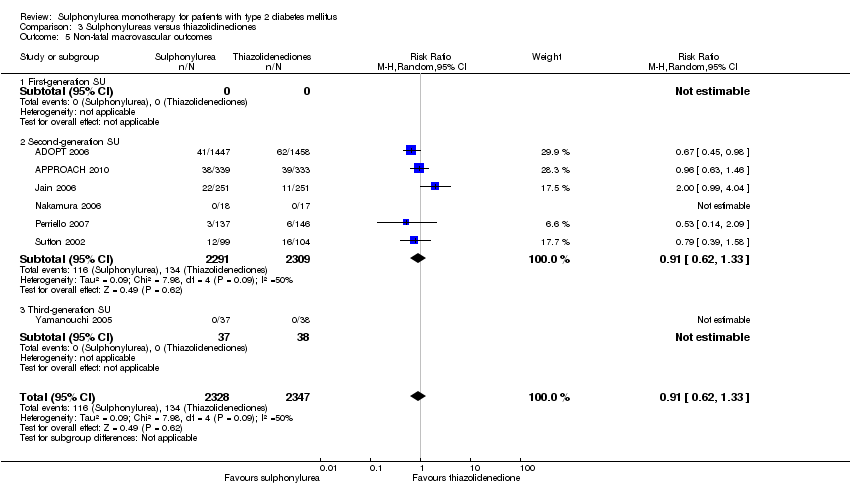
Comparison 3 Sulphonylureas versus thiazolidinediones, Outcome 5 Non‐fatal macrovascular outcomes.
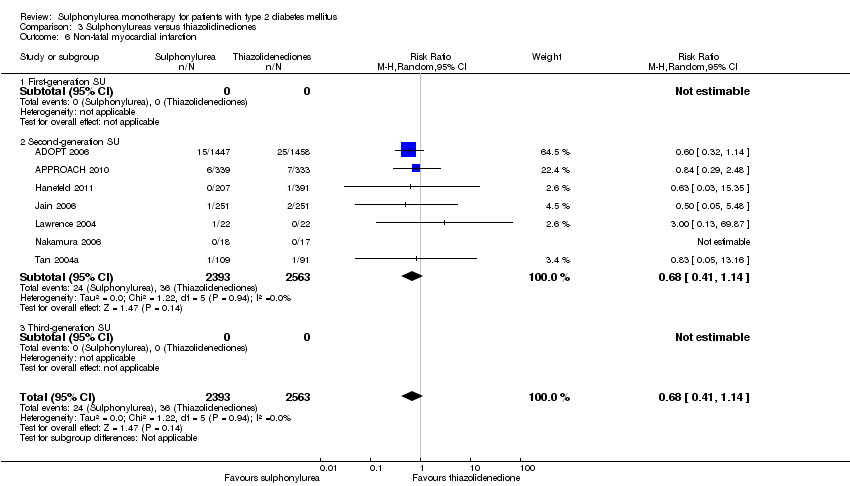
Comparison 3 Sulphonylureas versus thiazolidinediones, Outcome 6 Non‐fatal myocardial infarction.

Comparison 3 Sulphonylureas versus thiazolidinediones, Outcome 7 Non‐fatal stroke.

Comparison 3 Sulphonylureas versus thiazolidinediones, Outcome 8 Amputation of lower extremity.
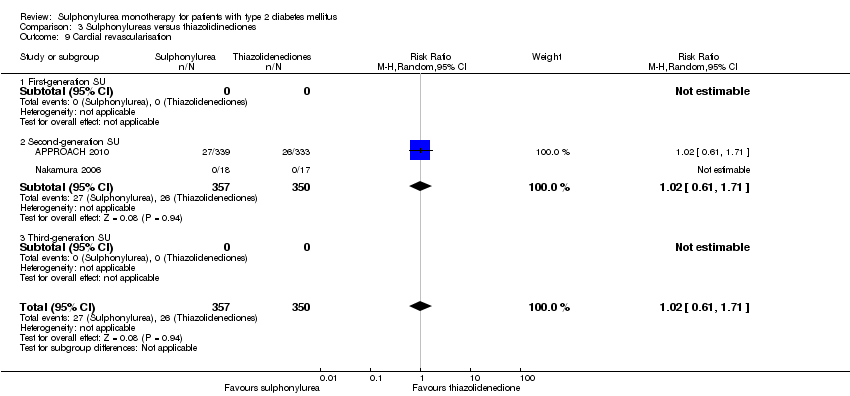
Comparison 3 Sulphonylureas versus thiazolidinediones, Outcome 9 Cardial revascularisation.
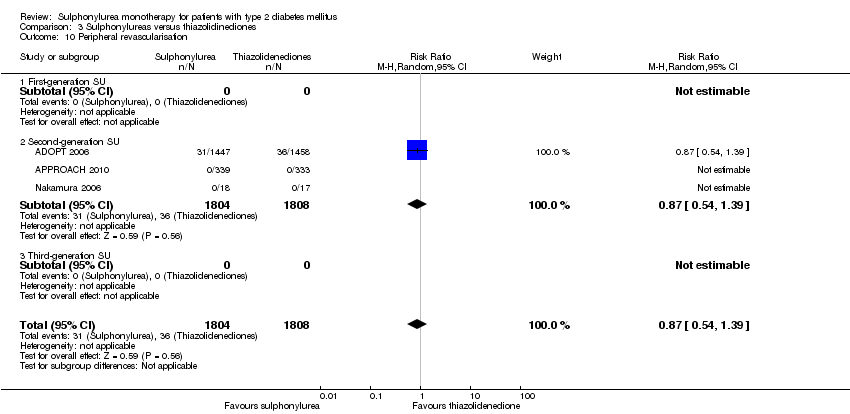
Comparison 3 Sulphonylureas versus thiazolidinediones, Outcome 10 Peripheral revascularisation.
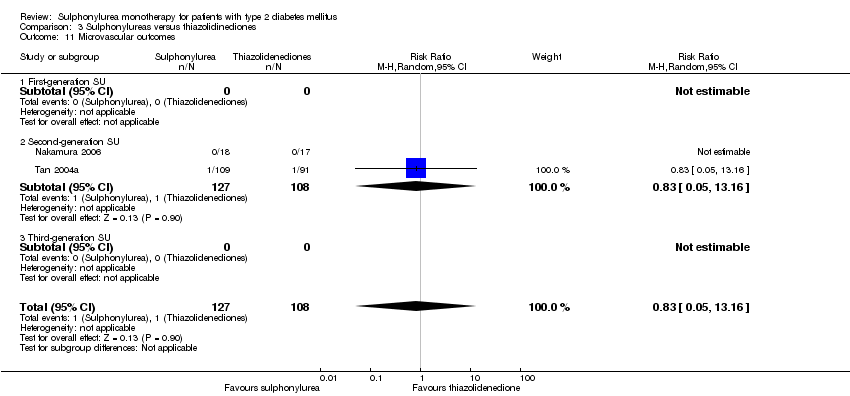
Comparison 3 Sulphonylureas versus thiazolidinediones, Outcome 11 Microvascular outcomes.
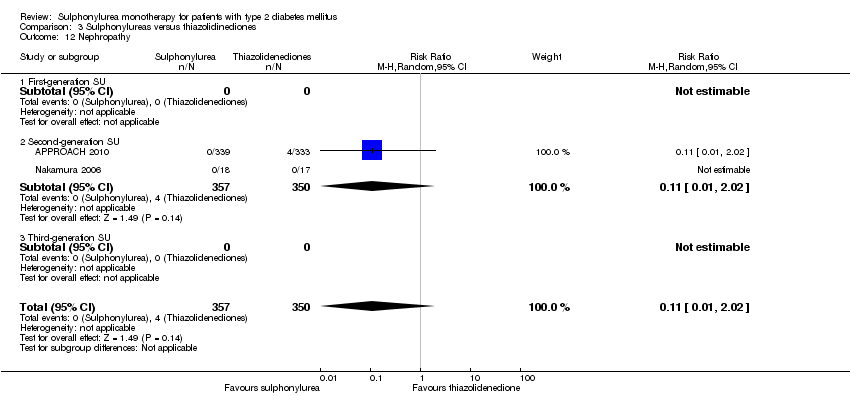
Comparison 3 Sulphonylureas versus thiazolidinediones, Outcome 12 Nephropathy.
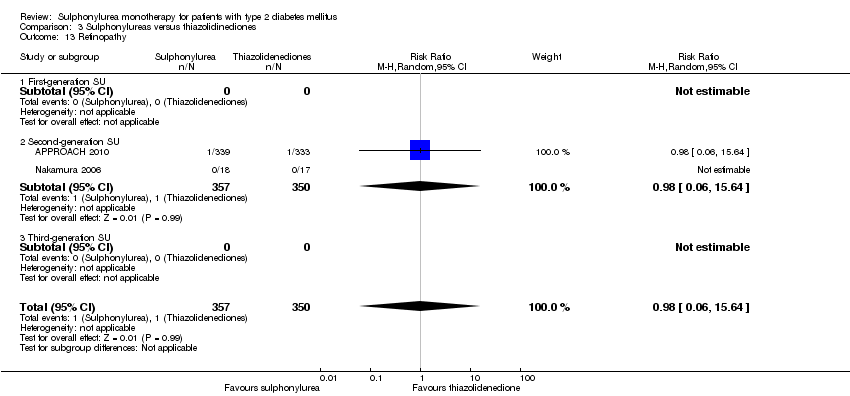
Comparison 3 Sulphonylureas versus thiazolidinediones, Outcome 13 Retinopathy.
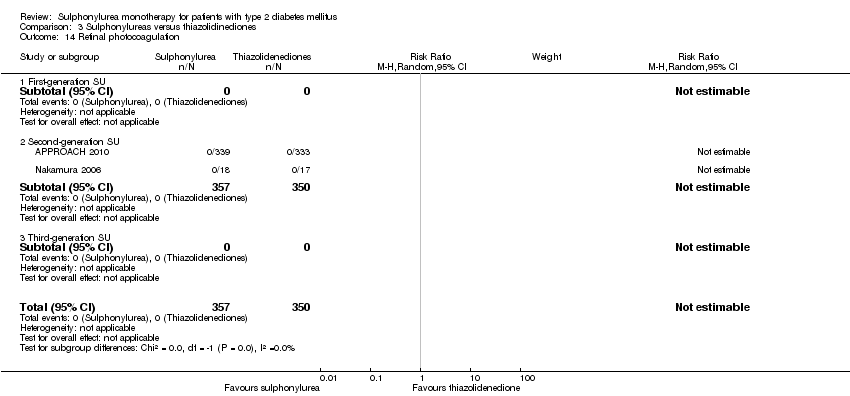
Comparison 3 Sulphonylureas versus thiazolidinediones, Outcome 14 Retinal photocoagulation.

Comparison 3 Sulphonylureas versus thiazolidinediones, Outcome 15 Change in fasting blood glucose from baseline (mmol/L).

Comparison 3 Sulphonylureas versus thiazolidinediones, Outcome 16 Change in HbA1c from baseline (%).
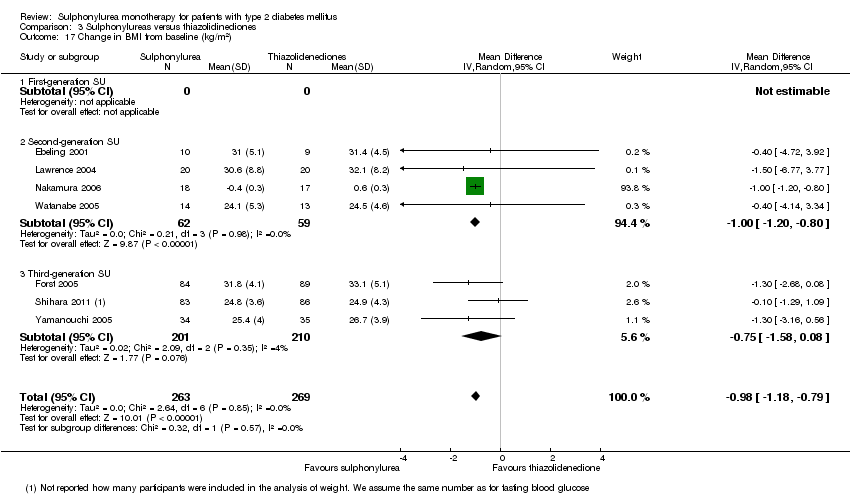
Comparison 3 Sulphonylureas versus thiazolidinediones, Outcome 17 Change in BMI from baseline (kg/m2).

Comparison 3 Sulphonylureas versus thiazolidinediones, Outcome 18 Change in weight from baseline (kg).

Comparison 3 Sulphonylureas versus thiazolidinediones, Outcome 19 Adverse events.
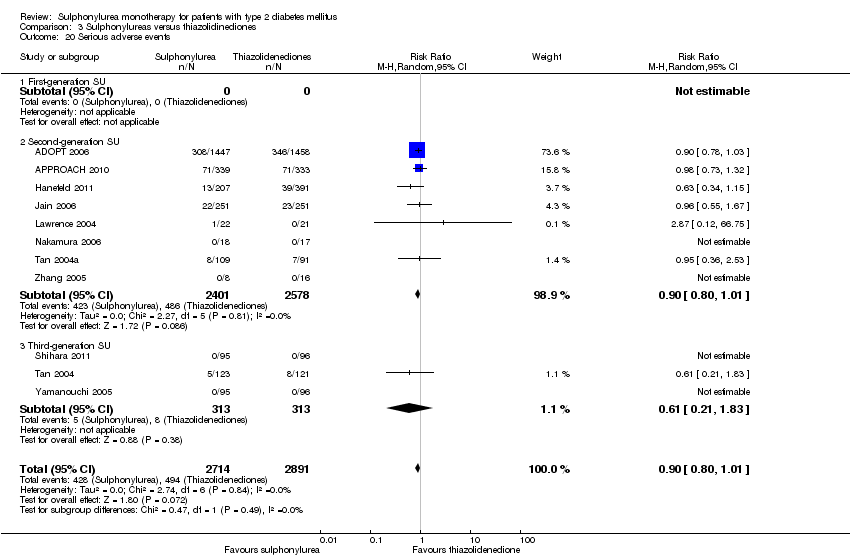
Comparison 3 Sulphonylureas versus thiazolidinediones, Outcome 20 Serious adverse events.
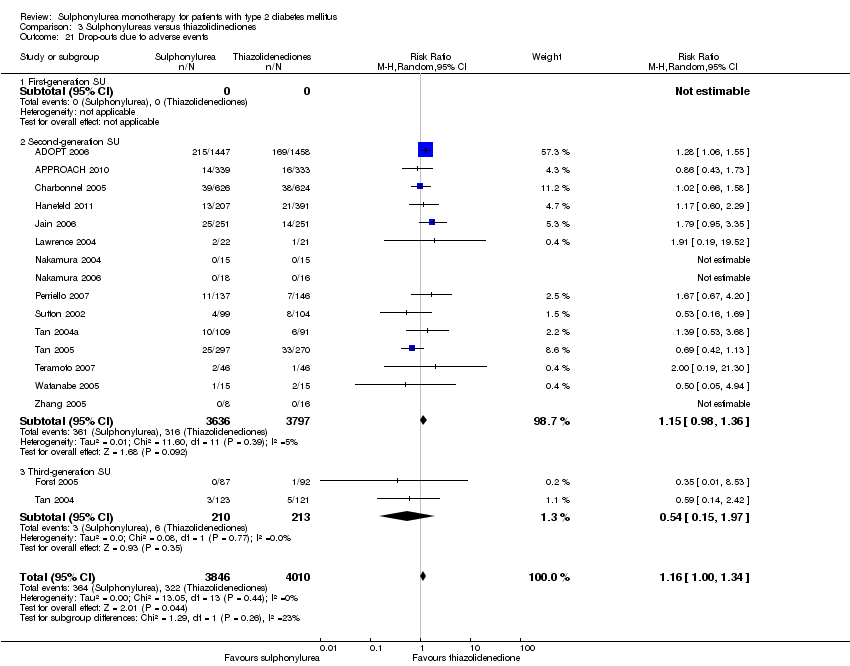
Comparison 3 Sulphonylureas versus thiazolidinediones, Outcome 21 Drop‐outs due to adverse events.

Comparison 3 Sulphonylureas versus thiazolidinediones, Outcome 22 Mild hypoglycaemia.

Comparison 3 Sulphonylureas versus thiazolidinediones, Outcome 23 Moderate hypoglycaemia.

Comparison 3 Sulphonylureas versus thiazolidinediones, Outcome 24 Severe hypoglycaemia.
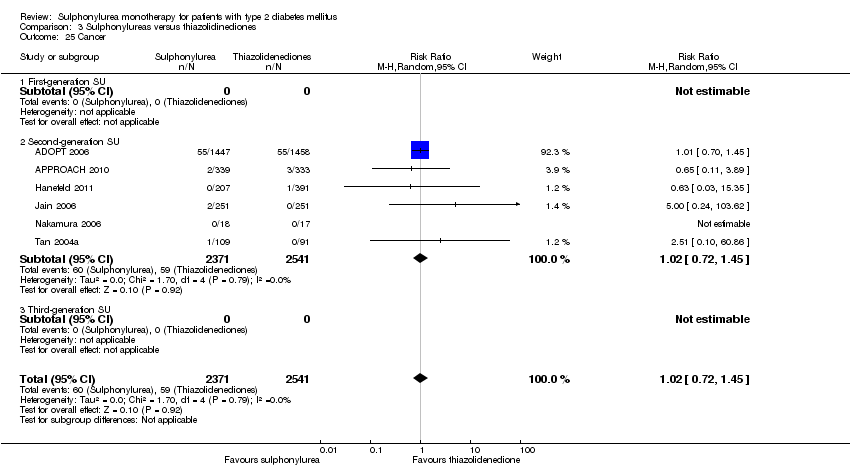
Comparison 3 Sulphonylureas versus thiazolidinediones, Outcome 25 Cancer.

Comparison 3 Sulphonylureas versus thiazolidinediones, Outcome 26 Intervention failure.

Comparison 4 Sulphonylureas versus insulin, Outcome 1 All‐cause mortality.
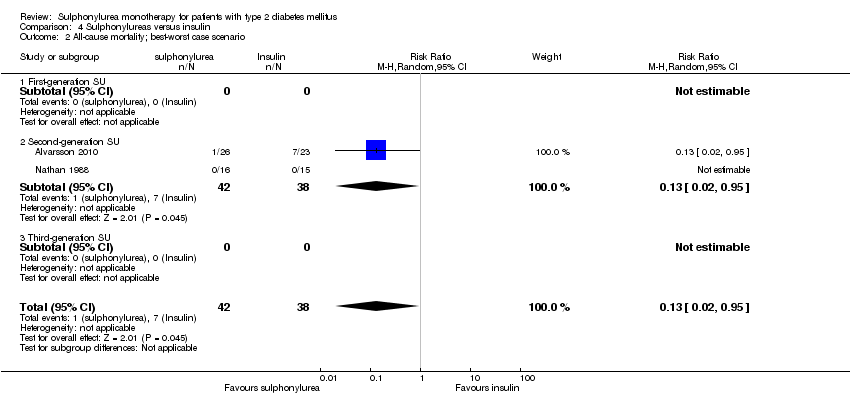
Comparison 4 Sulphonylureas versus insulin, Outcome 2 All‐cause mortality; best‐worst case scenario.

Comparison 4 Sulphonylureas versus insulin, Outcome 3 All‐cause mortality; worst‐best case scenario.
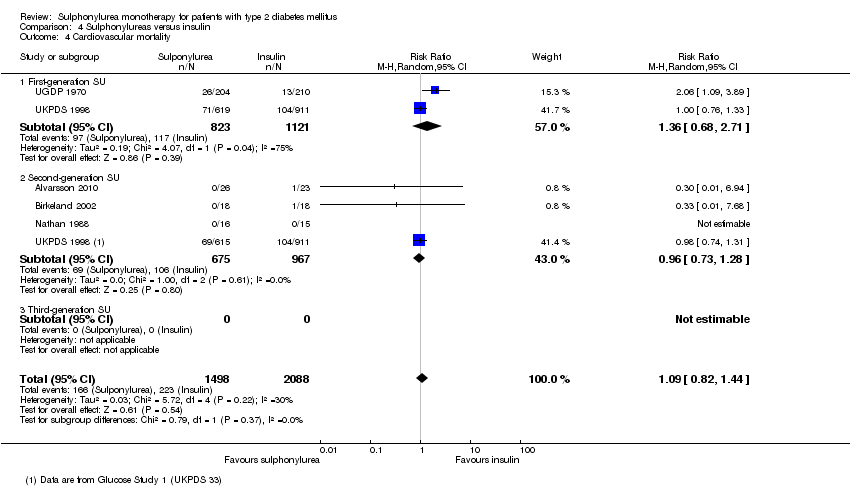
Comparison 4 Sulphonylureas versus insulin, Outcome 4 Cardiovascular mortality.

Comparison 4 Sulphonylureas versus insulin, Outcome 5 Non‐fatal myocardial infarction.
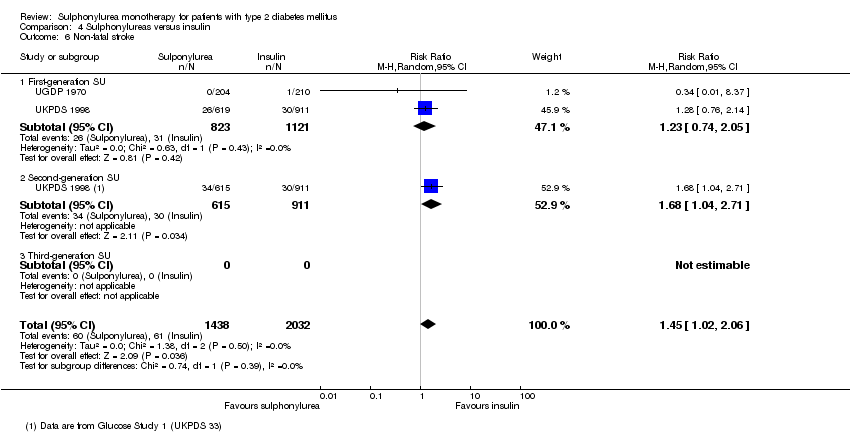
Comparison 4 Sulphonylureas versus insulin, Outcome 6 Non‐fatal stroke.

Comparison 4 Sulphonylureas versus insulin, Outcome 7 Amputation of lower extremity.
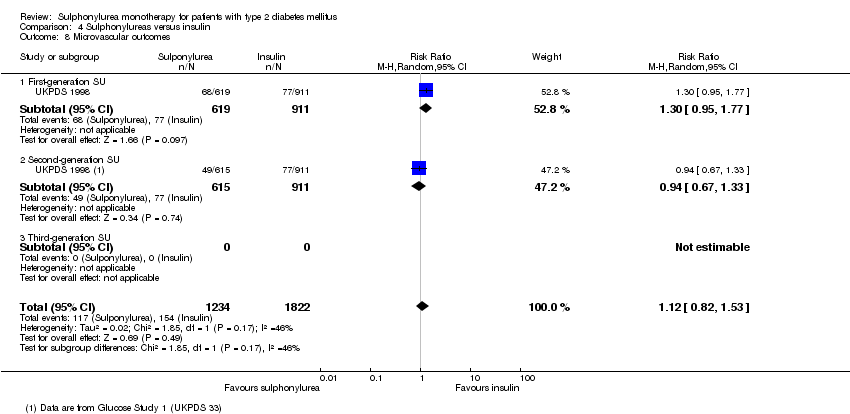
Comparison 4 Sulphonylureas versus insulin, Outcome 8 Microvascular outcomes.
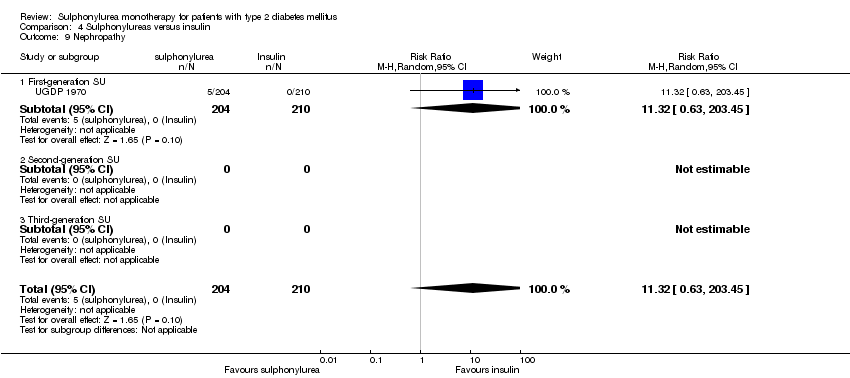
Comparison 4 Sulphonylureas versus insulin, Outcome 9 Nephropathy.

Comparison 4 Sulphonylureas versus insulin, Outcome 10 Retinopathy.

Comparison 4 Sulphonylureas versus insulin, Outcome 11 Retinal photocoagulation.
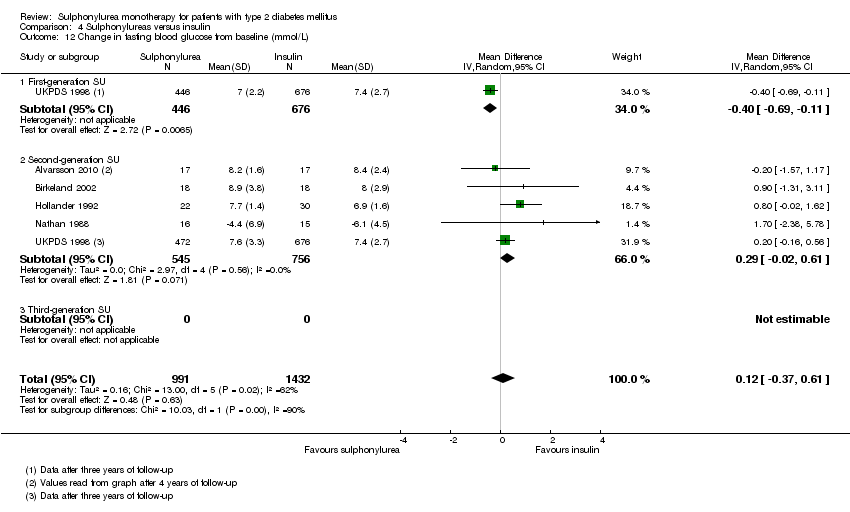
Comparison 4 Sulphonylureas versus insulin, Outcome 12 Change in fasting blood glucose from baseline (mmol/L).
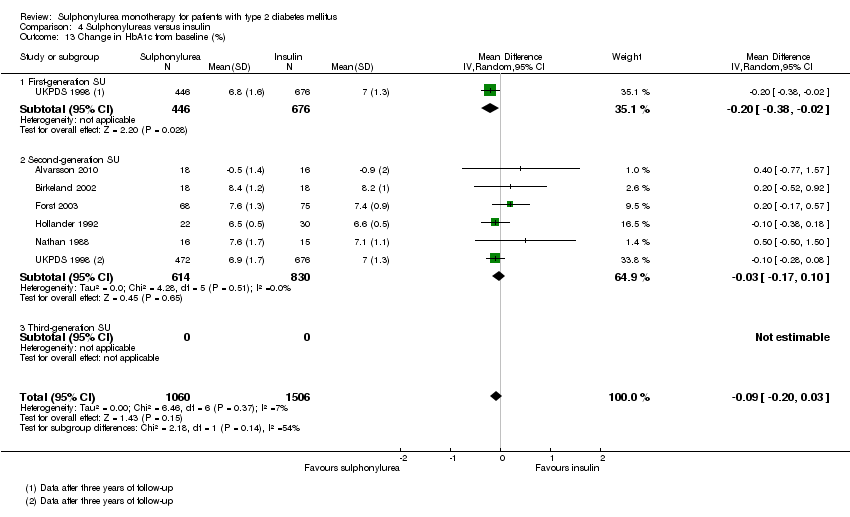
Comparison 4 Sulphonylureas versus insulin, Outcome 13 Change in HbA1c from baseline (%).

Comparison 4 Sulphonylureas versus insulin, Outcome 14 Change in BMI from baseline (kg/m2).

Comparison 4 Sulphonylureas versus insulin, Outcome 15 Change in weight from baseline (kg).

Comparison 4 Sulphonylureas versus insulin, Outcome 16 Adverse events.

Comparison 4 Sulphonylureas versus insulin, Outcome 17 Drop‐outs due to adverse events.
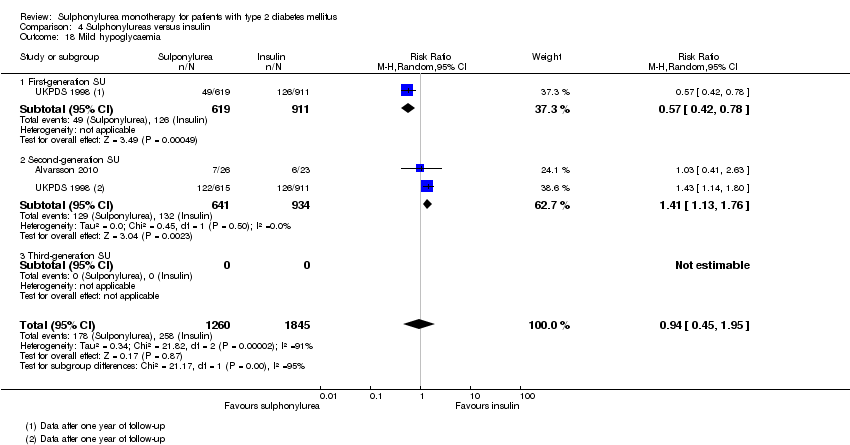
Comparison 4 Sulphonylureas versus insulin, Outcome 18 Mild hypoglycaemia.

Comparison 4 Sulphonylureas versus insulin, Outcome 19 Severe hypoglycaemia.

Comparison 4 Sulphonylureas versus insulin, Outcome 20 Cancer.

Comparison 4 Sulphonylureas versus insulin, Outcome 21 Intervention failure.

Comparison 5 Sulphonylureas versus alpha‐glucosidase inhibitors, Outcome 1 All‐cause mortality.
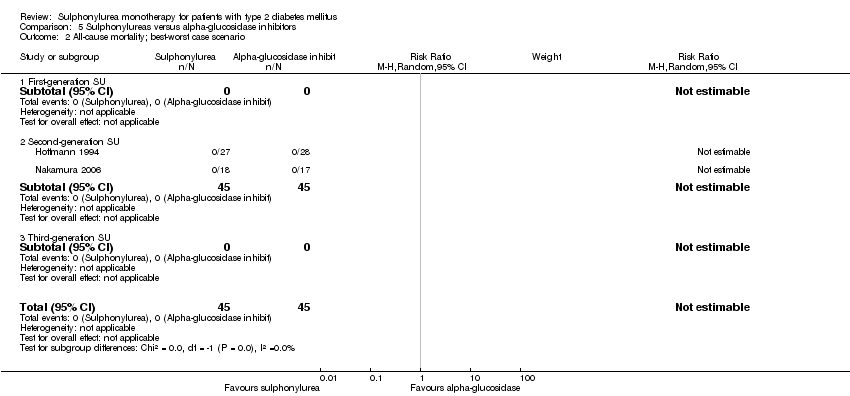
Comparison 5 Sulphonylureas versus alpha‐glucosidase inhibitors, Outcome 2 All‐cause mortality; best‐worst case scenario.

Comparison 5 Sulphonylureas versus alpha‐glucosidase inhibitors, Outcome 3 All‐cause mortality; worst‐best case scenario.

Comparison 5 Sulphonylureas versus alpha‐glucosidase inhibitors, Outcome 4 Cardiovascular mortality.

Comparison 5 Sulphonylureas versus alpha‐glucosidase inhibitors, Outcome 5 Non‐fatal macrovascular outcomes.

Comparison 5 Sulphonylureas versus alpha‐glucosidase inhibitors, Outcome 6 Non‐fatal myocardial infarction.
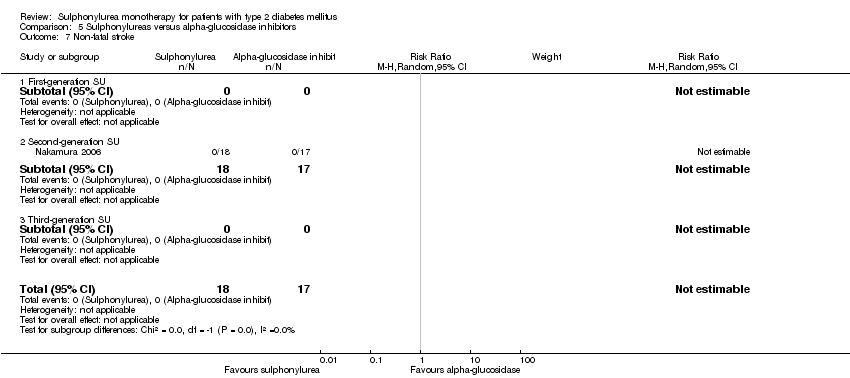
Comparison 5 Sulphonylureas versus alpha‐glucosidase inhibitors, Outcome 7 Non‐fatal stroke.

Comparison 5 Sulphonylureas versus alpha‐glucosidase inhibitors, Outcome 8 Amputation of lower extremity.

Comparison 5 Sulphonylureas versus alpha‐glucosidase inhibitors, Outcome 9 Cardial revascularisation.

Comparison 5 Sulphonylureas versus alpha‐glucosidase inhibitors, Outcome 10 Peripheral revascularisation.

Comparison 5 Sulphonylureas versus alpha‐glucosidase inhibitors, Outcome 11 Microvascular outcomes.

Comparison 5 Sulphonylureas versus alpha‐glucosidase inhibitors, Outcome 12 Nephropathy.

Comparison 5 Sulphonylureas versus alpha‐glucosidase inhibitors, Outcome 13 Retinopathy.

Comparison 5 Sulphonylureas versus alpha‐glucosidase inhibitors, Outcome 14 Retinal photocoagulation.

Comparison 5 Sulphonylureas versus alpha‐glucosidase inhibitors, Outcome 15 Change in fasting blood glucose from baseline (mmol/L).
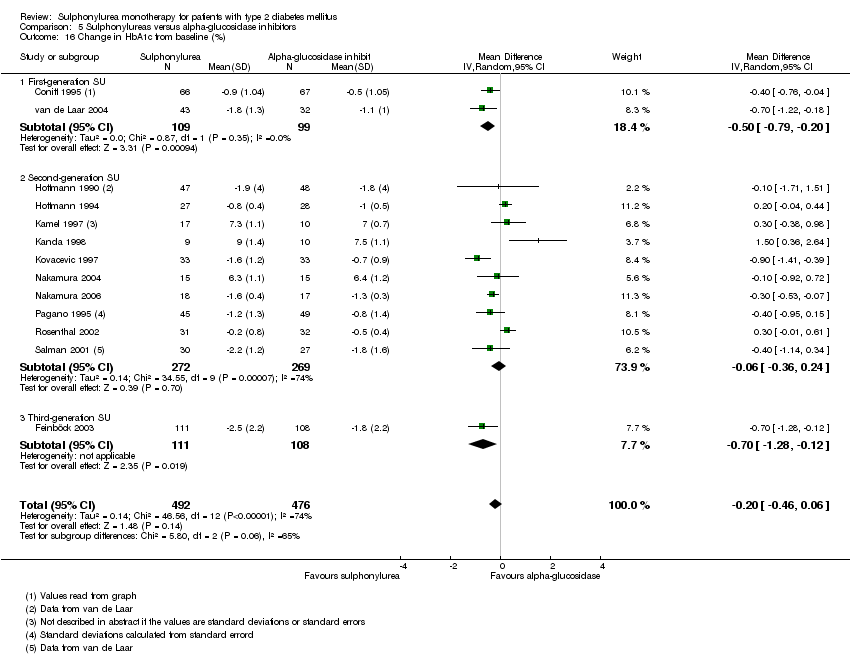
Comparison 5 Sulphonylureas versus alpha‐glucosidase inhibitors, Outcome 16 Change in HbA1c from baseline (%).

Comparison 5 Sulphonylureas versus alpha‐glucosidase inhibitors, Outcome 17 Change in BMI from baseline (kg/m2).

Comparison 5 Sulphonylureas versus alpha‐glucosidase inhibitors, Outcome 18 Change in weight from baseline (kg).
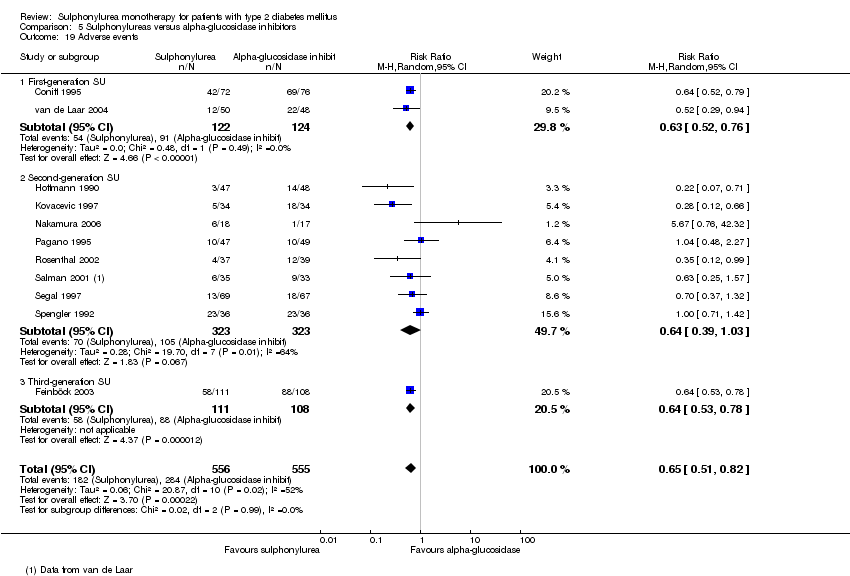
Comparison 5 Sulphonylureas versus alpha‐glucosidase inhibitors, Outcome 19 Adverse events.

Comparison 5 Sulphonylureas versus alpha‐glucosidase inhibitors, Outcome 20 Serious adverse events.

Comparison 5 Sulphonylureas versus alpha‐glucosidase inhibitors, Outcome 21 Drop‐outs due to adverse events.
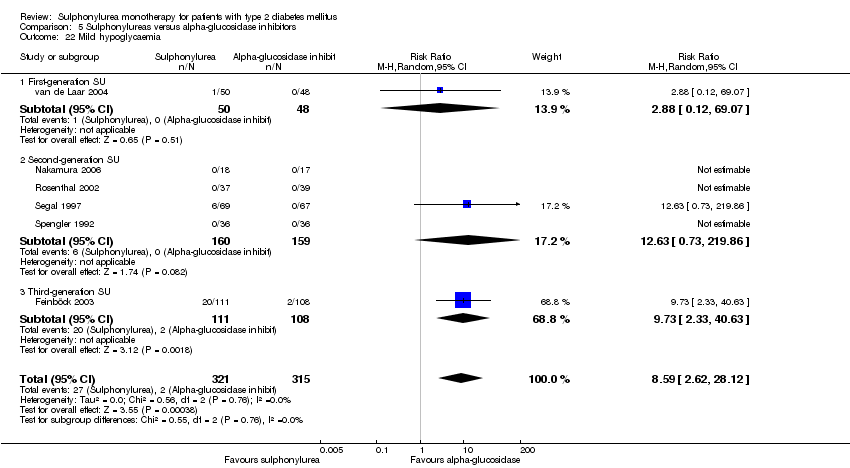
Comparison 5 Sulphonylureas versus alpha‐glucosidase inhibitors, Outcome 22 Mild hypoglycaemia.
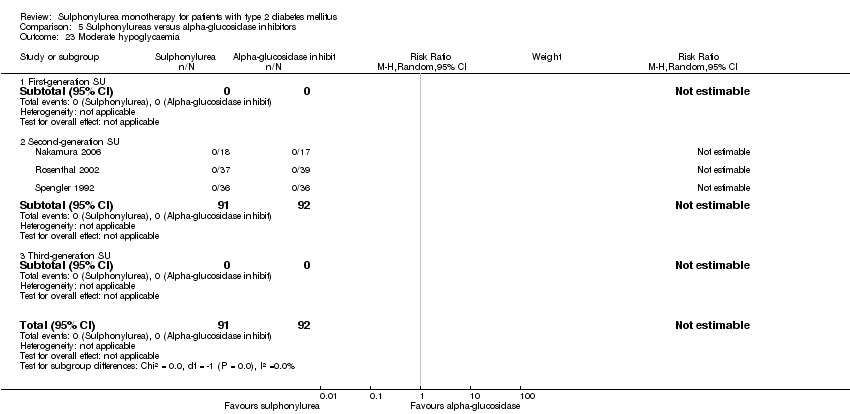
Comparison 5 Sulphonylureas versus alpha‐glucosidase inhibitors, Outcome 23 Moderate hypoglycaemia.

Comparison 5 Sulphonylureas versus alpha‐glucosidase inhibitors, Outcome 24 Severe hypoglycaemia.

Comparison 5 Sulphonylureas versus alpha‐glucosidase inhibitors, Outcome 25 Cancer.

Comparison 5 Sulphonylureas versus alpha‐glucosidase inhibitors, Outcome 26 Intervention failure.

Comparison 6 Sulphonylureas versus incretin‐based intervention, Outcome 1 All‐cause mortality.

Comparison 6 Sulphonylureas versus incretin‐based intervention, Outcome 2 All‐cause mortality; best‐worst case scenario.
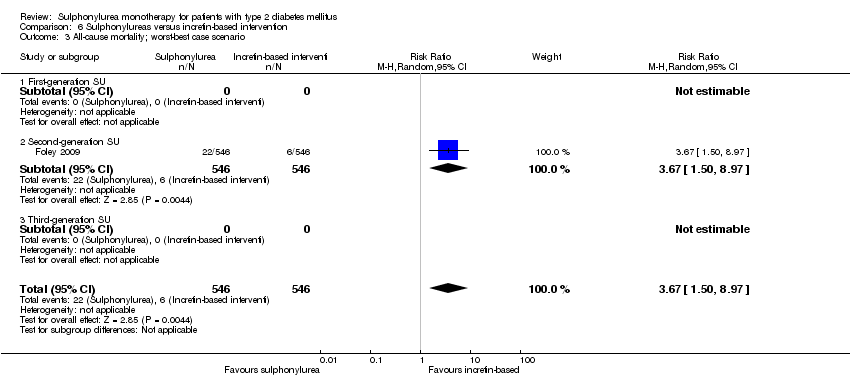
Comparison 6 Sulphonylureas versus incretin‐based intervention, Outcome 3 All‐cause mortality; worst‐best case scenario.

Comparison 6 Sulphonylureas versus incretin‐based intervention, Outcome 4 Cardiovascular mortality.
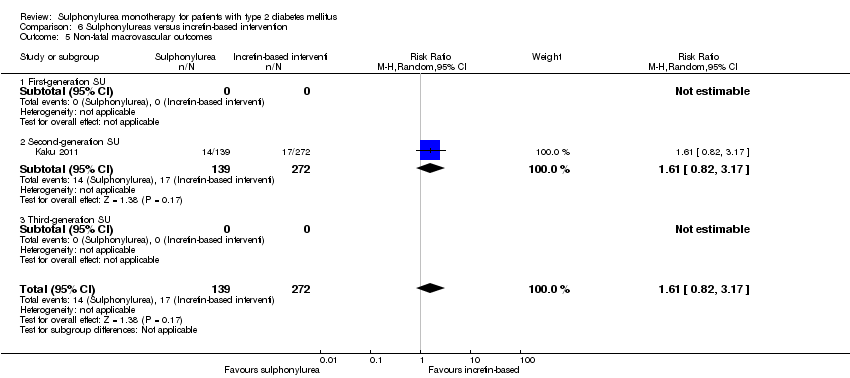
Comparison 6 Sulphonylureas versus incretin‐based intervention, Outcome 5 Non‐fatal macrovascular outcomes.
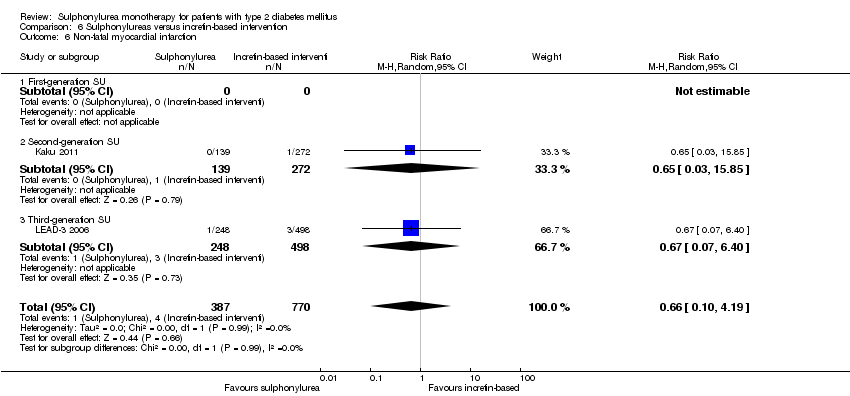
Comparison 6 Sulphonylureas versus incretin‐based intervention, Outcome 6 Non‐fatal myocardial infarction.
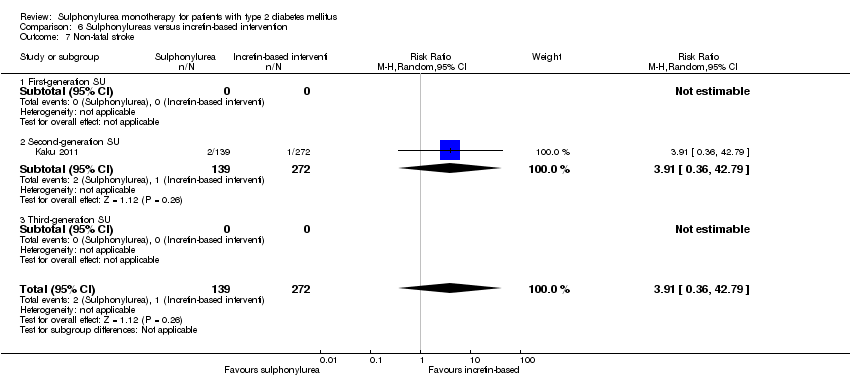
Comparison 6 Sulphonylureas versus incretin‐based intervention, Outcome 7 Non‐fatal stroke.

Comparison 6 Sulphonylureas versus incretin‐based intervention, Outcome 8 Amputation of lower extremity.

Comparison 6 Sulphonylureas versus incretin‐based intervention, Outcome 9 Cardial revascularisation.

Comparison 6 Sulphonylureas versus incretin‐based intervention, Outcome 10 Peripheral revascularisation.

Comparison 6 Sulphonylureas versus incretin‐based intervention, Outcome 11 Microvascular outcomes.

Comparison 6 Sulphonylureas versus incretin‐based intervention, Outcome 12 Nephropathy.

Comparison 6 Sulphonylureas versus incretin‐based intervention, Outcome 13 Retinopathy.
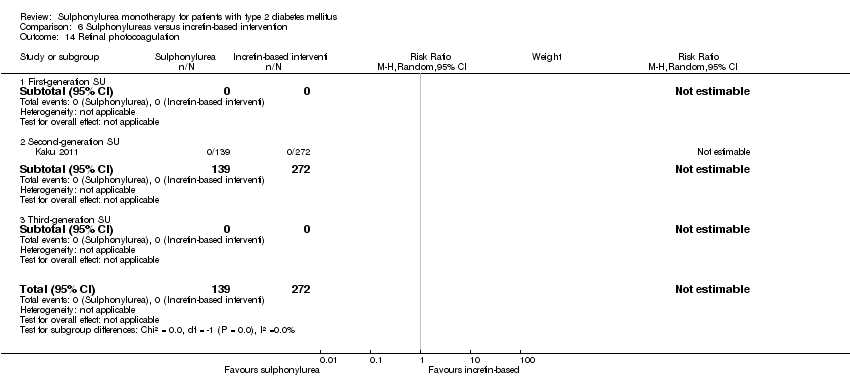
Comparison 6 Sulphonylureas versus incretin‐based intervention, Outcome 14 Retinal photocoagulation.
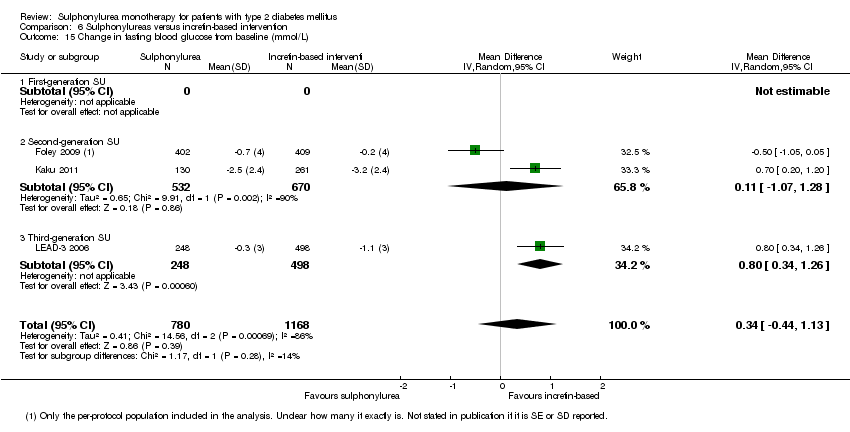
Comparison 6 Sulphonylureas versus incretin‐based intervention, Outcome 15 Change in fasting blood glucose from baseline (mmol/L).
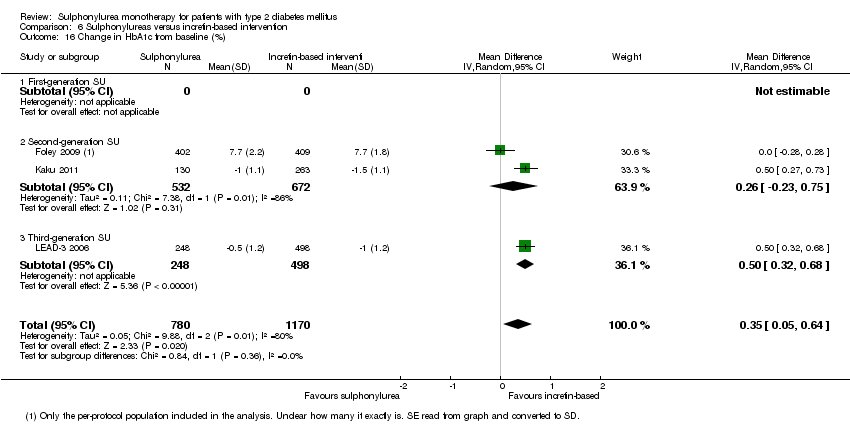
Comparison 6 Sulphonylureas versus incretin‐based intervention, Outcome 16 Change in HbA1c from baseline (%).

Comparison 6 Sulphonylureas versus incretin‐based intervention, Outcome 17 Change in BMI from baseline (kg/m2).

Comparison 6 Sulphonylureas versus incretin‐based intervention, Outcome 18 Change in weight from baseline (kg).

Comparison 6 Sulphonylureas versus incretin‐based intervention, Outcome 19 Adverse events.

Comparison 6 Sulphonylureas versus incretin‐based intervention, Outcome 20 Serious adverse events.

Comparison 6 Sulphonylureas versus incretin‐based intervention, Outcome 21 Drop‐outs due to adverse events.
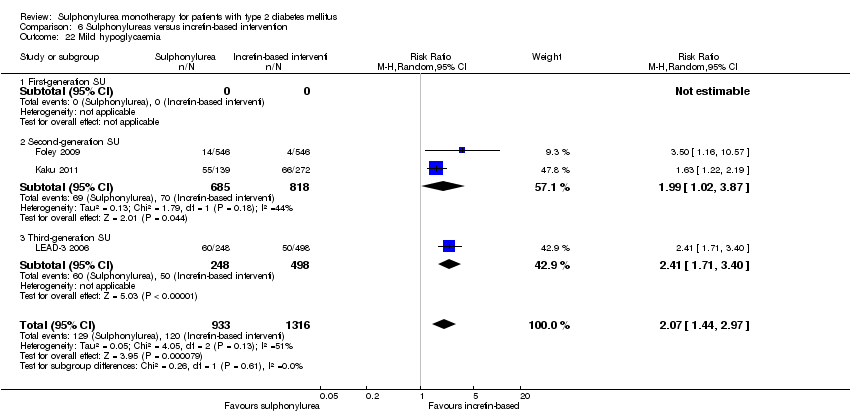
Comparison 6 Sulphonylureas versus incretin‐based intervention, Outcome 22 Mild hypoglycaemia.
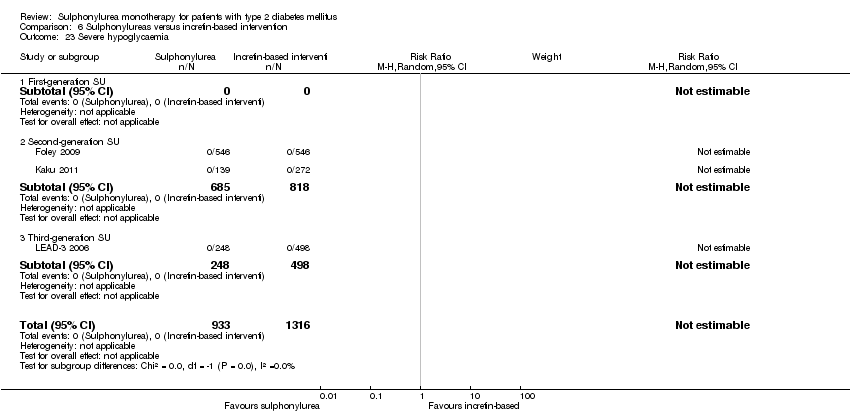
Comparison 6 Sulphonylureas versus incretin‐based intervention, Outcome 23 Severe hypoglycaemia.

Comparison 6 Sulphonylureas versus incretin‐based intervention, Outcome 24 Intervention failure.
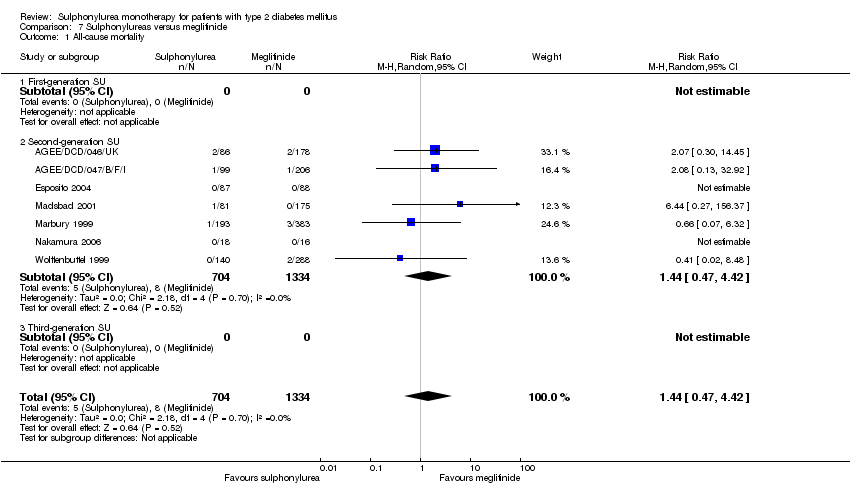
Comparison 7 Sulphonylureas versus meglitinide, Outcome 1 All‐cause mortality.

Comparison 7 Sulphonylureas versus meglitinide, Outcome 2 All‐cause mortality; best‐worst case scenario.
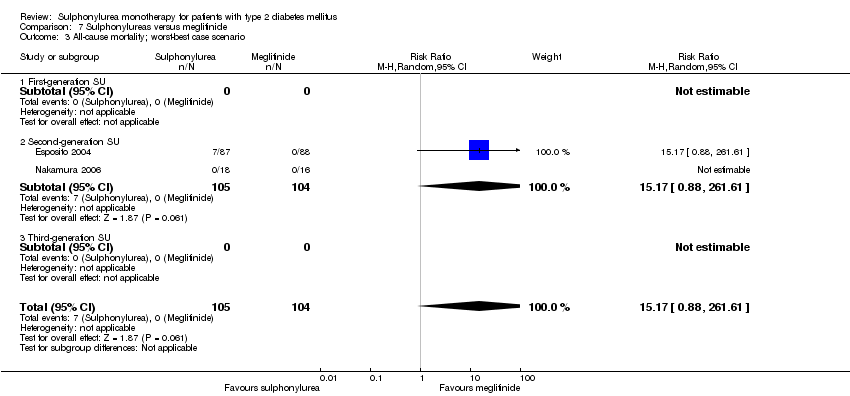
Comparison 7 Sulphonylureas versus meglitinide, Outcome 3 All‐cause mortality; worst‐best case scenario.

Comparison 7 Sulphonylureas versus meglitinide, Outcome 4 Cardiovascular mortality.

Comparison 7 Sulphonylureas versus meglitinide, Outcome 5 Non‐fatal macrovascular outcomes.

Comparison 7 Sulphonylureas versus meglitinide, Outcome 6 Non‐fatal myocardial infarction.

Comparison 7 Sulphonylureas versus meglitinide, Outcome 7 Non‐fatal stroke.

Comparison 7 Sulphonylureas versus meglitinide, Outcome 8 Amputation of lower extremity.

Comparison 7 Sulphonylureas versus meglitinide, Outcome 9 Cardial revascularisation.

Comparison 7 Sulphonylureas versus meglitinide, Outcome 10 Peripheral revascularisation.

Comparison 7 Sulphonylureas versus meglitinide, Outcome 11 Microvascular outcomes.
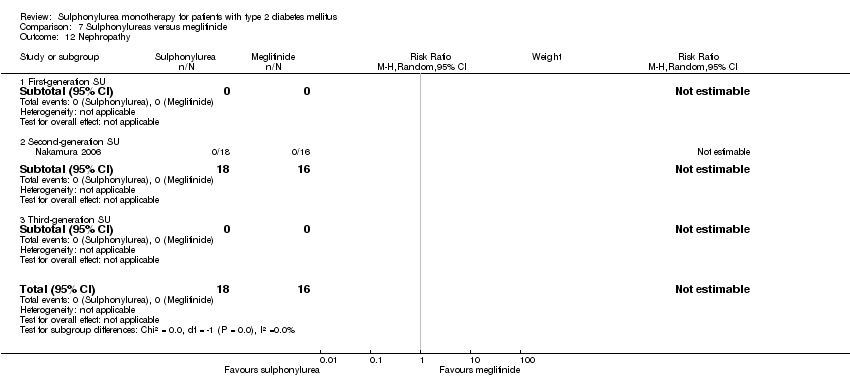
Comparison 7 Sulphonylureas versus meglitinide, Outcome 12 Nephropathy.

Comparison 7 Sulphonylureas versus meglitinide, Outcome 13 Retinopathy.

Comparison 7 Sulphonylureas versus meglitinide, Outcome 14 Retinal photocoagulation.

Comparison 7 Sulphonylureas versus meglitinide, Outcome 15 Change in fasting blood glucose from baseline (mmol/L).
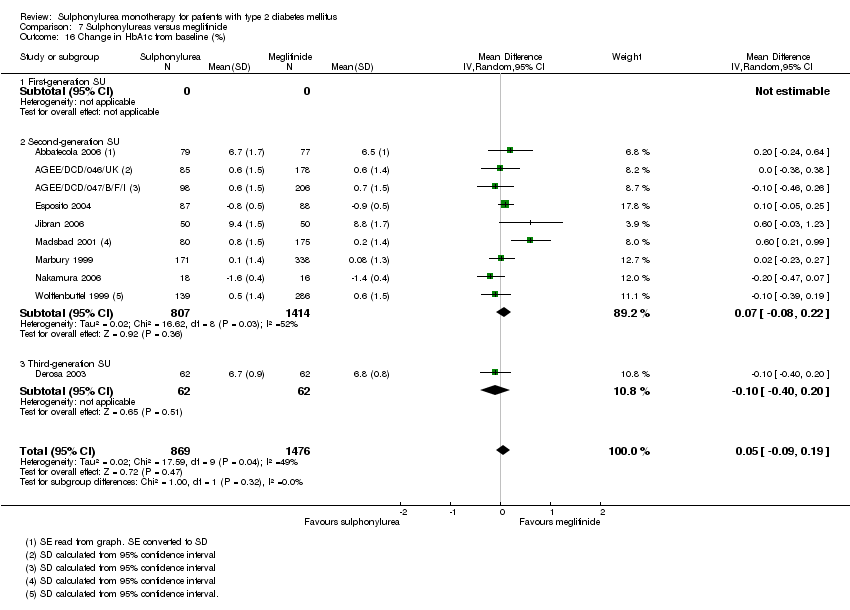
Comparison 7 Sulphonylureas versus meglitinide, Outcome 16 Change in HbA1c from baseline (%).

Comparison 7 Sulphonylureas versus meglitinide, Outcome 17 Change in BMI from baseline (kg/m2).

Comparison 7 Sulphonylureas versus meglitinide, Outcome 18 Change in weight from baseline (kg).
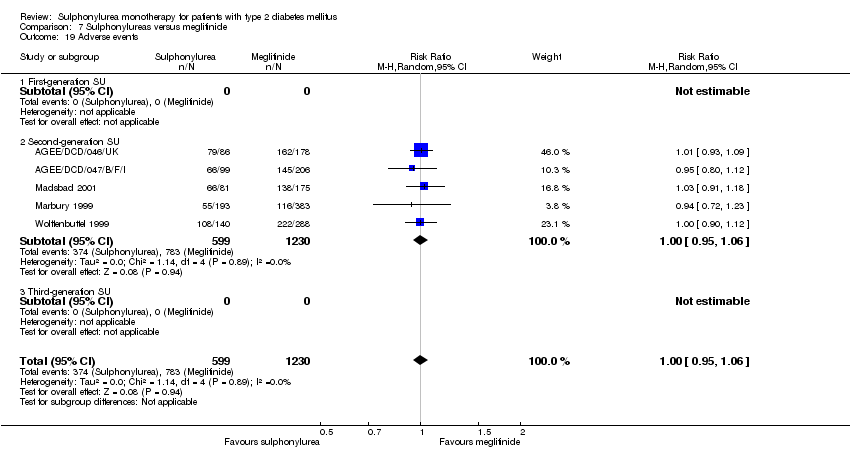
Comparison 7 Sulphonylureas versus meglitinide, Outcome 19 Adverse events.
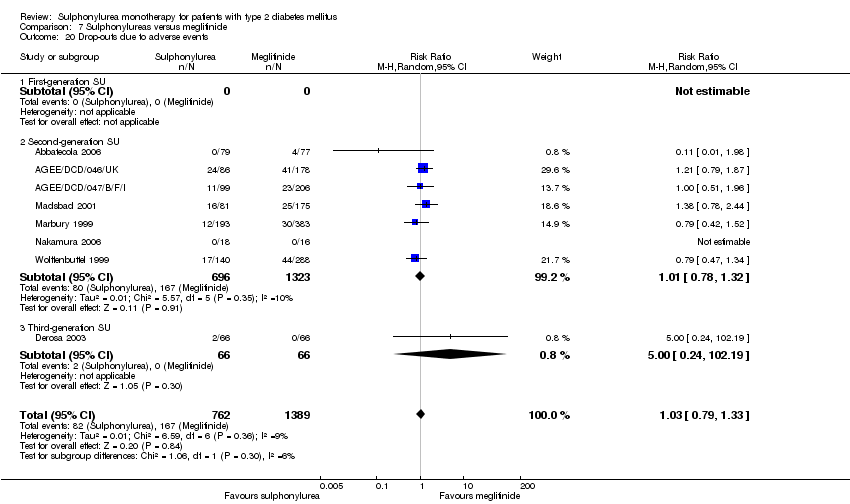
Comparison 7 Sulphonylureas versus meglitinide, Outcome 20 Drop‐outs due to adverse events.
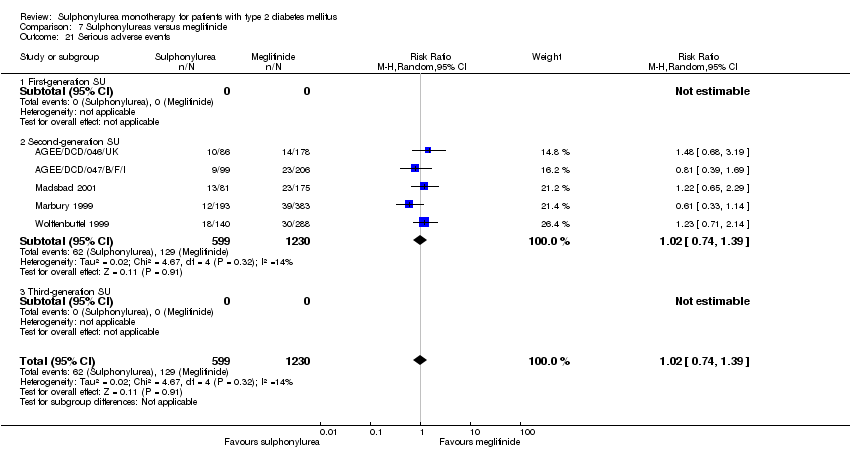
Comparison 7 Sulphonylureas versus meglitinide, Outcome 21 Serious adverse events.
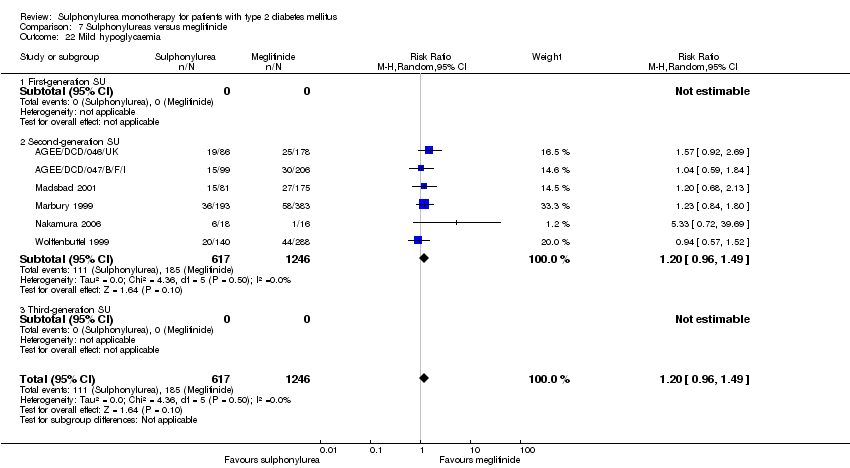
Comparison 7 Sulphonylureas versus meglitinide, Outcome 22 Mild hypoglycaemia.
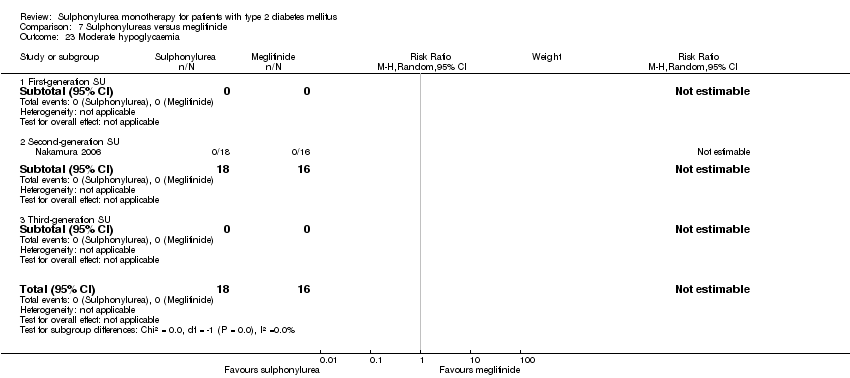
Comparison 7 Sulphonylureas versus meglitinide, Outcome 23 Moderate hypoglycaemia.
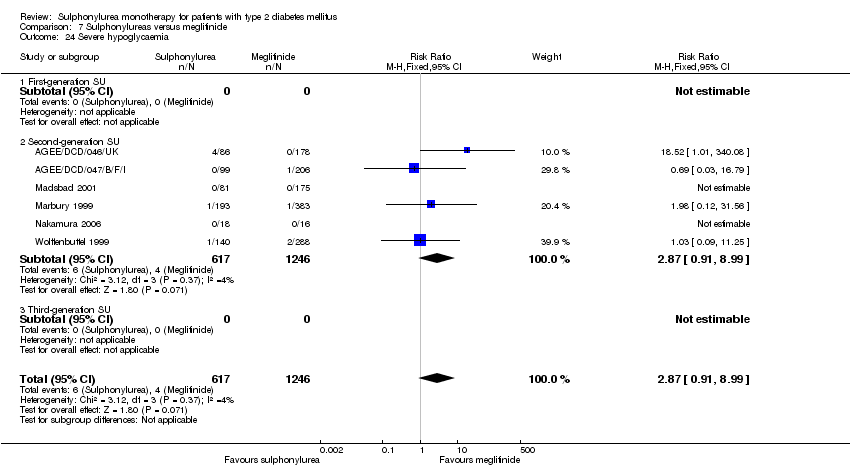
Comparison 7 Sulphonylureas versus meglitinide, Outcome 24 Severe hypoglycaemia.

Comparison 7 Sulphonylureas versus meglitinide, Outcome 25 Cancer.

Comparison 7 Sulphonylureas versus meglitinide, Outcome 26 Intervention failure.

Comparison 8 Second‐generation sulphonylureas versus first‐generation sulphonylureas, Outcome 1 All‐cause mortality.

Comparison 8 Second‐generation sulphonylureas versus first‐generation sulphonylureas, Outcome 2 Cardiovascular mortality.

Comparison 8 Second‐generation sulphonylureas versus first‐generation sulphonylureas, Outcome 3 Non‐fatal myocardial infarction.

Comparison 8 Second‐generation sulphonylureas versus first‐generation sulphonylureas, Outcome 4 Non‐fatal stroke.

Comparison 8 Second‐generation sulphonylureas versus first‐generation sulphonylureas, Outcome 5 Amputation of lower extremity.

Comparison 8 Second‐generation sulphonylureas versus first‐generation sulphonylureas, Outcome 6 Microvascular outcomes.

Comparison 8 Second‐generation sulphonylureas versus first‐generation sulphonylureas, Outcome 7 Retinal photocoagulation.

Comparison 8 Second‐generation sulphonylureas versus first‐generation sulphonylureas, Outcome 8 Change in fasting blood glucose from baseline (mmol/L).

Comparison 8 Second‐generation sulphonylureas versus first‐generation sulphonylureas, Outcome 9 Change in HbA1c from baseline (%).
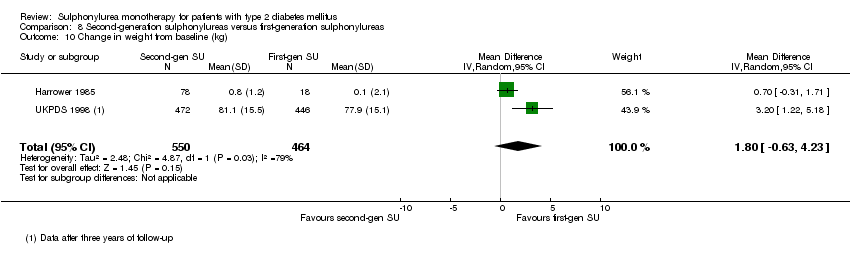
Comparison 8 Second‐generation sulphonylureas versus first‐generation sulphonylureas, Outcome 10 Change in weight from baseline (kg).
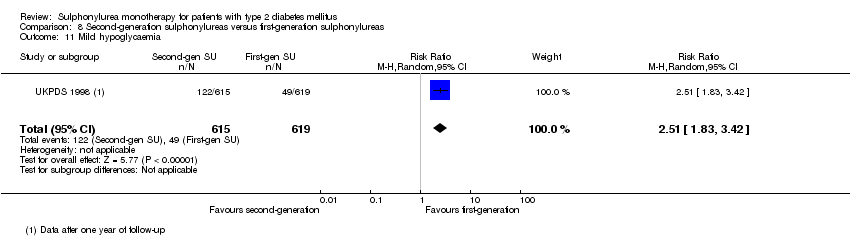
Comparison 8 Second‐generation sulphonylureas versus first‐generation sulphonylureas, Outcome 11 Mild hypoglycaemia.

Comparison 8 Second‐generation sulphonylureas versus first‐generation sulphonylureas, Outcome 12 Severe hypoglycaemia.

Comparison 8 Second‐generation sulphonylureas versus first‐generation sulphonylureas, Outcome 13 Cancer.
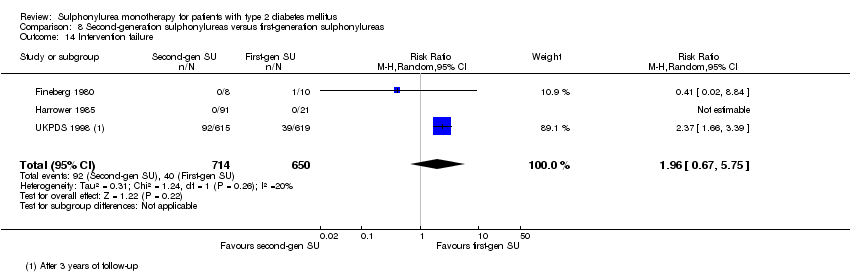
Comparison 8 Second‐generation sulphonylureas versus first‐generation sulphonylureas, Outcome 14 Intervention failure.
| First‐generation sulphonylureas compared with controls for type 2 diabetes mellitus | ||||
| Patient or population: participants with type 2 diabetes mellitus Settings: outpatients Intervention: first‐generation sulphonylureas (acetohexamide, carbutamide, chlorpropamide, tolbutamide, tolazamide) Comparison: placebo, active comparators | ||||
| Outcomes | Relative effect | No of participants | Quality of the evidence | Comments |
| All‐cause mortality a. Intervention vs placebo b. Intervention vs insulin | a.RR 1.46 (0.87 to 2.45) b. RR 1.18 (0.88 to 1.59) | a. 553 (2) b. 1944 (2) | ⊕⊕⊝⊝ | a. Small sample size (1.5% of the diversity‐adjusted required information size) b. Trial sequential analysis showed that 5.7% of the required information size to detect or reject a 10% RRR was accrued |
| Cardiovascular mortality a. Intervention vs placebo b. Intervention vs insulin | a.RR 2.63 (1.32 to 5.22) b. RR 1.36 (0.88 to 1.48) | a. 553 (2) b. 1944 (2) | ⊕⊕⊝⊝ | a. Small sample size (0.7% of the diversity‐adjusted required information size) b. Trial sequential analysis showed that 1.1% of the required information size to detect or reject a 10% RRR was accrued |
| Non‐fatal macrovascular outcomes 1. Composite 2. Non‐fatal myocardial infarction Intervention vs insulin | 1a. not estimable 2b. RR 1.08 (0.81 to 1.45) | 1a. See comment 2b.1944 (2) | 1a. See comment 2b. ⊕⊕⊝⊝ | 1a. No meta‐analysis possible |
| Microvascular outcomes | Not estimable | See comment | See comment | No meta‐analysis possible |
| Cancer Intervention vs insulin | RR 0.81 (0.29 to 2.27) | 1944 (2) | ⊕⊕⊝⊝ | One study reported any cancer and the other death due to cancer |
| Adverse events 1. All adverse events Intervention vs alpha‐glucosidase inhibitors | 1. RR 0.63 (0.52 to 0.76) 2. RR 0.28 (0.12 to 0.67) | 1. 246 (2) | ⊕⊕⊝⊝ | Trial sequential analysis showed that firm evidence was not established |
| Health‐related quality of life | Not estimable | See comment | See comment | Not investigated |
| GRADE Working Group grades of evidence | ||||
| aDue to imprecision and results of trial sequential analysis. RRR: relative risk reduction | ||||
| Second‐generation sulphonylureas compared with controls for type 2 diabetes mellitus | ||||
| Patient or population: participants with type 2 diabetes mellitus Settings: outpatients Intervention: second‐generation sulphonylureas (glibenclamide or glyburide, glibornuride, gliclazide, glipizide) Comparison: placebo, active comparators | ||||
| Outcomes | Relative effect | No of participants | Quality of the evidence | Comments |
| All‐cause mortality a. Intervention vs metformin b. Intervention vs thiazolidinediones c. Intervention vs insulin d. Intervention vs incretin‐based control e. Intervention vs meglitinide [e. 12 months to 17 months] | a. RR 0.98 (0.61 to 1.58) b. RR 0.92 (0.60 to 1.41) c. RR 0.96 (0.79 to 1.18) d. RR 1.39 (0.52 to 3.68) e. RR 1.44 (0.47 to 4.42) | a. 3528 (6) b. 4955 (7) c. 1642 (4) d. 1503 (2) e. 2038 (7) | ⊕⊕⊝⊝ | a. Trial sequential analysis showed that 2.3% of the required information size to detect or reject a 10% RRR was accrued. b. Results of the random‐effects model. Trial sequential analysis showed that 2.5% of the required information size to detect or reject a 10% RRR was accrued. c. Trial sequential analysis showed that 12.8% of the required information size to detect or reject a 10% RRR was accrued. d. Trial sequential analysis showed that 0.5% of the required information size to detect or reject a 10% RRR was accrued. e. Trial sequential analysis showed that only a minor fraction of the required information size to detect or reject a 10% RRR was accrued. |
| Cardiovascular mortality a. Intervention vs metformin b. Intervention vs thiazolidinediones c. Intervention vs insulin d. Intervention vs meglitinide [d. 12 months to 17 months] | a. RR 1.47 (0.54 to 4.01) b. RR 1.30 (0.55 to 3.07) c. RR 0.96 (0.73 to 1.28) d. RR 0.97 (0.27 to 3.53) | a. 3528 (6) b. 4955 (7) c. 1642 (4) d. 2038 (7) | ⊕⊕⊝⊝ | a. Trial sequential analysis showed that 2.7% of the required information size to detect or reject a 10% RRR was accrued. b. Trial sequential analysis showed that 0.3% of the required information size to detect or reject a 10% RRR was accrued. c. Trial sequential analysis showed that 6.6% of the required information size to detect or reject a 10% RRR was accrued. d. Trial sequential analysis showed that only a minor fraction of the required information size to detect or reject a 10% RRR was accrued. |
| Non‐fatal macrovascular outcomes a. Intervention vs metformin b. Intervention vs thiazolidinediones [1b. 52 weeks to 4 years] c. Intervention vs meglitinide [1c. 12 months to 15 months] a. Intervention vs metformin b. Intervention vs thiazolidinediones [2b. 24 weeks to 4 years] c. Intervention vs meglitinide [2c. 12 months to 17 months] | 1a. RR 0.67 (0.48 to 0.93) 1b. RR 0.91 (0.62 to 1.33) 1c. RR 0.50 (0.20 to 1.20) 2a.RR 1.02 (0.37 to 2.85) 2b. RR 0.68 (0.41 to 1.14) 2c. RR 1.03 (0.26 to 4.08) | 1a. 3018 (3) 1b. 4600 (6) 1c. 866 (3) 2a. 3061 (4) 2b. 4956 (7) 2c. 726 (3) | ⊕⊕⊝⊝ | 1a. Non‐fatal macrovascular outcomes as a composite outcome were not reported in the way we predefined to assess this outcome. Trial sequential analysis showed that 5% of the required information size to detect or reject a 10% RRR was accrued. 1c. The definition of non‐fatal macrovascular outcomes was heterogenous. |
| Microvascular outcomes | Not estimable | See comment | See comment | No meta‐analysis possible |
| Adverse events 1. All adverse events a. Intervention vs placebo b. Intervention vs metformin [3b. 24 weeks to 10.4 years] c. Intervention vs thiazolidinediones [3c. 6 months to 4 years] d. Intervention vs alpha‐glucosidase inhibitors [1d. 24 weeks to 12 months] e. Intervention vs incretin‐based control f. Intervention vs meglitinides [3f. 14 months to 17 months] | 1a. RR 0.91 (0.51 to 1.62) 1b. RR 0.99 (0.97 to 1.01) 1c. RR 0.99 (0.97 to 1.01) 1d. RR 0.64 (0.39 to 1.03) 1f. RR 1.0 (0.95 to 1.06) 2a. RR 0.62 (0.24 to 1.57) 2b.RR 1.19 (0.99 to 1.42) 2c. RR 1.15 (0.98 to 1.36) 2d. RR 0.48 (0.24 to 0.96) 2e. RR 1.00 (0.67 to 1.50) 2f. RR 1.01 (0.78 to 1.32) 3b. RR 5.64 (1.22 to 26.00) 3c. RR 6.11 (1.57 to 23.79) 3f. RR 2.17 (0.53 to 8.91) | 1a. 202 (2) 1b. 3042 (2) 1c. 6491 (10) 1d. 646 (8) 1f. 1829 (5) 2a. 510 (5) 2b. 3567 (7) 2c. 7433 (15) 2d. 970 (9) 2e. 1503 (2) 2f. 2019 (7) 3b. 3637 (4) 3c. 5669 (6) 3f. 1863 (6) | ⊕⊕⊝⊝ | 1d. Results of the random‐effects model. Fixed‐effect model: RR 0.67 (0.52 to 0.86) 2c. Results of the random‐effects model. Fixed‐effect model: RR 1.17 (1.01 to 1.35) 2d. Trial sequential analysis showed that only a minor fraction of the required information size to confirm or reject a 10% RRR was accrued 3b. Trial sequential analysis showed that only 0.1% of the required information size was accrued 3c. Trial sequential analysis showed that a minor fraction of the required information size was accrued |
| Cancer a. Intervention vs thiazolidinediones b. Intervention vs insulin | a. RR 1.02 (0.72 to 1.45) b. RR 0.95 (0.61 to 1.49) | a. 4192 (6) b. 1575 (2) | ⊕⊕⊝⊝ | |
| Health‐related quality of life a. Intervention vs thiazolidinediones b. Intervention vs insulin c. Intervention vs alpha‐glucosidase inhibitors | Not estimable | a. 35 (1) b. 49 (1) c. 35 (1) | ⊕⊝⊝⊝ | a. Inadequately reported, no scale provided b. Authors used short‐form 36 (SF 36), but did not find any significant differences between the interventions c. Inadequately reported, no scale provided |
| GRADE Working Group grades of evidence | ||||
| aDue to imprecision and results of trial sequential analysis. bDue to small sample size and risk of bias. RRR: relative risk reduction | ||||
| Third‐generation sulphonylureas compared with controls for type 2 diabetes mellitus | ||||
| Patient or population: participants with type 2 diabetes mellitus Settings: outpatients Intervention: third‐generation sulphonylureas (gliclazide modified release (MR), glimepiride, glipizide gastrointestinal therapeutic system (GITS)) Comparison: active comparators | ||||
| Outcomes | Relative effect | No of Participants | Quality of the evidence | Comments |
| All‐cause mortality | Not estimable | See comment | See comment | No meta‐analysis possible |
| Cardiovascular mortality | Not estimable | See comment | See comment | No meta‐analysis possible |
| Macrovascular outcomes | Not estimable | See comment | See comment | No meta‐analysis possible |
| Microvascular outcomes | Not estimable | See comment | See comment | No meta‐analysis possible |
| Adverse events 1. All adverse events Interventions vs thiazolidinediones [1. 6 months to 12 months] [2. 24 weeks to 52 weeks] | 1. RR 0.88 (0.78 to 0.99) 2. RR 0.54 (0.15 to 1.97) | 1. 510 (3) 2. 423 (2) | ⊕⊕⊝⊝ | 1. Trial sequential analysis showed that firm evidence was not established |
| Cancer | Not estimable | See comment | See comment | No meta‐analysis possible |
| Health‐related quality of life | Not estimable | See comment | See comment | No meta‐analysis possible |
| GRADE Working Group grades of evidence | ||||
| aDue to imprecision/small sample size and results of trial sequential analysis. RRR: relative risk reduction | ||||
| Characteristic Study ID | Intervention(s) and control(s) | [N] screened | [N] randomised | [N] safety | [N] lost to follow‐up (mortality) | [N] finishing study | [%] of randomised participants finishing study |
| Abbatecola 2006 | I1: glibenclamide C1: repaglinide | ‐ | I1: 79 C1: 77 T: 156 | I1: 73 C1: 74 T: 147 | ‐ | I1: 63 C1: 65 T: 128 | I1: 80 C1: 84 T: 82 |
| ADOPT 2006 | I1: glibenclamide C1: rosiglitazone C2: metformin | 6676 | I1: 1447 C1: 1458 C2: 1455 T: 4360 | I1: 1441 C1: 1456 C2: 1455 T: 4351 | ‐ | I1: 807 C1: 917 C2: 903 T: 2627 | I1: 56 C1: 63 C2: 62 T: 60 |
| AGEE/DCD/046/UK | I1:glibenclamide C1: repaglinide | 313 | I1: 86 C1: 178 T: 264 | I1: 85 C1: 178 T: 264 | ‐ | I1: 57 C1: 111 T: 168 | I1:66 C1: 62 T: 64 |
| AGEE/DCD/047/B/F/I | I1: gliclazide C1: repaglinide | 337 | I1: 99 C1: 206 T: 305 | I1: 99 C1: 206 T: 305 | ‐ | I1: 68 C1: 138 T: 206 | I1: 69 C1: 67 T: 68 |
| Alvarsson 2010 | I1: glibenclamide C1: insulin | 56 | I1: 26 C1: 23 T: 49 | ‐ | I1: 7 C1: 5 T: 12 | I1: 18 C1: 16 T: 34 | I1: 69 C1: 70 T: 70 |
| APPROACH 2010 a | I1: glipizide C1: rosiglitazone | 1147 | I1: 339 C1: 333 T: 672 | I1: 337 C1: 331 T: 668 | I1: 22 C1: 17 T: 39 | I1: 264 C1: 259 T: 523 | I1: 78 C1: 78 T: 78 |
| Birkeland 1994 | I1: glibenclamide I2: glipizide C1: placebo | ‐ | I1: 15 I2: 15 C1: 16 T: 46 | ‐ | I1: 0 I2: 0 C1: 0 T: 0 | I1: 15 I2: 13 C1: 12 T: 40 | I1: 100 I2: 87 C1: 75 T: 87 |
| Birkeland 2002 | I1: glibenclamide C1: insulin | 54 | I1: 18 C1: 18 T: 36 | ‐ | ‐ | ‐ | N/A |
| Campbell 1994 | I1: glipizide C1: metformin | 50 (?) | I1: 24 C1: 24 T: 48 | I1: 24 C1: 24 T: 48 | I1: 0 C1: 0 T: 0 | I1: 24 C1: 24 T: 48 | I1: 100 C1: 100 T: 100 |
| Charbonnel 2005 b | I1: gliclazide C1: pioglitazone | 2412 | I1: 626 C1: 624 T: 1270 | ‐ | I1: 4 C1: 4 T: 8 | I1: 525 C1: 530 T: 1055 | I1: ‐ C1: ‐ T: 83 |
| Collier 1989 | I1: gliclazide C1: metformin | ‐ | I1: 12 C1: 12 T: 24 | I1: 12 C1: 12 T: 24 | ‐ | I1: 12 C1: 12 T: 24 | I1: 100 C1: 100 T: 100 |
| Coniff 1995 | I1: tolbutamide C1: acarbose C2: placebo | ‐ | I1: 72 C1: 76 C2: 72 T: 220 | I1: 71 C1: 74 C2: 72 T: 217 | ‐ | ‐ | N/A |
| Dalzell 1986 | I1: tolbutamide C1: metformin | ‐ | I1: 15 C1: 18 T: 33 | ‐ | ‐ | ‐ | N/A |
| DeFronzo 2005 | I1: glibenclamide C1: metformin | 788 | I1: 209 C1: 210 T: 419 | ‐ | ‐ | I1: 174 C1: 157 T: 331 | I1: 83 C1: 75 T: 79 |
| Deng 2003 | I1: glibenclamide C1: Xiaoyaosan | 160 | I1: 80 C1: 80 T: 160 | ‐ | ‐ | ‐ | N/A |
| Derosa 2003 | I1: glimepiride C1: repaglinide | ‐ | I1: 66 C1: 66 T: 132 | I1: 66 C1: 66 T: 132 | I1: 4 C1: 4 T: 8 | I1: 62 C1: 62 T: 124 | I1: 94 C1: 94 T: 94 |
| Derosa 2004 | I1: glimepiride C1: metformin | ‐ | I1: 81 C1: 83 T: 164 | I1: 81 C1: 83 T: 164 | ‐ | I1: 73 C1: 75 T: 148 | I1:90 C1: 90 T: 90 |
| Diehl 1985 | I1: chlorpropamide C1: insulin | 137 | I1: 40 C1: 37 T: 77 | ‐ | ‐ | I1: 30 C1: 28 T: 58 | I1: 75 C1: 77 T: 75 |
| Ebeling 2001 | I1: glibenclamide C1: pioglitazone C2: placebo | ‐ | I1: 10 C1: 9 C2: 10 T: 29 | ‐ | ‐ | ‐ | N/A |
| Esposito 2004 | I1: glibenclamide C1: repaglinide | 210 | I1: 87 C1: 88 T: 175 | I1: 87 C1: 88 T: 175 | I1: 7 C1: 7 T: 14 | I1: 80 C1: 81 T: 161 | I1: 92 C1: 92 T: 92 |
| Feinböck 2003 | I1: glibenclamide C1: acarbose | ‐ | I1: 111 C1: 108 T: 219 | I1: 93 C1: 59 T: 152 | ‐ | I1: 93 C1: 59 T: 152 | I1: 84 C1: 55 T: 69 |
| Fineberg 1980 c | I1: glipizide C1: tolbutamide | ‐ | I1: ‐ C1: ‐ T: 29 | ‐ | ‐ | I1: 8 C1: 10 T: 18 | I1: ‐ C1: ‐ T: 62 |
| Foley 2009 | I1: gliclazide C1: vildagliptin | ‐ | I1: 546 C1: 546 T: 1092 | I1: 402 C1: 409 T: 811 | I1: 13 C1: 17 T: 30 | I1: 402 C1: 409 T: 811 | I1:74 C1: 75 T: 74 |
| Forst 2003 | I1: glibenclamide C1: insulin | 200 | I1: 68 C1: 75 T: 143 | I1: 68 C1: 75 T: 143 | I1: 0 C1: 0 T: 0 | I1: 68 C1: 75 T: 143 | I1: 100 C1: 100 T: 100 |
| Forst 2005 | I1: glimepiride C1: pioglitazone | 192 | I1: 87 C1: 92 T: 179 | I1: 84 C1: 89 T: 173 | I1: 3 C1: 3 T: 6 | I1: 84 C1: 89 T: 173 | I1:97 C1: 97 T: 97 |
| Hanefeld 2005 | I1: glibenclamide C1: rosiglitazone 2 mg C2: rosiglitazone 4 mg | ‐ | I1: 207 C1: 200 C2: 191 T: 598 | ‐ | I1: 0 C1: 0 C2: 0 T: 0 | I1: 173 C1: 153 C2: 158 T: 484 | I1: 84 C1: 77 C2: 83 T: 81 |
| Harrower 1985 | I1: glipizide I2: gliquidone I3: gliclazide I4: glibenclamide C1: chlorpropamide | ‐ | I1: 24 I2: 22 I3: 22 I4: 23 T: 112 | ‐ | I1: 4 I2: 3 I3: 2 I4: 4 T: 16 | I1: 20 I2: 19 I3: 20 I4: 19 T: 96 | I1: 83 I2: 86 I3: 91 I4: 83 T: 86 |
| Hermann 1991 d | I1: glibenclamide C1: metformin | ‐ | I1: ‐ C1: ‐ T: 25 | I1: 10 C1: 12 T: 22 | ‐ | I1: 10 C1: 12 T: 22 | N/A |
| Hermann 1991a | I1: glibenclamide C1: metformin | ‐ | I1: 34 C1: 38 T: 72 | ‐ | I1: 0 C1: 0 T: 0 | I1: 28 C1: 28 T: 56 | I1: 82 C1: 74 T: 78 |
| Hoffmann 1990 | I1: glibenclamide C1: acarbose | ‐ | I1: 47 C1: 48 T: 95 | ‐ | ‐ | ‐ | N/A |
| Hoffmann 1994 | I1: glibenclamide C1: placebo C2: acarbose | 96 | I1: 27 C1: 30 C2: 28 T: 85 | ‐ | I1: 0 C1: 0 T: 0 | I1: 27 C1: 30 C2: 28 T: 85 | I1: 100 C1: 100 C2: 100 |
| Hollander 1992 | I1: glibenclamide C1: insulin | ‐ | I1: 29 C1: 30 T: 59 | ‐ | ‐ | ‐ | N/A |
| Jain 2006 | I1: glibenclamide C1: pioglitazone | ‐ | I1: 251 C1: 251 T: 502 | ‐ | I1: 21 C1: 22 T: 43 | I1: 128 C1: 134 T: 262 | I1: 50 C1: 53 T: 52 |
| Jibran 2006 | I1: glibenclamide C1: repaglinide | ‐ | I1: 50 C1: 50 T: 100 | ‐ | ‐ | ‐ | N/A |
| Johnston 1997 | I1: glibenclamide C1: placebo C2: miglitol 25 mg C3: miglitol 50 mg | ‐ | I1: 104 C1: 101 C2: 104 C3: 102 T: 411 | ‐ | ‐ | ‐ | N/A |
| Kaku 2011 | I1: glibenclamide C1: liraglutide | 464 | I1: 139 C1: 272 T: 411 | I1: 132 C1: 268 T: 400 | ‐ | I1: 110 C1: 225 T: 335 | I1: 79 C1: 83 T: 82 |
| Kamel 1997 | I1: gliclazide I2: glibenclamide C1: acarbose C2: metformin C3: placebo | ‐ | I1: 9 I2: 8 C1: 10 C2: 6 C3: 10 T: 43 | ‐ | ‐ | ‐ | N/A |
| Kanda 1998 | I1: gliclazide C1: acarbose | 25 | I1: 9 C1: 10 T: 19 | ‐ | ‐ | I1: 9 C1: 10 T: 19 | I1: 100 C1: 100 T: 100 |
| Kovacevic 1997 | I1: glibenclamide C1: acarbose C2: placebo | ‐ | I1: 34 C1: 34 C2: 34 T: 102 | I1: 33 C1: 33 C2: 31 T: 97 | ‐ | I1: 33 C1: 33 C2: 31 T: 97 | I1: 97 C1: 97 C2: 91 T: 95 |
| Lawrence 2004 | I1: gliclazide C1: metformin C2: pioglitazone | 67 | I1: 22 C1: 21 C2: 21 T: 64 | ‐ | I1: 0 C1: 0 C2: 0 T: 0 | I1: 20 C1: 20 C2: 20 T: 60 | I1: 91 C1: 95 C2: 95 T: 94 |
| LEAD‐3 2006 e | I1: glimepiride C1: liraglutide 1.2 mg C2: liraglutide 1.8 mg | ‐ | I1: 248 C1: 251 C2: 247 T: 746 | I1: 248 C1: 251 C2: 246 T: 745 | ‐ | I1: 152 C1: 162 C2: 173 T: 487 | I1: 61 C1: 65 C2: 70 T: 65 |
| Madsbad 2001 | I1: glipizide C1: repaglinide | 320 | I1: 81 C1: 175 T: 256 | I1: 81 C1: 175 T: 256 | ‐ | I1: 58 C1: 140 T: 198 | I1: 72 C1: 80 T: 77 |
| Marbury 1999 | I1: glibenclamide C1: repaglinide | ‐ | I1: 193 C1: 383 T: 576 | I1: 193 C1: 383 T: 576 | ‐ | I1: 115 C1: 216 T: 331 | I1: 60 C1: 56 T: 57 |
| Memisogullari 2009 | I1: gliclazide C1: nothing | ‐ | I1: 26 C1: 30 T: 56 | ‐ | I1:0 C1: 0 T: 0 | ‐ | N/A |
| Nakamura 2004 | I1: glibenclamide C1: pioglitazone C2: voglibose | ‐ | I1: 15 C1: 15 C2: 15 T: 45 | I1: 15 C1: 15 C2: 15 T: 45 | I1: 0 C1: 0 C2: 0 T: 0 | I1: 15 C1: 15 C2: 15 T: 45 | I1: 100 C1: 100 C2: 100 T: 100 |
| Nakamura 2006 | I1: glibenclamide C1: pioglitazone C2: voglibose C3: nateglinide | 78 | I1: 18 C1: 17 C2: 17 C3: 16 T: 68 | I1: 18 C1: 17 C2: 17 C3: 16 T: 68 | I1: 0 C1: 0 C2: 0 C3: 0 T: 0 | I1: 18 C1: 17 C2: 17 C3: 16 T: 68 | I1: 100 C1: 100 C2: 100 C3: 100 T: 100 |
| Nathan 1988 | I1: glibenclamide C1: insulin | ‐ | I1: 16 C1: 15 T: 31 | I1: 16 C1: 15 T: 31 | I1: 0 C1: 0 T: 0 | I1: 16 C1: 15 T: 31 | I1: 100 C1: 100 T: 100 |
| Pagano 1995 f | I1: glibenclamide C1: miglitol | ‐ | I1: 47 C1: 50 T: 100 | I1: ‐ C1: ‐ T: 99 | I1: ‐ C1: ‐ T: 3 | I1: 47 C1: 49 T: 96 | I1: ‐ C1: ‐ T: 96 |
| Perriello 2007 | I1: gliclazide C1: pioglitazone | ‐ | I1: 137 C1: 146 T: 283 | ‐ | ‐ | I1: 135 C1: 140 T: 275 | I1: 99 C1: 96 T: 97 |
| Rosenthal 2002 | I1: glibenclamide C1: acarbose | ‐ | I1: 37 C1: 39 T: 76 | I1: 31 C1: 32 T: 63 | ‐ | I1: 31 C1: 32 T: 63 | I1: 84 C1: 82 T: 83 |
| Salman 2001 | I1: gliclazide C1: acarbose | ‐ | I1: 35 C1: 33 T: 68 | I1: 30 C1: 27 T: 57 | ‐ | I1: 30 C1: 27 T: 57 | I1: 86 C1: 82 T: 84 |
| Segal 1997 | I1: glibenclamide C1: miglitol C2: placebo | ‐ | I1: 69 C1: 67 C2: 65 T: 201 | I1: 69 C1: 67 C2: 65 T: 201 | I1: 11 C1: 12 C2: 6 T: 29 | I1: 50 C1: 49 C2: 58 T: 157 | I1: 72 C1: 73 C2: 89 T: 78 |
| Shihara 2011 | I1: glimepiride C1: pioglitazone | 238 | I1: 95 C1: 96 T: 191 | I1: 86 C1: 91 T: 177 | ‐ | I1: 86 C1: 91 T: 177 | I1: 91 C1: 95 T: 93 |
| Spengler 1992 g | I1: glibenclamide C1: acarbose | ‐ | I1: 36 C1: 36 T: 72 | ‐ | ‐ | I1: 29 C1: 26 T: 55 | I1: 81 C1: 72 T: 76 |
| Sung 1999 | I1: glibenclamide C1: troglitazone | ‐ | I1: 12 C1: 10 T: 22 | ‐ | ‐ | ‐ | N/A |
| Sutton 2002 h | I1: glibenclamide C1: rosiglitazone | 351 | I1: 99 C1: 104 T: 203 | I1: 99 C1: 104 T: 203 | I1: 3 C1: 2 T: 5 | I1: 65 C1: 64 T: 129 | I1: 66 C1: 62 T: 64 |
| Tan 2004 | I1: glimepiride C1: pioglitazone | 584 | I1: 123 C1: 121 T: 244 | I1: 92 C1: 100 T: 192 | I1: 11 C1: 6 T: 17 | I1: 89 C1: 87 T: 176 | I1: 72 C1: 72 T: 72 |
| Tan 2004a | I1: glimepiride C1: pioglitazone | ‐ | I1: 109 C1: 91 T: 200 | I1: 109 C1: 91 T: 200 | ‐ | I1: 68 C1: 55 T: 123 | I1: 62 C1: 60 T: 62 |
| Tan 2005 i | I1: gliclazide C1: pioglitazone | 2412 | I1: 297 C1: 270 T: 567 | ‐ | I1: 4 C1: 2 T: 6 | I1: 127 C1: 147 T: 274 | I1: 43 C1: 54 T: 48 |
| Tang 2004 | I1: glimepiride C1: metformin | ‐ | I1: 33 C1: 29 T: 62 | ‐ | ‐ | ‐ | N/A |
| Teramoto 2007 | I1: glibenclamide C1: pioglitazone | 126 | I1: 46 C1: 46 | I1: 41 C1: 39 T: 80 | ‐ | I1: 41 C1: 39 T: 80 | I1: 89 C1: 85 T: 86 |
| Tessier 1999 | I1: gliclazide C1: metformin | ‐ | I1: 19 C1: 20 T: 39 | ‐ | I1: 1 C1: 2 T: 3 | I1: 18 | I1: 94.7 |
| Tosi 2003 | I1: glibenclamide C1: metformin | ‐ | I1: 22 C1: 22 T: 44 | ‐ | ‐ | I1: 20 C1: 19 T: 39 | I1: 91 C1: 86 T: 89 |
| UGDP 1970 | I1: tolbutamide C1: placebo C1: insulin | ‐ | I1: 204 C1: 205 C2: 210 T: 619 | I1: 75% on tolbutamide C1: 75% on placebo C2: ‐ T: ‐ | ‐ | ‐ | N/A |
| UKPDS 1998 j | Study 1: I1: chlorpropamide I2: glibenclamide I3: glipizide C1: insulin | 7616 | I1: 788 I2: 615 I3: 170 C1: 1156 T: 2729 | ‐ | ‐ | ‐ | N/A |
| UKPDS 34 1998 | I1: chlorpropamide I2: glibenclamide C1: metformin C2: insulin | 4209 | I1: 265 I2: 277 C1: 342 C2: 409 T: 1293 | ‐ | I1: ‐ I2: ‐ C1: ‐ C2: ‐ T: 13 | ‐ | N/A |
| van de Laar 2004 | I1: tolbutamide C1: acarbose | 144 | I1: 50 C1: 48 T: 98 | I1: 48 C1: 48 T: 96 | I1: 5 C1: 16 T: 21 | I1: 43 C1: 32 T: 75 | I1: 86 C1: 67 T: 77 |
| Watanabe 2005 | I1: glibenclamide C1: pioglitazone | ‐ | I1: 15 C1: 15 | I1: 14 C1: 13 | I1: 1 C1: 2 | I1: 14 C1: 13 | I1: 93 C1: 87 |
| Wolffenbuttel 1989 | I1: tolbutamide C1: insulin | ‐ | I1: 6 C1: 7 T: 13 | ‐ | ‐ | ‐ | N/A |
| Wolffenbuttel 1999 | I1: glibenclamide C1: repaglinide | 491 | I1: 140 C1: 288 | I1: 139 C1: 286 | ‐ | I1: 109 C1: 211 T: 320 | I1: 78 C1: 74 T: 75 |
| Yamanouchi 2005 | I1: glimepiride C1: pioglitazone C2: metformin | ‐ | I1: 37 C1: 38 C2: 39 T: 114 | ‐ | I1: 3 C1: 0 C2: 1 T: 4 | I1: 34 C1: 35 C2: 37 T: 106 | I1: 92 C1: 92 C2: 95 T: 93 |
| Zhang 2005 | I1: glipizide C1: rosiglitazone 4 mg C2: rosiglitazone 8 mg | 45 | I1: 8 C1: 8 C2: 8 T: 24 | I1: 8 C1: 8 C2: 8 T: 24 | I1: 0 C1: 0 C2: 0 T: 0 | I1: 8 C1: 8 C2: 8 T: 24 | I1: 100 C1: 100 C2: 100 T: 100 |
| Totalk | I: any sulphonylurea C: any comparator | I: 9707 C: 12,805 T:22,589 | I: 4901 C: 6888 T:11,789 | ||||
| "‐" denotes not reported aThe number of participants finishing the trial is taken from clinicaltrials.gov and is the number of individuals who completed the trial as defined by investigator. bTwenty of the randomised participants are not included in the analysis. It is unknown to which group they belong. Therefore the total number of randomised participants does not equal the sum of the number of randomised patients in each intervention group. cThe number of randomised participants to each comparator group is not reported. Only the 18 participants finishing the trial are described in the publication. dIt is reported that 25 participants were randomised, but only the 22 participants who completed the trial are presented. eData after 52 weeks of double‐blind intervention. From the double‐blind intervention period to the open‐label extension of 91 weeks 84 participants discontinued in the glimepiride group, 70 in the liraglutide 1.2 mg group and 71 in the liraglutide 1.8 mg group. fIt is not described in the publication to which group the three patients who were lost to follow‐up belonged. However, it is stated in the publication that 100 participants were randomised. gA total of 72 participants underwent randomisation, but only 55 participants are included in the analyses of the trial. Eleven participants were excluded because they had received sulphonylurea previously, but the authors did not report to which group they initially were randomised. hIn the publication there is a discrepancy in the number of participants finishing the study. iThe number of patients screened is the number screened to the initial 52 weeks (Charbonnel 2005). jThe numbers for chlorpropamide and insulin interventions are the number of participants randomised to 'Glucose Study 1' plus the number of participants randomised to 'Glucose Study 2'. Lost to follow‐up mortality is not explicitly explained for each antidiabetic intervention group. For 'Glucose Study 1' vital status was unknown for 57 participants in the intensive intervention group (chlorpropamide/glibenclamide/insulin). kThe number of total is not the same as the number of I and C together, as some of the trials only reported the total number of participants randomised (Fineberg 1980; Hermann 1991; Pagano 1995). Several trials did not report the number of participants finishing study. ADOPT: A Diabetes Outcome Progression Trial; APPROACH: Assessment on the Prevention of Progression by Rosiglitazone on Atherosclerosis in Type 2 Diabetes Patients with Cardiovascular History; C: control; I: intervention; LEAD‐3: Liraglutide Effect and Action in Diabetes‐3; N/A: not acknowledged; T: total; UKPDS: United Kingdom Prospective Diabetes Study | |||||||
| Outcome or subgroup title | No. of studies | No. of participants | Statistical method | Effect size |
| 1 All‐cause mortality Show forest plot | 5 | 883 | Risk Ratio (M‐H, Random, 95% CI) | 1.51 [0.91, 2.52] |
| 1.1 First‐generation SU | 2 | 553 | Risk Ratio (M‐H, Random, 95% CI) | 1.46 [0.87, 2.45] |
| 1.2 Second‐generation SU | 3 | 330 | Risk Ratio (M‐H, Random, 95% CI) | 4.86 [0.24, 99.94] |
| 1.3 Third‐generation SU | 0 | 0 | Risk Ratio (M‐H, Random, 95% CI) | 0.0 [0.0, 0.0] |
| 2 All‐cause mortality; best‐worst case scenario Show forest plot | 1 | 57 | Risk Ratio (M‐H, Random, 95% CI) | 0.0 [0.0, 0.0] |
| 2.1 First‐generation SU | 0 | 0 | Risk Ratio (M‐H, Random, 95% CI) | 0.0 [0.0, 0.0] |
| 2.2 Second‐generation SU | 1 | 57 | Risk Ratio (M‐H, Random, 95% CI) | 0.0 [0.0, 0.0] |
| 2.3 Third‐generation SU | 0 | 0 | Risk Ratio (M‐H, Random, 95% CI) | 0.0 [0.0, 0.0] |
| 3 All‐cause mortality; worst‐best case scenario Show forest plot | 1 | 57 | Risk Ratio (M‐H, Random, 95% CI) | 0.0 [0.0, 0.0] |
| 3.1 First‐generation SU | 0 | 0 | Risk Ratio (M‐H, Random, 95% CI) | 0.0 [0.0, 0.0] |
| 3.2 Second‐generation SU | 1 | 57 | Risk Ratio (M‐H, Random, 95% CI) | 0.0 [0.0, 0.0] |
| 3.3 Third‐generation SU | 0 | 0 | Risk Ratio (M‐H, Random, 95% CI) | 0.0 [0.0, 0.0] |
| 4 Cardiovascular mortality Show forest plot | 5 | 883 | Risk Ratio (M‐H, Random, 95% CI) | 2.64 [1.35, 5.17] |
| 4.1 First‐generation SU | 2 | 553 | Risk Ratio (M‐H, Random, 95% CI) | 2.63 [1.32, 5.22] |
| 4.2 Second‐generation SU | 3 | 330 | Risk Ratio (M‐H, Random, 95% CI) | 2.91 [0.12, 70.71] |
| 4.3 Third‐generation SU | 0 | 0 | Risk Ratio (M‐H, Random, 95% CI) | 0.0 [0.0, 0.0] |
| 5 Non‐fatal macrovascular outcomes Show forest plot | 1 | 205 | Risk Ratio (M‐H, Random, 95% CI) | 1.32 [0.82, 2.13] |
| 5.1 First‐generation SU | 0 | 0 | Risk Ratio (M‐H, Random, 95% CI) | 0.0 [0.0, 0.0] |
| 5.2 Second‐generation SU | 1 | 205 | Risk Ratio (M‐H, Random, 95% CI) | 1.32 [0.82, 2.13] |
| 5.3 Third‐generation SU | 0 | 0 | Risk Ratio (M‐H, Random, 95% CI) | 0.0 [0.0, 0.0] |
| 6 Non‐fatal myocardial infarction Show forest plot | 1 | 409 | Risk Ratio (M‐H, Random, 95% CI) | 0.80 [0.43, 1.51] |
| 6.1 First‐generation SU | 1 | 409 | Risk Ratio (M‐H, Random, 95% CI) | 0.80 [0.43, 1.51] |
| 6.2 Second‐generation SU | 0 | 0 | Risk Ratio (M‐H, Random, 95% CI) | 0.0 [0.0, 0.0] |
| 6.3 Third‐generation SU | 0 | 0 | Risk Ratio (M‐H, Random, 95% CI) | 0.0 [0.0, 0.0] |
| 7 Amputation of lower extremity Show forest plot | 1 | 409 | Risk Ratio (M‐H, Random, 95% CI) | 0.20 [0.01, 4.16] |
| 7.1 First‐generation SU | 1 | 409 | Risk Ratio (M‐H, Random, 95% CI) | 0.20 [0.01, 4.16] |
| 7.2 Second‐generation SU | 0 | 0 | Risk Ratio (M‐H, Random, 95% CI) | 0.0 [0.0, 0.0] |
| 7.3 Third‐generation SU | 0 | 0 | Risk Ratio (M‐H, Random, 95% CI) | 0.0 [0.0, 0.0] |
| 8 Nephropathy Show forest plot | 1 | 409 | Risk Ratio (M‐H, Random, 95% CI) | 1.26 [0.34, 4.61] |
| 8.1 First‐generation SU | 1 | 409 | Risk Ratio (M‐H, Random, 95% CI) | 1.26 [0.34, 4.61] |
| 8.2 Second‐generation SU | 0 | 0 | Risk Ratio (M‐H, Random, 95% CI) | 0.0 [0.0, 0.0] |
| 8.3 Third‐generation SU | 0 | 0 | Risk Ratio (M‐H, Random, 95% CI) | 0.0 [0.0, 0.0] |
| 9 Retinopathy Show forest plot | 1 | 409 | Risk Ratio (M‐H, Random, 95% CI) | 0.93 [0.67, 1.30] |
| 9.1 First‐generation SU | 1 | 409 | Risk Ratio (M‐H, Random, 95% CI) | 0.93 [0.67, 1.30] |
| 9.2 Second‐generation SU | 0 | 0 | Risk Ratio (M‐H, Random, 95% CI) | 0.0 [0.0, 0.0] |
| 9.3 Third‐generation SU | 0 | 0 | Risk Ratio (M‐H, Random, 95% CI) | 0.0 [0.0, 0.0] |
| 10 Change in fasting blood glucose from baseline (mmol/L) Show forest plot | 6 | 342 | Mean Difference (IV, Random, 95% CI) | ‐1.35 [‐2.00, ‐0.69] |
| 10.1 First‐generation SU | 1 | 128 | Mean Difference (IV, Random, 95% CI) | ‐2.1 [‐3.19, ‐1.01] |
| 10.2 Second‐generation SU | 5 | 214 | Mean Difference (IV, Random, 95% CI) | ‐1.20 [‐1.94, ‐0.46] |
| 10.3 Third‐generation SU | 0 | 0 | Mean Difference (IV, Random, 95% CI) | 0.0 [0.0, 0.0] |
| 11 Change in HbA1c from baseline (%) Show forest plot | 6 | 342 | Mean Difference (IV, Random, 95% CI) | 1.00 [‐1.21, ‐0.79] |
| 11.1 First‐generation SU | 1 | 128 | Mean Difference (IV, Random, 95% CI) | ‐0.94 [‐1.29, ‐0.59] |
| 11.2 Second‐generation SU | 5 | 214 | Mean Difference (IV, Random, 95% CI) | ‐1.02 [‐1.32, ‐0.72] |
| 11.3 Third‐generation SU | 0 | 0 | Mean Difference (IV, Random, 95% CI) | 0.0 [0.0, 0.0] |
| 12 Change in BMI from baseline (kg/m2) Show forest plot | 3 | 141 | Mean Difference (IV, Random, 95% CI) | ‐0.09 [‐0.59, 0.41] |
| 12.1 First‐generation SU | 0 | 0 | Mean Difference (IV, Random, 95% CI) | 0.0 [0.0, 0.0] |
| 12.2 Second‐generation SU | 3 | 141 | Mean Difference (IV, Random, 95% CI) | ‐0.09 [‐0.59, 0.41] |
| 12.3 Third‐generation SU | 0 | 0 | Mean Difference (IV, Random, 95% CI) | 0.0 [0.0, 0.0] |
| 13 Change in weight from baseline (kg) Show forest plot | 1 | 128 | Mean Difference (IV, Random, 95% CI) | ‐0.40 [‐1.36, 0.56] |
| 13.1 First‐generation SU | 1 | 128 | Mean Difference (IV, Random, 95% CI) | ‐0.40 [‐1.36, 0.56] |
| 13.2 Second‐generation SU | 0 | 0 | Mean Difference (IV, Random, 95% CI) | 0.0 [0.0, 0.0] |
| 13.3 Third‐generation SU | 0 | 0 | Mean Difference (IV, Random, 95% CI) | 0.0 [0.0, 0.0] |
| 14 Adverse events Show forest plot | 3 | 346 | Risk Ratio (M‐H, Random, 95% CI) | 1.23 [0.92, 1.64] |
| 14.1 First‐generation SU | 1 | 144 | Risk Ratio (M‐H, Random, 95% CI) | 1.35 [0.97, 1.88] |
| 14.2 Second‐generation SU | 2 | 202 | Risk Ratio (M‐H, Random, 95% CI) | 0.91 [0.51, 1.62] |
| 14.3 Third‐generation SU | 0 | 0 | Risk Ratio (M‐H, Random, 95% CI) | 0.0 [0.0, 0.0] |
| 15 Drop‐outs due to adverse events Show forest plot | 6 | 654 | Risk Ratio (M‐H, Random, 95% CI) | 0.67 [0.33, 1.36] |
| 15.1 First‐generation SU | 1 | 144 | Risk Ratio (M‐H, Random, 95% CI) | 0.75 [0.17, 3.23] |
| 15.2 Second‐generation SU | 5 | 510 | Risk Ratio (M‐H, Random, 95% CI) | 0.62 [0.24, 1.57] |
| 15.3 Third‐generation SU | 0 | 0 | Risk Ratio (M‐H, Random, 95% CI) | 0.0 [0.0, 0.0] |
| 16 Mild hypoglycaemia Show forest plot | 1 | 134 | Risk Ratio (M‐H, Random, 95% CI) | 12.26 [0.70, 213.33] |
| 16.1 First‐generation SU | 0 | 0 | Risk Ratio (M‐H, Random, 95% CI) | 0.0 [0.0, 0.0] |
| 16.2 Second‐generation SU | 1 | 134 | Risk Ratio (M‐H, Random, 95% CI) | 12.26 [0.70, 213.33] |
| 16.3 Third‐generation SU | 0 | 0 | Risk Ratio (M‐H, Random, 95% CI) | 0.0 [0.0, 0.0] |
| 17 Severe hypoglycaemia Show forest plot | 1 | 46 | Risk Ratio (M‐H, Random, 95% CI) | 0.0 [0.0, 0.0] |
| 17.1 First‐generation SU | 0 | 0 | Risk Ratio (M‐H, Random, 95% CI) | 0.0 [0.0, 0.0] |
| 17.2 Second‐generation SU | 1 | 46 | Risk Ratio (M‐H, Random, 95% CI) | 0.0 [0.0, 0.0] |
| 17.3 Third‐generation SU | 0 | 0 | Risk Ratio (M‐H, Random, 95% CI) | 0.0 [0.0, 0.0] |
| 18 Cancer Show forest plot | 2 | 614 | Risk Ratio (M‐H, Random, 95% CI) | 0.54 [0.06, 5.05] |
| 18.1 First‐generation SU | 1 | 409 | Risk Ratio (M‐H, Random, 95% CI) | 0.25 [0.07, 0.88] |
| 18.2 Second‐generation SU | 1 | 205 | Risk Ratio (M‐H, Random, 95% CI) | 2.91 [0.12, 70.71] |
| 18.3 Third‐generation SU | 0 | 0 | Risk Ratio (M‐H, Random, 95% CI) | 0.0 [0.0, 0.0] |
| 19 Intervention failure Show forest plot | 4 | 794 | Risk Ratio (M‐H, Random, 95% CI) | 0.26 [0.07, 0.94] |
| 19.1 First‐generation SU | 1 | 409 | Risk Ratio (M‐H, Random, 95% CI) | 0.72 [0.44, 1.19] |
| 19.2 Second‐generation SU | 3 | 385 | Risk Ratio (M‐H, Random, 95% CI) | 0.13 [0.04, 0.44] |
| 19.3 Third‐generation SU | 0 | 0 | Risk Ratio (M‐H, Random, 95% CI) | 0.0 [0.0, 0.0] |
| Outcome or subgroup title | No. of studies | No. of participants | Statistical method | Effect size |
| 1 All‐cause mortality Show forest plot | 8 | 3768 | Risk Ratio (M‐H, Random, 95% CI) | 0.98 [0.61, 1.58] |
| 1.1 First‐generation SU | 0 | 0 | Risk Ratio (M‐H, Random, 95% CI) | 0.0 [0.0, 0.0] |
| 1.2 Second‐generation SU | 6 | 3528 | Risk Ratio (M‐H, Random, 95% CI) | 0.98 [0.61, 1.58] |
| 1.3 Third‐generation SU | 2 | 240 | Risk Ratio (M‐H, Random, 95% CI) | 0.0 [0.0, 0.0] |
| 2 All‐cause mortality; best‐worst case scenario Show forest plot | 5 | 283 | Risk Ratio (M‐H, Random, 95% CI) | 0.72 [0.12, 4.45] |
| 2.1 First‐generation SU | 0 | 0 | Risk Ratio (M‐H, Random, 95% CI) | 0.0 [0.0, 0.0] |
| 2.2 Second‐generation SU | 4 | 207 | Risk Ratio (M‐H, Random, 95% CI) | 1.02 [0.10, 10.25] |
| 2.3 Third‐generation SU | 1 | 76 | Risk Ratio (M‐H, Random, 95% CI) | 0.35 [0.01, 8.35] |
| 3 All‐cause mortality; worst‐best case scenario Show forest plot | 5 | 283 | Risk Ratio (M‐H, Random, 95% CI) | 1.81 [0.37, 8.71] |
| 3.1 First‐generation SU | 0 | 0 | Risk Ratio (M‐H, Random, 95% CI) | 0.0 [0.0, 0.0] |
| 3.2 Second‐generation SU | 4 | 207 | Risk Ratio (M‐H, Random, 95% CI) | 1.02 [0.10, 10.25] |
| 3.3 Third‐generation SU | 1 | 76 | Risk Ratio (M‐H, Random, 95% CI) | 3.16 [0.34, 29.06] |
| 4 Cardiovascular mortality Show forest plot | 8 | 3768 | Risk Ratio (M‐H, Random, 95% CI) | 1.47 [0.54, 4.01] |
| 4.1 First‐generation SU | 0 | 0 | Risk Ratio (M‐H, Random, 95% CI) | 0.0 [0.0, 0.0] |
| 4.2 Second‐generation SU | 6 | 3528 | Risk Ratio (M‐H, Random, 95% CI) | 1.47 [0.54, 4.01] |
| 4.3 Third‐generation SU | 2 | 240 | Risk Ratio (M‐H, Random, 95% CI) | 0.0 [0.0, 0.0] |
| 5 Non‐fatal macrovascular outcomes Show forest plot | 4 | 3094 | Risk Ratio (M‐H, Random, 95% CI) | 0.67 [0.48, 0.93] |
| 5.1 First‐generation SU | 0 | 0 | Risk Ratio (M‐H, Random, 95% CI) | 0.0 [0.0, 0.0] |
| 5.2 Second‐generation SU | 3 | 3018 | Risk Ratio (M‐H, Random, 95% CI) | 0.67 [0.48, 0.93] |
| 5.3 Third‐generation SU | 1 | 76 | Risk Ratio (M‐H, Random, 95% CI) | 0.0 [0.0, 0.0] |
| 6 Non‐fatal myocardial infarction Show forest plot | 4 | 3061 | Risk Ratio (M‐H, Random, 95% CI) | 1.02 [0.37, 2.85] |
| 6.1 First‐generation SU | 0 | 0 | Risk Ratio (M‐H, Random, 95% CI) | 0.0 [0.0, 0.0] |
| 6.2 Second‐generation SU | 4 | 3061 | Risk Ratio (M‐H, Random, 95% CI) | 1.02 [0.37, 2.85] |
| 6.3 Third‐generation SU | 0 | 0 | Risk Ratio (M‐H, Random, 95% CI) | 0.0 [0.0, 0.0] |
| 7 Non‐fatal stroke Show forest plot | 1 | 44 | Risk Ratio (M‐H, Random, 95% CI) | 0.0 [0.0, 0.0] |
| 7.1 First‐generation SU | 0 | 0 | Risk Ratio (M‐H, Random, 95% CI) | 0.0 [0.0, 0.0] |
| 7.2 Second‐generation SU | 1 | 44 | Risk Ratio (M‐H, Random, 95% CI) | 0.0 [0.0, 0.0] |
| 7.3 Third‐generation SU | 0 | 0 | Risk Ratio (M‐H, Random, 95% CI) | 0.0 [0.0, 0.0] |
| 8 Amputation of lower extremity Show forest plot | 1 | 44 | Risk Ratio (M‐H, Random, 95% CI) | 0.0 [0.0, 0.0] |
| 8.1 First‐generation SU | 0 | 0 | Risk Ratio (M‐H, Random, 95% CI) | 0.0 [0.0, 0.0] |
| 8.2 Second‐generation SU | 1 | 44 | Risk Ratio (M‐H, Random, 95% CI) | 0.0 [0.0, 0.0] |
| 8.3 Third‐generation SU | 0 | 0 | Risk Ratio (M‐H, Random, 95% CI) | 0.0 [0.0, 0.0] |
| 9 Peripheral revascularisation Show forest plot | 2 | 2946 | Risk Ratio (M‐H, Random, 95% CI) | 1.15 [0.69, 1.92] |
| 9.1 First‐generation SU | 0 | 0 | Risk Ratio (M‐H, Random, 95% CI) | 0.0 [0.0, 0.0] |
| 9.2 Second‐generation SU | 2 | 2946 | Risk Ratio (M‐H, Random, 95% CI) | 1.15 [0.69, 1.92] |
| 9.3 Third‐generation SU | 0 | 0 | Risk Ratio (M‐H, Random, 95% CI) | 0.0 [0.0, 0.0] |
| 10 Microvascular outcomes Show forest plot | 1 | 44 | Risk Ratio (M‐H, Random, 95% CI) | 2.0 [0.20, 20.49] |
| 10.1 First‐generation SU | 0 | 0 | Risk Ratio (M‐H, Random, 95% CI) | 0.0 [0.0, 0.0] |
| 10.2 Second‐generation SU | 1 | 44 | Risk Ratio (M‐H, Random, 95% CI) | 2.0 [0.20, 20.49] |
| 10.3 Third‐generation SU | 0 | 0 | Risk Ratio (M‐H, Random, 95% CI) | 0.0 [0.0, 0.0] |
| 11 Nephropathy Show forest plot | 1 | 44 | Risk Ratio (M‐H, Random, 95% CI) | 1.0 [0.07, 15.00] |
| 11.1 First‐generation SU | 0 | 0 | Risk Ratio (M‐H, Random, 95% CI) | 0.0 [0.0, 0.0] |
| 11.2 Second‐generation SU | 1 | 44 | Risk Ratio (M‐H, Random, 95% CI) | 1.0 [0.07, 15.00] |
| 11.3 Third‐generation SU | 0 | 0 | Risk Ratio (M‐H, Random, 95% CI) | 0.0 [0.0, 0.0] |
| 12 Retinal photocoagulation Show forest plot | 1 | 44 | Risk Ratio (M‐H, Random, 95% CI) | 0.0 [0.0, 0.0] |
| 12.1 First‐generation SU | 0 | 0 | Risk Ratio (M‐H, Random, 95% CI) | 0.0 [0.0, 0.0] |
| 12.2 Second‐generation SU | 1 | 44 | Risk Ratio (M‐H, Random, 95% CI) | 0.0 [0.0, 0.0] |
| 12.3 Third‐generation SU | 0 | 0 | Risk Ratio (M‐H, Random, 95% CI) | 0.0 [0.0, 0.0] |
| 13 Change in fasting blood glucose from baseline (mmol/L) Show forest plot | 15 | 4654 | Mean Difference (IV, Random, 95% CI) | 0.20 [‐0.07, 0.48] |
| 13.1 First‐generation SU | 2 | 482 | Mean Difference (IV, Random, 95% CI) | 0.13 [‐0.75, 1.01] |
| 13.2 Second‐generation SU | 11 | 3891 | Mean Difference (IV, Random, 95% CI) | 0.43 [0.10, 0.75] |
| 13.3 Third‐generation SU | 3 | 281 | Mean Difference (IV, Random, 95% CI) | ‐0.22 [‐0.52, 0.08] |
| 14 Change in HbA1c from baseline (%) Show forest plot | 13 | 3632 | Mean Difference (IV, Random, 95% CI) | 0.06 [‐0.16, 0.29] |
| 14.1 First‐generation SU | 0 | 0 | Mean Difference (IV, Random, 95% CI) | 0.0 [0.0, 0.0] |
| 14.2 Second‐generation SU | 10 | 3351 | Mean Difference (IV, Random, 95% CI) | 0.17 [‐0.09, 0.44] |
| 14.3 Third‐generation SU | 3 | 281 | Mean Difference (IV, Random, 95% CI) | ‐0.18 [‐0.43, 0.07] |
| 15 Change in BMI from baseline (kg/m2) Show forest plot | 5 | 322 | Mean Difference (IV, Random, 95% CI) | 0.13 [‐0.69, 0.94] |
| 15.1 First‐generation SU | 0 | 0 | Mean Difference (IV, Random, 95% CI) | 0.0 [0.0, 0.0] |
| 15.2 Second‐generation SU | 3 | 103 | Mean Difference (IV, Random, 95% CI) | 0.25 [‐1.21, 1.70] |
| 15.3 Third‐generation SU | 2 | 219 | Mean Difference (IV, Random, 95% CI) | ‐0.10 [‐1.06, 0.86] |
| 16 Change in weight from baseline (kg) Show forest plot | 7 | 3497 | Mean Difference (IV, Random, 95% CI) | 3.77 [3.06, 4.47] |
| 16.1 First‐generation SU | 0 | 0 | Mean Difference (IV, Random, 95% CI) | 0.0 [0.0, 0.0] |
| 16.2 Second‐generation SU | 7 | 3497 | Mean Difference (IV, Random, 95% CI) | 3.77 [3.06, 4.47] |
| 16.3 Third‐generation SU | 0 | 0 | Mean Difference (IV, Random, 95% CI) | 0.0 [0.0, 0.0] |
| 17 Adverse events Show forest plot | 5 | 3118 | Risk Ratio (M‐H, Random, 95% CI) | 0.99 [0.97, 1.01] |
| 17.1 First‐generation SU | 0 | 0 | Risk Ratio (M‐H, Random, 95% CI) | 0.0 [0.0, 0.0] |
| 17.2 Second‐generation SU | 4 | 3042 | Risk Ratio (M‐H, Random, 95% CI) | 0.99 [0.97, 1.01] |
| 17.3 Third‐generation SU | 1 | 76 | Risk Ratio (M‐H, Random, 95% CI) | 3.16 [0.13, 75.16] |
| 18 Serious adverse events Show forest plot | 5 | 3175 | Risk Ratio (M‐H, Random, 95% CI) | 0.94 [0.82, 1.07] |
| 18.1 First‐generation SU | 0 | 0 | Risk Ratio (M‐H, Random, 95% CI) | 0.0 [0.0, 0.0] |
| 18.2 Second‐generation SU | 4 | 3011 | Risk Ratio (M‐H, Random, 95% CI) | 0.94 [0.82, 1.07] |
| 18.3 Third‐generation SU | 1 | 164 | Risk Ratio (M‐H, Random, 95% CI) | 0.0 [0.0, 0.0] |
| 19 Drop‐outs due to adverse events Show forest plot | 8 | 3731 | Risk Ratio (M‐H, Random, 95% CI) | 1.18 [0.98, 1.41] |
| 19.1 First‐generation SU | 0 | 0 | Risk Ratio (M‐H, Random, 95% CI) | 0.0 [0.0, 0.0] |
| 19.2 Second‐generation SU | 7 | 3567 | Risk Ratio (M‐H, Random, 95% CI) | 1.19 [0.99, 1.42] |
| 19.3 Third‐generation SU | 1 | 164 | Risk Ratio (M‐H, Random, 95% CI) | 0.20 [0.01, 4.20] |
| 20 Mild hypoglycaemia Show forest plot | 6 | 4827 | Risk Ratio (M‐H, Fixed, 95% CI) | 3.16 [2.74, 3.64] |
| 20.1 First‐generation SU | 1 | 607 | Risk Ratio (M‐H, Fixed, 95% CI) | 1.89 [1.00, 3.58] |
| 20.2 Second‐generation SU | 5 | 4056 | Risk Ratio (M‐H, Fixed, 95% CI) | 3.24 [2.80, 3.76] |
| 20.3 Third‐generation SU | 1 | 164 | Risk Ratio (M‐H, Fixed, 95% CI) | 0.0 [0.0, 0.0] |
| 21 Moderate hypoglycaemia Show forest plot | 1 | 44 | Risk Ratio (M‐H, Random, 95% CI) | 3.0 [0.13, 69.87] |
| 21.1 First‐generation SU | 0 | 0 | Risk Ratio (M‐H, Random, 95% CI) | 0.0 [0.0, 0.0] |
| 21.2 Second‐generation SU | 1 | 44 | Risk Ratio (M‐H, Random, 95% CI) | 3.0 [0.13, 69.87] |
| 21.3 Third‐generation SU | 0 | 0 | Risk Ratio (M‐H, Random, 95% CI) | 0.0 [0.0, 0.0] |
| 22 Severe hypoglycaemia Show forest plot | 5 | 4408 | Risk Ratio (M‐H, Random, 95% CI) | 4.50 [1.24, 16.31] |
| 22.1 First‐generation SU | 1 | 607 | Risk Ratio (M‐H, Random, 95% CI) | 2.58 [0.24, 28.31] |
| 22.2 Second‐generation SU | 4 | 3637 | Risk Ratio (M‐H, Random, 95% CI) | 5.64 [1.22, 26.00] |
| 22.3 Third‐generation SU | 1 | 164 | Risk Ratio (M‐H, Random, 95% CI) | 0.0 [0.0, 0.0] |
| 23 Cancer Show forest plot | 1 | 2902 | Risk Ratio (M‐H, Random, 95% CI) | 1.11 [0.76, 1.61] |
| 23.1 First‐generation SU | 0 | 0 | Risk Ratio (M‐H, Random, 95% CI) | 0.0 [0.0, 0.0] |
| 23.2 Second‐generation SU | 1 | 2902 | Risk Ratio (M‐H, Random, 95% CI) | 1.11 [0.76, 1.61] |
| 23.3 Third‐generation SU | 0 | 0 | Risk Ratio (M‐H, Random, 95% CI) | 0.0 [0.0, 0.0] |
| 24 Intervention failure Show forest plot | 9 | 4990 | Risk Ratio (M‐H, Random, 95% CI) | 0.92 [0.60, 1.39] |
| 24.1 First‐generation SU | 1 | 607 | Risk Ratio (M‐H, Random, 95% CI) | 0.63 [0.36, 1.09] |
| 24.2 Second‐generation SU | 7 | 4143 | Risk Ratio (M‐H, Random, 95% CI) | 0.97 [0.60, 1.57] |
| 24.3 Third‐generation SU | 2 | 240 | Risk Ratio (M‐H, Random, 95% CI) | 1.23 [0.43, 3.50] |
| Outcome or subgroup title | No. of studies | No. of participants | Statistical method | Effect size |
| 1 All‐cause mortality Show forest plot | 8 | 5030 | Risk Ratio (M‐H, Random, 95% CI) | 0.92 [0.60, 1.41] |
| 1.1 First‐generation SU | 0 | 0 | Risk Ratio (M‐H, Random, 95% CI) | 0.0 [0.0, 0.0] |
| 1.2 Second‐generation SU | 7 | 4955 | Risk Ratio (M‐H, Random, 95% CI) | 0.92 [0.60, 1.41] |
| 1.3 Third‐generation SU | 1 | 75 | Risk Ratio (M‐H, Random, 95% CI) | 0.0 [0.0, 0.0] |
| 2 All‐cause mortality; best‐worst case scenario Show forest plot | 5 | 1327 | Risk Ratio (M‐H, Random, 95% CI) | 0.18 [0.06, 0.54] |
| 2.1 First‐generation SU | 0 | 0 | Risk Ratio (M‐H, Random, 95% CI) | 0.0 [0.0, 0.0] |
| 2.2 Second‐generation SU | 4 | 1252 | Risk Ratio (M‐H, Random, 95% CI) | 0.18 [0.06, 0.54] |
| 2.3 Third‐generation SU | 1 | 75 | Risk Ratio (M‐H, Random, 95% CI) | 0.0 [0.0, 0.0] |
| 3 All‐cause mortality; worst‐best case scenario Show forest plot | 5 | 1327 | Risk Ratio (M‐H, Random, 95% CI) | 7.49 [1.39, 40.18] |
| 3.1 First‐generation SU | 0 | 0 | Risk Ratio (M‐H, Random, 95% CI) | 0.0 [0.0, 0.0] |
| 3.2 Second‐generation SU | 4 | 1252 | Risk Ratio (M‐H, Random, 95% CI) | 9.76 [0.59, 161.27] |
| 3.3 Third‐generation SU | 1 | 75 | Risk Ratio (M‐H, Random, 95% CI) | 7.18 [0.38, 134.45] |
| 4 Cardiovascular mortality Show forest plot | 8 | 5030 | Risk Ratio (M‐H, Random, 95% CI) | 1.30 [0.55, 3.07] |
| 4.1 First‐generation SU | 0 | 0 | Risk Ratio (M‐H, Random, 95% CI) | 0.0 [0.0, 0.0] |
| 4.2 Second‐generation SU | 7 | 4955 | Risk Ratio (M‐H, Random, 95% CI) | 1.30 [0.55, 3.07] |
| 4.3 Third‐generation SU | 1 | 75 | Risk Ratio (M‐H, Random, 95% CI) | 0.0 [0.0, 0.0] |
| 5 Non‐fatal macrovascular outcomes Show forest plot | 7 | 4675 | Risk Ratio (M‐H, Random, 95% CI) | 0.91 [0.62, 1.33] |
| 5.1 First‐generation SU | 0 | 0 | Risk Ratio (M‐H, Random, 95% CI) | 0.0 [0.0, 0.0] |
| 5.2 Second‐generation SU | 6 | 4600 | Risk Ratio (M‐H, Random, 95% CI) | 0.91 [0.62, 1.33] |
| 5.3 Third‐generation SU | 1 | 75 | Risk Ratio (M‐H, Random, 95% CI) | 0.0 [0.0, 0.0] |
| 6 Non‐fatal myocardial infarction Show forest plot | 7 | 4956 | Risk Ratio (M‐H, Random, 95% CI) | 0.68 [0.41, 1.14] |
| 6.1 First‐generation SU | 0 | 0 | Risk Ratio (M‐H, Random, 95% CI) | 0.0 [0.0, 0.0] |
| 6.2 Second‐generation SU | 7 | 4956 | Risk Ratio (M‐H, Random, 95% CI) | 0.68 [0.41, 1.14] |
| 6.3 Third‐generation SU | 0 | 0 | Risk Ratio (M‐H, Random, 95% CI) | 0.0 [0.0, 0.0] |
| 7 Non‐fatal stroke Show forest plot | 2 | 707 | Risk Ratio (M‐H, Random, 95% CI) | 0.20 [0.02, 1.67] |
| 7.1 First‐generation SU | 0 | 0 | Risk Ratio (M‐H, Random, 95% CI) | 0.0 [0.0, 0.0] |
| 7.2 Second‐generation SU | 2 | 707 | Risk Ratio (M‐H, Random, 95% CI) | 0.20 [0.02, 1.67] |
| 7.3 Third‐generation SU | 0 | 0 | Risk Ratio (M‐H, Random, 95% CI) | 0.0 [0.0, 0.0] |
| 8 Amputation of lower extremity Show forest plot | 2 | 707 | Risk Ratio (M‐H, Random, 95% CI) | 0.0 [0.0, 0.0] |
| 8.1 First‐generation SU | 0 | 0 | Risk Ratio (M‐H, Random, 95% CI) | 0.0 [0.0, 0.0] |
| 8.2 Second‐generation SU | 2 | 707 | Risk Ratio (M‐H, Random, 95% CI) | 0.0 [0.0, 0.0] |
| 8.3 Third‐generation SU | 0 | 0 | Risk Ratio (M‐H, Random, 95% CI) | 0.0 [0.0, 0.0] |
| 9 Cardial revascularisation Show forest plot | 2 | 707 | Risk Ratio (M‐H, Random, 95% CI) | 1.02 [0.61, 1.71] |
| 9.1 First‐generation SU | 0 | 0 | Risk Ratio (M‐H, Random, 95% CI) | 0.0 [0.0, 0.0] |
| 9.2 Second‐generation SU | 2 | 707 | Risk Ratio (M‐H, Random, 95% CI) | 1.02 [0.61, 1.71] |
| 9.3 Third‐generation SU | 0 | 0 | Risk Ratio (M‐H, Random, 95% CI) | 0.0 [0.0, 0.0] |
| 10 Peripheral revascularisation Show forest plot | 3 | 3612 | Risk Ratio (M‐H, Random, 95% CI) | 0.87 [0.54, 1.39] |
| 10.1 First‐generation SU | 0 | 0 | Risk Ratio (M‐H, Random, 95% CI) | 0.0 [0.0, 0.0] |
| 10.2 Second‐generation SU | 3 | 3612 | Risk Ratio (M‐H, Random, 95% CI) | 0.87 [0.54, 1.39] |
| 10.3 Third‐generation SU | 0 | 0 | Risk Ratio (M‐H, Random, 95% CI) | 0.0 [0.0, 0.0] |
| 11 Microvascular outcomes Show forest plot | 2 | 235 | Risk Ratio (M‐H, Random, 95% CI) | 0.83 [0.05, 13.16] |
| 11.1 First‐generation SU | 0 | 0 | Risk Ratio (M‐H, Random, 95% CI) | 0.0 [0.0, 0.0] |
| 11.2 Second‐generation SU | 2 | 235 | Risk Ratio (M‐H, Random, 95% CI) | 0.83 [0.05, 13.16] |
| 11.3 Third‐generation SU | 0 | 0 | Risk Ratio (M‐H, Random, 95% CI) | 0.0 [0.0, 0.0] |
| 12 Nephropathy Show forest plot | 2 | 707 | Risk Ratio (M‐H, Random, 95% CI) | 0.11 [0.01, 2.02] |
| 12.1 First‐generation SU | 0 | 0 | Risk Ratio (M‐H, Random, 95% CI) | 0.0 [0.0, 0.0] |
| 12.2 Second‐generation SU | 2 | 707 | Risk Ratio (M‐H, Random, 95% CI) | 0.11 [0.01, 2.02] |
| 12.3 Third‐generation SU | 0 | 0 | Risk Ratio (M‐H, Random, 95% CI) | 0.0 [0.0, 0.0] |
| 13 Retinopathy Show forest plot | 2 | 707 | Risk Ratio (M‐H, Random, 95% CI) | 0.98 [0.06, 15.64] |
| 13.1 First‐generation SU | 0 | 0 | Risk Ratio (M‐H, Random, 95% CI) | 0.0 [0.0, 0.0] |
| 13.2 Second‐generation SU | 2 | 707 | Risk Ratio (M‐H, Random, 95% CI) | 0.98 [0.06, 15.64] |
| 13.3 Third‐generation SU | 0 | 0 | Risk Ratio (M‐H, Random, 95% CI) | 0.0 [0.0, 0.0] |
| 14 Retinal photocoagulation Show forest plot | 2 | 707 | Risk Ratio (M‐H, Random, 95% CI) | 0.0 [0.0, 0.0] |
| 14.1 First‐generation SU | 0 | 0 | Risk Ratio (M‐H, Random, 95% CI) | 0.0 [0.0, 0.0] |
| 14.2 Second‐generation SU | 2 | 707 | Risk Ratio (M‐H, Random, 95% CI) | 0.0 [0.0, 0.0] |
| 14.3 Third‐generation SU | 0 | 0 | Risk Ratio (M‐H, Random, 95% CI) | 0.0 [0.0, 0.0] |
| 15 Change in fasting blood glucose from baseline (mmol/L) Show forest plot | 18 | 6731 | Mean Difference (IV, Random, 95% CI) | 0.53 [0.31, 0.75] |
| 15.1 First‐generation SU | 0 | 0 | Mean Difference (IV, Random, 95% CI) | 0.0 [0.0, 0.0] |
| 15.2 Second‐generation SU | 14 | 6076 | Mean Difference (IV, Random, 95% CI) | 0.56 [0.33, 0.79] |
| 15.3 Third‐generation SU | 4 | 655 | Mean Difference (IV, Random, 95% CI) | 0.46 [‐0.22, 1.13] |
| 16 Change in HbA1c from baseline (%) Show forest plot | 21 | 7435 | Mean Difference (IV, Random, 95% CI) | 0.03 [‐0.10, 0.16] |
| 16.1 First‐generation SU | 0 | 0 | Mean Difference (IV, Random, 95% CI) | 0.0 [0.0, 0.0] |
| 16.2 Second‐generation SU | 17 | 6776 | Mean Difference (IV, Random, 95% CI) | 0.06 [‐0.09, 0.20] |
| 16.3 Third‐generation SU | 4 | 659 | Mean Difference (IV, Random, 95% CI) | ‐0.09 [‐0.31, 0.14] |
| 17 Change in BMI from baseline (kg/m2) Show forest plot | 7 | 532 | Mean Difference (IV, Random, 95% CI) | ‐0.98 [‐1.18, ‐0.79] |
| 17.1 First‐generation SU | 0 | 0 | Mean Difference (IV, Random, 95% CI) | 0.0 [0.0, 0.0] |
| 17.2 Second‐generation SU | 4 | 121 | Mean Difference (IV, Random, 95% CI) | 1.00 [‐1.20, ‐0.80] |
| 17.3 Third‐generation SU | 3 | 411 | Mean Difference (IV, Random, 95% CI) | ‐0.75 [‐1.58, 0.08] |
| 18 Change in weight from baseline (kg) Show forest plot | 11 | 5948 | Mean Difference (IV, Random, 95% CI) | ‐1.86 [‐2.50, ‐1.21] |
| 18.1 First‐generation SU | 0 | 0 | Mean Difference (IV, Random, 95% CI) | 0.0 [0.0, 0.0] |
| 18.2 Second‐generation SU | 10 | 5779 | Mean Difference (IV, Random, 95% CI) | ‐1.90 [‐2.56, ‐1.25] |
| 18.3 Third‐generation SU | 1 | 169 | Mean Difference (IV, Random, 95% CI) | 0.20 [‐3.75, 4.15] |
| 19 Adverse events Show forest plot | 13 | 7001 | Risk Ratio (M‐H, Random, 95% CI) | 0.98 [0.94, 1.01] |
| 19.1 First‐generation SU | 0 | 0 | Risk Ratio (M‐H, Random, 95% CI) | 0.0 [0.0, 0.0] |
| 19.2 Second‐generation SU | 10 | 6491 | Risk Ratio (M‐H, Random, 95% CI) | 0.99 [0.97, 1.01] |
| 19.3 Third‐generation SU | 3 | 510 | Risk Ratio (M‐H, Random, 95% CI) | 0.88 [0.78, 0.99] |
| 20 Serious adverse events Show forest plot | 11 | 5605 | Risk Ratio (M‐H, Random, 95% CI) | 0.90 [0.80, 1.01] |
| 20.1 First‐generation SU | 0 | 0 | Risk Ratio (M‐H, Random, 95% CI) | 0.0 [0.0, 0.0] |
| 20.2 Second‐generation SU | 8 | 4979 | Risk Ratio (M‐H, Random, 95% CI) | 0.90 [0.80, 1.01] |
| 20.3 Third‐generation SU | 3 | 626 | Risk Ratio (M‐H, Random, 95% CI) | 0.61 [0.21, 1.83] |
| 21 Drop‐outs due to adverse events Show forest plot | 17 | 7856 | Risk Ratio (M‐H, Random, 95% CI) | 1.16 [1.00, 1.34] |
| 21.1 First‐generation SU | 0 | 0 | Risk Ratio (M‐H, Random, 95% CI) | 0.0 [0.0, 0.0] |
| 21.2 Second‐generation SU | 15 | 7433 | Risk Ratio (M‐H, Random, 95% CI) | 1.15 [0.98, 1.36] |
| 21.3 Third‐generation SU | 2 | 423 | Risk Ratio (M‐H, Random, 95% CI) | 0.54 [0.15, 1.97] |
| 22 Mild hypoglycaemia Show forest plot | 9 | 6556 | Risk Ratio (M‐H, Random, 95% CI) | 3.95 [3.08, 5.06] |
| 22.1 First‐generation SU | 0 | 0 | Risk Ratio (M‐H, Random, 95% CI) | 0.0 [0.0, 0.0] |
| 22.2 Second‐generation SU | 8 | 6365 | Risk Ratio (M‐H, Random, 95% CI) | 4.05 [3.28, 5.00] |
| 22.3 Third‐generation SU | 1 | 191 | Risk Ratio (M‐H, Random, 95% CI) | 1.41 [0.47, 4.30] |
| 23 Moderate hypoglycaemia Show forest plot | 1 | 35 | Risk Ratio (M‐H, Random, 95% CI) | 0.0 [0.0, 0.0] |
| 23.1 First‐generation SU | 0 | 0 | Risk Ratio (M‐H, Random, 95% CI) | 0.0 [0.0, 0.0] |
| 23.2 Second‐generation SU | 1 | 35 | Risk Ratio (M‐H, Random, 95% CI) | 0.0 [0.0, 0.0] |
| 23.3 Third‐generation SU | 0 | 0 | Risk Ratio (M‐H, Random, 95% CI) | 0.0 [0.0, 0.0] |
| 24 Severe hypoglycaemia Show forest plot | 8 | 6030 | Risk Ratio (M‐H, Random, 95% CI) | 6.11 [1.57, 23.79] |
| 24.1 First‐generation SU | 0 | 0 | Risk Ratio (M‐H, Random, 95% CI) | 0.0 [0.0, 0.0] |
| 24.2 Second‐generation SU | 6 | 5660 | Risk Ratio (M‐H, Random, 95% CI) | 6.11 [1.57, 23.79] |
| 24.3 Third‐generation SU | 2 | 370 | Risk Ratio (M‐H, Random, 95% CI) | 0.0 [0.0, 0.0] |
| 25 Cancer Show forest plot | 6 | 4912 | Risk Ratio (M‐H, Random, 95% CI) | 1.02 [0.72, 1.45] |
| 25.1 First‐generation SU | 0 | 0 | Risk Ratio (M‐H, Random, 95% CI) | 0.0 [0.0, 0.0] |
| 25.2 Second‐generation SU | 6 | 4912 | Risk Ratio (M‐H, Random, 95% CI) | 1.02 [0.72, 1.45] |
| 25.3 Third‐generation SU | 0 | 0 | Risk Ratio (M‐H, Random, 95% CI) | 0.0 [0.0, 0.0] |
| 26 Intervention failure Show forest plot | 10 | 6757 | Risk Ratio (M‐H, Random, 95% CI) | 0.97 [0.65, 1.45] |
| 26.1 First‐generation SU | 0 | 0 | Risk Ratio (M‐H, Random, 95% CI) | 0.0 [0.0, 0.0] |
| 26.2 Second‐generation SU | 8 | 6438 | Risk Ratio (M‐H, Random, 95% CI) | 1.10 [0.73, 1.65] |
| 26.3 Third‐generation SU | 2 | 319 | Risk Ratio (M‐H, Random, 95% CI) | 0.24 [0.08, 0.75] |
| Outcome or subgroup title | No. of studies | No. of participants | Statistical method | Effect size |
| 1 All‐cause mortality Show forest plot | 5 | 3586 | Risk Ratio (M‐H, Random, 95% CI) | 1.05 [0.92, 1.21] |
| 1.1 First‐generation SU | 2 | 1944 | Risk Ratio (M‐H, Random, 95% CI) | 1.18 [0.88, 1.59] |
| 1.2 Second‐generation SU | 4 | 1642 | Risk Ratio (M‐H, Random, 95% CI) | 0.96 [0.79, 1.18] |
| 1.3 Third‐generation SU | 0 | 0 | Risk Ratio (M‐H, Random, 95% CI) | 0.0 [0.0, 0.0] |
| 2 All‐cause mortality; best‐worst case scenario Show forest plot | 2 | 80 | Risk Ratio (M‐H, Random, 95% CI) | 0.13 [0.02, 0.95] |
| 2.1 First‐generation SU | 0 | 0 | Risk Ratio (M‐H, Random, 95% CI) | 0.0 [0.0, 0.0] |
| 2.2 Second‐generation SU | 2 | 80 | Risk Ratio (M‐H, Random, 95% CI) | 0.13 [0.02, 0.95] |
| 2.3 Third‐generation SU | 0 | 0 | Risk Ratio (M‐H, Random, 95% CI) | 0.0 [0.0, 0.0] |
| 3 All‐cause mortality; worst‐best case scenario Show forest plot | 2 | 80 | Risk Ratio (M‐H, Random, 95% CI) | 3.54 [0.83, 15.00] |
| 3.1 First‐generation SU | 0 | 0 | Risk Ratio (M‐H, Random, 95% CI) | 0.0 [0.0, 0.0] |
| 3.2 Second‐generation SU | 2 | 80 | Risk Ratio (M‐H, Random, 95% CI) | 3.54 [0.83, 15.00] |
| 3.3 Third‐generation SU | 0 | 0 | Risk Ratio (M‐H, Random, 95% CI) | 0.0 [0.0, 0.0] |
| 4 Cardiovascular mortality Show forest plot | 5 | 3586 | Risk Ratio (M‐H, Random, 95% CI) | 1.09 [0.82, 1.44] |
| 4.1 First‐generation SU | 2 | 1944 | Risk Ratio (M‐H, Random, 95% CI) | 1.36 [0.68, 2.71] |
| 4.2 Second‐generation SU | 4 | 1642 | Risk Ratio (M‐H, Random, 95% CI) | 0.96 [0.73, 1.28] |
| 4.3 Third‐generation SU | 0 | 0 | Risk Ratio (M‐H, Random, 95% CI) | 0.0 [0.0, 0.0] |
| 5 Non‐fatal myocardial infarction Show forest plot | 2 | 3470 | Risk Ratio (M‐H, Random, 95% CI) | 0.99 [0.79, 1.23] |
| 5.1 First‐generation SU | 2 | 1944 | Risk Ratio (M‐H, Random, 95% CI) | 1.08 [0.81, 1.45] |
| 5.2 Second‐generation SU | 1 | 1526 | Risk Ratio (M‐H, Random, 95% CI) | 0.86 [0.61, 1.22] |
| 5.3 Third‐generation SU | 0 | 0 | Risk Ratio (M‐H, Random, 95% CI) | 0.0 [0.0, 0.0] |
| 6 Non‐fatal stroke Show forest plot | 2 | 3470 | Risk Ratio (M‐H, Random, 95% CI) | 1.45 [1.02, 2.06] |
| 6.1 First‐generation SU | 2 | 1944 | Risk Ratio (M‐H, Random, 95% CI) | 1.23 [0.74, 2.05] |
| 6.2 Second‐generation SU | 1 | 1526 | Risk Ratio (M‐H, Random, 95% CI) | 1.68 [1.04, 2.71] |
| 6.3 Third‐generation SU | 0 | 0 | Risk Ratio (M‐H, Random, 95% CI) | 0.0 [0.0, 0.0] |
| 7 Amputation of lower extremity Show forest plot | 2 | 3470 | Risk Ratio (M‐H, Random, 95% CI) | 0.49 [0.24, 1.00] |
| 7.1 First‐generation SU | 2 | 1944 | Risk Ratio (M‐H, Random, 95% CI) | 0.49 [0.18, 1.34] |
| 7.2 Second‐generation SU | 1 | 1526 | Risk Ratio (M‐H, Random, 95% CI) | 0.49 [0.18, 1.35] |
| 7.3 Third‐generation SU | 0 | 0 | Risk Ratio (M‐H, Random, 95% CI) | 0.0 [0.0, 0.0] |
| 8 Microvascular outcomes Show forest plot | 1 | 3056 | Risk Ratio (M‐H, Random, 95% CI) | 1.12 [0.82, 1.53] |
| 8.1 First‐generation SU | 1 | 1530 | Risk Ratio (M‐H, Random, 95% CI) | 1.30 [0.95, 1.77] |
| 8.2 Second‐generation SU | 1 | 1526 | Risk Ratio (M‐H, Random, 95% CI) | 0.94 [0.67, 1.33] |
| 8.3 Third‐generation SU | 0 | 0 | Risk Ratio (M‐H, Random, 95% CI) | 0.0 [0.0, 0.0] |
| 9 Nephropathy Show forest plot | 1 | 414 | Risk Ratio (M‐H, Random, 95% CI) | 11.32 [0.63, 203.45] |
| 9.1 First‐generation SU | 1 | 414 | Risk Ratio (M‐H, Random, 95% CI) | 11.32 [0.63, 203.45] |
| 9.2 Second‐generation SU | 0 | 0 | Risk Ratio (M‐H, Random, 95% CI) | 0.0 [0.0, 0.0] |
| 9.3 Third‐generation SU | 0 | 0 | Risk Ratio (M‐H, Random, 95% CI) | 0.0 [0.0, 0.0] |
| 10 Retinopathy Show forest plot | 1 | 414 | Risk Ratio (M‐H, Random, 95% CI) | 0.99 [0.71, 1.39] |
| 10.1 First‐generation SU | 1 | 414 | Risk Ratio (M‐H, Random, 95% CI) | 0.99 [0.71, 1.39] |
| 10.2 Second‐generation SU | 0 | 0 | Risk Ratio (M‐H, Random, 95% CI) | 0.0 [0.0, 0.0] |
| 10.3 Third‐generation SU | 0 | 0 | Risk Ratio (M‐H, Random, 95% CI) | 0.0 [0.0, 0.0] |
| 11 Retinal photocoagulation Show forest plot | 1 | 3056 | Risk Ratio (M‐H, Random, 95% CI) | 1.03 [0.80, 1.31] |
| 11.1 First‐generation SU | 1 | 1530 | Risk Ratio (M‐H, Random, 95% CI) | 1.12 [0.80, 1.57] |
| 11.2 Second‐generation SU | 1 | 1526 | Risk Ratio (M‐H, Random, 95% CI) | 0.93 [0.65, 1.32] |
| 11.3 Third‐generation SU | 0 | 0 | Risk Ratio (M‐H, Random, 95% CI) | 0.0 [0.0, 0.0] |
| 12 Change in fasting blood glucose from baseline (mmol/L) Show forest plot | 5 | 2423 | Mean Difference (IV, Random, 95% CI) | 0.12 [‐0.37, 0.61] |
| 12.1 First‐generation SU | 1 | 1122 | Mean Difference (IV, Random, 95% CI) | ‐0.40 [‐0.69, ‐0.11] |
| 12.2 Second‐generation SU | 5 | 1301 | Mean Difference (IV, Random, 95% CI) | 0.29 [‐0.02, 0.61] |
| 12.3 Third‐generation SU | 0 | 0 | Mean Difference (IV, Random, 95% CI) | 0.0 [0.0, 0.0] |
| 13 Change in HbA1c from baseline (%) Show forest plot | 6 | 2566 | Mean Difference (IV, Random, 95% CI) | ‐0.09 [‐0.20, 0.03] |
| 13.1 First‐generation SU | 1 | 1122 | Mean Difference (IV, Random, 95% CI) | ‐0.20 [‐0.38, ‐0.02] |
| 13.2 Second‐generation SU | 6 | 1444 | Mean Difference (IV, Random, 95% CI) | ‐0.03 [‐0.17, 0.10] |
| 13.3 Third‐generation SU | 0 | 0 | Mean Difference (IV, Random, 95% CI) | 0.0 [0.0, 0.0] |
| 14 Change in BMI from baseline (kg/m2) Show forest plot | 1 | 34 | Mean Difference (IV, Random, 95% CI) | ‐1.70 [‐4.10, 0.70] |
| 14.1 First‐generation SU | 0 | 0 | Mean Difference (IV, Random, 95% CI) | 0.0 [0.0, 0.0] |
| 14.2 Second‐generation SU | 1 | 34 | Mean Difference (IV, Random, 95% CI) | ‐1.70 [‐4.10, 0.70] |
| 14.3 Third‐generation SU | 0 | 0 | Mean Difference (IV, Random, 95% CI) | 0.0 [0.0, 0.0] |
| 15 Change in weight from baseline (kg) Show forest plot | 5 | 2514 | Mean Difference (IV, Random, 95% CI) | 1.00 [‐2.82, 0.83] |
| 15.1 First‐generation SU | 1 | 1122 | Mean Difference (IV, Random, 95% CI) | ‐2.30 [‐4.11, ‐0.49] |
| 15.2 Second‐generation SU | 5 | 1392 | Mean Difference (IV, Random, 95% CI) | ‐0.37 [‐2.39, 1.65] |
| 15.3 Third‐generation SU | 0 | 0 | Mean Difference (IV, Random, 95% CI) | 0.0 [0.0, 0.0] |
| 16 Adverse events Show forest plot | 1 | 143 | Risk Ratio (M‐H, Random, 95% CI) | 1.06 [0.68, 1.65] |
| 16.1 First‐generation SU | 0 | 0 | Risk Ratio (M‐H, Random, 95% CI) | 0.0 [0.0, 0.0] |
| 16.2 Second‐generation SU | 1 | 143 | Risk Ratio (M‐H, Random, 95% CI) | 1.06 [0.68, 1.65] |
| 16.3 Third‐generation SU | 0 | 0 | Risk Ratio (M‐H, Random, 95% CI) | 0.0 [0.0, 0.0] |
| 17 Drop‐outs due to adverse events Show forest plot | 2 | 192 | Risk Ratio (M‐H, Random, 95% CI) | 3.54 [0.43, 29.43] |
| 17.1 First‐generation SU | 0 | 0 | Risk Ratio (M‐H, Random, 95% CI) | 0.0 [0.0, 0.0] |
| 17.2 Second‐generation SU | 2 | 192 | Risk Ratio (M‐H, Random, 95% CI) | 3.54 [0.43, 29.43] |
| 17.3 Third‐generation SU | 0 | 0 | Risk Ratio (M‐H, Random, 95% CI) | 0.0 [0.0, 0.0] |
| 18 Mild hypoglycaemia Show forest plot | 2 | 3105 | Risk Ratio (M‐H, Random, 95% CI) | 0.94 [0.45, 1.95] |
| 18.1 First‐generation SU | 1 | 1530 | Risk Ratio (M‐H, Random, 95% CI) | 0.57 [0.42, 0.78] |
| 18.2 Second‐generation SU | 2 | 1575 | Risk Ratio (M‐H, Random, 95% CI) | 1.41 [1.13, 1.76] |
| 18.3 Third‐generation SU | 0 | 0 | Risk Ratio (M‐H, Random, 95% CI) | 0.0 [0.0, 0.0] |
| 19 Severe hypoglycaemia Show forest plot | 4 | 3172 | Risk Ratio (M‐H, Random, 95% CI) | 1.27 [0.38, 4.24] |
| 19.1 First‐generation SU | 1 | 1530 | Risk Ratio (M‐H, Random, 95% CI) | 0.59 [0.11, 3.02] |
| 19.2 Second‐generation SU | 4 | 1642 | Risk Ratio (M‐H, Random, 95% CI) | 2.07 [0.66, 6.50] |
| 19.3 Third‐generation SU | 0 | 0 | Risk Ratio (M‐H, Random, 95% CI) | 0.0 [0.0, 0.0] |
| 20 Cancer Show forest plot | 3 | 3519 | Risk Ratio (M‐H, Random, 95% CI) | 1.01 [0.75, 1.36] |
| 20.1 First‐generation SU | 2 | 1944 | Risk Ratio (M‐H, Random, 95% CI) | 0.81 [0.29, 2.27] |
| 20.2 Second‐generation SU | 2 | 1575 | Risk Ratio (M‐H, Random, 95% CI) | 0.95 [0.61, 1.49] |
| 20.3 Third‐generation SU | 0 | 0 | Risk Ratio (M‐H, Random, 95% CI) | 0.0 [0.0, 0.0] |
| 21 Intervention failure Show forest plot | 4 | 3200 | Risk Ratio (M‐H, Random, 95% CI) | 1.24 [0.67, 2.27] |
| 21.1 First‐generation SU | 1 | 1530 | Risk Ratio (M‐H, Random, 95% CI) | 0.62 [0.44, 0.89] |
| 21.2 Second‐generation SU | 4 | 1670 | Risk Ratio (M‐H, Random, 95% CI) | 1.96 [0.80, 4.76] |
| 21.3 Third‐generation SU | 0 | 0 | Risk Ratio (M‐H, Random, 95% CI) | 0.0 [0.0, 0.0] |
| Outcome or subgroup title | No. of studies | No. of participants | Statistical method | Effect size |
| 1 All‐cause mortality Show forest plot | 6 | 714 | Risk Ratio (M‐H, Random, 95% CI) | 2.25 [0.43, 11.84] |
| 1.1 First‐generation SU | 2 | 246 | Risk Ratio (M‐H, Random, 95% CI) | 3.16 [0.13, 76.44] |
| 1.2 Second‐generation SU | 4 | 468 | Risk Ratio (M‐H, Random, 95% CI) | 1.98 [0.28, 13.86] |
| 1.3 Third‐generation SU | 0 | 0 | Risk Ratio (M‐H, Random, 95% CI) | 0.0 [0.0, 0.0] |
| 2 All‐cause mortality; best‐worst case scenario Show forest plot | 2 | 90 | Risk Ratio (M‐H, Random, 95% CI) | 0.0 [0.0, 0.0] |
| 2.1 First‐generation SU | 0 | 0 | Risk Ratio (M‐H, Random, 95% CI) | 0.0 [0.0, 0.0] |
| 2.2 Second‐generation SU | 2 | 90 | Risk Ratio (M‐H, Random, 95% CI) | 0.0 [0.0, 0.0] |
| 2.3 Third‐generation SU | 0 | 0 | Risk Ratio (M‐H, Random, 95% CI) | 0.0 [0.0, 0.0] |
| 3 All‐cause mortality; worst‐best case scenario Show forest plot | 2 | 90 | Risk Ratio (M‐H, Random, 95% CI) | 0.0 [0.0, 0.0] |
| 3.1 First‐generation SU | 0 | 0 | Risk Ratio (M‐H, Random, 95% CI) | 0.0 [0.0, 0.0] |
| 3.2 Second‐generation SU | 2 | 90 | Risk Ratio (M‐H, Random, 95% CI) | 0.0 [0.0, 0.0] |
| 3.3 Third‐generation SU | 0 | 0 | Risk Ratio (M‐H, Random, 95% CI) | 0.0 [0.0, 0.0] |
| 4 Cardiovascular mortality Show forest plot | 6 | 708 | Risk Ratio (M‐H, Random, 95% CI) | 2.39 [0.30, 19.28] |
| 4.1 First‐generation SU | 2 | 242 | Risk Ratio (M‐H, Random, 95% CI) | 3.0 [0.12, 72.44] |
| 4.2 Second‐generation SU | 4 | 466 | Risk Ratio (M‐H, Random, 95% CI) | 2.02 [0.13, 31.96] |
| 4.3 Third‐generation SU | 0 | 0 | Risk Ratio (M‐H, Random, 95% CI) | 0.0 [0.0, 0.0] |
| 5 Non‐fatal macrovascular outcomes Show forest plot | 2 | 345 | Risk Ratio (M‐H, Random, 95% CI) | 1.61 [1.06, 2.44] |
| 5.1 First‐generation SU | 0 | 0 | Risk Ratio (M‐H, Random, 95% CI) | 0.0 [0.0, 0.0] |
| 5.2 Second‐generation SU | 2 | 345 | Risk Ratio (M‐H, Random, 95% CI) | 1.61 [1.06, 2.44] |
| 5.3 Third‐generation SU | 0 | 0 | Risk Ratio (M‐H, Random, 95% CI) | 0.0 [0.0, 0.0] |
| 6 Non‐fatal myocardial infarction Show forest plot | 2 | 133 | Risk Ratio (M‐H, Random, 95% CI) | 0.96 [0.06, 14.92] |
| 6.1 First‐generation SU | 1 | 98 | Risk Ratio (M‐H, Random, 95% CI) | 0.96 [0.06, 14.92] |
| 6.2 Second‐generation SU | 1 | 35 | Risk Ratio (M‐H, Random, 95% CI) | 0.0 [0.0, 0.0] |
| 6.3 Third‐generation SU | 0 | 0 | Risk Ratio (M‐H, Random, 95% CI) | 0.0 [0.0, 0.0] |
| 7 Non‐fatal stroke Show forest plot | 1 | 35 | Risk Ratio (M‐H, Random, 95% CI) | 0.0 [0.0, 0.0] |
| 7.1 First‐generation SU | 0 | 0 | Risk Ratio (M‐H, Random, 95% CI) | 0.0 [0.0, 0.0] |
| 7.2 Second‐generation SU | 1 | 35 | Risk Ratio (M‐H, Random, 95% CI) | 0.0 [0.0, 0.0] |
| 7.3 Third‐generation SU | 0 | 0 | Risk Ratio (M‐H, Random, 95% CI) | 0.0 [0.0, 0.0] |
| 8 Amputation of lower extremity Show forest plot | 1 | 35 | Risk Ratio (M‐H, Random, 95% CI) | 0.0 [0.0, 0.0] |
| 8.1 First‐generation SU | 0 | 0 | Risk Ratio (M‐H, Random, 95% CI) | 0.0 [0.0, 0.0] |
| 8.2 Second‐generation SU | 1 | 35 | Risk Ratio (M‐H, Random, 95% CI) | 0.0 [0.0, 0.0] |
| 8.3 Third‐generation SU | 0 | 0 | Risk Ratio (M‐H, Random, 95% CI) | 0.0 [0.0, 0.0] |
| 9 Cardial revascularisation Show forest plot | 1 | 35 | Risk Ratio (M‐H, Random, 95% CI) | 0.0 [0.0, 0.0] |
| 9.1 First‐generation SU | 0 | 0 | Risk Ratio (M‐H, Random, 95% CI) | 0.0 [0.0, 0.0] |
| 9.2 Second‐generation SU | 1 | 35 | Risk Ratio (M‐H, Random, 95% CI) | 0.0 [0.0, 0.0] |
| 9.3 Third‐generation SU | 0 | 0 | Risk Ratio (M‐H, Random, 95% CI) | 0.0 [0.0, 0.0] |
| 10 Peripheral revascularisation Show forest plot | 1 | 35 | Risk Ratio (M‐H, Random, 95% CI) | 0.0 [0.0, 0.0] |
| 10.1 First‐generation SU | 0 | 0 | Risk Ratio (M‐H, Random, 95% CI) | 0.0 [0.0, 0.0] |
| 10.2 Second‐generation SU | 1 | 35 | Risk Ratio (M‐H, Random, 95% CI) | 0.0 [0.0, 0.0] |
| 10.3 Third‐generation SU | 0 | 0 | Risk Ratio (M‐H, Random, 95% CI) | 0.0 [0.0, 0.0] |
| 11 Microvascular outcomes Show forest plot | 1 | 35 | Risk Ratio (M‐H, Random, 95% CI) | 0.0 [0.0, 0.0] |
| 11.1 First‐generation SU | 0 | 0 | Risk Ratio (M‐H, Random, 95% CI) | 0.0 [0.0, 0.0] |
| 11.2 Second‐generation SU | 1 | 35 | Risk Ratio (M‐H, Random, 95% CI) | 0.0 [0.0, 0.0] |
| 11.3 Third‐generation SU | 0 | 0 | Risk Ratio (M‐H, Random, 95% CI) | 0.0 [0.0, 0.0] |
| 12 Nephropathy Show forest plot | 1 | 35 | Risk Ratio (M‐H, Random, 95% CI) | 0.0 [0.0, 0.0] |
| 12.1 First‐generation SU | 0 | 0 | Risk Ratio (M‐H, Random, 95% CI) | 0.0 [0.0, 0.0] |
| 12.2 Second‐generation SU | 1 | 35 | Risk Ratio (M‐H, Random, 95% CI) | 0.0 [0.0, 0.0] |
| 12.3 Third‐generation SU | 0 | 0 | Risk Ratio (M‐H, Random, 95% CI) | 0.0 [0.0, 0.0] |
| 13 Retinopathy Show forest plot | 1 | 35 | Risk Ratio (M‐H, Random, 95% CI) | 0.0 [0.0, 0.0] |
| 13.1 First‐generation SU | 0 | 0 | Risk Ratio (M‐H, Random, 95% CI) | 0.0 [0.0, 0.0] |
| 13.2 Second‐generation SU | 1 | 35 | Risk Ratio (M‐H, Random, 95% CI) | 0.0 [0.0, 0.0] |
| 13.3 Third‐generation SU | 0 | 0 | Risk Ratio (M‐H, Random, 95% CI) | 0.0 [0.0, 0.0] |
| 14 Retinal photocoagulation Show forest plot | 1 | 35 | Risk Ratio (M‐H, Random, 95% CI) | 0.0 [0.0, 0.0] |
| 14.1 First‐generation SU | 0 | 0 | Risk Ratio (M‐H, Random, 95% CI) | 0.0 [0.0, 0.0] |
| 14.2 Second‐generation SU | 1 | 35 | Risk Ratio (M‐H, Random, 95% CI) | 0.0 [0.0, 0.0] |
| 14.3 Third‐generation SU | 0 | 0 | Risk Ratio (M‐H, Random, 95% CI) | 0.0 [0.0, 0.0] |
| 15 Change in fasting blood glucose from baseline (mmol/L) Show forest plot | 11 | 915 | Mean Difference (IV, Random, 95% CI) | ‐0.46 [‐0.80, ‐0.11] |
| 15.1 First‐generation SU | 2 | 208 | Mean Difference (IV, Random, 95% CI) | ‐1.16 [‐1.92, ‐0.41] |
| 15.2 Second‐generation SU | 8 | 488 | Mean Difference (IV, Random, 95% CI) | ‐0.16 [‐0.42, 0.11] |
| 15.3 Third‐generation SU | 1 | 219 | Mean Difference (IV, Random, 95% CI) | ‐1.20 [‐1.92, ‐0.48] |
| 16 Change in HbA1c from baseline (%) Show forest plot | 13 | 968 | Mean Difference (IV, Random, 95% CI) | ‐0.20 [‐0.46, 0.06] |
| 16.1 First‐generation SU | 2 | 208 | Mean Difference (IV, Random, 95% CI) | ‐0.50 [‐0.79, ‐0.20] |
| 16.2 Second‐generation SU | 10 | 541 | Mean Difference (IV, Random, 95% CI) | ‐0.06 [‐0.36, 0.24] |
| 16.3 Third‐generation SU | 1 | 219 | Mean Difference (IV, Random, 95% CI) | ‐0.7 [‐1.28, ‐0.12] |
| 17 Change in BMI from baseline (kg/m2) Show forest plot | 5 | 232 | Mean Difference (IV, Random, 95% CI) | ‐0.02 [‐0.20, 0.16] |
| 17.1 First‐generation SU | 0 | 0 | Mean Difference (IV, Random, 95% CI) | 0.0 [0.0, 0.0] |
| 17.2 Second‐generation SU | 5 | 232 | Mean Difference (IV, Random, 95% CI) | ‐0.02 [‐0.20, 0.16] |
| 17.3 Third‐generation SU | 0 | 0 | Mean Difference (IV, Random, 95% CI) | 0.0 [0.0, 0.0] |
| 18 Change in weight from baseline (kg) Show forest plot | 7 | 689 | Mean Difference (IV, Random, 95% CI) | 0.81 [‐0.61, 2.23] |
| 18.1 First‐generation SU | 1 | 132 | Mean Difference (IV, Random, 95% CI) | 3.2 [2.29, 4.11] |
| 18.2 Second‐generation SU | 5 | 338 | Mean Difference (IV, Random, 95% CI) | ‐0.22 [‐0.47, 0.03] |
| 18.3 Third‐generation SU | 1 | 219 | Mean Difference (IV, Random, 95% CI) | 1.5 [0.28, 2.72] |
| 19 Adverse events Show forest plot | 11 | 1111 | Risk Ratio (M‐H, Random, 95% CI) | 0.65 [0.51, 0.82] |
| 19.1 First‐generation SU | 2 | 246 | Risk Ratio (M‐H, Random, 95% CI) | 0.63 [0.52, 0.76] |
| 19.2 Second‐generation SU | 8 | 646 | Risk Ratio (M‐H, Random, 95% CI) | 0.64 [0.39, 1.03] |
| 19.3 Third‐generation SU | 1 | 219 | Risk Ratio (M‐H, Random, 95% CI) | 0.64 [0.53, 0.78] |
| 20 Serious adverse events Show forest plot | 3 | 229 | Risk Ratio (M‐H, Random, 95% CI) | 0.52 [0.09, 3.03] |
| 20.1 First‐generation SU | 1 | 98 | Risk Ratio (M‐H, Random, 95% CI) | 0.96 [0.14, 6.55] |
| 20.2 Second‐generation SU | 2 | 131 | Risk Ratio (M‐H, Random, 95% CI) | 0.15 [0.01, 2.81] |
| 20.3 Third‐generation SU | 0 | 0 | Risk Ratio (M‐H, Random, 95% CI) | 0.0 [0.0, 0.0] |
| 21 Drop‐outs due to adverse events Show forest plot | 12 | 1335 | Risk Ratio (M‐H, Random, 95% CI) | 0.37 [0.22, 0.63] |
| 21.1 First‐generation SU | 2 | 246 | Risk Ratio (M‐H, Random, 95% CI) | 0.28 [0.12, 0.67] |
| 21.2 Second‐generation SU | 9 | 870 | Risk Ratio (M‐H, Random, 95% CI) | 0.48 [0.24, 0.96] |
| 21.3 Third‐generation SU | 1 | 219 | Risk Ratio (M‐H, Random, 95% CI) | 0.19 [0.02, 1.64] |
| 22 Mild hypoglycaemia Show forest plot | 6 | 636 | Risk Ratio (M‐H, Random, 95% CI) | 8.59 [2.62, 28.12] |
| 22.1 First‐generation SU | 1 | 98 | Risk Ratio (M‐H, Random, 95% CI) | 2.88 [0.12, 69.07] |
| 22.2 Second‐generation SU | 4 | 319 | Risk Ratio (M‐H, Random, 95% CI) | 12.63 [0.73, 219.86] |
| 22.3 Third‐generation SU | 1 | 219 | Risk Ratio (M‐H, Random, 95% CI) | 9.73 [2.33, 40.63] |
| 23 Moderate hypoglycaemia Show forest plot | 3 | 183 | Risk Ratio (M‐H, Random, 95% CI) | 0.0 [0.0, 0.0] |
| 23.1 First‐generation SU | 0 | 0 | Risk Ratio (M‐H, Random, 95% CI) | 0.0 [0.0, 0.0] |
| 23.2 Second‐generation SU | 3 | 183 | Risk Ratio (M‐H, Random, 95% CI) | 0.0 [0.0, 0.0] |
| 23.3 Third‐generation SU | 0 | 0 | Risk Ratio (M‐H, Random, 95% CI) | 0.0 [0.0, 0.0] |
| 24 Severe hypoglycaemia Show forest plot | 5 | 500 | Risk Ratio (M‐H, Random, 95% CI) | 0.0 [0.0, 0.0] |
| 24.1 First‐generation SU | 1 | 98 | Risk Ratio (M‐H, Random, 95% CI) | 0.0 [0.0, 0.0] |
| 24.2 Second‐generation SU | 3 | 183 | Risk Ratio (M‐H, Random, 95% CI) | 0.0 [0.0, 0.0] |
| 24.3 Third‐generation SU | 1 | 219 | Risk Ratio (M‐H, Random, 95% CI) | 0.0 [0.0, 0.0] |
| 25 Cancer Show forest plot | 3 | 443 | Risk Ratio (M‐H, Random, 95% CI) | 0.90 [0.11, 7.27] |
| 25.1 First‐generation SU | 1 | 98 | Risk Ratio (M‐H, Random, 95% CI) | 0.32 [0.01, 7.67] |
| 25.2 Second‐generation SU | 2 | 345 | Risk Ratio (M‐H, Random, 95% CI) | 1.98 [0.13, 31.35] |
| 25.3 Third‐generation SU | 0 | 0 | Risk Ratio (M‐H, Random, 95% CI) | 0.0 [0.0, 0.0] |
| 26 Intervention failure Show forest plot | 5 | 831 | Risk Ratio (M‐H, Random, 95% CI) | 0.32 [0.18, 0.57] |
| 26.1 First‐generation SU | 1 | 98 | Risk Ratio (M‐H, Random, 95% CI) | 0.32 [0.01, 7.67] |
| 26.2 Second‐generation SU | 3 | 514 | Risk Ratio (M‐H, Random, 95% CI) | 0.25 [0.07, 0.92] |
| 26.3 Third‐generation SU | 1 | 219 | Risk Ratio (M‐H, Random, 95% CI) | 0.34 [0.17, 0.65] |
| Outcome or subgroup title | No. of studies | No. of participants | Statistical method | Effect size |
| 1 All‐cause mortality Show forest plot | 3 | 2249 | Risk Ratio (M‐H, Random, 95% CI) | 1.57 [0.62, 4.00] |
| 1.1 First‐generation SU | 0 | 0 | Risk Ratio (M‐H, Random, 95% CI) | 0.0 [0.0, 0.0] |
| 1.2 Second‐generation SU | 2 | 1503 | Risk Ratio (M‐H, Random, 95% CI) | 1.39 [0.52, 3.68] |
| 1.3 Third‐generation SU | 1 | 746 | Risk Ratio (M‐H, Random, 95% CI) | 6.01 [0.25, 147.05] |
| 2 All‐cause mortality; best‐worst case scenario Show forest plot | 1 | 1092 | Risk Ratio (M‐H, Random, 95% CI) | 0.39 [0.18, 0.84] |
| 2.1 First‐generation SU | 0 | 0 | Risk Ratio (M‐H, Random, 95% CI) | 0.0 [0.0, 0.0] |
| 2.2 Second‐generation SU | 1 | 1092 | Risk Ratio (M‐H, Random, 95% CI) | 0.39 [0.18, 0.84] |
| 2.3 Third‐generation SU | 0 | 0 | Risk Ratio (M‐H, Random, 95% CI) | 0.0 [0.0, 0.0] |
| 3 All‐cause mortality; worst‐best case scenario Show forest plot | 1 | 1092 | Risk Ratio (M‐H, Random, 95% CI) | 3.67 [1.50, 8.97] |
| 3.1 First‐generation SU | 0 | 0 | Risk Ratio (M‐H, Random, 95% CI) | 0.0 [0.0, 0.0] |
| 3.2 Second‐generation SU | 1 | 1092 | Risk Ratio (M‐H, Random, 95% CI) | 3.67 [1.50, 8.97] |
| 3.3 Third‐generation SU | 0 | 0 | Risk Ratio (M‐H, Random, 95% CI) | 0.0 [0.0, 0.0] |
| 4 Cardiovascular mortality Show forest plot | 2 | 1157 | Risk Ratio (M‐H, Random, 95% CI) | 6.01 [0.25, 147.05] |
| 4.1 First‐generation SU | 0 | 0 | Risk Ratio (M‐H, Random, 95% CI) | 0.0 [0.0, 0.0] |
| 4.2 Second‐generation SU | 1 | 411 | Risk Ratio (M‐H, Random, 95% CI) | 0.0 [0.0, 0.0] |
| 4.3 Third‐generation SU | 1 | 746 | Risk Ratio (M‐H, Random, 95% CI) | 6.01 [0.25, 147.05] |
| 5 Non‐fatal macrovascular outcomes Show forest plot | 1 | 411 | Risk Ratio (M‐H, Random, 95% CI) | 1.61 [0.82, 3.17] |
| 5.1 First‐generation SU | 0 | 0 | Risk Ratio (M‐H, Random, 95% CI) | 0.0 [0.0, 0.0] |
| 5.2 Second‐generation SU | 1 | 411 | Risk Ratio (M‐H, Random, 95% CI) | 1.61 [0.82, 3.17] |
| 5.3 Third‐generation SU | 0 | 0 | Risk Ratio (M‐H, Random, 95% CI) | 0.0 [0.0, 0.0] |
| 6 Non‐fatal myocardial infarction Show forest plot | 2 | 1157 | Risk Ratio (M‐H, Random, 95% CI) | 0.66 [0.10, 4.19] |
| 6.1 First‐generation SU | 0 | 0 | Risk Ratio (M‐H, Random, 95% CI) | 0.0 [0.0, 0.0] |
| 6.2 Second‐generation SU | 1 | 411 | Risk Ratio (M‐H, Random, 95% CI) | 0.65 [0.03, 15.85] |
| 6.3 Third‐generation SU | 1 | 746 | Risk Ratio (M‐H, Random, 95% CI) | 0.67 [0.07, 6.40] |
| 7 Non‐fatal stroke Show forest plot | 1 | 411 | Risk Ratio (M‐H, Random, 95% CI) | 3.91 [0.36, 42.79] |
| 7.1 First‐generation SU | 0 | 0 | Risk Ratio (M‐H, Random, 95% CI) | 0.0 [0.0, 0.0] |
| 7.2 Second‐generation SU | 1 | 411 | Risk Ratio (M‐H, Random, 95% CI) | 3.91 [0.36, 42.79] |
| 7.3 Third‐generation SU | 0 | 0 | Risk Ratio (M‐H, Random, 95% CI) | 0.0 [0.0, 0.0] |
| 8 Amputation of lower extremity Show forest plot | 1 | 411 | Risk Ratio (M‐H, Random, 95% CI) | 0.0 [0.0, 0.0] |
| 8.1 First‐generation SU | 0 | 0 | Risk Ratio (M‐H, Random, 95% CI) | 0.0 [0.0, 0.0] |
| 8.2 Second‐generation SU | 1 | 411 | Risk Ratio (M‐H, Random, 95% CI) | 0.0 [0.0, 0.0] |
| 8.3 Third‐generation SU | 0 | 0 | Risk Ratio (M‐H, Random, 95% CI) | 0.0 [0.0, 0.0] |
| 9 Cardial revascularisation Show forest plot | 1 | 411 | Risk Ratio (M‐H, Random, 95% CI) | 0.0 [0.0, 0.0] |
| 9.1 First‐generation SU | 0 | 0 | Risk Ratio (M‐H, Random, 95% CI) | 0.0 [0.0, 0.0] |
| 9.2 Second‐generation SU | 1 | 411 | Risk Ratio (M‐H, Random, 95% CI) | 0.0 [0.0, 0.0] |
| 9.3 Third‐generation SU | 0 | 0 | Risk Ratio (M‐H, Random, 95% CI) | 0.0 [0.0, 0.0] |
| 10 Peripheral revascularisation Show forest plot | 1 | 411 | Risk Ratio (M‐H, Random, 95% CI) | 0.0 [0.0, 0.0] |
| 10.1 First‐generation SU | 0 | 0 | Risk Ratio (M‐H, Random, 95% CI) | 0.0 [0.0, 0.0] |
| 10.2 Second‐generation SU | 1 | 411 | Risk Ratio (M‐H, Random, 95% CI) | 0.0 [0.0, 0.0] |
| 10.3 Third‐generation SU | 0 | 0 | Risk Ratio (M‐H, Random, 95% CI) | 0.0 [0.0, 0.0] |
| 11 Microvascular outcomes Show forest plot | 1 | 411 | Risk Ratio (M‐H, Random, 95% CI) | 1.09 [0.52, 2.29] |
| 11.1 First‐generation SU | 0 | 0 | Risk Ratio (M‐H, Random, 95% CI) | 0.0 [0.0, 0.0] |
| 11.2 Second‐generation SU | 1 | 411 | Risk Ratio (M‐H, Random, 95% CI) | 1.09 [0.52, 2.29] |
| 11.3 Third‐generation SU | 0 | 0 | Risk Ratio (M‐H, Random, 95% CI) | 0.0 [0.0, 0.0] |
| 12 Nephropathy Show forest plot | 1 | 411 | Risk Ratio (M‐H, Random, 95% CI) | 0.98 [0.09, 10.70] |
| 12.1 First‐generation SU | 0 | 0 | Risk Ratio (M‐H, Random, 95% CI) | 0.0 [0.0, 0.0] |
| 12.2 Second‐generation SU | 1 | 411 | Risk Ratio (M‐H, Random, 95% CI) | 0.98 [0.09, 10.70] |
| 12.3 Third‐generation SU | 0 | 0 | Risk Ratio (M‐H, Random, 95% CI) | 0.0 [0.0, 0.0] |
| 13 Retinopathy Show forest plot | 1 | 411 | Risk Ratio (M‐H, Random, 95% CI) | 1.10 [0.50, 2.43] |
| 13.1 First‐generation SU | 0 | 0 | Risk Ratio (M‐H, Random, 95% CI) | 0.0 [0.0, 0.0] |
| 13.2 Second‐generation SU | 1 | 411 | Risk Ratio (M‐H, Random, 95% CI) | 1.10 [0.50, 2.43] |
| 13.3 Third‐generation SU | 0 | 0 | Risk Ratio (M‐H, Random, 95% CI) | 0.0 [0.0, 0.0] |
| 14 Retinal photocoagulation Show forest plot | 1 | 411 | Risk Ratio (M‐H, Random, 95% CI) | 0.0 [0.0, 0.0] |
| 14.1 First‐generation SU | 0 | 0 | Risk Ratio (M‐H, Random, 95% CI) | 0.0 [0.0, 0.0] |
| 14.2 Second‐generation SU | 1 | 411 | Risk Ratio (M‐H, Random, 95% CI) | 0.0 [0.0, 0.0] |
| 14.3 Third‐generation SU | 0 | 0 | Risk Ratio (M‐H, Random, 95% CI) | 0.0 [0.0, 0.0] |
| 15 Change in fasting blood glucose from baseline (mmol/L) Show forest plot | 3 | 1948 | Mean Difference (IV, Random, 95% CI) | 0.34 [‐0.44, 1.13] |
| 15.1 First‐generation SU | 0 | 0 | Mean Difference (IV, Random, 95% CI) | 0.0 [0.0, 0.0] |
| 15.2 Second‐generation SU | 2 | 1202 | Mean Difference (IV, Random, 95% CI) | 0.11 [‐1.07, 1.28] |
| 15.3 Third‐generation SU | 1 | 746 | Mean Difference (IV, Random, 95% CI) | 0.8 [0.34, 1.26] |
| 16 Change in HbA1c from baseline (%) Show forest plot | 3 | 1950 | Mean Difference (IV, Random, 95% CI) | 0.35 [0.05, 0.64] |
| 16.1 First‐generation SU | 0 | 0 | Mean Difference (IV, Random, 95% CI) | 0.0 [0.0, 0.0] |
| 16.2 Second‐generation SU | 2 | 1204 | Mean Difference (IV, Random, 95% CI) | 0.26 [‐0.23, 0.75] |
| 16.3 Third‐generation SU | 1 | 746 | Mean Difference (IV, Random, 95% CI) | 0.5 [0.32, 0.68] |
| 17 Change in BMI from baseline (kg/m2) Show forest plot | 1 | 400 | Mean Difference (IV, Random, 95% CI) | 0.7 [0.52, 0.88] |
| 17.1 First‐generation SU | 0 | 0 | Mean Difference (IV, Random, 95% CI) | 0.0 [0.0, 0.0] |
| 17.2 Second‐generation SU | 1 | 400 | Mean Difference (IV, Random, 95% CI) | 0.7 [0.52, 0.88] |
| 17.3 Third‐generation SU | 0 | 0 | Mean Difference (IV, Random, 95% CI) | 0.0 [0.0, 0.0] |
| 18 Change in weight from baseline (kg) Show forest plot | 3 | 1952 | Mean Difference (IV, Random, 95% CI) | 1.96 [0.63, 3.28] |
| 18.1 First‐generation SU | 0 | 0 | Mean Difference (IV, Random, 95% CI) | 0.0 [0.0, 0.0] |
| 18.2 Second‐generation SU | 2 | 1206 | Mean Difference (IV, Random, 95% CI) | 1.31 [0.33, 2.29] |
| 18.3 Third‐generation SU | 1 | 746 | Mean Difference (IV, Random, 95% CI) | 3.30 [2.64, 3.96] |
| 19 Adverse events Show forest plot | 2 | 1157 | Risk Ratio (M‐H, Random, 95% CI) | 0.89 [0.74, 1.08] |
| 19.1 First‐generation SU | 0 | 0 | Risk Ratio (M‐H, Random, 95% CI) | 0.0 [0.0, 0.0] |
| 19.2 Second‐generation SU | 1 | 411 | Risk Ratio (M‐H, Random, 95% CI) | 0.97 [0.90, 1.04] |
| 19.3 Third‐generation SU | 1 | 746 | Risk Ratio (M‐H, Random, 95% CI) | 0.82 [0.73, 0.92] |
| 20 Serious adverse events Show forest plot | 2 | 1157 | Risk Ratio (M‐H, Random, 95% CI) | 1.22 [0.77, 1.94] |
| 20.1 First‐generation SU | 0 | 0 | Risk Ratio (M‐H, Random, 95% CI) | 0.0 [0.0, 0.0] |
| 20.2 Second‐generation SU | 1 | 411 | Risk Ratio (M‐H, Random, 95% CI) | 1.37 [0.71, 2.63] |
| 20.3 Third‐generation SU | 1 | 746 | Risk Ratio (M‐H, Random, 95% CI) | 1.09 [0.56, 2.10] |
| 21 Drop‐outs due to adverse events Show forest plot | 3 | 2249 | Risk Ratio (M‐H, Random, 95% CI) | 0.89 [0.64, 1.24] |
| 21.1 First‐generation SU | 0 | 0 | Risk Ratio (M‐H, Random, 95% CI) | 0.0 [0.0, 0.0] |
| 21.2 Second‐generation SU | 2 | 1503 | Risk Ratio (M‐H, Random, 95% CI) | 1.00 [0.67, 1.50] |
| 21.3 Third‐generation SU | 1 | 746 | Risk Ratio (M‐H, Random, 95% CI) | 0.70 [0.40, 1.24] |
| 22 Mild hypoglycaemia Show forest plot | 3 | 2249 | Risk Ratio (M‐H, Random, 95% CI) | 2.07 [1.44, 2.97] |
| 22.1 First‐generation SU | 0 | 0 | Risk Ratio (M‐H, Random, 95% CI) | 0.0 [0.0, 0.0] |
| 22.2 Second‐generation SU | 2 | 1503 | Risk Ratio (M‐H, Random, 95% CI) | 1.99 [1.02, 3.87] |
| 22.3 Third‐generation SU | 1 | 746 | Risk Ratio (M‐H, Random, 95% CI) | 2.41 [1.71, 3.40] |
| 23 Severe hypoglycaemia Show forest plot | 3 | 2249 | Risk Ratio (M‐H, Random, 95% CI) | 0.0 [0.0, 0.0] |
| 23.1 First‐generation SU | 0 | 0 | Risk Ratio (M‐H, Random, 95% CI) | 0.0 [0.0, 0.0] |
| 23.2 Second‐generation SU | 2 | 1503 | Risk Ratio (M‐H, Random, 95% CI) | 0.0 [0.0, 0.0] |
| 23.3 Third‐generation SU | 1 | 746 | Risk Ratio (M‐H, Random, 95% CI) | 0.0 [0.0, 0.0] |
| 24 Intervention failure Show forest plot | 3 | 2249 | Risk Ratio (M‐H, Random, 95% CI) | 1.31 [0.56, 3.05] |
| 24.1 First‐generation SU | 0 | 0 | Risk Ratio (M‐H, Random, 95% CI) | 0.0 [0.0, 0.0] |
| 24.2 Second‐generation SU | 2 | 1503 | Risk Ratio (M‐H, Random, 95% CI) | 1.00 [0.41, 2.43] |
| 24.3 Third‐generation SU | 1 | 746 | Risk Ratio (M‐H, Random, 95% CI) | 2.09 [1.22, 3.59] |
| Outcome or subgroup title | No. of studies | No. of participants | Statistical method | Effect size |
| 1 All‐cause mortality Show forest plot | 7 | 2038 | Risk Ratio (M‐H, Random, 95% CI) | 1.44 [0.47, 4.42] |
| 1.1 First‐generation SU | 0 | 0 | Risk Ratio (M‐H, Random, 95% CI) | 0.0 [0.0, 0.0] |
| 1.2 Second‐generation SU | 7 | 2038 | Risk Ratio (M‐H, Random, 95% CI) | 1.44 [0.47, 4.42] |
| 1.3 Third‐generation SU | 0 | 0 | Risk Ratio (M‐H, Random, 95% CI) | 0.0 [0.0, 0.0] |
| 2 All‐cause mortality; best‐worst case scenario Show forest plot | 2 | 209 | Risk Ratio (M‐H, Random, 95% CI) | 0.07 [0.00, 1.16] |
| 2.1 First‐generation SU | 0 | 0 | Risk Ratio (M‐H, Random, 95% CI) | 0.0 [0.0, 0.0] |
| 2.2 Second‐generation SU | 2 | 209 | Risk Ratio (M‐H, Random, 95% CI) | 0.07 [0.00, 1.16] |
| 2.3 Third‐generation SU | 0 | 0 | Risk Ratio (M‐H, Random, 95% CI) | 0.0 [0.0, 0.0] |
| 3 All‐cause mortality; worst‐best case scenario Show forest plot | 2 | 209 | Risk Ratio (M‐H, Random, 95% CI) | 15.17 [0.88, 261.61] |
| 3.1 First‐generation SU | 0 | 0 | Risk Ratio (M‐H, Random, 95% CI) | 0.0 [0.0, 0.0] |
| 3.2 Second‐generation SU | 2 | 209 | Risk Ratio (M‐H, Random, 95% CI) | 15.17 [0.88, 261.61] |
| 3.3 Third‐generation SU | 0 | 0 | Risk Ratio (M‐H, Random, 95% CI) | 0.0 [0.0, 0.0] |
| 4 Cardiovascular mortality Show forest plot | 7 | 2038 | Risk Ratio (M‐H, Random, 95% CI) | 0.97 [0.27, 3.53] |
| 4.1 First‐generation SU | 0 | 0 | Risk Ratio (M‐H, Random, 95% CI) | 0.0 [0.0, 0.0] |
| 4.2 Second‐generation SU | 7 | 2038 | Risk Ratio (M‐H, Random, 95% CI) | 0.97 [0.27, 3.53] |
| 4.3 Third‐generation SU | 0 | 0 | Risk Ratio (M‐H, Random, 95% CI) | 0.0 [0.0, 0.0] |
| 5 Non‐fatal macrovascular outcomes Show forest plot | 3 | 866 | Risk Ratio (M‐H, Random, 95% CI) | 0.50 [0.20, 1.20] |
| 5.1 First‐generation SU | 0 | 0 | Risk Ratio (M‐H, Random, 95% CI) | 0.0 [0.0, 0.0] |
| 5.2 Second‐generation SU | 3 | 866 | Risk Ratio (M‐H, Random, 95% CI) | 0.50 [0.20, 1.20] |
| 5.3 Third‐generation SU | 0 | 0 | Risk Ratio (M‐H, Random, 95% CI) | 0.0 [0.0, 0.0] |
| 6 Non‐fatal myocardial infarction Show forest plot | 3 | 726 | Risk Ratio (M‐H, Random, 95% CI) | 1.03 [0.26, 4.08] |
| 6.1 First‐generation SU | 0 | 0 | Risk Ratio (M‐H, Random, 95% CI) | 0.0 [0.0, 0.0] |
| 6.2 Second‐generation SU | 3 | 726 | Risk Ratio (M‐H, Random, 95% CI) | 1.03 [0.26, 4.08] |
| 6.3 Third‐generation SU | 0 | 0 | Risk Ratio (M‐H, Random, 95% CI) | 0.0 [0.0, 0.0] |
| 7 Non‐fatal stroke Show forest plot | 1 | 34 | Risk Ratio (M‐H, Random, 95% CI) | 0.0 [0.0, 0.0] |
| 7.1 First‐generation SU | 0 | 0 | Risk Ratio (M‐H, Random, 95% CI) | 0.0 [0.0, 0.0] |
| 7.2 Second‐generation SU | 1 | 34 | Risk Ratio (M‐H, Random, 95% CI) | 0.0 [0.0, 0.0] |
| 7.3 Third‐generation SU | 0 | 0 | Risk Ratio (M‐H, Random, 95% CI) | 0.0 [0.0, 0.0] |
| 8 Amputation of lower extremity Show forest plot | 1 | 34 | Risk Ratio (M‐H, Random, 95% CI) | 0.0 [0.0, 0.0] |
| 8.1 First‐generation SU | 0 | 0 | Risk Ratio (M‐H, Random, 95% CI) | 0.0 [0.0, 0.0] |
| 8.2 Second‐generation SU | 1 | 34 | Risk Ratio (M‐H, Random, 95% CI) | 0.0 [0.0, 0.0] |
| 8.3 Third‐generation SU | 0 | 0 | Risk Ratio (M‐H, Random, 95% CI) | 0.0 [0.0, 0.0] |
| 9 Cardial revascularisation Show forest plot | 1 | 34 | Risk Ratio (M‐H, Random, 95% CI) | 0.0 [0.0, 0.0] |
| 9.1 First‐generation SU | 0 | 0 | Risk Ratio (M‐H, Random, 95% CI) | 0.0 [0.0, 0.0] |
| 9.2 Second‐generation SU | 1 | 34 | Risk Ratio (M‐H, Random, 95% CI) | 0.0 [0.0, 0.0] |
| 9.3 Third‐generation SU | 0 | 0 | Risk Ratio (M‐H, Random, 95% CI) | 0.0 [0.0, 0.0] |
| 10 Peripheral revascularisation Show forest plot | 1 | 34 | Risk Ratio (M‐H, Random, 95% CI) | 0.0 [0.0, 0.0] |
| 10.1 First‐generation SU | 0 | 0 | Risk Ratio (M‐H, Random, 95% CI) | 0.0 [0.0, 0.0] |
| 10.2 Second‐generation SU | 1 | 34 | Risk Ratio (M‐H, Random, 95% CI) | 0.0 [0.0, 0.0] |
| 10.3 Third‐generation SU | 0 | 0 | Risk Ratio (M‐H, Random, 95% CI) | 0.0 [0.0, 0.0] |
| 11 Microvascular outcomes Show forest plot | 1 | 34 | Risk Ratio (M‐H, Random, 95% CI) | 0.0 [0.0, 0.0] |
| 11.1 First‐generation SU | 0 | 0 | Risk Ratio (M‐H, Random, 95% CI) | 0.0 [0.0, 0.0] |
| 11.2 Second‐generation SU | 1 | 34 | Risk Ratio (M‐H, Random, 95% CI) | 0.0 [0.0, 0.0] |
| 11.3 Third‐generation SU | 0 | 0 | Risk Ratio (M‐H, Random, 95% CI) | 0.0 [0.0, 0.0] |
| 12 Nephropathy Show forest plot | 1 | 34 | Risk Ratio (M‐H, Random, 95% CI) | 0.0 [0.0, 0.0] |
| 12.1 First‐generation SU | 0 | 0 | Risk Ratio (M‐H, Random, 95% CI) | 0.0 [0.0, 0.0] |
| 12.2 Second‐generation SU | 1 | 34 | Risk Ratio (M‐H, Random, 95% CI) | 0.0 [0.0, 0.0] |
| 12.3 Third‐generation SU | 0 | 0 | Risk Ratio (M‐H, Random, 95% CI) | 0.0 [0.0, 0.0] |
| 13 Retinopathy Show forest plot | 1 | 34 | Risk Ratio (M‐H, Random, 95% CI) | 0.0 [0.0, 0.0] |
| 13.1 First‐generation SU | 0 | 0 | Risk Ratio (M‐H, Random, 95% CI) | 0.0 [0.0, 0.0] |
| 13.2 Second‐generation SU | 1 | 34 | Risk Ratio (M‐H, Random, 95% CI) | 0.0 [0.0, 0.0] |
| 13.3 Third‐generation SU | 0 | 0 | Risk Ratio (M‐H, Random, 95% CI) | 0.0 [0.0, 0.0] |
| 14 Retinal photocoagulation Show forest plot | 1 | 34 | Risk Ratio (M‐H, Random, 95% CI) | 0.0 [0.0, 0.0] |
| 14.1 First‐generation SU | 0 | 0 | Risk Ratio (M‐H, Random, 95% CI) | 0.0 [0.0, 0.0] |
| 14.2 Second‐generation SU | 1 | 34 | Risk Ratio (M‐H, Random, 95% CI) | 0.0 [0.0, 0.0] |
| 14.3 Third‐generation SU | 0 | 0 | Risk Ratio (M‐H, Random, 95% CI) | 0.0 [0.0, 0.0] |
| 15 Change in fasting blood glucose from baseline (mmol/L) Show forest plot | 10 | 2329 | Mean Difference (IV, Random, 95% CI) | ‐0.21 [‐0.45, 0.03] |
| 15.1 First‐generation SU | 0 | 0 | Mean Difference (IV, Random, 95% CI) | 0.0 [0.0, 0.0] |
| 15.2 Second‐generation SU | 9 | 2205 | Mean Difference (IV, Random, 95% CI) | ‐0.27 [‐0.51, ‐0.02] |
| 15.3 Third‐generation SU | 1 | 124 | Mean Difference (IV, Random, 95% CI) | 0.20 [‐0.22, 0.62] |
| 16 Change in HbA1c from baseline (%) Show forest plot | 10 | 2345 | Mean Difference (IV, Random, 95% CI) | 0.05 [‐0.09, 0.19] |
| 16.1 First‐generation SU | 0 | 0 | Mean Difference (IV, Random, 95% CI) | 0.0 [0.0, 0.0] |
| 16.2 Second‐generation SU | 9 | 2221 | Mean Difference (IV, Random, 95% CI) | 0.07 [‐0.08, 0.22] |
| 16.3 Third‐generation SU | 1 | 124 | Mean Difference (IV, Random, 95% CI) | ‐0.10 [‐0.40, 0.20] |
| 17 Change in BMI from baseline (kg/m2) Show forest plot | 3 | 333 | Mean Difference (IV, Random, 95% CI) | ‐0.05 [‐0.25, 0.14] |
| 17.1 First‐generation SU | 0 | 0 | Mean Difference (IV, Random, 95% CI) | 0.0 [0.0, 0.0] |
| 17.2 Second‐generation SU | 2 | 209 | Mean Difference (IV, Random, 95% CI) | 0.00 [‐0.19, 0.20] |
| 17.3 Third‐generation SU | 1 | 124 | Mean Difference (IV, Random, 95% CI) | ‐0.30 [‐0.66, 0.06] |
| 18 Change in weight from baseline (kg) Show forest plot | 5 | 1176 | Mean Difference (IV, Random, 95% CI) | 0.05 [‐0.40, 0.51] |
| 18.1 First‐generation SU | 0 | 0 | Mean Difference (IV, Random, 95% CI) | 0.0 [0.0, 0.0] |
| 18.2 Second‐generation SU | 4 | 1052 | Mean Difference (IV, Random, 95% CI) | 0.13 [‐0.50, 0.76] |
| 18.3 Third‐generation SU | 1 | 124 | Mean Difference (IV, Random, 95% CI) | 0.10 [‐1.77, 1.97] |
| 19 Adverse events Show forest plot | 5 | 1829 | Risk Ratio (M‐H, Random, 95% CI) | 1.00 [0.95, 1.06] |
| 19.1 First‐generation SU | 0 | 0 | Risk Ratio (M‐H, Random, 95% CI) | 0.0 [0.0, 0.0] |
| 19.2 Second‐generation SU | 5 | 1829 | Risk Ratio (M‐H, Random, 95% CI) | 1.00 [0.95, 1.06] |
| 19.3 Third‐generation SU | 0 | 0 | Risk Ratio (M‐H, Random, 95% CI) | 0.0 [0.0, 0.0] |
| 20 Drop‐outs due to adverse events Show forest plot | 8 | 2151 | Risk Ratio (M‐H, Random, 95% CI) | 1.03 [0.79, 1.33] |
| 20.1 First‐generation SU | 0 | 0 | Risk Ratio (M‐H, Random, 95% CI) | 0.0 [0.0, 0.0] |
| 20.2 Second‐generation SU | 7 | 2019 | Risk Ratio (M‐H, Random, 95% CI) | 1.01 [0.78, 1.32] |
| 20.3 Third‐generation SU | 1 | 132 | Risk Ratio (M‐H, Random, 95% CI) | 5.0 [0.24, 102.19] |
| 21 Serious adverse events Show forest plot | 5 | 1829 | Risk Ratio (M‐H, Random, 95% CI) | 1.02 [0.74, 1.39] |
| 21.1 First‐generation SU | 0 | 0 | Risk Ratio (M‐H, Random, 95% CI) | 0.0 [0.0, 0.0] |
| 21.2 Second‐generation SU | 5 | 1829 | Risk Ratio (M‐H, Random, 95% CI) | 1.02 [0.74, 1.39] |
| 21.3 Third‐generation SU | 0 | 0 | Risk Ratio (M‐H, Random, 95% CI) | 0.0 [0.0, 0.0] |
| 22 Mild hypoglycaemia Show forest plot | 6 | 1863 | Risk Ratio (M‐H, Random, 95% CI) | 1.20 [0.96, 1.49] |
| 22.1 First‐generation SU | 0 | 0 | Risk Ratio (M‐H, Random, 95% CI) | 0.0 [0.0, 0.0] |
| 22.2 Second‐generation SU | 6 | 1863 | Risk Ratio (M‐H, Random, 95% CI) | 1.20 [0.96, 1.49] |
| 22.3 Third‐generation SU | 0 | 0 | Risk Ratio (M‐H, Random, 95% CI) | 0.0 [0.0, 0.0] |
| 23 Moderate hypoglycaemia Show forest plot | 1 | 34 | Risk Ratio (M‐H, Random, 95% CI) | 0.0 [0.0, 0.0] |
| 23.1 First‐generation SU | 0 | 0 | Risk Ratio (M‐H, Random, 95% CI) | 0.0 [0.0, 0.0] |
| 23.2 Second‐generation SU | 1 | 34 | Risk Ratio (M‐H, Random, 95% CI) | 0.0 [0.0, 0.0] |
| 23.3 Third‐generation SU | 0 | 0 | Risk Ratio (M‐H, Random, 95% CI) | 0.0 [0.0, 0.0] |
| 24 Severe hypoglycaemia Show forest plot | 6 | 1863 | Risk Ratio (M‐H, Fixed, 95% CI) | 2.87 [0.91, 8.99] |
| 24.1 First‐generation SU | 0 | 0 | Risk Ratio (M‐H, Fixed, 95% CI) | 0.0 [0.0, 0.0] |
| 24.2 Second‐generation SU | 6 | 1863 | Risk Ratio (M‐H, Fixed, 95% CI) | 2.87 [0.91, 8.99] |
| 24.3 Third‐generation SU | 0 | 0 | Risk Ratio (M‐H, Fixed, 95% CI) | 0.0 [0.0, 0.0] |
| 25 Cancer Show forest plot | 2 | 290 | Risk Ratio (M‐H, Random, 95% CI) | 6.44 [0.27, 156.37] |
| 25.1 First‐generation SU | 0 | 0 | Risk Ratio (M‐H, Random, 95% CI) | 0.0 [0.0, 0.0] |
| 25.2 Second‐generation SU | 2 | 290 | Risk Ratio (M‐H, Random, 95% CI) | 6.44 [0.27, 156.37] |
| 25.3 Third‐generation SU | 0 | 0 | Risk Ratio (M‐H, Random, 95% CI) | 0.0 [0.0, 0.0] |
| 26 Intervention failure Show forest plot | 5 | 1656 | Risk Ratio (M‐H, Random, 95% CI) | 0.96 [0.69, 1.35] |
| 26.1 First‐generation SU | 0 | 0 | Risk Ratio (M‐H, Random, 95% CI) | 0.0 [0.0, 0.0] |
| 26.2 Second‐generation SU | 4 | 1524 | Risk Ratio (M‐H, Random, 95% CI) | 0.98 [0.69, 1.38] |
| 26.3 Third‐generation SU | 1 | 132 | Risk Ratio (M‐H, Random, 95% CI) | 0.67 [0.12, 3.86] |
| Outcome or subgroup title | No. of studies | No. of participants | Statistical method | Effect size |
| 1 All‐cause mortality Show forest plot | 1 | 1234 | Risk Ratio (M‐H, Random, 95% CI) | 0.90 [0.72, 1.11] |
| 2 Cardiovascular mortality Show forest plot | 1 | 1234 | Risk Ratio (M‐H, Random, 95% CI) | 0.98 [0.72, 1.34] |
| 3 Non‐fatal myocardial infarction Show forest plot | 1 | 1234 | Risk Ratio (M‐H, Random, 95% CI) | 0.80 [0.55, 1.16] |
| 4 Non‐fatal stroke Show forest plot | 1 | 1234 | Risk Ratio (M‐H, Random, 95% CI) | 1.32 [0.80, 2.17] |
| 5 Amputation of lower extremity Show forest plot | 1 | 1234 | Risk Ratio (M‐H, Random, 95% CI) | 1.01 [0.29, 3.46] |
| 6 Microvascular outcomes Show forest plot | 1 | 1234 | Odds Ratio (M‐H, Random, 95% CI) | 0.70 [0.48, 1.03] |
| 7 Retinal photocoagulation Show forest plot | 1 | 1234 | Risk Ratio (M‐H, Random, 95% CI) | 0.82 [0.56, 1.20] |
| 8 Change in fasting blood glucose from baseline (mmol/L) Show forest plot | 2 | 936 | Mean Difference (IV, Random, 95% CI) | 0.62 [0.31, 0.94] |
| 9 Change in HbA1c from baseline (%) Show forest plot | 2 | 1014 | Mean Difference (IV, Random, 95% CI) | ‐1.44 [‐4.48, 1.60] |
| 10 Change in weight from baseline (kg) Show forest plot | 2 | 1014 | Mean Difference (IV, Random, 95% CI) | 1.80 [‐0.63, 4.23] |
| 11 Mild hypoglycaemia Show forest plot | 1 | 1234 | Risk Ratio (M‐H, Random, 95% CI) | 2.51 [1.83, 3.42] |
| 12 Severe hypoglycaemia Show forest plot | 1 | 1234 | Risk Ratio (M‐H, Random, 95% CI) | 3.52 [0.73, 16.89] |
| 13 Cancer Show forest plot | 1 | 1234 | Risk Ratio (M‐H, Random, 95% CI) | 0.81 [0.50, 1.31] |
| 14 Intervention failure Show forest plot | 3 | 1364 | Risk Ratio (M‐H, Random, 95% CI) | 1.96 [0.67, 5.75] |