Tratamiento guiado por el péptido natriurético tipo B para la insuficiencia cardíaca
Referencias
Referencias de los estudios incluidos en esta revisión
Referencias de los estudios excluidos de esta revisión
Referencias de los estudios en curso
Referencias adicionales
Referencias de otras versiones publicadas de esta revisión
Characteristics of studies
Characteristics of included studies [ordered by study ID]
| Methods | Setting: Hospital in Spain Duration of study: 18 months Inclusion criteria: At least NYHA III, receiving at least one diuretic, an ACE inhibitor or ARB and a beta blocker Exclusion criteria: < 18 years old, acute coronary syndrome within 3 months, aetiological treatment or cardiac transplantation pending, life expectancy < 1 year due to co‐morbidities | |
| Participants | Number of participants at baseline: Intervention 30; Control 30 Gender (male): Intervention 67%; Control 70% Mean age (SD): Intervention 70 (8); Control 69 (12) | |
| Interventions |
Intervention provider: Specialist (cardiology service) | |
| Outcomes | Review relevant: i) All‐cause mortality; ii) HF admission Additional outcomes: i) Cardiovascular events | |
| Notes | ||
| Risk of bias | ||
| Bias | Authors' judgement | Support for judgement |
| Random sequence generation (selection bias) | Unclear risk | Randomised, but no description of how achieved |
| Allocation concealment (selection bias) | Unclear risk | Not stated |
| Blinding of participants and personnel (performance bias) | Unclear risk | Not stated |
| Blinding of outcome assessment (detection bias) | Unclear risk | Not stated |
| Incomplete outcome data (attrition bias) | Low risk | No attrition |
| Selective reporting (reporting bias) | Low risk | All outcomes reported as specified in the publication |
| Other bias | Unclear risk | Source of funding: Not stated |
| Methods | Setting: Outpatient clinic in Canada Duration of study: Three months Inclusion criteria: Patients with symptomatic HF (NYHA II to IV) for 3 months previous or previous hospital admission due to HF, not on beta blockers, LVEF 40% or less, receiving treatment with an ACE inhibitor or ARB plus loop diuretic and digoxin Exclusion criteria: < 18 years old, one of the following: myocardial infarction or unstable angina within 4 weeks, severe stenotic valvular heart disease or hepatic or renal disease or a contraindication for beta blockers | |
| Participants | Number of participants at baseline: Intervention 21; Control 20 Gender (male): Intervention 33.3%; Control 35% Mean age (SD): Intervention 64.5 (15.2); Control 65.6 (13.5) | |
| Interventions |
Intervention provider: Specialist (HF team) | |
| Outcomes | Review relevant: i) All‐cause mortality; ii) All‐cause admission iii); Quality of Life Additional outcomes: i) LVEF change | |
| Notes | ||
| Risk of bias | ||
| Bias | Authors' judgement | Support for judgement |
| Random sequence generation (selection bias) | Unclear risk | 'Randomly assigned'. No description of how achieved |
| Allocation concealment (selection bias) | Low risk | Email from author 19 September 14 "'opaque envelopes" |
| Blinding of participants and personnel (performance bias) | High risk | "BNP values were blinded to the attending physician in the clinical group... (control)... but the doctors were not blinded as to which group the patient belonged" |
| Blinding of outcome assessment (detection bias) | Unclear risk | Not stated |
| Incomplete outcome data (attrition bias) | Unclear risk | Email from author 19 September 14 "There was very few missing data. I believe the participants were then excluded" |
| Selective reporting (reporting bias) | Low risk | All outcomes reported as specified in the publication |
| Other bias | Unclear risk | Source of funding: Not stated |
| Methods | Setting: Hospital and community in Austria Duration of study: 18 months Inclusion criteria: Clincial signs and symptoms of cardiac decompensation at hospitalisation, NYHA III or IV at admission, cardiothoracic ratio > 0.5 or LVEF < 40% Exclusion criteria: None stated | |
| Participants | Number of participants at baseline: Intervention (BM) 92; Control (MC) 96; Control (UC) 90 Gender (male): Intervention (BM) 63%; Control (MC) 70%; Control (UC) 69% Mean age (SD): Intervention (BM) 70 (12); Control (MC) 73 (11); Control (UC) 71 (13) | |
| Interventions |
Intervention provider: HF specialist (BM), HF nurse (MC), Primary care physician (UC) | |
| Outcomes | Review relevant: i) All‐cause mortality; ii) HF mortality; iii) HF admission; iv) All‐cause admission; v) Quality of life Additional outcomes: i) Time to death or HF admission; ii) Ambulatory visits at HF clinics | |
| Notes | ||
| Risk of bias | ||
| Bias | Authors' judgement | Support for judgement |
| Random sequence generation (selection bias) | Low risk | Computer‐generated permuted block randomisation. 6 patients per block |
| Allocation concealment (selection bias) | Low risk | Randomisation and concealment completed by independent medical project management institute |
| Blinding of participants and personnel (performance bias) | High risk | "Patients and providers knew they were in an intervention group (BM and MC)" |
| Blinding of outcome assessment (detection bias) | Low risk | "Independent data collectors obtained information from medical reports and interviews with relatives". Cardologists blinded to treatment classified the cause of hospitalisation |
| Incomplete outcome data (attrition bias) | Low risk | No attrition |
| Selective reporting (reporting bias) | High risk | Planned outcomes specified in Berger 2010. Data not reported for HF mortality, all‐cause admission |
| Other bias | Unclear risk | Source of funding: AstraZeneca, Novartis, Roche Diagnostics, Roche Medical, Merck, Medtronic, and Guidant, who provided the financial support for a clinical investigator, a specialised chronic HF nurse, and data collection |
| Methods | 'PRIMA' Setting: 12 hospitals in the Netherlands Duration of study: 24 months Inclusion criteria: European Society of Cardiology (ESC) diagnostic guideline criteria for acute HF, NT‐proBNP levels at admission were required to be at least 1,700 pg/mL, NT‐proBNP levels during hospitalisation were required to decrease more than 10%, with a drop in NT‐proBNP levels of at least 850 pg/mL, from admission to discharge Exclusion criteria: Life‐threatening cardiac arrhythmias during the index hospitalisation, urgent invasive or surgical intervention performed or planned during the index hospital admission, severe COPD with a forced expiratory volume in 1 s (FEV1) of 1 l/s, pulmonary embolism less than 3 months prior to admission, pulmonary hypertension not caused by left ventricular systolic dysfunction (LVSD), a non–HF‐related expected survival of less than 1 year, and patients undergoing haemodialysis or CAPD | |
| Participants | Number of participants at baseline: Intervention 174; Control 171 Gender (male): Intervention 55%; Control 60% Mean age (SD): Intervention 71.6 (12); Control 72.8 (11.7) | |
| Interventions |
Intervention provider: Specialist (HF cardiologists and nurses) | |
| Outcomes | Review relevant: i) All‐cause mortality; ii) Quality of life Additional outcomes: i) Survival free of hospitalisation; ii) Cardiovascular mortality; iii) Cardiovascular admissions; vi) Composite of total cardiovascular morbidity and mortality | |
| Notes | ||
| Risk of bias | ||
| Bias | Authors' judgement | Support for judgement |
| Random sequence generation (selection bias) | Unclear risk | 'Randomised to'. No description of how achieved |
| Allocation concealment (selection bias) | Low risk | Email from author 23 October 14 "completed by non‐transparent envelopes" |
| Blinding of participants and personnel (performance bias) | High risk | Email from author 23 October 14 "Patients were blinded to the treatment allocation. The treating physician however was not." |
| Blinding of outcome assessment (detection bias) | Low risk | "All events were adjudicated by a blinded event committee, consisting of medical specialists in cardiology, nephrology, vascular medicine, pulmonology, and neurology." |
| Incomplete outcome data (attrition bias) | Unclear risk | One‐year attrition documented with reasons. Unclear beyond 1 year |
| Selective reporting (reporting bias) | High risk | Planned outcomes specified in Eurlings 2010. No data reported for all‐cause admission |
| Other bias | Unclear risk | Source of funding: Main funding from the Netherlands heart foundation, Netherlands organisation for scientific research and Royal Netherlands academy of arts and sciences‐inter university cardiology institute of the Netherlands. Minor funding of an unrestricted fund was provided by Pfizer |
| Methods | 'PROTECT' Setting: Hospital in USA Duration of study: 12 months Inclusion criteria: ≥ 21 years old, LVEF ≤ 40%, NYHA class II ‐ IV, hospital admission, emergency dept. or outpatient therapy for destabilised HF at least once in last 6 months Exclusion criteria: Serum creatinine >2.5 mg/dL, inoperable aortic valvular heart disease, life expectancy < 1 year due to causes other than HF, cardiac implant or revascularisation indicated or expected within 6 months, severe obstructive or restrictive pulmonary disease, unwilling or unable to give consent, coronary revascularisation within previous 3 months | |
| Participants | Number of participants at baseline: Intervention 75; Control 76 Gender (male): Intervention 88.2%; Control 81.3% Mean age (SD): Intervention 63 (14.5); Control 63.5 (13.5) | |
| Interventions |
Intervention provider: Specialist (physicians skilled in HF care) | |
| Outcomes | Review relevant: i) HF admission; ii) Adverse events; iii) Cost; iv) Quality of life Additional outcomes: i) Total cardiovascular events in one year; ii) Cardiac structure and function; iii) Cost of care | |
| Notes | ||
| Risk of bias | ||
| Bias | Authors' judgement | Support for judgement |
| Random sequence generation (selection bias) | Low risk | Block randomisation |
| Allocation concealment (selection bias) | Unclear risk | Not stated |
| Blinding of participants and personnel (performance bias) | High risk | 'Neither caregivers nor the patients were blinded to the NT‐proBNP results' |
| Blinding of outcome assessment (detection bias) | Unclear risk | Not stated |
| Incomplete outcome data (attrition bias) | Unclear risk | Not stated |
| Selective reporting (reporting bias) | Low risk | All outcomes reported as specified in the protocol |
| Other bias | Unclear risk | Source of funding: In part by Roche diagnostics, Inc. First author partly funded by Roche Diagnostics, Inc., Siemens Diagnostics, and Critical Diagnostics |
| Methods | 'STARS‐BNP' Setting: 17 hospitals in France Duration of study: Minimum six months Inclusion criteria: > 18 years old, NYHA II to III, LVEF < 45%, stable condition (no hospital stay in previous month) and treated by optimal therapy (ESC guidelines), dosages of medication stable for at least 1 month, diuretics, ACEs, ARBs, and β blockers at maximum tolerated doses Exclusion criteria: Acute coronary syndrome in last 3 months, chronic renal failure (plasma creatinine > 250 µmol/L), documented hepatic cirrhosis, asthma, or COPD | |
| Participants | Number of participants at baseline: Intervention 110; Control 110 Gender (male): Intervention 59%; Control 56% Mean age (SD): Intervention 65 (5); Control 66 (6) | |
| Interventions |
Intervention provider: Specialist (highly qualified cardiologists) | |
| Outcomes | Review relevant: i) All‐cause mortality; ii) HF mortality; iii) HF admission; iv) All‐cause admission Additional outcomes: i) Composite of HF mortality or HF hospital admissions | |
| Notes | ||
| Risk of bias | ||
| Bias | Authors' judgement | Support for judgement |
| Random sequence generation (selection bias) | Unclear risk | Randomised, but no description of how achieved |
| Allocation concealment (selection bias) | Unclear risk | Not stated |
| Blinding of participants and personnel (performance bias) | High risk | Patients blinded to BNP results. BNP results only available to investigator to guide treatment |
| Blinding of outcome assessment (detection bias) | Unclear risk | Not stated |
| Incomplete outcome data (attrition bias) | Low risk | No attrition |
| Selective reporting (reporting bias) | Low risk | All outcomes reported as specified in the publication |
| Other bias | Unclear risk | Source of funding: Unrestricted grant from Biosite Inc. (San Diego, Calafornia) to the french working group on HF |
| Methods | 'UPSTEP' Setting: 19 hospitals in Sweden and Norway Duration of study: Minimum 12 months Inclusion criteria: > 18 years old, with verified systolic HF, worsening HF in last month (requiring hospitalisation, and/or intravenous diuretic treatment, metolazone, or increased daily doses of diuretics and /or need of intravenous inotropic support), LVEF < 40% (measured in last 6 months)4. NYHA II‐IV, ongoing standard HF treatment according to guidelines (ACE, ACEI, ARB, BB and/or diuretics, AA and/or digoxin if needed) Exclusion criteria: If any of the following conditions existed: haemodynamically unstable patients on waiting list for cardiac surgery, myocardial infarction within the last 3 months, patients with haemodynamically significant valvular heart disease, patients with impaired renal function (s‐creatinine >250 µmol/L) or liver function (> 3x normal value), patients with severely decreased pulmonary function, patients with limited life expectancy | |
| Participants | Number of participants at baseline: Intervention 147; Control 132 Gender (male): Intervention 73%; Control 73% Mean age (SD): Intervention 71.6 (9.7); Control 70.1 (10) | |
| Interventions |
Intervention provider: Specialist (treating physician experienced in managing patients with HF) | |
| Outcomes | Review relevant: i) All‐cause mortality; ii) HF mortality; iii) HF admission; iv) All‐cause admission; v) Quality of life Additional outcomes: i) Composite of mortality, need for hospitalisation and worsening HF; ii) Cardiovascular mortality; iii) Cardiovascular hospital admissions; iv) Worsening HF | |
| Notes | ||
| Risk of bias | ||
| Bias | Authors' judgement | Support for judgement |
| Random sequence generation (selection bias) | Low risk | Block randomisation |
| Allocation concealment (selection bias) | Low risk | Email by author 21 October 14 "Opaque envelopes" |
| Blinding of participants and personnel (performance bias) | High risk | Unblinded "patients were made aware of their BNP value in order increase motivation to adhere to treatment" |
| Blinding of outcome assessment (detection bias) | Low risk | "All endpoints were adjudicated using a predefined endpoint protocol by a committee with two experienced cardiologists who did not participate in the study and were blinded to the results" |
| Incomplete outcome data (attrition bias) | Unclear risk | Numbers provided, but not reasons |
| Selective reporting (reporting bias) | Low risk | All outcomes reported as specified in the publication |
| Other bias | Unclear risk | Source of funding: Swedish Heart‐Lung foundation, Regional research foundation in south eastern Sweden, regional foundation in northern Sweden, and by unrestricted grant from Biosite International and Infiniti Medical AB who supplied BNP analysing equipment |
| Methods | 'OPTIMA' Setting: Hospitals in Czech Republic Duration of study: 24 months Inclusion criteria: Newly diagnosed or acutely deteriorating advanced chronic failure (NYHA III‐IV), LVEF ≤ 45% Exclusion criteria: Age under 18 or above 90 years old; acute coronary syndrome during the last three months, pulmonary embolism during the last three months, history of hepatic cirrhosis, severe renal insufficiency (creatinine >250 µmol/L), severe chronic lung disease, current malignant disease. | |
| Participants | Number of participants at baseline: Intervention 26; Control 26 Gender (male): Intervention 69%; Control 65% Median age (range): Intervention 71 (36‐89); Control 70 (45‐84) | |
| Interventions |
Intervention provider: Specialist | |
| Outcomes | Review relevant: i) All‐cause mortality; ii) HF mortality; iii) HF admission; iv) Adverse events Additional outcomes: i) Composite of cardiovascular mortality, hospitalisation for worsening HF and outpatient episodes of worsening HF requiring to increase diuretic by at least 50% | |
| Notes | ||
| Risk of bias | ||
| Bias | Authors' judgement | Support for judgement |
| Random sequence generation (selection bias) | Unclear risk | 'randomised'. No description of how achieved |
| Allocation concealment (selection bias) | Low risk | Email from author 17 October 14 "opaque envelopes" |
| Blinding of participants and personnel (performance bias) | High risk | Email from the author 17 October 14 "Only the patients were blinded to the group allocation" |
| Blinding of outcome assessment (detection bias) | Unclear risk | Not stated |
| Incomplete outcome data (attrition bias) | Unclear risk | Not stated |
| Selective reporting (reporting bias) | Low risk | All outcomes reported as specified in Krupicka 2010 |
| Other bias | Unclear risk | Source of funding: supported by an educational grant from the ZENTIVA company (ZENTIVA is Czech generic pharmaceutical company) |
| Methods | 'BATTLESCARRED' Setting: Hospital in New Zealand Duration of study: Three years Inclusion criteria: > 18 years old with symptomatic CHF (as defined by Framingham criteria and satisfying ESC guidelines for the diagnosis of HF), requiring admission to hospital and able to give informed consent, pre‐randomisation plasma NTproBNP must exceed 50 pmol/L (i.e. approximately 400 pg/mlL. Recruitment deliberately included elderly patients and patients with a preserved LVEF Exclusion criteria: Active myocarditis/pericarditis, life expectancy due to non‐cardiovascular disease of < 24 months, severe hepatic or pulmonary disease, renal impairment (plasma creatinine > 250 µmol/L), transient HF from myocardial infarction treated with acute revascularisation and a subsequent ejection fraction during the index hospital admission of > 40%, severe valvular disease being considered for surgery, severe aortic stenosis (valve area < 1 cm2), HF secondary to mitral stenosis or are under consideration for cardiac transplantation | |
| Participants | Number of participants at baseline: Intervention 121; Control (CG) 121; Control (UC) 122 Gender (male): Intervention 63%; Control (CG) 67%; Control (UC) 62% Median age (range): Intervention 76 (44 to 89); Control (CG) 76 (34 to 89); Control (UC) 75 (31 to 89) | |
| Interventions |
Intervention provider: Specialist (research outpatient clinic) (NT‐proBNP and CG), Primary care physician (UC) | |
| Outcomes | Review relevant: i) All‐cause mortality; ii) HF admission; iii) Quality of life Additional outcomes: i) Mortality plus episodes of inpatient or outpatient HF decompensation; ii) Mortality plus hospital admission for any cardiovascular event plus episodes of outpatient decompensated HF requiring increased medication treatment for decompensated HF; iii) Episodes of HF decompensation; iv) Episodes of HF decompensation; (v) Changes in NTproBNP, NYHJA status, LVEF, six‐minute walk distance | |
| Notes | ||
| Risk of bias | ||
| Bias | Authors' judgement | Support for judgement |
| Random sequence generation (selection bias) | Low risk | Stratified by age (≤75 or > 75) in permuted blocks of 30 |
| Allocation concealment (selection bias) | Unclear risk | Not stated |
| Blinding of participants and personnel (performance bias) | Low risk | "double blind", "Patients will be blinded as to their group allocation, and clinical assessments will be made by a physician also blinded. Intensification of drug treatment will be made by an unblinded physician in the research team" |
| Blinding of outcome assessment (detection bias) | Low risk | "double blind" |
| Incomplete outcome data (attrition bias) | Unclear risk | Numbers provided, but not reasons |
| Selective reporting (reporting bias) | High risk | Planned outcomes specified in protocol. No follow‐up quality of life data for usual care (UC) control group. Analyses for two secondary outcomes were completed and commented on, but data were not provided. |
| Other bias | Low risk | Source of funding: Grants from the Health Research Council of New Zealand and the National Heart Foundation of New Zealand |
| Methods | Setting: Hospital in China Duration of study: 1 month Inclusion criteria: Moderate to severe HF (NYHA III ‐ IV) Exclusion criteria: Patients with severe renal function damage (serum creatinine > 265 umol/L), bronchial asthma or COPD were excluded, as well as end‐stage HF patients without response to intravenous drug treatment. | |
| Participants | Number of participants at baseline: Intervention 96; Control 99 Gender (male): Intervention 56.3%; Control 55.4% Average age (range): Intervention 57 (40 to 78); Control 58 (38 to 81) | |
| Interventions |
Intervention provider: Specialist (highly placed medical profession in cardiology) | |
| Outcomes | Review relevant: i) HF mortality Additional outcomes: i) Average start up of metoprolol succinate; ii) Maximum dose of metoprolol succinate; iii) Recurrance rate of additional drugs | |
| Notes | ||
| Risk of bias | ||
| Bias | Authors' judgement | Support for judgement |
| Random sequence generation (selection bias) | Unclear risk | Randomised, but no description of how achieved |
| Allocation concealment (selection bias) | Unclear risk | Not stated |
| Blinding of participants and personnel (performance bias) | Unclear risk | Not stated |
| Blinding of outcome assessment (detection bias) | Unclear risk | Not stated |
| Incomplete outcome data (attrition bias) | Low risk | Numbers and reasons provided. ".....due to severe bradycardia" |
| Selective reporting (reporting bias) | Low risk | All outcomes reported as specified in the publication |
| Other bias | Unclear risk | Source of funding: Not stated |
| Methods | 'TIME‐CHF (Heart failure preserved LVEF (HFpEF)) Setting: 15 hospital outpatient clinics in Switzerland and Germany Duration of study: 18 months Inclusion criteria: 60 years or older with dyspnoea (NYHA class II with current therapy), a history of hospitalisation for HF within the last year, N‐terminal BNP level of 400 pg/mL or higher in patients younger than 75 years and a level of 800 pg/mL or higher in patients aged 75 years or older, > 45% LVEF Exclusion criteria: patients with dyspnoea not mainly due to HF, with valvular disease requiring surgery, acute coronary syndromes within the previous 10 days, angina pectoris classified as being in the Canadian Cardiovascular Society Class higher than II, revascularisation within the previous month, BMI (calculated as weight in kilograms divided by height in meters squared) higher than 35, serum creatinine level higher than 2.49 mg/dL, a life expectancy of less than 3 years for non cardiovascular diseases, unable to give informed consent, no follow‐up possible, or participating in another study | |
| Participants | Number of participants at baseline: Intervention 59; Control 64 Gender (male): Intervention 36%; Control 33% Mean age (SD): Intervention 80.3 (6.8); Control 79.9 (7.2) | |
| Interventions |
Intervention provider: Specialist (HF outpatient clinic with collaboration of general practitioner) | |
| Outcomes | Review relevant: i) All‐cause mortality; ii) Adverse events; iii) Cost; iv) Qualtiy of life Additional outcomes: i) Survival free of hospitalisation | |
| Notes | Linked to Pfisterer 2009. Two separate groups of participants in TIME‐CHF | |
| Risk of bias | ||
| Bias | Authors' judgement | Support for judgement |
| Random sequence generation (selection bias) | Low risk | Stratified by 2 age groups using central allocation in blocks of 8 patients |
| Allocation concealment (selection bias) | Low risk | "concealed" |
| Blinding of participants and personnel (performance bias) | High risk | "Patients, but not treating physicians, were blinded to group allocation" |
| Blinding of outcome assessment (detection bias) | Unclear risk | Not stated |
| Incomplete outcome data (attrition bias) | Unclear risk | Numbers provided, but not reasons |
| Selective reporting (reporting bias) | High risk | Planned outcomes specified in Brunner‐LA Rocca 2006. Quality of life outcome not reported |
| Other bias | Unclear risk | Source of funding: Sponsored by the Horten Research Foundation (Lugano, Switzerland; 55% of the study’s budget), as well as by smaller unrestricted grants from AstraZeneca Pharma, Novartis Pharma, Menarini Pharma, Pfizer Pharma, Servier, Roche Diagnostics, Roche Pharma, and Merck Pharma |
| Methods | 'SIGNAL‐HF' Setting: Community in Sweden Duration of study: Nine months Inclusion criteria: Diagnosis of chronic HF, stable NYHA class II–IV, LVEF 50%, elevated NT‐proBNP levels (males 800, females 1000 ng/L) Exclusion criteria: planned cardiovascular hospitalisation; stroke, acute myocardial infarction, or open heart surgery within the last 3 months before enrolment, mitral stenosis, aortic stenosis of clinical significance, patients already receiving optimal pharmacological treatment for chronic HF according to the national guidelines, serum creatinine ≥265 mmol/L | |
| Participants | Number of participants at baseline: Intervention 126; Control 124 Gender (male): Intervention 76%; Control 66% Mean age: Intervention 78; Control 77 | |
| Interventions |
It was not specifically stated if no or any action was taken if the patient was below or at target. Intervention provider: Generalist plus 2‐3 hours training about HF guidelines with local cardiologist | |
| Outcomes | Review relevant: i) All‐cause mortality; ii) Adverse events; iii) Quality of life (not reported) Additional outcomes: i) Composite endpoint of days alive, days out of hospital (for cardiovascular reasons), and symptom score from the Kansas City Cardiomyopathy Questionnaire ii) Change in NT‐proBNP, NYHA, level of titration and intensification of treatment | |
| Notes | ||
| Risk of bias | ||
| Bias | Authors' judgement | Support for judgement |
| Random sequence generation (selection bias) | Unclear risk | Randomised, but no description of how achieved |
| Allocation concealment (selection bias) | Unclear risk | Not stated |
| Blinding of participants and personnel (performance bias) | Unclear risk | "single‐blind", lack of details |
| Blinding of outcome assessment (detection bias) | Unclear risk | "single‐blind", lack of details |
| Incomplete outcome data (attrition bias) | Unclear risk | Numbers provided, but not reasons |
| Selective reporting (reporting bias) | High risk | Planned outcomes specified in Persson 2010. Quality of life outcomes not reported |
| Other bias | Unclear risk | Source of funding: AstraZeneca |
| Methods | 'TIME‐CHF (Heart failure reduced LVEF (HFrEF)) Setting: 15 hospital outpatient clinics in Switzerland and Germany Duration of study: 18 months Inclusion criteria: 60 years or older with dyspnoea (NYHA class II with current therapy), a history of hospitalisation for HF within the last year, N‐terminal BNP level of 400 pg/mL or higher in patients younger than 75 years and a level of 800 pg/mL or higher in patients aged 75 years or older, ≤ 45% LVEF Exclusion criteria: patients with dyspnoea not mainly due to HF, with valvular disease requiring surgery, acute coronary syndromes within the previous 10 days, angina pectoris classified as being in the Canadian Cardiovascular Society Class higher than II, revascularisation within the previous month, BMI (calculated as weight in kilograms divided by height in meters squared) higher than 35, serum creatinine level higher than 2.49 mg/dL, a life expectancy of less than 3 years for non cardiovascular diseases, unable to give informed consent, no follow‐up possible, or participating in another study | |
| Participants | Number of participants at baseline: Intervention 251; Control 248 Gender (male): Intervention 68.1%; Control 62.9% Mean age: Intervention 76; Control 77 | |
| Interventions |
Intervention provider: Specialist (HF outpatient clinic with collaboration of general practitioner) | |
| Outcomes | Review relevant: i) All‐cause mortality; ii) Adverse events; iii) Cost; iv) Qualtiy of life Additional outcomes: i) Survival free of hospitalisation | |
| Notes | Linked to Maeder 2013. Two separate groups of participants in TIME‐CHF | |
| Risk of bias | ||
| Bias | Authors' judgement | Support for judgement |
| Random sequence generation (selection bias) | Low risk | Stratified by 2 age groups using central allocation in blocks of 8 patients |
| Allocation concealment (selection bias) | Low risk | "concealed" |
| Blinding of participants and personnel (performance bias) | High risk | "Patients, but not treating physicians, were blinded to group allocation" |
| Blinding of outcome assessment (detection bias) | Unclear risk | Not stated |
| Incomplete outcome data (attrition bias) | Unclear risk | Numbers provided, but not reasons |
| Selective reporting (reporting bias) | Low risk | Planned outcomes specified in protocol. All outcomes reported. |
| Other bias | Unclear risk | Source of funding: Sponsored by the Horten Research Foundation (Lugano, Switzerland; 55% of the study’s budget), as well as by smaller unrestricted grants from AstraZeneca Pharma, Novartis Pharma, Menarini Pharma, Pfizer Pharma, Servier, Roche Diagnostics, Roche Pharma, and Merck Pharma |
| Methods | 'NorthStar' Setting: 18 HF clinics in Denmark Duration of study: 30 months Inclusion criteria: > 18 years old, LVEF < 45%, educated in HF disease and management, on optimal medical therapy (ACE inhibitor/ARB, beta‐blocker, aldosterone receptor antagonist) or an implantable cardioverter‐defibrillator and/or CRT, if indicated,and NT‐proBNP ≥ 1000 pg/mL after up‐titration (high‐risk patients were included, but not as target since the patients should receive guideline treatment based on LVEF, functional class, and QRS duration on the ECG before randomisation), euvolaemic and clinically stable according to the pre‐defined stability criteria Exclusion criteria: Plasma creatinine >200 µmol/l200720, waiting for a heart transplant, valvular or Ischaemic heart disease with planned surgery or PCI, withdrawal of ACE inhibitors/ARBs, BB, and ARAs due to a reversible cause of cardiomyopathy, malignancy with life expectancy, 5 years, dementia | |
| Participants | Number of participants at baseline: Intervention 199; Control 208 Gender (male): Intervention 76%; Control 76% Median age (range): Intervention 72 (56 to 85); Control 74 (51 to 89) | |
| Interventions |
Intervention provider: Specialist (HF nurse supervised by local cardiologist) | |
| Outcomes | Review relevant: i) All‐cause mortality; ii) HF admission; iii) All‐cause admission; iv) Quality of life Additional outcomes: i) Composite of all‐cause mortality or admission for a protocol‐specified cardiovascular cause; ii) Cardiovascular hospital admissions; iii) Change in NYHA class and NT‐proBNP levels; iv) Admission days; v) Number of admissions | |
| Notes | ||
| Risk of bias | ||
| Bias | Authors' judgement | Support for judgement |
| Random sequence generation (selection bias) | Unclear risk | "Randomisation performed". No description of how achieved |
| Allocation concealment (selection bias) | Unclear risk | "sealed envelopes kept at the local site". Not stated whether opaque |
| Blinding of participants and personnel (performance bias) | High risk | "NT‐proBNP levels are neither blinded for the patients, cardiologists, HFC nurses, or the GPs." |
| Blinding of outcome assessment (detection bias) | Low risk | "vital status and admissions evaluated by an independent endpoint committee whose members were unaware of the study group assignments" |
| Incomplete outcome data (attrition bias) | Low risk | No attrition |
| Selective reporting (reporting bias) | High risk | Planned outcomes specified in protocol. Cost not reported |
| Other bias | Unclear risk | Source of funding: Supported by unrestricted grants from Roche Diagnostics International, Schwitzerland; Merck, Sharp and Dohme, Denmark supported development of the electronic case report form; M.S. was supported by a grant from the Copenhagen Hospital Corporation |
| Methods | 'STARBRITE' Setting: Three hospitals in USA Duration of study: Four months Inclusion criteria: LVEF ≤ 35%, NYHA class III/IV on admission, follow‐up in the HF program of each site, and regular access to a telephone Exclusion criteria: Diagnosed with an acute coronary syndrome during the index hospitalisation, serum creatinine level >3.5 mg/dL, required haemodialysis | |
| Participants | Number of participants at baseline: Intervention 68; Control 69 Gender (male): Intervention 67.7%; Control 72.3% Median age (IQR): Intervention 59 (50,70); Control 63 (52,74) | |
| Interventions |
It was not specifically stated if no or any action was taken if the patient was below or at target. Intervention provider: Specialist (HF clinic clinicians, plus HF nurses for follow‐up telephone calls) | |
| Outcomes | Review relevant: i) All‐cause mortality; ii) All‐cause admission Additional outcomes: i) Survival free of hospitalisation during 90 days; ii) Number of days alive during the study period; iii) Number of diuretic adjustments; iv) Cost (not reported) Trial stopped early due to poor enrolment | |
| Notes | ||
| Risk of bias | ||
| Bias | Authors' judgement | Support for judgement |
| Random sequence generation (selection bias) | Low risk | "stratified by site with randomisation blocks of 6 through a central telephone centre" |
| Allocation concealment (selection bias) | Low risk | Email by author 7 October 2014 "opaque envelopes were used" |
| Blinding of participants and personnel (performance bias) | High risk | "Clinicians were aware of the treatment allocation but were blinded to BNP levels in patients in the congestion score strategy arm. Patients were blinded to the randomisation arm." |
| Blinding of outcome assessment (detection bias) | High risk | Email from author 7 October 2014: "No blinding. Outcomes were based on case report forms" |
| Incomplete outcome data (attrition bias) | Low risk | No attrition |
| Selective reporting (reporting bias) | High risk | Planned outcomes specified in protocol. Cost not reported. |
| Other bias | Unclear risk | Source of funding: Sponsored by the American Heart Association, the American College of Cardiology/Merck Foundation, and the Duke Clinical Research Institute |
| Methods | Setting: Hospital in Israel Duration of study: 16 (±11) months Inclusion criteria: ≥ 18 years old, known chronic HF, HF hospitalisation within last year before recruitment, GFR > 30 ml/mi, signed agreement, NYHA II – IV, NT‐ProBNP >2000 at day of randomisation Exclusion criteria: None | |
| Participants | Number of participants at baseline: Intervention 60; Control 60 Gender (male): Intervention 88.3%; Control 83% Mean age (SD): Intervention 70.2 (11); Control 69.4 (10.5) | |
| Interventions |
Intervention provider: Specialist (HF clinic) | |
| Outcomes | Review relevant: i) All‐cause mortality; ii) HF mortality (data not confirmed); iii) HF admission (data not confirmed); iv) All‐cause admission (data not confirmed) Additional outcomes: i) Cardiovascular mortality | |
| Notes | ||
| Risk of bias | ||
| Bias | Authors' judgement | Support for judgement |
| Random sequence generation (selection bias) | Low risk | "randomised' by computer" |
| Allocation concealment (selection bias) | Unclear risk | Email from author 12 November 14 "computer generated". |
| Blinding of participants and personnel (performance bias) | Unclear risk | Email from author 12 November 14 "Patients and physicians blinded to group allocation. Study co‐ordinator not blinded but did not participate in study process". Correspondence with author makes evaluation of bias unclear as it is not known if participants and clinicians were blinded to the monitoring process (intervention). |
| Blinding of outcome assessment (detection bias) | Unclear risk | Not stated |
| Incomplete outcome data (attrition bias) | Unclear risk | Numbers provided, but not reasons |
| Selective reporting (reporting bias) | Unclear risk | Insufficient information to assess risk |
| Other bias | Unclear risk | Source of funding: 'Rosh' Company granted sets for NT‐proBNP determination, no additional funding |
| Methods | Setting: Hospital outpatients in Russia Duration of study: One year Inclusion criteria: Hospital admission due to acute decompensation HF, NYHA class III – IV at admission, LVEF < 40%, high risk at hospital discharge (> 1400 pg/mL NT‐proBNP) Exclusion criteria: Participant unable or unwilling to provide written informed consent, inoperable aortic or mitral valve disease, coronary revascularisation (PCI or CABG) within the previous 3 months, acute myocardial infarction in previous 6 month, inflammatory myocardium disease, serum creatinine > 220 mkmol/mL, severe obstructive or restrictive pulmonary disease, high degree atrioventricular block, alcohol abuse, oncology | |
| Participants | Number of participants at baseline: Intervention 35; Control 35 Gender (male): Intervention 61%; Control 89% Mean age (SD): Intervention 63.7 (8.6); Control 62.5 (13.3) | |
| Interventions |
Intervention provider: Specialist (HF clinic) | |
| Outcomes | Review relevant: i) All‐cause mortality; ii) HF mortality; iii) HF admission; iv) Quality of life Additional outcomes: i) Total cardiovascular events; ii) Changes in NT‐proBNP, LVEF, functional capacity i) Cardiovascular events; ii) Cardiovascular mortality; iii) Alternative biomarkers; iv) Clinical and functional status; v) LV systolic and diastolic function; vi) Episodes of HF deterioration needing additional i/v diuretics vii) Blood pressure viii) Serum creatinine ix) Recovery of patients | |
| Notes | ||
| Risk of bias | ||
| Bias | Authors' judgement | Support for judgement |
| Random sequence generation (selection bias) | Low risk | "randomisation 1:1" using block design, email from author 17.4.16 confirms randomisation by independent investigator |
| Allocation concealment (selection bias) | Unclear risk | Not stated |
| Blinding of participants and personnel (performance bias) | Unclear risk | Email from author 17 April 16 confirms patients and clinicians blinded to NT‐proBNP measurements in the control group, but unclear if blinded to group allocation |
| Blinding of outcome assessment (detection bias) | High risk | Email from author 17 April 16 confirms outcomes not blinded |
| Incomplete outcome data (attrition bias) | Low risk | Numbers provided with reasons |
| Selective reporting (reporting bias) | Unclear risk | Planned outcomes specified in Skvortsov 2015. Not all outcomes reported. Email from author 17 April 16 confirmed further publications due shortly |
| Other bias | Unclear risk | Source of funding: Not stated |
| Methods | Setting: Hospital in New Zealand Duration of study: Maximum 17 months Inclusion criteria: Aged 35 to 85, after hospital admission with decompensated HF or from a specialist cardiology outpatient clinic, LVEF < 40%, NYHA class II–IV, treated with ACE inhibitors, loop diuretic with or without digoxin Exclusion criteria: Acute coronary syndrome (within 3 months), pending cardiac transplant or revascularisation, severe stenotic valvular heart disease, or by severe pulmonary (forced expiratory volume in 1 s <1 L) hepatic or renal (plasma creatinine > 0·2 mmol/L) disease | |
| Participants | Number of participants at baseline: Intervention 33; Control 36 Gender (male): Intervention 78%; Control 75% Mean age: Intervention 68; Control 72 | |
| Interventions |
Intervention provider: Specialist (HF clinic) | |
| Outcomes | Review relevant: i) All‐cause mortality; ii) HF mortality; iii) HF admission; iv) All‐cause admission; v) Adverse events; vi) Qualtiy of life (no Additional outcomes: i) Total cardiovascular events; ii) Changes in NT‐proBNP, LVEF, functional capacity | |
| Notes | ||
| Risk of bias | ||
| Bias | Authors' judgement | Support for judgement |
| Random sequence generation (selection bias) | Low risk | "randomised" by computer. Email from author 21 October 2014 "Computer generated randomisation schedule". |
| Allocation concealment (selection bias) | Unclear risk | Not stated |
| Blinding of participants and personnel (performance bias) | High risk | Investigator intensifying treatment aware of group allocations |
| Blinding of outcome assessment (detection bias) | Unclear risk | Not stated |
| Incomplete outcome data (attrition bias) | Low risk | No attrition. |
| Selective reporting (reporting bias) | Low risk | Planned outcomes specified in Troughton 2000. All outcomes reported |
| Other bias | Unclear risk | Source of funding: grants from Health Research Council of New Zealand and Lottery Health |
ACE: angiotensin‐converting enzyme
ACEi: angiotensin‐converting enzyme inhibitor
ARB: angiotensin receptor blocker
BMI: body mass index
BNP: brain natriuretic peptide or b‐type natriuretic peptide
CABG: coronary artery bypass graft
CHF: chronic heart failure
CAPD: continuous ambulatory peritoneal dialysis
COPD: chronic obstructive pulmonary disease
CRT: cardiac resynchronisation therapy
ECG: electrocardiogram
ESC: European Society of Cardiology
FEV1: forced expiratory volume
GFR: glomerular filtration rate
HF: heart failure
KCL: potassium chloride
LVEF: left ventricular ejection fraction
Mg: magnesium
MRA: mineralocorticoid receptor antagonists
NT‐proBNP: N‐terminal pro b‐type natriuretic peptide
NYHA: New York Heart Association
PCI: percutaneous coronary intervention
SD: standard deviation
[STEMI: segment elevation myocardial infarction}
/d: per day
Characteristics of excluded studies [ordered by study ID]
| Study | Reason for exclusion |
| Not RCT. Further analysis from Troughton 2014 individual patient data meta analysis | |
| Not NP‐guided treatment | |
| Not RCT | |
| Not RCT | |
| Not RCT | |
| Not RCT | |
| Not RCT | |
| Not RCT | |
| Not RCT | |
| Not RCT | |
| Not RCT | |
| Not RCT | |
| Not treatment for heart failure | |
| Not NP‐guided treatment | |
| Not RCT | |
| Not NP‐guided treatment | |
| Not RCT | |
| Not RCT | |
| Not heart failure population | |
| Not RCT | |
| Not NP‐guided treatment | |
| Not NP‐guided treatment | |
| Not NP‐guided treatment | |
| Not RCT | |
| Not RCT | |
| Not RCT | |
| No prespecified outcomes | |
| Trial terminated | |
| Trial terminated | |
| Not NP‐guided treatment | |
| Not RCT | |
| Not RCT | |
| Not RCT | |
| Not RCT | |
| Not RCT |
RCT: randomised controlled trial
Characteristics of ongoing studies [ordered by study ID]
| Trial name or title | NCT01685840 'GUIDE‐IT' |
| Methods | Setting: USA & Canada Duration of study: 12‐24 months Inclusion criteria: ≥18 years old, LVEF ≤ 40% within 12 months of randomisation, High risk HF (HF hospitalisation, treatment in emergency department, outpatient treatment with intravenous diuretics in the prior 12 months) AND NT‐proBNP greater than 2000 pg/mL or BNP greater than 400 pg/mL at any time during the 30 days prior to randomisation, willing to provide informed consent Exclusion criteria: Acute coronary syndrome or cardiac revascularisation procedure within 30 days, cardiac resynchronisation therapy (CRT) within prior 3 months or current plan to implant CRT device, active myocarditis, hypertrophic obstructive cardiomyopathy, pericarditis, or restrictive cardiomyopathy, severe stenotic valvular disease, anticipated heart transplantation or ventricular assist device within 12 months, chronic inotropic therapy, complex congenital heart disease, end stage renal disease with renal replacement therapy, non cardiac terminal illness with expected survival less than 12 months, women who are pregnant or planning to become pregnant, inability to comply with planned study procedures, enrolment or planned enrolment in another clinical trial |
| Participants | Number of participants at baseline: 1100 (all groups) |
| Interventions |
Intervention provider: Treating physician for all arms |
| Outcomes | Review relevant: i) quality of life; ii) adverse events; iii) medical costs, resource and cost‐effectiveness Additional outcomes: i) time to cardiovascular death or HF hospitalisation; ii) time to all‐cause mortality and cardiovascular mortality; iii) cumulative morbidity; iv) time to first HF hospitalisation |
| Starting date | December 2012 |
| Contact information | |
| Notes | Unblinded. Except blinded clinical committee to adjudicate all deaths and hospitalisations Analysis on intention‐to‐treat basis Due to finish in December 2017 |
| Trial name or title | NCT02110433 |
| Methods | Setting: Hospitals in France Duration of study: 12 months Inclusion criteria: > 18 years old, HF diagnosed on a first hospitalisation for acute exacerbation during the last 12 months, without high age limit, minimal knowledge of the French language (patient or his relatives), informed written consent, resides or is treated in Ile de France, insured under the social security system Exclusion criteria: Myocardial infarction or revascularisation or heart valve surgery < 3 months, inability to execute the feasibility test, major cognitive disorders do not allow access to the platform, patient does not have the necessary autonomy to use the equipment, patient enrolled in another clinical trial, renal failure with creatininemia clearance (cockcroft) <15 mL/min 24h/day oxygen |
| Participants | Number of participants at baseline: 330 (all groups) |
| Interventions |
|
| Outcomes | Review relevant: i) all‐cause mortality; ii) HF admission; iii) quality of life; vi) cost Additional outcomes: i) composite end point including unplanned hospitalisations for CHF with hospital stay > 1 day / all‐cause death/ non‐programmed emergency department admission related to CHF; ii) emergency admission; iii) adherence to strategy; iv) false positive induced by the system; v) false positive induced by the system |
| Starting date | December 2013 |
| Contact information | patrick.jourdain@ch‐pontoise.fr, maryline.delattre@ch‐pontoise.fr |
| Notes | Due to finish in December 2015 |
| Trial name or title | |
| Methods | Setting: Italy |
| Participants | Number of participants at baseline: 300 (all groups) |
| Interventions |
|
| Outcomes | |
| Starting date | January 2005 |
| Contact information | |
| Notes | Recrutiment finished in August 2009 Currently in write up |
| Trial name or title | EX‐IMPROVE‐CHF (NCT00601679) |
| Methods | Setting: Three hospitals in Canada Duration of study: 24 months Inclusion criteria: ≥ 18 years old, NYHA class II‐IV, followed in a programmed HF management setting Exclusion criteria: Life expectancy <1 year due to causes other than HF such as advanced cancer, any other conditions that may render the patient ineligible according to the investigator's judgment |
| Participants | Number of participants at baseline: 400 (all groups) |
| Interventions |
Intervention provider: HF clinic specialists |
| Outcomes | Review relevant: i) All‐cause mortality Additional outcomes: i) HF hospitalisation and death; ii) time to hospitalisation/admission to emergency department due to HF; iii) total number of HF events; iv) total number of hospitalisations for cardiovascular events; v) cardiovascular mortality; vi) worsening in clinical status but not requiring hospital admission |
| Starting date | December 2007 |
| Contact information | |
| Notes | Due to finish in December 2014 |
| Trial name or title | |
| Methods | Setting: Hospital in Eygpt Duration of study: Six months Inclusion criteria: Patients with HF and reduced ejection fraction Exclusion criteria: acute or chronic renal failure, chronic lung disease, massive pericardial effusion, acute coronary syndrome |
| Participants | Number of participants at baseline: Intervention 25; Control 25 (2 further groups: ultrasound lung comets [n = 25], Doppler imaging [n = 25]) |
| Interventions |
|
| Outcomes | Review relevant: i) HF admission |
| Starting date | July 2012 |
| Contact information | Not stated |
| Notes | Finished August 2014 Limited data in the conference abstract, awaiting full publication Source of funding: Eygptian Society of Cardiology |
| Trial name or title | PRIMA II (NTR3279) |
| Methods | Setting: Hospitals in the Netherlands Duration of study: Six months Inclusion criteria: Acute decompensated HF (either de novo or acute‐on‐chronic HF) and NT‐proBNP levels of N1,700 ng/L (ie, 200 pmol/L) measured within 24 hours of hospital admission Exclusion criteria: COPD with FEV1 of <1 L, pulmonary embolism within 1 month before admission and pulmonary hypertension not caused by left ventricle dysfunction, undergoing CAPD/haemodialysis patients, planned coronary artery bypass graft (CABG), percutaneous coronary intervention (PCI), cardiac resynchronisation therapy (CRT), and/or valvular surgery before randomisation, cardiogenic shock at admission requiring invasive treatment, history of STEMI, CABG, PCI, CRTand/or valvular surgery within 1 month before admission, signed informed consent for any current interventional study, presence of severe noncardiac‐related life‐threatening disease before inclusion with an expected survival of < 6 months after inclusion, unwillingness to give or mental or physical status not allowing written informed consent, circumstances that prevent follow‐up (no permanent home address, transient, etc) |
| Participants | Number of participants at baseline: Intervention 170; Control 170 |
| Interventions |
Intervention provider: Physicians (control), HF nurses/cardiologists (intervention) |
| Outcomes | Review relevant: i) all‐cause mortality; ii) HF admission; iii) cost; iv) quality of life Additional outcomes: i) composite all‐cause mortality and HF hospitalisations; ii) hospital free survival in the first 180 days |
| Starting date | November 2011 |
| Contact information | |
| Notes | Due to finish in December 2014 Source of funding: Netherlands Heart Foundation, Dutch Organization for Scientific Research (NWO), the Royal Dutch Academy of Arts and Sciences (KNAW) – Interuniversity Cardiology Institute of the Netherlands, Pfizer, Astra‐Zeneca, Medtronic, and Roche Diagnostics |
ACE: angiotensin‐converting enzyme
CHF: chronic heart failure
CAPD: continuous ambulatory peritoneal dialysis
COPD: chronic obstructive pulmonary disease
ESC: European Society of Cardiology
FEV1: forced expiratory volume
HF: heart failure
LVEF: left ventricular ejection fraction
NYHA: New York Heart Association
STEMI: segment elevation myocardial infarction
Data and analyses
| Outcome or subgroup title | No. of studies | No. of participants | Statistical method | Effect size |
| 1 All‐cause mortality Show forest plot | 15 | 3169 | Risk Ratio (M‐H, Fixed, 95% CI) | 0.87 [0.76, 1.01] |
| Analysis 1.1  Comparison 1 Primary objective BNP vs no BNP, Outcome 1 All‐cause mortality. | ||||
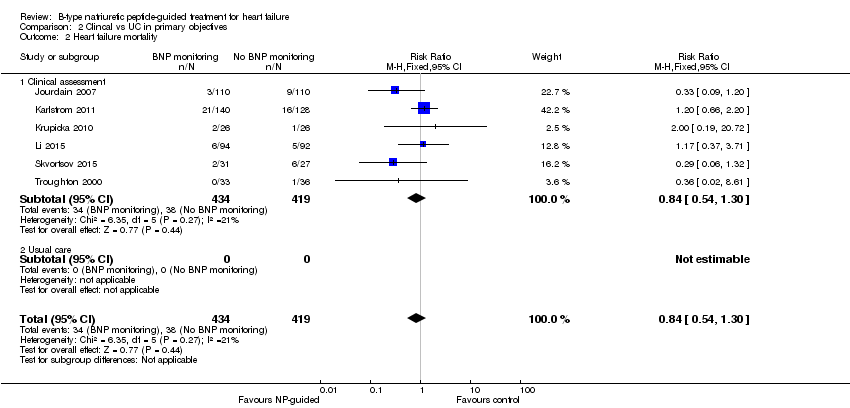
| 2 Heart failure mortality Show forest plot | 6 | 853 | Risk Ratio (M‐H, Fixed, 95% CI) | 0.84 [0.54, 1.30] |
| Analysis 1.2  Comparison 1 Primary objective BNP vs no BNP, Outcome 2 Heart failure mortality. | ||||
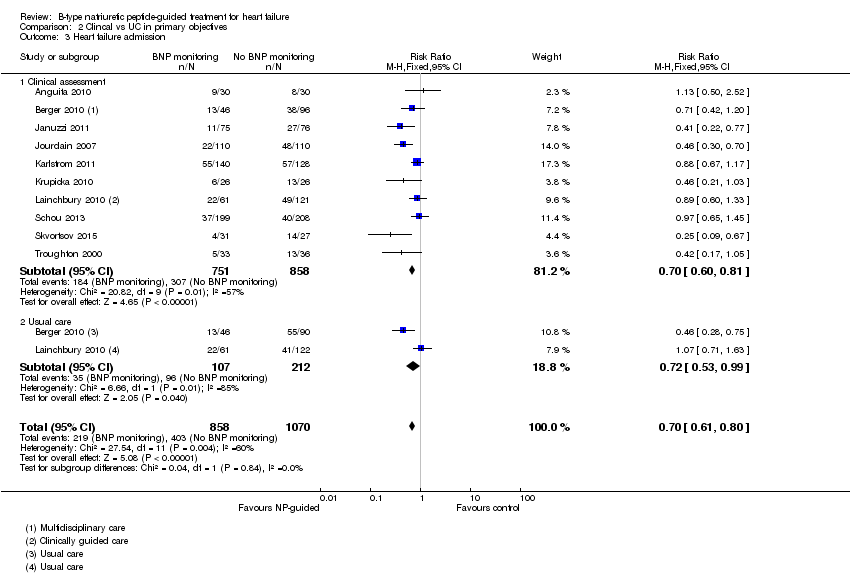
| 3 Heart failure admission Show forest plot | 10 | 1928 | Risk Ratio (M‐H, Fixed, 95% CI) | 0.70 [0.61, 0.80] |
| Analysis 1.3 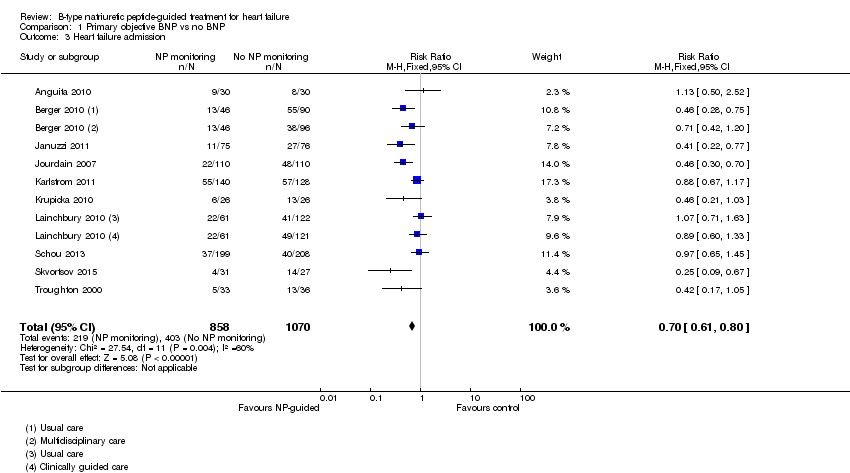 Comparison 1 Primary objective BNP vs no BNP, Outcome 3 Heart failure admission. | ||||
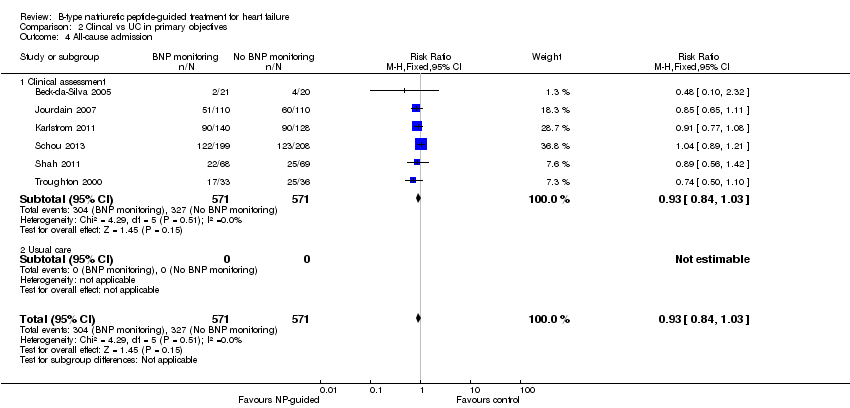
| 4 All‐cause admission Show forest plot | 6 | 1142 | Risk Ratio (M‐H, Fixed, 95% CI) | 0.93 [0.84, 1.03] |
| Analysis 1.4 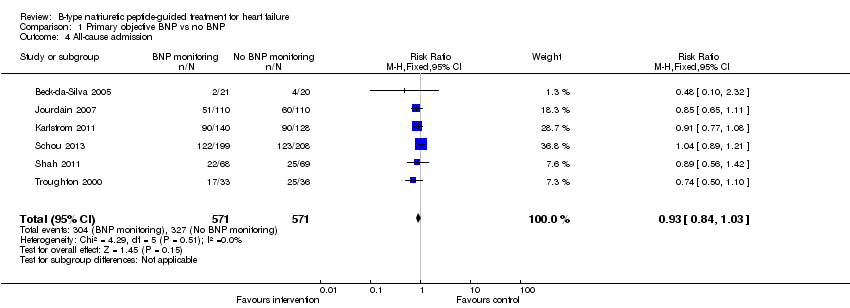 Comparison 1 Primary objective BNP vs no BNP, Outcome 4 All‐cause admission. | ||||
| 5 Quality of life Show forest plot | 8 | 1812 | Mean Difference (IV, Fixed, 95% CI) | ‐0.03 [‐1.18, 1.13] |
| Analysis 1.5  Comparison 1 Primary objective BNP vs no BNP, Outcome 5 Quality of life. | ||||
| Outcome or subgroup title | No. of studies | No. of participants | Statistical method | Effect size |
| 1 All‐cause mortality Show forest plot | 15 | 3169 | Risk Ratio (M‐H, Fixed, 95% CI) | 0.87 [0.76, 1.01] |
| Analysis 2.1 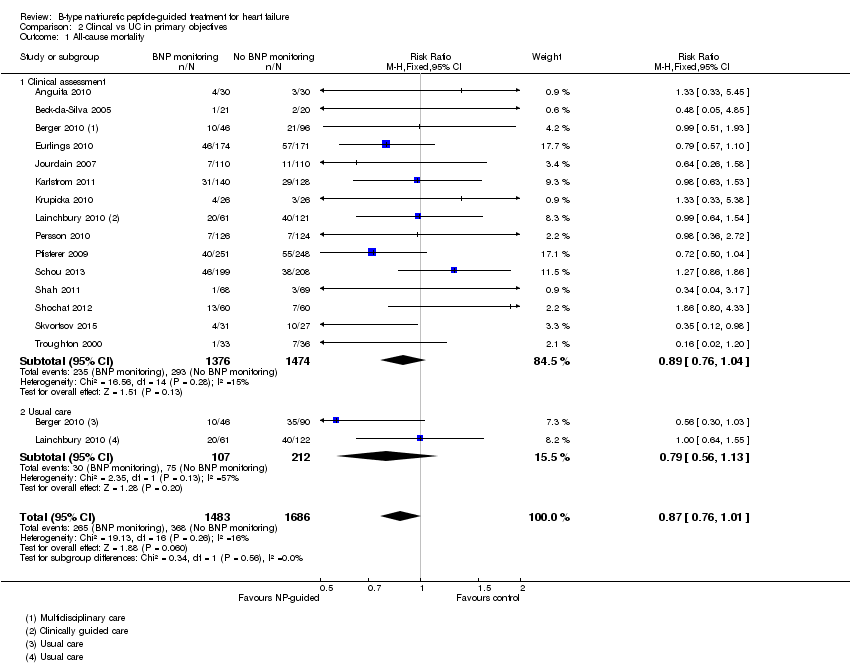 Comparison 2 Clincal vs UC in primary objectives, Outcome 1 All‐cause mortality. | ||||
| 1.1 Clinical assessment | 15 | 2850 | Risk Ratio (M‐H, Fixed, 95% CI) | 0.89 [0.76, 1.04] |
| 1.2 Usual care | 2 | 319 | Risk Ratio (M‐H, Fixed, 95% CI) | 0.79 [0.56, 1.13] |
| 2 Heart failure mortality Show forest plot | 6 | 853 | Risk Ratio (M‐H, Fixed, 95% CI) | 0.84 [0.54, 1.30] |
| Analysis 2.2  Comparison 2 Clincal vs UC in primary objectives, Outcome 2 Heart failure mortality. | ||||
| 2.1 Clinical assessment | 6 | 853 | Risk Ratio (M‐H, Fixed, 95% CI) | 0.84 [0.54, 1.30] |
| 2.2 Usual care | 0 | 0 | Risk Ratio (M‐H, Fixed, 95% CI) | 0.0 [0.0, 0.0] |
| 3 Heart failure admission Show forest plot | 10 | 1928 | Risk Ratio (M‐H, Fixed, 95% CI) | 0.70 [0.61, 0.80] |
| Analysis 2.3  Comparison 2 Clincal vs UC in primary objectives, Outcome 3 Heart failure admission. | ||||
| 3.1 Clinical assessment | 10 | 1609 | Risk Ratio (M‐H, Fixed, 95% CI) | 0.70 [0.60, 0.81] |
| 3.2 Usual care | 2 | 319 | Risk Ratio (M‐H, Fixed, 95% CI) | 0.72 [0.53, 0.99] |
| 4 All‐cause admission Show forest plot | 6 | 1142 | Risk Ratio (M‐H, Fixed, 95% CI) | 0.93 [0.84, 1.03] |
| Analysis 2.4  Comparison 2 Clincal vs UC in primary objectives, Outcome 4 All‐cause admission. | ||||
| 4.1 Clinical assessment | 6 | 1142 | Risk Ratio (M‐H, Fixed, 95% CI) | 0.93 [0.84, 1.03] |
| 4.2 Usual care | 0 | 0 | Risk Ratio (M‐H, Fixed, 95% CI) | 0.0 [0.0, 0.0] |
| 5 Quality of life Show forest plot | 8 | 1812 | Mean Difference (IV, Fixed, 95% CI) | ‐0.03 [‐1.18, 1.13] |
| Analysis 2.5  Comparison 2 Clincal vs UC in primary objectives, Outcome 5 Quality of life. | ||||
| 5.1 Clincial assessment | 8 | 1812 | Mean Difference (IV, Fixed, 95% CI) | ‐0.03 [‐1.18, 1.13] |
| 5.2 Usual care | 0 | 0 | Mean Difference (IV, Fixed, 95% CI) | 0.0 [0.0, 0.0] |
| Outcome or subgroup title | No. of studies | No. of participants | Statistical method | Effect size |
| 1 All‐cause mortality and age Show forest plot | 3 | 830 | Risk Ratio (M‐H, Fixed, 95% CI) | 1.02 [0.83, 1.27] |
| Analysis 3.1  Comparison 3 Subgroup analyses, Outcome 1 All‐cause mortality and age. | ||||
| 1.1 Equal or greater than 75 yrs old | 3 | 410 | Risk Ratio (M‐H, Fixed, 95% CI) | 1.23 [0.96, 1.57] |
| 1.2 Under 75 yrs old | 3 | 420 | Risk Ratio (M‐H, Fixed, 95% CI) | 0.73 [0.49, 1.10] |
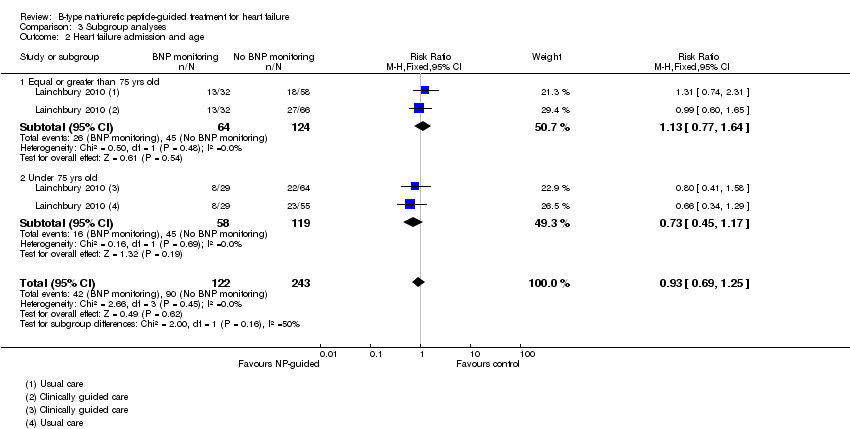
| 2 Heart failure admission and age Show forest plot | 1 | 365 | Risk Ratio (M‐H, Fixed, 95% CI) | 0.93 [0.69, 1.25] |
| Analysis 3.2  Comparison 3 Subgroup analyses, Outcome 2 Heart failure admission and age. | ||||
| 2.1 Equal or greater than 75 yrs old | 1 | 188 | Risk Ratio (M‐H, Fixed, 95% CI) | 1.13 [0.77, 1.64] |
| 2.2 Under 75 yrs old | 1 | 177 | Risk Ratio (M‐H, Fixed, 95% CI) | 0.73 [0.45, 1.17] |
| Outcome or subgroup title | No. of studies | No. of participants | Statistical method | Effect size |
| 1 All‐cause mortality Show forest plot | 5 | 1663 | Risk Ratio (M‐H, Fixed, 95% CI) | 0.94 [0.80, 1.11] |
| Analysis 4.1  Comparison 4 Sensitivity analyses: Outcome blinding, Outcome 1 All‐cause mortality. | ||||
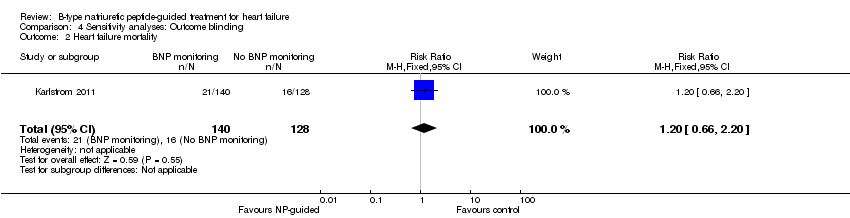
| 2 Heart failure mortality Show forest plot | 1 | 268 | Risk Ratio (M‐H, Fixed, 95% CI) | 1.2 [0.66, 2.20] |
| Analysis 4.2  Comparison 4 Sensitivity analyses: Outcome blinding, Outcome 2 Heart failure mortality. | ||||
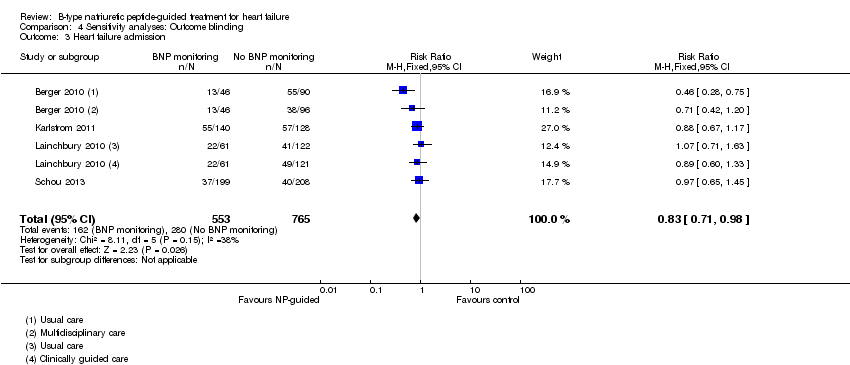
| 3 Heart failure admission Show forest plot | 4 | 1318 | Risk Ratio (M‐H, Fixed, 95% CI) | 0.83 [0.71, 0.98] |
| Analysis 4.3  Comparison 4 Sensitivity analyses: Outcome blinding, Outcome 3 Heart failure admission. | ||||
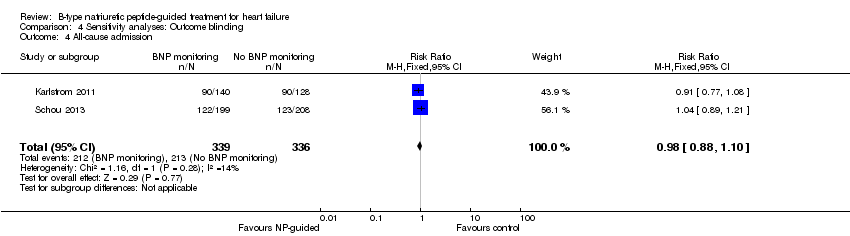
| 4 All‐cause admission Show forest plot | 2 | 675 | Risk Ratio (M‐H, Fixed, 95% CI) | 0.98 [0.88, 1.10] |
| Analysis 4.4  Comparison 4 Sensitivity analyses: Outcome blinding, Outcome 4 All‐cause admission. | ||||
| 5 Quality of life Show forest plot | 3 | 994 | Mean Difference (IV, Fixed, 95% CI) | ‐0.01 [‐1.28, 1.27] |
| Analysis 4.5  Comparison 4 Sensitivity analyses: Outcome blinding, Outcome 5 Quality of life. | ||||
| Outcome or subgroup title | No. of studies | No. of participants | Statistical method | Effect size |
| 1 All‐cause mortality Show forest plot | 7 | 1229 | Risk Ratio (M‐H, Fixed, 95% CI) | 0.83 [0.65, 1.07] |
| Analysis 5.1 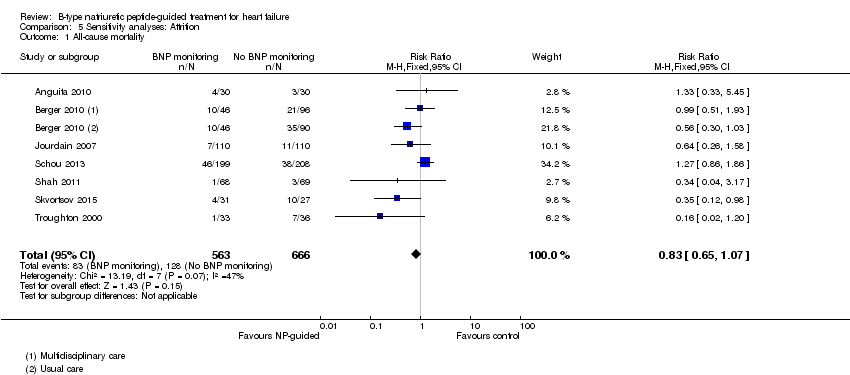 Comparison 5 Sensitivity analyses: Attrition, Outcome 1 All‐cause mortality. | ||||
| 2 Heart failure mortality Show forest plot | 4 | 533 | Risk Ratio (M‐H, Fixed, 95% CI) | 0.52 [0.26, 1.03] |
| Analysis 5.2 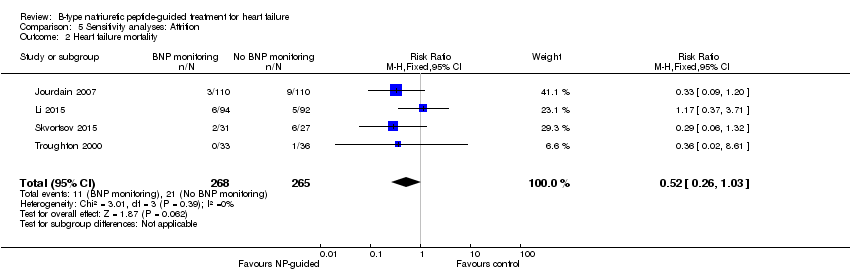 Comparison 5 Sensitivity analyses: Attrition, Outcome 2 Heart failure mortality. | ||||
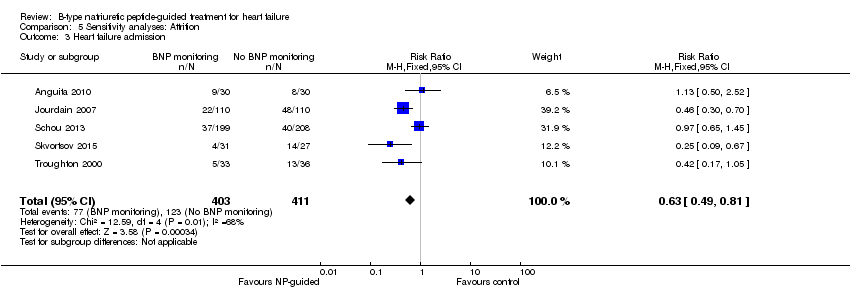
| 3 Heart failure admission Show forest plot | 5 | 814 | Risk Ratio (M‐H, Fixed, 95% CI) | 0.63 [0.49, 0.81] |
| Analysis 5.3  Comparison 5 Sensitivity analyses: Attrition, Outcome 3 Heart failure admission. | ||||
| 4 All‐cause admission Show forest plot | 4 | 833 | Risk Ratio (M‐H, Fixed, 95% CI) | 0.94 [0.83, 1.07] |
| Analysis 5.4 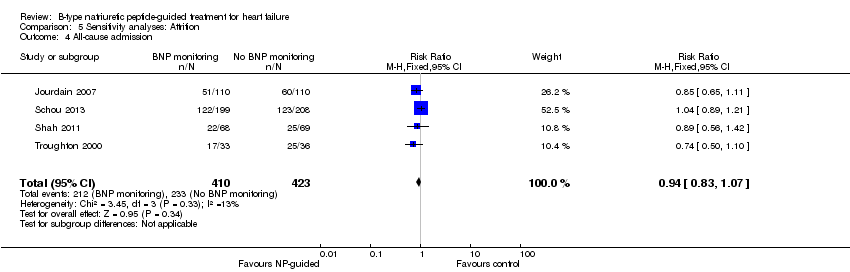 Comparison 5 Sensitivity analyses: Attrition, Outcome 4 All‐cause admission. | ||||
| 5 Quality of life Show forest plot | 3 | 534 | Mean Difference (IV, Fixed, 95% CI) | ‐0.57 [‐1.92, 0.78] |
| Analysis 5.5 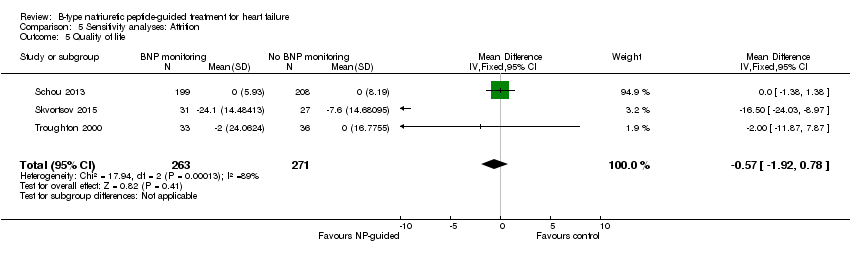 Comparison 5 Sensitivity analyses: Attrition, Outcome 5 Quality of life. | ||||
| Outcome or subgroup title | No. of studies | No. of participants | Statistical method | Effect size |
| 1 All‐cause mortality Show forest plot | 15 | 3169 | Risk Ratio (M‐H, Fixed, 95% CI) | 0.87 [0.76, 1.01] |
| Analysis 6.1  Comparison 6 Duration of FU BNP vs no BNP, Outcome 1 All‐cause mortality. | ||||
| 1.1 ≤ 1 yr | 5 | 555 | Risk Ratio (M‐H, Fixed, 95% CI) | 0.46 [0.25, 0.85] |
| 1.2 1‐2 yrs | 8 | 1842 | Risk Ratio (M‐H, Fixed, 95% CI) | 0.83 [0.69, 0.99] |
| 1.3 > 2 yrs | 2 | 772 | Risk Ratio (M‐H, Fixed, 95% CI) | 1.11 [0.87, 1.41] |
| 2 Heart failure mortality Show forest plot | 6 | 853 | Risk Ratio (M‐H, Fixed, 95% CI) | 0.84 [0.54, 1.30] |
| Analysis 6.2  Comparison 6 Duration of FU BNP vs no BNP, Outcome 2 Heart failure mortality. | ||||
| 2.1 ≤ 1 yr | 3 | 313 | Risk Ratio (M‐H, Fixed, 95% CI) | 0.64 [0.28, 1.48] |
| 2.2 1 ‐ 2 yrs | 3 | 540 | Risk Ratio (M‐H, Fixed, 95% CI) | 0.94 [0.56, 1.57] |
| 2.3 > 2 yrs | 0 | 0 | Risk Ratio (M‐H, Fixed, 95% CI) | 0.0 [0.0, 0.0] |
| 3 Heart failure admission Show forest plot | 10 | 1928 | Risk Ratio (M‐H, Fixed, 95% CI) | 0.70 [0.61, 0.80] |
| Analysis 6.3  Comparison 6 Duration of FU BNP vs no BNP, Outcome 3 Heart failure admission. | ||||
| 3.1 ≤ 1 yr | 3 | 278 | Risk Ratio (M‐H, Fixed, 95% CI) | 0.37 [0.23, 0.58] |
| 3.2 1 ‐ 2 yrs | 5 | 878 | Risk Ratio (M‐H, Fixed, 95% CI) | 0.65 [0.54, 0.79] |
| 3.3 > 2 ys | 2 | 772 | Risk Ratio (M‐H, Fixed, 95% CI) | 0.97 [0.77, 1.23] |
| 4 All‐cause admission Show forest plot | 6 | 1142 | Risk Ratio (M‐H, Fixed, 95% CI) | 0.93 [0.84, 1.03] |
| Analysis 6.4  Comparison 6 Duration of FU BNP vs no BNP, Outcome 4 All‐cause admission. | ||||
| 4.1 ≤ 1 yr | 3 | 247 | Risk Ratio (M‐H, Fixed, 95% CI) | 0.79 [0.58, 1.07] |
| 4.2 1 ‐ 2 yrs | 2 | 488 | Risk Ratio (M‐H, Fixed, 95% CI) | 0.89 [0.77, 1.03] |
| 4.3 > 2 yrs | 1 | 407 | Risk Ratio (M‐H, Fixed, 95% CI) | 1.04 [0.89, 1.21] |
| 5 Quality of life Show forest plot | 8 | 1812 | Mean Difference (IV, Fixed, 95% CI) | ‐0.03 [‐1.18, 1.13] |
| Analysis 6.5  Comparison 6 Duration of FU BNP vs no BNP, Outcome 5 Quality of life. | ||||
| 5.1 ≤ 1 yr | 5 | 561 | Mean Difference (IV, Fixed, 95% CI) | ‐3.14 [‐6.46, 0.19] |
| 5.2 1 ‐ 2 yrs | 2 | 844 | Mean Difference (IV, Fixed, 95% CI) | 1.98 [‐0.76, 4.72] |
| 5.3 > 2 yrs | 1 | 407 | Mean Difference (IV, Fixed, 95% CI) | 0.0 [‐1.38, 1.38] |
| Outcome or subgroup title | No. of studies | No. of participants | Statistical method | Effect size |
| 1 All‐cause mortality Show forest plot | 15 | 3169 | Risk Ratio (M‐H, Fixed, 95% CI) | 0.87 [0.76, 1.01] |
| Analysis 7.1 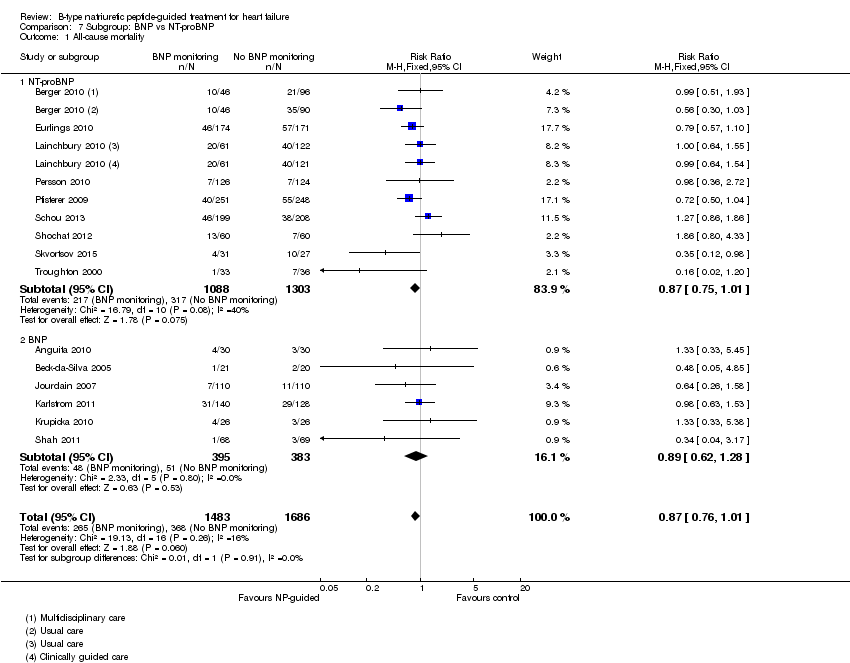 Comparison 7 Subgroup: BNP vs NT‐proBNP, Outcome 1 All‐cause mortality. | ||||
| 1.1 NT‐proBNP | 9 | 2391 | Risk Ratio (M‐H, Fixed, 95% CI) | 0.87 [0.75, 1.01] |
| 1.2 BNP | 6 | 778 | Risk Ratio (M‐H, Fixed, 95% CI) | 0.89 [0.62, 1.28] |
| 2 Heart failure mortality Show forest plot | 6 | 853 | Risk Ratio (M‐H, Fixed, 95% CI) | 0.84 [0.54, 1.30] |
| Analysis 7.2 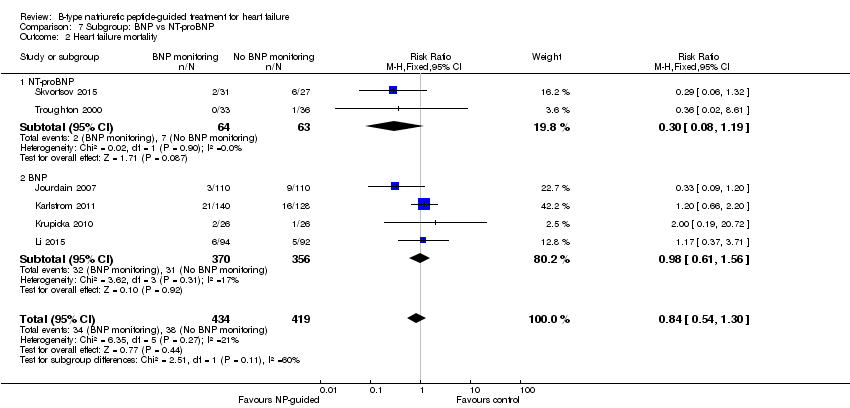 Comparison 7 Subgroup: BNP vs NT‐proBNP, Outcome 2 Heart failure mortality. | ||||
| 2.1 NT‐proBNP | 2 | 127 | Risk Ratio (M‐H, Fixed, 95% CI) | 0.30 [0.08, 1.19] |
| 2.2 BNP | 4 | 726 | Risk Ratio (M‐H, Fixed, 95% CI) | 0.98 [0.61, 1.56] |
| 3 Heart failure admission Show forest plot | 10 | 1928 | Risk Ratio (M‐H, Random, 95% CI) | 0.67 [0.53, 0.84] |
| Analysis 7.3 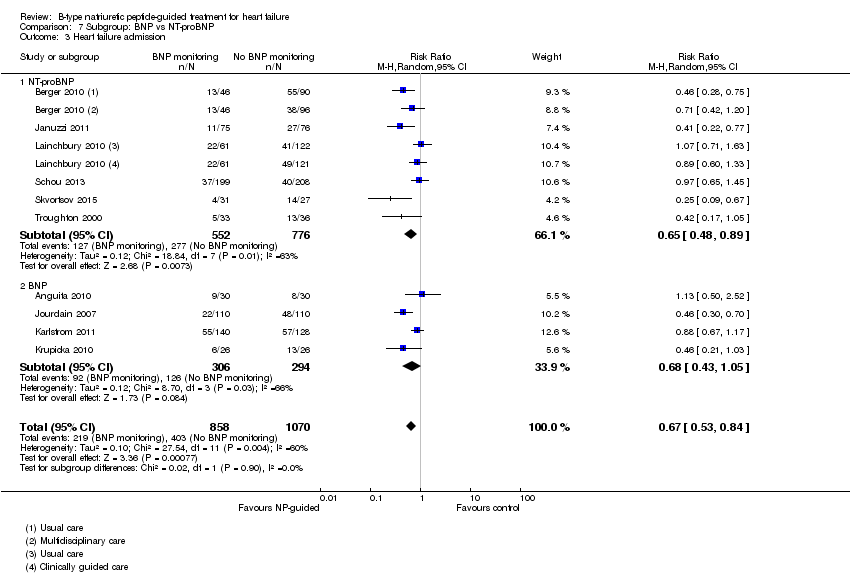 Comparison 7 Subgroup: BNP vs NT‐proBNP, Outcome 3 Heart failure admission. | ||||
| 3.1 NT‐proBNP | 6 | 1328 | Risk Ratio (M‐H, Random, 95% CI) | 0.65 [0.48, 0.89] |
| 3.2 BNP | 4 | 600 | Risk Ratio (M‐H, Random, 95% CI) | 0.68 [0.43, 1.05] |
| 4 All‐cause admission Show forest plot | 6 | 1142 | Risk Ratio (M‐H, Fixed, 95% CI) | 0.93 [0.84, 1.03] |
| Analysis 7.4  Comparison 7 Subgroup: BNP vs NT‐proBNP, Outcome 4 All‐cause admission. | ||||
| 4.1 NT‐proBNP | 2 | 476 | Risk Ratio (M‐H, Fixed, 95% CI) | 0.99 [0.85, 1.14] |
| 4.2 BNP | 4 | 666 | Risk Ratio (M‐H, Fixed, 95% CI) | 0.88 [0.77, 1.01] |
| 5 Quality of life Show forest plot | 8 | 1812 | Mean Difference (IV, Fixed, 95% CI) | ‐0.03 [‐1.18, 1.13] |
| Analysis 7.5 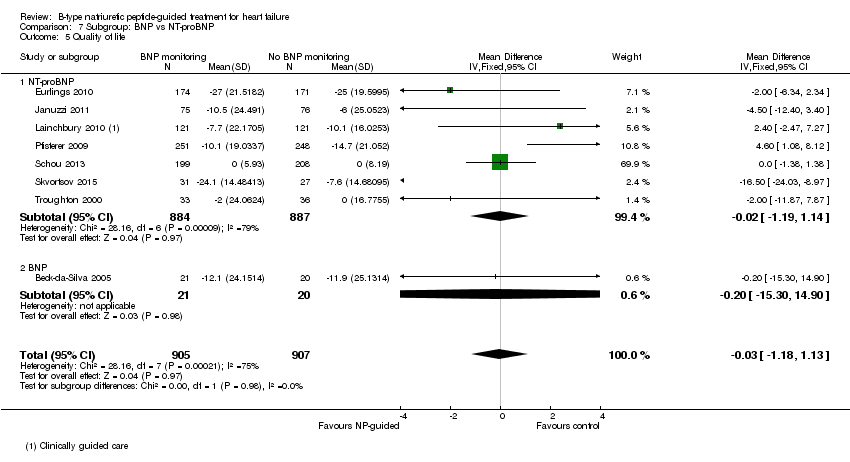 Comparison 7 Subgroup: BNP vs NT‐proBNP, Outcome 5 Quality of life. | ||||
| 5.1 NT‐proBNP | 7 | 1771 | Mean Difference (IV, Fixed, 95% CI) | ‐0.02 [‐1.19, 1.14] |
| 5.2 BNP | 1 | 41 | Mean Difference (IV, Fixed, 95% CI) | ‐0.20 [‐15.30, 14.90] |
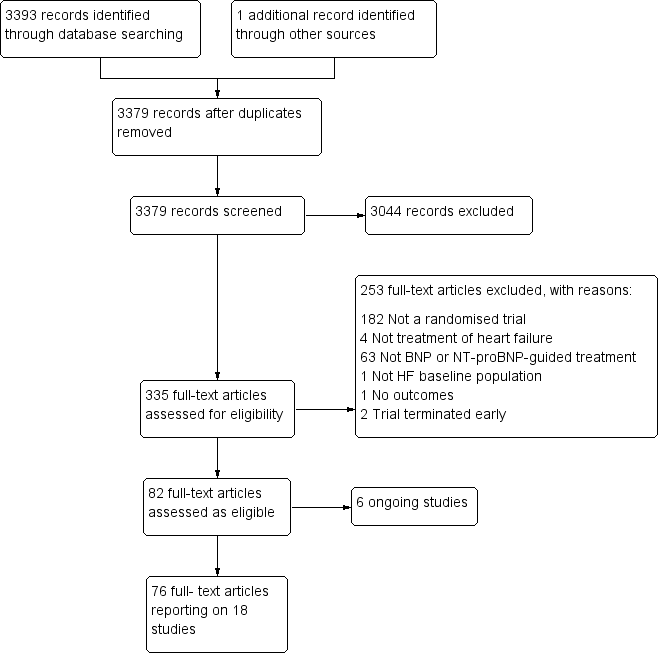
Study flow diagram.

Funnel plot of comparison: NP‐guided versus no NP‐guided treatment for all‐cause mortality.
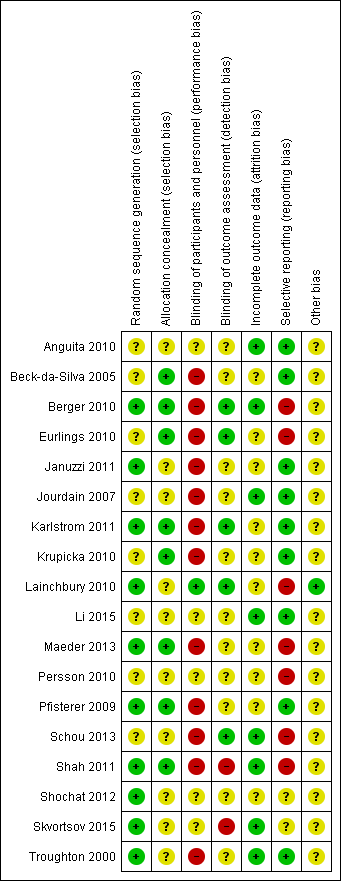
'Risk of bias' summary: review authors' judgements about methodological quality for each included study
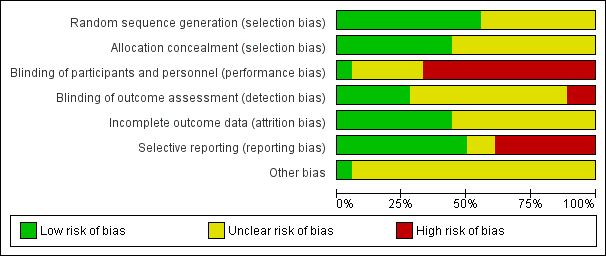
'Risk of bias' graph: review authors' judgements about methodological quality presented as percentages across all included studies.
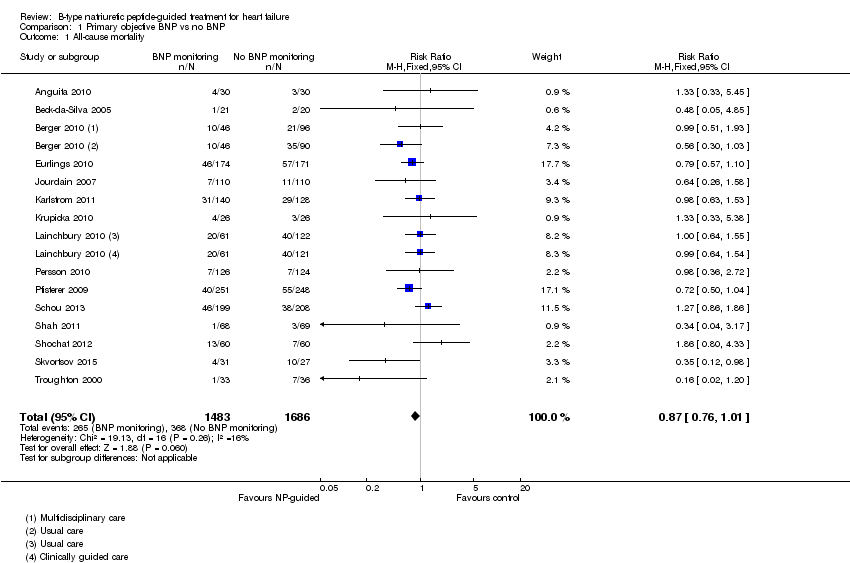
Comparison 1 Primary objective BNP vs no BNP, Outcome 1 All‐cause mortality.

Comparison 1 Primary objective BNP vs no BNP, Outcome 2 Heart failure mortality.

Comparison 1 Primary objective BNP vs no BNP, Outcome 3 Heart failure admission.

Comparison 1 Primary objective BNP vs no BNP, Outcome 4 All‐cause admission.
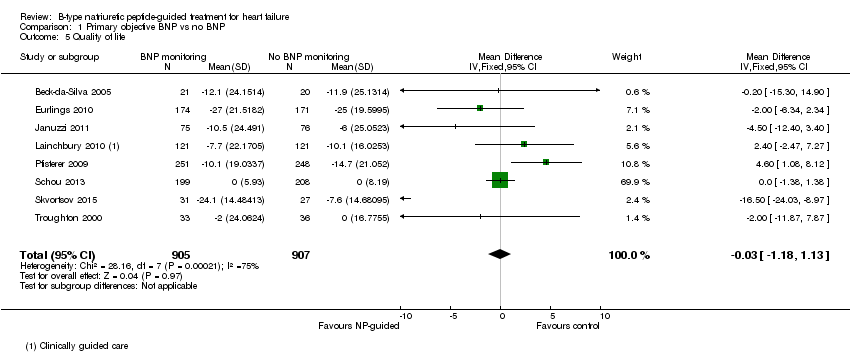
Comparison 1 Primary objective BNP vs no BNP, Outcome 5 Quality of life.

Comparison 2 Clincal vs UC in primary objectives, Outcome 1 All‐cause mortality.
Comparison 2 Clincal vs UC in primary objectives, Outcome 2 Heart failure mortality.
Comparison 2 Clincal vs UC in primary objectives, Outcome 3 Heart failure admission.
Comparison 2 Clincal vs UC in primary objectives, Outcome 4 All‐cause admission.

Comparison 2 Clincal vs UC in primary objectives, Outcome 5 Quality of life.

Comparison 3 Subgroup analyses, Outcome 1 All‐cause mortality and age.
Comparison 3 Subgroup analyses, Outcome 2 Heart failure admission and age.

Comparison 4 Sensitivity analyses: Outcome blinding, Outcome 1 All‐cause mortality.
Comparison 4 Sensitivity analyses: Outcome blinding, Outcome 2 Heart failure mortality.
Comparison 4 Sensitivity analyses: Outcome blinding, Outcome 3 Heart failure admission.
Comparison 4 Sensitivity analyses: Outcome blinding, Outcome 4 All‐cause admission.

Comparison 4 Sensitivity analyses: Outcome blinding, Outcome 5 Quality of life.

Comparison 5 Sensitivity analyses: Attrition, Outcome 1 All‐cause mortality.

Comparison 5 Sensitivity analyses: Attrition, Outcome 2 Heart failure mortality.
Comparison 5 Sensitivity analyses: Attrition, Outcome 3 Heart failure admission.

Comparison 5 Sensitivity analyses: Attrition, Outcome 4 All‐cause admission.

Comparison 5 Sensitivity analyses: Attrition, Outcome 5 Quality of life.
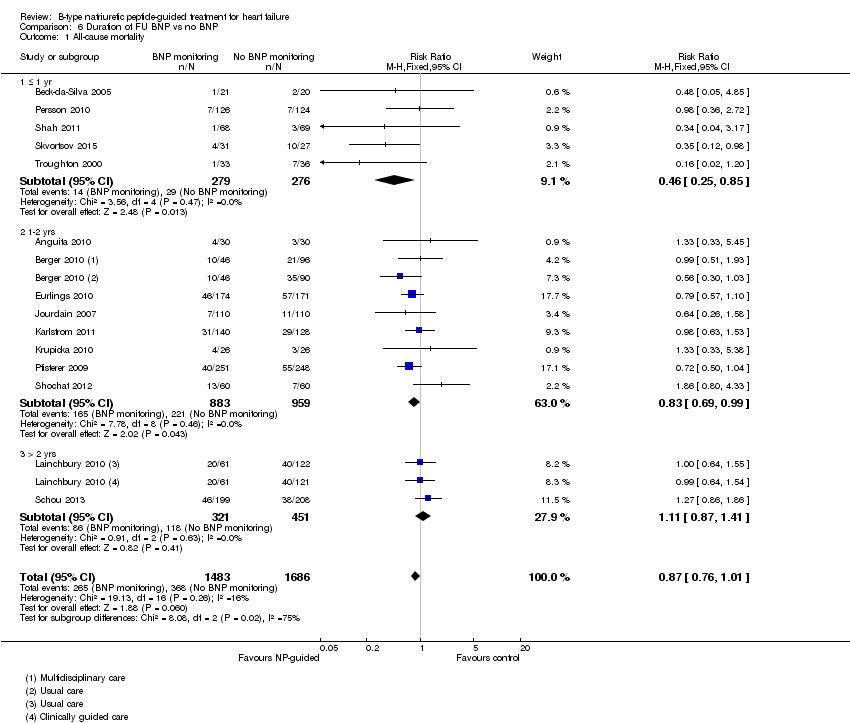
Comparison 6 Duration of FU BNP vs no BNP, Outcome 1 All‐cause mortality.
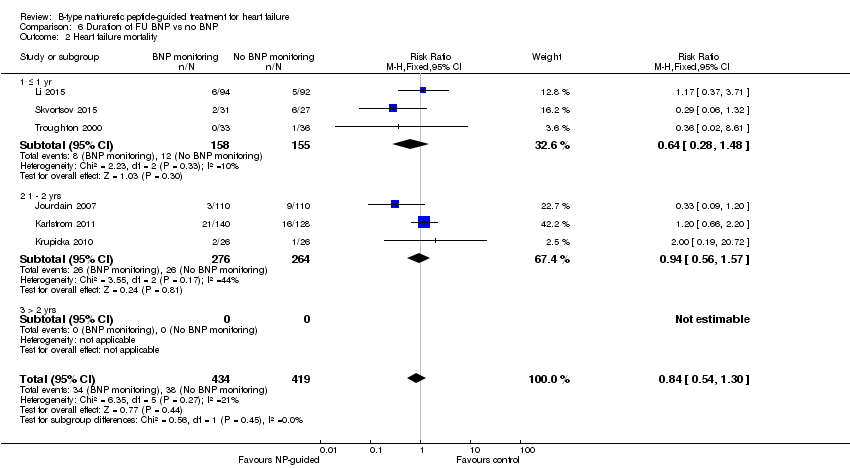
Comparison 6 Duration of FU BNP vs no BNP, Outcome 2 Heart failure mortality.

Comparison 6 Duration of FU BNP vs no BNP, Outcome 3 Heart failure admission.
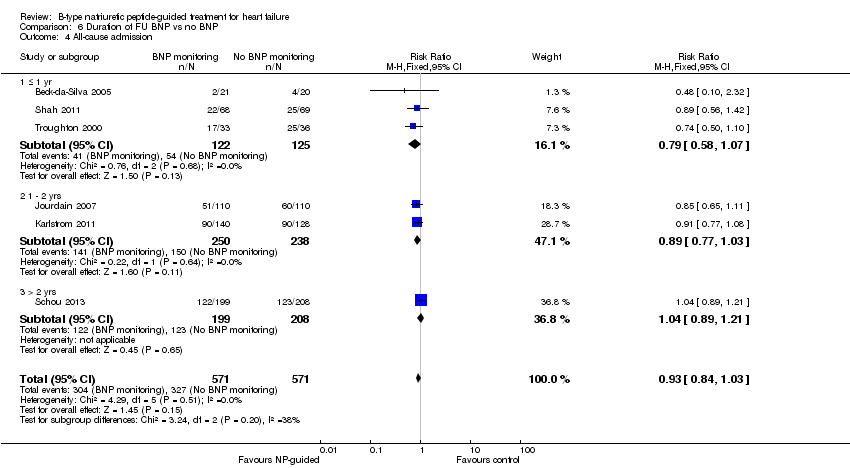
Comparison 6 Duration of FU BNP vs no BNP, Outcome 4 All‐cause admission.
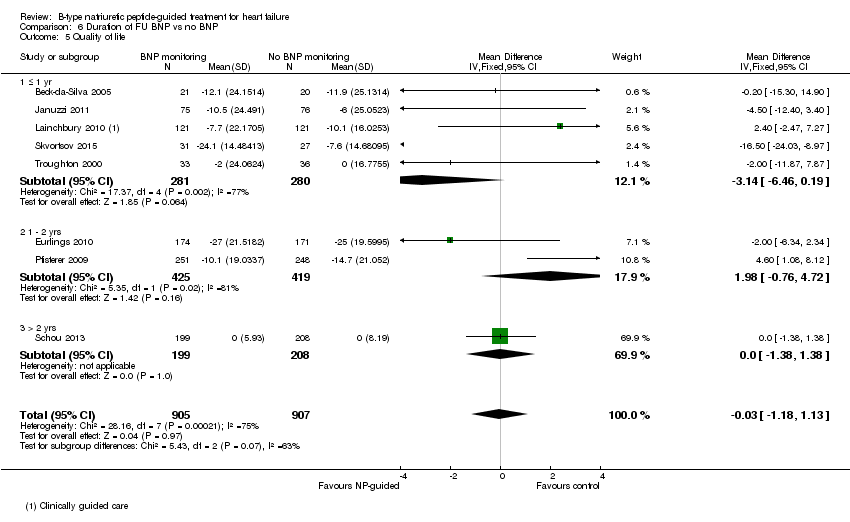
Comparison 6 Duration of FU BNP vs no BNP, Outcome 5 Quality of life.

Comparison 7 Subgroup: BNP vs NT‐proBNP, Outcome 1 All‐cause mortality.

Comparison 7 Subgroup: BNP vs NT‐proBNP, Outcome 2 Heart failure mortality.

Comparison 7 Subgroup: BNP vs NT‐proBNP, Outcome 3 Heart failure admission.

Comparison 7 Subgroup: BNP vs NT‐proBNP, Outcome 4 All‐cause admission.

Comparison 7 Subgroup: BNP vs NT‐proBNP, Outcome 5 Quality of life.
| Does treatment guided by serial BNP or NT‐proBNP monitoring improve outcomes compared to treatment guided by clinical assessment alone? | ||||||
| Patient or population: patients with heart failure | ||||||
| Outcomes | Illustrative comparative risks* (95% CI) | Relative effect | No of Participants | Quality of the evidence | Comments | |
| Assumed risk | Corresponding risk | |||||
| No BNP or NT‐proBNP‐guided treatment | Serial BNP or NT‐proBNP‐guided treatment | |||||
| All‐cause mortality | 218 per 1000 | 190 per 1000 | RR 0.87 | 3169 | ⊕⊕⊝⊝ | 16 studies reported on all‐cause mortality (n = 3292), but only 15 studies are included in the meta‐analysis (n = 3169). For one study data could not be extracted or obtained in a format useable in the review. Funnel plot analysis suggests possible lack of small studies (beneficial control effect). Insufficient to justify downgrading the quality of evidence. |
| Heart failure mortality | 91 per 1000 | 76 per 1000 | RR 0.84 | 853 | ⊕⊕⊝⊝ | |
| Heart failure admissions | 377 per 10002 | 264 per 1000 | RR 0.70 | 1928 | ⊕⊕⊝⊝ | |
| All‐cause admissions | 573 per 10002 | 533 per 1000 | RR 0.93 | 1142 | ⊕⊕⊝⊝ | |
| Adverse events | See comment | See comment | Not estimable | 1144 | ⊕⊕⊝⊝ | 3/6 studies commented on the difference between the intervention and control groups: no significant difference in one and two favoured the intervention group |
| Cost | See comment | See comment | Not estimable | 1051 | ⊕⊕⊝⊝ | 3/4 studies suggested reduced cost in the intervention groups. One study suggested NP‐guided treatment was unlikely to be cost‐effective. |
| Quality of life | The mean quality of life ranged across control groups from | The mean quality of life in the intervention groups was | 1812 | ⊕⊝⊝⊝ | Lower score indicates better quality of life | |
| *The basis for the assumed risk (e.g. the median control group risk across studies) is provided in footnotes. The corresponding risk (and its 95% confidence interval) is based on the assumed risk in the comparison group and the relative effect of the intervention (and its 95% CI). | ||||||
| GRADE Working Group grades of evidence | ||||||
| 1 The comparisons (controls) fell into two groups: same as the intervention without BNP or NT‐proBNP measures or usual care | ||||||
| Study | Participants treated in community or secondary care | Baseline NYHA classification (stages I ‐ IV) | Baseline left ventricular ejection fraction (LVEF, %) | |||||
| Study inclusion criteria | Intervention group | Control group | Comment in text | Study inclusion criteria | Intervention group (mean, SD unless stated) | Control group (mean, SD unless stated) | ||
| Hospital | Stage ≥ III | Stage III 73%, IV 27% | Stage III 63%, IV 37% | Not inclusion criterion | 44 (18) | 46 (18) | ||
| Hospital (outpatient) | Stages II ‐ III | 2.6 ± 0.7 (mean, SD) | 2.4 ± 0.6 (mean, SD) | <40% | 23.8 ± 8.8 | 20.9 ± 9.2 | ||
| Hospital & community | Stages III ‐ IV | Not stated | Not stated | <40% | NS | NS | ||
| Hospital | Not inclusion criterion | Stage I = 11.5%, II = 64.9%, III = 23.6% | stage I = 9.9%, II = 70.8%, III = 19.3% | Not inclusion criterion | 34.9 ± 13.7 | 36.7 ± 14.8 | ||
| Hospital | Stages II ‐ IV | Stage II or III = 85.5% | Stage II or III = 84.2% | ≤ 40% | 28 ± 8.7 | 25.9 ± 8.3 | ||
| Hospital (outpatient) | Stages II ‐ III | 2.29 ±0.6 (mean, SD) | 2.21 ± 0.62 (mean, SD) | <45% | 29.9 ± 7.7 | 31.8 ± 8.4 | ||
| Hospital | Stages II ‐ IV | Stage II = 32%, III = 52%, IV = 15% | Stage II = 27%, III = 59%, IV = 14% | <40% | <30% = 57% | <30% = 58% | ||
| Hospital | Stages III ‐ IV | 2.1 (0.3) (mean, SD) | 2.1 (0.3) (mean, SD) | ≤ 45% | 36.1% (7.2) | 32.3% (9.6) | ||
| Hospital & community | Not inclusion criterion | NT‐proBNP group: stage I 12%, II 68%, III 18%, IV 2% | Clinically‐guided group: Stage I 7%, II 66%, III 25%, IV 2%; Usual care: stage I 7%, II 67%, III 25%, IV 1% | Not inclusion criterion though deliberated included patients with preserved LVEF | 40 ±15 | CG = 39 ± 15, UC = 37 ± 15 | ||
| Hospital | Stages III ‐ IV | NS | NS | Not inclusion criterion | 30 ± 8.1 | 28 ± 7.9 | ||
| Hospital (outpatient) | Stages ≤ II | 49 (83) ≥ III (median, IQR) | 53 (83) ≥ III (median, IQR) | 'symptoms improved similarly' (at 6 months) | > 45% | 56 ± 6 | 56 ± 7 | |
| Community | Stage II ‐ IV | Stage II 62%, III 38% | Stage II 61%, III 39% | 'Improvements in NYHA class and dyspnoea symptoms were seen in both allocation groups, but with no significant differences between the groups' | <50% | 31 (9) | 33 (7) | |
| Hospital (outpatient) | Stages ≤ II | 186 ≥ III (n) | 185 ≥ III (n) | ≤ 45% | 29.8 (7.7) | 29.7 (7.9) | ||
| Hospital | Not inclusion criterion | Stage I ‐ II 86 % | Stage I ‐ II 85 % | <45% | 30 (14‐45) median (range) | 30 (15‐45) median (range) | ||
| Hospital | Stage III ‐ IV | Authors have no data for baseline NYHA | Authors have no data for baseline NYHA | <35% | 20 (15‐25) median (range) | 20 (15‐25) median (range) | ||
| Hospital | Not stated | 2.53 (mean) | 2.34 (mean) | Not inclusion criterion | 23 (6) | 23 (7) | ||
| Hospital (outpatient) | Stage III ‐ IV | Stage III 23%, IV 76% | Stage III 26%, IV 74% | At hospital admission | <40% | 29.2 (6.1) | 29.4 (6.1) | |
| Hospital | Stages II ‐ IV | Stage II 72%, overall 2.3 (mean) | Stage II 67%, overall 2.3 (mean) | <40% | 28 | 26 | ||
| Study | Target BNP/NT‐proBNP (pg/mL, unless stated) | Baseline BNP or NT‐proBNP measurement (units in pg/mL and given as mean (SD), unless stated) | BNP/NT‐proBNP drop (as % of baseline) (units in pg/mL and given as mean (SD), unless stated) | ||||
| Biomarker | Study inclusion criteria | Intervention group | Control group | Comment in text | |||
| 100 | BNP | No inclusion threshold | 57 (77) | 65 (97) | No percentage drop reported. BNP at 18 months follow‐up: BNP‐guided group 14 (20); control group 111 (71) | ||
| No target set/stated | BNP | No inclusion threshold | 502.3 (411.3) | 701.6 (409.9) | No percentage drop reported. BNP at follow‐up: control arm 626.8 (325.8); BNP arm 477.8 (406.9) | ||
| < 2200 NT = proBNP (reported in IPD analysis by Troughton 2014) | NT‐proBNP | No inclusion threshold | 2216 (355‐9649) mean (95% CI) | Multidisplinary care 2469 (355 ‐18487; Usual care 2359 (355 ‐15603) mean (95% CI) | No percentage drop reported. NT ‐proBNP change from baseline to FU graphically shown in Berger 2010 (Figure 4). Decrease in NT‐proBNP more apparent in NT‐proBNP‐guided group than multidisplinary group. No decrease in usual care group | ||
| Set individually for each participant as the lowest level at discharge or at 2 weeks follow‐up | NT‐proBNP | NT‐proBNP levels at admission: minimum 1,700 pg/ml. Additionally NT‐proBNP levels during hospitalisation, defined as a decrease of more than 10%, with a drop in NT‐proBNP levels of at least 850 pg/ml, from admission to discharge. | 2961 (1383 ‐ 5144) median (IQR) | 2936 (1291‐5525) median (IQR) | Outcome data available by subgroup baseline BNP (above or below discharge NT‐proBNP 2950 pg/ml) | No percentage drop reported. Median (IQR) at 12 months follow‐up: NT‐proBNP‐guided group ‐432 (‐1392 to 297); Clincially‐guided group ‐572 (‐1329 to 434). | |
| ≤ 1000 | NT‐proBNP | No inclusion threshold | 2344 (median) | 1946 (median) | No percentage drop reported. Median NT‐proBNP at follow‐up: Standard care group 1844 (P = 0.61 follow‐up vs baseline); NT‐proBNP‐guided group 1125 (P = 0.01 vs baseline) | ||
| < 100 | BNP | No inclusion threshold | 352 (260) mean (SD) | Not measured | No percentage drop reported. BNP‐guided group only shown graphically in Jourdain 2007 (figure 5): mean BNP level drops over time and % of patients achieving target increases. | ||
| <150 ng/L in patients under 75; <300 ng/L in patients over 75 yrs | BNP | No inclusion threshold | 808.2 (676.1) ng/L, mean (SD) | 898.9 (915.3 ng/L, mean (SD) | No percentage drop reported. BNP at follow‐up: control group 457 (603), BNP‐guided group 403 (468) | ||
| <100 | BNP | No inclusion threshold | 704 (228‐2852) median (range) | 633 (276‐3756) median (range) | No percentage drop reported. In the BNP group 90% of patients manage to reduce BNP to <400 pg/mL; of this 90%, 2/3 of patients to achieve <100 pg/mL. Email from author "We do not have BNP values of the Clinical group at the end of follow‐up. Median BNP value after 6 months in BNP group was 235pg/ml. (At hospital discharge 704pg/ml; after 1 month 328.5pg/ml; after 3 months 253pg/ml)." | ||
| < 150 µmol/L | NT‐proBNP | No inclusion threshold | 2012 (516‐10233) median (IQR) | Clinically‐guided group: 1996 (425‐6588); Usual care: 2012 (425‐10571) median (IQR) | No percentage drop reported. No follow‐up data. Comment in text 'Plasma NT‐proBNP levels fell similarly within 6 months of randomisation in both the NT‐proBNP and CG groups (by 20% and 23%, respectively; P 0.001)'. | ||
| 50% of basal level or < 300 | BNP | No inclusion threshold | 1167.8 (219.9) mean (SD) | 1145.8 (224.9) mean (SD) | No percentage drop reported. Change in BNP level shown in Figure 2 (Li 2015). 'BNP value decreased dramatically over the duration of medication, but there was no difference between the two groups.' | ||
| < 400 in patients younger than 75 years; < 800 in patients aged 75 years or older | NT‐proBNP | N‐terminal BNP level of 400 pg/mL or higher in patients younger than 75 years and a level of 800 pg/mL or higher in patients aged 75 years or older | 2210 (1514‐4081) ng/L, median (IQR) | 2191 (1478‐4890) ng/L, median (IQR) | Maeder 2013 reports: 'NT‐proBNP was reduced similarly in patients allocated to NT‐proBNP‐guided or symptom‐guided management. The proportion of patients with NT‐proBNP below the target was low throughout the study period and did not significantly differ between groups (Figure 2C) although it tended to be lower in the NT‐proBNP‐guided group. | ||
| At least a 50% reduction from baseline NT‐proBNP | NT‐proBNP | Elevated NT‐proBNP levels (males > 800 ng/L, females > 1000 ng/L) | 2661 (2.1) ng/L, geometric mean(coefficient of variation, %) | 2429 (2.1) ng/L, geometric mean(coefficient of variation, %) | No percentage drop reported. Geometric Mean (SD) at follow‐up: NT‐proBNP‐guided group ‐ 301 ng/L to 2360 ng/L; control group ‐362 ng/L to 2067 ng/L. Comment in text 'similar modest decrease ( 10%) in NT‐proBNP from baseline to end‐of study was observed in both groups……NT‐proBNP levels were reduced by .50% in 24 (19%) and 27 (22%), of patients with and without NT‐proBNP‐guided treatment, respectively'. | ||
| < 400 in patients younger than 75 years; < 800 in patients aged 75 years or older | NT‐proBNP | N‐terminal BNP level of 400 pg/mL or higher in patients younger than 75 years and a level of 800 pg/mL or higher in patients aged 75 years or older | 3998 (2075‐7220) median (IQR) | 4657 (2455‐7520) median (IQR) | No percentage drop reported. No follow‐up data. Pfisterer 2009 (figure 3b) graphically shows data for NT‐proBNP changes over 6 months (by age). Comment in text 'There were no significant differences between the 2 treatment groups by by N‐terminal BNP level (P=.06 vs P=.30).' | ||
| No target set/stated | NT‐proBNP | NT‐proBNP ≥ 1000 pg/mL after up‐titration (i.e. at the randomisation visit) | 1884 (1033‐10435) average statistic not stated) | 2042 (1023‐9668) average statistic not stated | No percentage drop reported. Change in NT‐proBNP during follow‐up: NT‐proBNP‐guided group ‐129 (‐722 to 674) median (IQR); Clinically managed group ‐26 (‐681 to 751) median (IQR). Comment in text: 'Patients in whom NT‐proBNP increased ≤ 30% during the follow up period had a higher frequency of admission (69% vs. 47%, P = 0.002), a higher number of admission days (median) (14 days vs. 5 days, P= 0.003), a higher number of admissions (median) (2 vs. 1, P = 0.009), a lower quality of life (mean difference) (6 points, P = 0.032), and a poorer functional class (37% vs. 18% in functional class III–IV, P = 0.001).' | ||
| Discharge BNP | BNP | No inclusion threshold | 453 (221‐1135) median (IQR) | 440 (189 ‐981) median (IQR) | No percentage drop reported. Median (IQR) BNP at follow‐up: BNP‐guided group 412.5 (111,894); control (congestion score) group 471 (235.5, 1180) | ||
| No target set/stated | NT‐proBNP | Email from author confirmed 'NT‐ProBNP > 2000 at day of randomisation' | 5868 (2532) | 5820 (2434) | No percentage drop reported. | ||
| <1000 pg/mL or at least 50% reduction from baseline NT‐proBNP at discharge | NT‐proBNP | > 1400 pg/mL at hospital admission | 3750 (2224‐ 6613) median (IQR) | 2783.0 (2021.5‐ 4827.5) median (IQR) | At hospital discharge | At 6 months: NT‐proBNP‐guided group: 53% (Median drop (QR): 1585.5 (976.6, 2742.5)) Control group: 10.2% (median (IQR): 2189.0 (1954.0, 3688.5)) | |
| 200 µmol/L | NT‐proBNP | No inclusion threshold | 217 µmol/L, mean | 251 µmol/l, mean | No percentage drop reported. At 6 months follow‐up: Nt‐proBNP‐guided group decreased by 79 pmol/L, mean; clinically‐guided group decreased by 3 pmol/L, mean (P = 0.16) | ||
| Study | Adverse events | |||||||||
| Participants (N) | Missing participants (N) | Number of adverse events (definitions not consistent or not stated; not clear whether first event per participant or every event) | Additional data either from published articles or supplied by author | |||||||
| Intervention group | Control group | Total | Intervention group | Control group | Total | Intervention group | Control group | Total | ||
| 75 | 76 | 151 | 6 | 6 | 12 | 30 | 23 | 53 | No significant differences between groups. No specific event showed a significant difference between groups Events in intervention group: Abdominal pain (1); acute renal failure (4); anaemia (1); atrial fibrillation (2); cough (2); diarrhoea (2); dizziness (5); fever (1); gastrointestinal bleeding (1); hyper/hypokalaemia (3); hypotension (4); respiratory infection (2); syncope(2) Events in control group: Abdominal pain (1); acute renal failure (3); anaemia (0); atrial fibrillation (5); cough (1); diarrhoea (1); dizziness (4); fever (1); gastrointestinal bleeding (1); hyper/hypokalaemia (1); hypotension (0); respiratory infection (4); syncope(1) | |
| 26 | 26 | 52 | 0 | 0 | 0 | 7 | 0 | 7 | Email from author 17.10.14 confirmed: Hyperkalaemia (n = 2); orthostatic hypotension (n = 2); bradycardia (n = 3) | |
| 59 | 64 | 123 | 12 | 12 | 24 | Not reported | Not reported | 66 | Maeder 2013 reported: "58% of the patients in the NT‐proBNP‐guided and 50% in the symptom‐guided group had at least one SAE (p=0.32). SAE’s related to renal failure (14% versus 2%, p=0.01) were more common in the NT‐proBNP‐guided group, whereas hypotension tended to be less common (0% versus 8%, p=0.06)." No additional information | |
| 126 | 124 | 250 | 8 | 7 | 15 | 42 | 39 | 81 | No additional information provided | |
| 251 | 248 | 499 | 32 | 29 | 61 | 123 | 113 | 236 | P = 0.47 Renal impairment: intervention group n = 4, control group n = 5 (P = 0.64) Hypotension: intervention group n = 6, control group n = 3 (P = 0.22) No other type of adverse event described. Adverse events ≥ 75 years old patients: intervention group 10.5% vs control group 5.5% (P = 0.12) Adverse events in < 75 years old patients: intervention group 3.7% vs. control group 4.9% (P = 0.74) | |
| 33 | 36 | 69 | 0 | 0 | 0 | 13 | 9 | 22 | P = 0.32 No additional information provided | |
| Outcome | Studies(N) | Participants (n) | Risk ratio | 95% Confidence intervals | |
| Outcome blinding (low risk of bias studies only) | |||||
| All‐cause mortality | 5 | 1663 | 0.94 | 0.80 to 1.11 | |
| Heart failure mortality | 1 | 268 | 1.20 | 0.66 to 2.20 | |
| Heart failure admission | 4 | 1318 | 0.83 | 0.71 to 0.98 | |
| All‐cause admission | 2 | 675 | 0.98 | 0.88 to 1.10 | |
| Quality of life | 3 | 994 | ‐0.01 | ‐1.28 to 1.27 | |
| Incomplete data (low risk of bias studies only) | |||||
| All‐cause mortality | 7 | 1229 | 0.83 | 0.65 to 1.07 | |
| Heart failure mortality | 4 | 533 | 0.52 | 0.26 to 1.03 | |
| Heart failure admission | 5 | 814 | 0.63 | 0.49 to 0.81 | |
| All‐cause admission | 4 | 833 | 0.94 | 0.83 to 1.07 | |
| Quality of life | 3 | 534 | ‐0.57 | ‐1.92 to 0.78 | |
| Outcome | Review | Number of RCTs | N | Summary measure (hazard ratio HR, risk ratio RR, odds ratio OR, weighted mean difference WMD) | 95% Confidence intervals | p‐value | Heterogeneity (I2) | |
| All‐cause mortality (all patients) | 6 | 1627 | HR | 0.69 | 0.55 to 0.86 | Not reported | Not reported | |
| 8 | 1726 | RR | 0.76 | 0.63 to 0.91 | 0.003 | Not reported | ||
| 11 | 2414 | RR | 0.83 | 0.69 to 0.99 | 0.0.35 | 0% | ||
| 12 | 2686 | OR | 0.74 | 0.6 to 0.91 | 0.005 | 0% | ||
| Not reported | Not reported | RR | 0.79 | 0.67 to 0.92 | 0.004 | Not reported | ||
| 10 | 2280 | HR | 0.82 | 0.67 to 1.00 | 0.05 | 0% | ||
| 14 | 3004 | RR | 0.94 | 0.81 to 1.08 | 0.39 | 3% | ||
| This review | 15 | 3169 | RR | 0.87 | 0.76 to 1.01 | 0.06 | 16% | |
| Heart failure admission | 7 | 1190 | RR | 0.65 | 0.5 to 0.84 | 0.001 | 52.30% | |
| 8 | 1920 | OR | 0.55 | 0.4 to 0.77 | <0.0001 | 58.20% | ||
| Not reported | Not reported | RR | 0.67 | 0.46 to 0.97 | 0.03 | Not reported | ||
| 11 | 2431 | HR | 0.74 | 0.60 to 0.90 | 0.002 | 24.00% | ||
| 11 | 2572 | RR | 0.79 | 0.63 to 0.98 | 0.03 | 67.00% | ||
| This review | 10 | 1928 | RR | 0.7 | 0.61 to 0.80 | <0.0001 | 60.00% | |
| All‐cause admission | 3 | 330 | RR | 0.82 | 0.64 to 1.05 | 0.12 | Not reported | |
| 5 | 1108 | OR | 0.8 | 0.63‐ 1.02 | 0.077 | 0% | ||
| 7 | 1627 | RR | 0.97 | 0.89 to 1.07 | 0.56 | 8% | ||
| This review | 6 | 1142 | RR | 0.93 | 0.84 to 1.03 | 0.15 | 0% | |
| Adverse events | Not reported | Not reported | RR | 1.15 | 0.99 to 1.342 | 0.69 | Not reported | |
| Adverse events (symptomatic hypotension) | 4 | 838 | RR | 1.72 | 0.59 to 5.05 | 0.32 | 43% | |
| Adverse events (hyper/hypokalemia) | 2 | 354 | RR | 1.34 | 0.42 to 4.34 | 0.62 | 0% | |
| Adverse events (renal dysfunction) | 3 | 769 | RR | 1.46 | 0.34 to 6.24 | 0.21 | 0% | |
| Adverse events (severe cough) | 2 | 220 | RR | 1.93 | 0.69 to 5.37 | 0.21 | 0% | |
| Quality of life | 5 | 1172 | WMD | ‐1.29 | ‐3.81 to 1.22 | 0.31 | 49% | |
| This review | 8 | 1812 | WMD | ‐0.03 | ‐1.18 to 1.13 | 0.97 | 75% | |
| Outcome | Review | Number of RCTs | N | Summary measure (hazard ratio HR, risk ratio RR, odds ratio OR, weighted mean difference WMD) | 95% Confidence intervals | P value | Heterogeneity (I2) | |
| All‐cause mortality (< 75 years) | 2 | 741 | RR | 0.52 | 0.33 to 0.82 | 0.005 | Not reported | |
| This review | 3 | 420 | RR | 0.73 | 0.49 to 1.10 | 0.13 | 58% | |
| All‐cause mortality (> 75 years) | 2 | 741 | RR | 0.94 | 0.71 to 1.25 | 0.7 | Not reported | |
| This review | 3 | 410 | RR | 1.23 | 0.96 to 1.57 | 0.1 | 58% | |
| All‐cause mortality (< 72 years) | 7 | Not reported | RR | 0.82 | 0.58 to 1.17 | Not reported | 0% | |
| All‐cause mortality (≥ 72 years) | 7 | Not reported | RR | 0.96 | 0.83 to 1.13 | Not reported | 24% | |
| Heart failure admission (<70 years) | Not reported | Not reported | RR | 0.45 | 0.33 to 0.61 | < 0.0001 | 0% | |
| Not reported | Not reported | RR | 0.44 | 0.31 to 0.63 | Not reported | Not reported | ||
| Heart failure admission (>70 years) | Not reported | |||||||
| Not reported | Not reported | RR | 0.89 | 0.74 ‐ 1.07 | Not reported | Not reported | ||
| All‐cause admission (< 72 years) | 5 | Not reported | RR | 0.61 | 0.41 to 0.93 | Not reported | 65% | |
| All‐cause admission (≥ 72 years) | 6 | Not reported | RR | 0.95 | 0.79 to 1.14 | Not reported | 38% | |
| All‐cause admission (< 72 years) | 4 | Not reported | RR | 0.88 | 0.77 to 1.00 | Not reported | 0% | |
| Outcome or subgroup title | No. of studies | No. of participants | Statistical method | Effect size |
| 1 All‐cause mortality Show forest plot | 15 | 3169 | Risk Ratio (M‐H, Fixed, 95% CI) | 0.87 [0.76, 1.01] |
| 2 Heart failure mortality Show forest plot | 6 | 853 | Risk Ratio (M‐H, Fixed, 95% CI) | 0.84 [0.54, 1.30] |
| 3 Heart failure admission Show forest plot | 10 | 1928 | Risk Ratio (M‐H, Fixed, 95% CI) | 0.70 [0.61, 0.80] |
| 4 All‐cause admission Show forest plot | 6 | 1142 | Risk Ratio (M‐H, Fixed, 95% CI) | 0.93 [0.84, 1.03] |
| 5 Quality of life Show forest plot | 8 | 1812 | Mean Difference (IV, Fixed, 95% CI) | ‐0.03 [‐1.18, 1.13] |
| Outcome or subgroup title | No. of studies | No. of participants | Statistical method | Effect size |
| 1 All‐cause mortality Show forest plot | 15 | 3169 | Risk Ratio (M‐H, Fixed, 95% CI) | 0.87 [0.76, 1.01] |
| 1.1 Clinical assessment | 15 | 2850 | Risk Ratio (M‐H, Fixed, 95% CI) | 0.89 [0.76, 1.04] |
| 1.2 Usual care | 2 | 319 | Risk Ratio (M‐H, Fixed, 95% CI) | 0.79 [0.56, 1.13] |
| 2 Heart failure mortality Show forest plot | 6 | 853 | Risk Ratio (M‐H, Fixed, 95% CI) | 0.84 [0.54, 1.30] |
| 2.1 Clinical assessment | 6 | 853 | Risk Ratio (M‐H, Fixed, 95% CI) | 0.84 [0.54, 1.30] |
| 2.2 Usual care | 0 | 0 | Risk Ratio (M‐H, Fixed, 95% CI) | 0.0 [0.0, 0.0] |
| 3 Heart failure admission Show forest plot | 10 | 1928 | Risk Ratio (M‐H, Fixed, 95% CI) | 0.70 [0.61, 0.80] |
| 3.1 Clinical assessment | 10 | 1609 | Risk Ratio (M‐H, Fixed, 95% CI) | 0.70 [0.60, 0.81] |
| 3.2 Usual care | 2 | 319 | Risk Ratio (M‐H, Fixed, 95% CI) | 0.72 [0.53, 0.99] |
| 4 All‐cause admission Show forest plot | 6 | 1142 | Risk Ratio (M‐H, Fixed, 95% CI) | 0.93 [0.84, 1.03] |
| 4.1 Clinical assessment | 6 | 1142 | Risk Ratio (M‐H, Fixed, 95% CI) | 0.93 [0.84, 1.03] |
| 4.2 Usual care | 0 | 0 | Risk Ratio (M‐H, Fixed, 95% CI) | 0.0 [0.0, 0.0] |
| 5 Quality of life Show forest plot | 8 | 1812 | Mean Difference (IV, Fixed, 95% CI) | ‐0.03 [‐1.18, 1.13] |
| 5.1 Clincial assessment | 8 | 1812 | Mean Difference (IV, Fixed, 95% CI) | ‐0.03 [‐1.18, 1.13] |
| 5.2 Usual care | 0 | 0 | Mean Difference (IV, Fixed, 95% CI) | 0.0 [0.0, 0.0] |
| Outcome or subgroup title | No. of studies | No. of participants | Statistical method | Effect size |
| 1 All‐cause mortality and age Show forest plot | 3 | 830 | Risk Ratio (M‐H, Fixed, 95% CI) | 1.02 [0.83, 1.27] |
| 1.1 Equal or greater than 75 yrs old | 3 | 410 | Risk Ratio (M‐H, Fixed, 95% CI) | 1.23 [0.96, 1.57] |
| 1.2 Under 75 yrs old | 3 | 420 | Risk Ratio (M‐H, Fixed, 95% CI) | 0.73 [0.49, 1.10] |
| 2 Heart failure admission and age Show forest plot | 1 | 365 | Risk Ratio (M‐H, Fixed, 95% CI) | 0.93 [0.69, 1.25] |
| 2.1 Equal or greater than 75 yrs old | 1 | 188 | Risk Ratio (M‐H, Fixed, 95% CI) | 1.13 [0.77, 1.64] |
| 2.2 Under 75 yrs old | 1 | 177 | Risk Ratio (M‐H, Fixed, 95% CI) | 0.73 [0.45, 1.17] |
| Outcome or subgroup title | No. of studies | No. of participants | Statistical method | Effect size |
| 1 All‐cause mortality Show forest plot | 5 | 1663 | Risk Ratio (M‐H, Fixed, 95% CI) | 0.94 [0.80, 1.11] |
| 2 Heart failure mortality Show forest plot | 1 | 268 | Risk Ratio (M‐H, Fixed, 95% CI) | 1.2 [0.66, 2.20] |
| 3 Heart failure admission Show forest plot | 4 | 1318 | Risk Ratio (M‐H, Fixed, 95% CI) | 0.83 [0.71, 0.98] |
| 4 All‐cause admission Show forest plot | 2 | 675 | Risk Ratio (M‐H, Fixed, 95% CI) | 0.98 [0.88, 1.10] |
| 5 Quality of life Show forest plot | 3 | 994 | Mean Difference (IV, Fixed, 95% CI) | ‐0.01 [‐1.28, 1.27] |
| Outcome or subgroup title | No. of studies | No. of participants | Statistical method | Effect size |
| 1 All‐cause mortality Show forest plot | 7 | 1229 | Risk Ratio (M‐H, Fixed, 95% CI) | 0.83 [0.65, 1.07] |
| 2 Heart failure mortality Show forest plot | 4 | 533 | Risk Ratio (M‐H, Fixed, 95% CI) | 0.52 [0.26, 1.03] |
| 3 Heart failure admission Show forest plot | 5 | 814 | Risk Ratio (M‐H, Fixed, 95% CI) | 0.63 [0.49, 0.81] |
| 4 All‐cause admission Show forest plot | 4 | 833 | Risk Ratio (M‐H, Fixed, 95% CI) | 0.94 [0.83, 1.07] |
| 5 Quality of life Show forest plot | 3 | 534 | Mean Difference (IV, Fixed, 95% CI) | ‐0.57 [‐1.92, 0.78] |
| Outcome or subgroup title | No. of studies | No. of participants | Statistical method | Effect size |
| 1 All‐cause mortality Show forest plot | 15 | 3169 | Risk Ratio (M‐H, Fixed, 95% CI) | 0.87 [0.76, 1.01] |
| 1.1 ≤ 1 yr | 5 | 555 | Risk Ratio (M‐H, Fixed, 95% CI) | 0.46 [0.25, 0.85] |
| 1.2 1‐2 yrs | 8 | 1842 | Risk Ratio (M‐H, Fixed, 95% CI) | 0.83 [0.69, 0.99] |
| 1.3 > 2 yrs | 2 | 772 | Risk Ratio (M‐H, Fixed, 95% CI) | 1.11 [0.87, 1.41] |
| 2 Heart failure mortality Show forest plot | 6 | 853 | Risk Ratio (M‐H, Fixed, 95% CI) | 0.84 [0.54, 1.30] |
| 2.1 ≤ 1 yr | 3 | 313 | Risk Ratio (M‐H, Fixed, 95% CI) | 0.64 [0.28, 1.48] |
| 2.2 1 ‐ 2 yrs | 3 | 540 | Risk Ratio (M‐H, Fixed, 95% CI) | 0.94 [0.56, 1.57] |
| 2.3 > 2 yrs | 0 | 0 | Risk Ratio (M‐H, Fixed, 95% CI) | 0.0 [0.0, 0.0] |
| 3 Heart failure admission Show forest plot | 10 | 1928 | Risk Ratio (M‐H, Fixed, 95% CI) | 0.70 [0.61, 0.80] |
| 3.1 ≤ 1 yr | 3 | 278 | Risk Ratio (M‐H, Fixed, 95% CI) | 0.37 [0.23, 0.58] |
| 3.2 1 ‐ 2 yrs | 5 | 878 | Risk Ratio (M‐H, Fixed, 95% CI) | 0.65 [0.54, 0.79] |
| 3.3 > 2 ys | 2 | 772 | Risk Ratio (M‐H, Fixed, 95% CI) | 0.97 [0.77, 1.23] |
| 4 All‐cause admission Show forest plot | 6 | 1142 | Risk Ratio (M‐H, Fixed, 95% CI) | 0.93 [0.84, 1.03] |
| 4.1 ≤ 1 yr | 3 | 247 | Risk Ratio (M‐H, Fixed, 95% CI) | 0.79 [0.58, 1.07] |
| 4.2 1 ‐ 2 yrs | 2 | 488 | Risk Ratio (M‐H, Fixed, 95% CI) | 0.89 [0.77, 1.03] |
| 4.3 > 2 yrs | 1 | 407 | Risk Ratio (M‐H, Fixed, 95% CI) | 1.04 [0.89, 1.21] |
| 5 Quality of life Show forest plot | 8 | 1812 | Mean Difference (IV, Fixed, 95% CI) | ‐0.03 [‐1.18, 1.13] |
| 5.1 ≤ 1 yr | 5 | 561 | Mean Difference (IV, Fixed, 95% CI) | ‐3.14 [‐6.46, 0.19] |
| 5.2 1 ‐ 2 yrs | 2 | 844 | Mean Difference (IV, Fixed, 95% CI) | 1.98 [‐0.76, 4.72] |
| 5.3 > 2 yrs | 1 | 407 | Mean Difference (IV, Fixed, 95% CI) | 0.0 [‐1.38, 1.38] |
| Outcome or subgroup title | No. of studies | No. of participants | Statistical method | Effect size |
| 1 All‐cause mortality Show forest plot | 15 | 3169 | Risk Ratio (M‐H, Fixed, 95% CI) | 0.87 [0.76, 1.01] |
| 1.1 NT‐proBNP | 9 | 2391 | Risk Ratio (M‐H, Fixed, 95% CI) | 0.87 [0.75, 1.01] |
| 1.2 BNP | 6 | 778 | Risk Ratio (M‐H, Fixed, 95% CI) | 0.89 [0.62, 1.28] |
| 2 Heart failure mortality Show forest plot | 6 | 853 | Risk Ratio (M‐H, Fixed, 95% CI) | 0.84 [0.54, 1.30] |
| 2.1 NT‐proBNP | 2 | 127 | Risk Ratio (M‐H, Fixed, 95% CI) | 0.30 [0.08, 1.19] |
| 2.2 BNP | 4 | 726 | Risk Ratio (M‐H, Fixed, 95% CI) | 0.98 [0.61, 1.56] |
| 3 Heart failure admission Show forest plot | 10 | 1928 | Risk Ratio (M‐H, Random, 95% CI) | 0.67 [0.53, 0.84] |
| 3.1 NT‐proBNP | 6 | 1328 | Risk Ratio (M‐H, Random, 95% CI) | 0.65 [0.48, 0.89] |
| 3.2 BNP | 4 | 600 | Risk Ratio (M‐H, Random, 95% CI) | 0.68 [0.43, 1.05] |
| 4 All‐cause admission Show forest plot | 6 | 1142 | Risk Ratio (M‐H, Fixed, 95% CI) | 0.93 [0.84, 1.03] |
| 4.1 NT‐proBNP | 2 | 476 | Risk Ratio (M‐H, Fixed, 95% CI) | 0.99 [0.85, 1.14] |
| 4.2 BNP | 4 | 666 | Risk Ratio (M‐H, Fixed, 95% CI) | 0.88 [0.77, 1.01] |
| 5 Quality of life Show forest plot | 8 | 1812 | Mean Difference (IV, Fixed, 95% CI) | ‐0.03 [‐1.18, 1.13] |
| 5.1 NT‐proBNP | 7 | 1771 | Mean Difference (IV, Fixed, 95% CI) | ‐0.02 [‐1.19, 1.14] |
| 5.2 BNP | 1 | 41 | Mean Difference (IV, Fixed, 95% CI) | ‐0.20 [‐15.30, 14.90] |