Tratamiento guiado por el péptido natriurético tipo B para la insuficiencia cardíaca
Resumen
Antecedentes
La insuficiencia cardíaca es una afección en la que el corazón no bombea suficiente sangre para satisfacer todas las necesidades del cuerpo. Los síntomas de la insuficiencia cardíaca incluyen disnea, fatiga y retención de líquido. Los resultados de los pacientes con insuficiencia cardíaca son muy variables; sin embargo, como promedio estos pacientes tienen un pronóstico deficiente. El pronóstico se puede mejorar con el diagnóstico temprano y el uso apropiado del tratamiento médico, el uso de dispositivos y el trasplante. Los pacientes con insuficiencia cardíaca son usuarios importantes de los recursos de la asistencia sanitaria, no sólo debido a los tratamientos con fármacos y dispositivos, sino debido a los costos elevados de la atención hospitalaria. Los niveles del péptido natriurético tipo B se utilizan como marcadores biológicos para el diagnóstico y el pronóstico de la insuficiencia cardíaca, pero podrían ofrecer a los médicos una posible herramienta para guiar el tratamiento farmacológico. Esta herramienta podría optimizar el tratamiento farmacológico en los pacientes con insuficiencia cardíaca a la vez que disminuye las inquietudes sobre los efectos secundarios potenciales debido a la intolerancia al fármaco.
Objetivos
Evaluar si el tratamiento guiado por la monitorización seriada del PNB o el NT‐proPNB (denominados en conjunto PN) mejora los resultados en comparación con el tratamiento guiado por la evaluación clínica sola.
Métodos de búsqueda
Las búsquedas se realizaron hasta el 15 de marzo 2016 en el Registro Cochrane Central de Ensayos Controlados (Cochrane Central Register of Controlled Trials) (CENTRAL) en la Cochrane Library; en MEDLINE (OVID), Embase (OVID), en la Database of Abstracts of Reviews of Effects (DARE) y en la NHS Economic Evaluation Database en la Cochrane Library. También se realizaron búsquedas en Science Citation Index Expanded, Conference Proceedings Citation Index on Web of Science (Thomson Reuters), World Health Organization International Clinical Trials Registry y ClinicalTrials.gov. No se aplicaron restricciones de fecha ni de idioma.
Criterios de selección
Se incluyeron los ensayos controlados aleatorios del tratamiento guiado por el PN de la insuficiencia cardíaca versus el tratamiento guiado por la evaluación clínica sola, sin restricción en el seguimiento. Se incluyeron los adultos tratados por insuficiencia cardíaca en ámbitos hospitalarios y extrahospitalarios y los ensayos que informaron un resultado clínico.
Obtención y análisis de los datos
Dos autores de la revisión, de forma independiente, seleccionaron los estudios para la inclusión, extrajeron los datos y evaluaron el riesgo de sesgo. Se calcularon los cocientes de riesgos (CR) para los datos dicotómicos, y se calcularon las diferencias de medias (DM) agrupadas (con intervalos de confianza [IC] del 95%) para los datos continuos. Se estableció contacto con los autores de los ensayos para obtener la información que faltaba. La calidad de las pruebas se evaluó mediante el enfoque Grading of Recommendations Assessment, Development and Evaluation (GRADE) y se utilizó GRADE profiler (GRADEPRO) para importar los datos de Review Manager y crear tablas "Resumen de los hallazgos".
Resultados principales
Se incluyeron 18 ensayos controlados aleatorios con 3660 participantes (rango de media de la edad: 57 a 80 años) que compararon el tratamiento guiado por el PN con la evaluación clínica sola. Las pruebas de la mortalidad por todas las causas con el tratamiento guiado por el PN no fueron confiables (CR 0,87; IC del 95%: 0,76 a 1,01); pacientes = 3169; estudios = 15; pruebas de baja calidad), al igual que para la mortalidad por insuficiencia cardíaca (CR 0,84; IC del 95%: 0,54 a 1,30; pacientes = 853; estudios = 6; pruebas de baja calidad).
Las pruebas indicaron que el ingreso por insuficiencia cardíaca se redujo con el tratamiento guiado por el PN (38% versus 26%, CR 0,70; IC del 95%: 0,61 a 0,80; pacientes = 1928; estudios = 10; pruebas de baja calidad), pero las pruebas del ingreso por todas las causas no fueron confiables (57% versus 53%, CR 0,93; IC del 95%: 0,84 a 1,03; pacientes = 1142; estudios = 6; pruebas de baja calidad).
Seis estudios informaron los eventos adversos; sin embargo, no fue posible agrupar los resultados (pacientes = 1144; pruebas de baja calidad). Sólo cuatro estudios proporcionaron resultados del costo del tratamiento y tres informaron un menor costo del tratamiento guiado por el PN, aunque uno informó un costo mayor (los resultados no se agruparon; pacientes = 931, pruebas de baja calidad). Las pruebas obtenidas a partir de los datos de calidad de vida no fueron confiables (DM ‐0,03; IC del 95%: ‐1,18 a 1,13; pacientes = 1812; estudios = 8; pruebas de muy baja calidad).
Se completó una evaluación del "Riesgo de sesgo" para todos los estudios. Para examinar la repercusión del riesgo de sesgo debido a la falta de cegamiento de la evaluación de los resultados y los altos niveles de deserción los análisis se limitaron a sólo los estudios con bajo "riesgo de sesgo".
Conclusiones de los autores
En los pacientes con insuficiencia cardíaca, pruebas de baja calidad mostraron una reducción del ingreso por insuficiencia cardíaca con el tratamiento guiado por el PN, mientras que hubo pruebas de baja calidad no confiables sobre el efecto del tratamiento guiado por el PN en la mortalidad por todas las causas, la mortalidad por insuficiencia cardíaca y el ingreso por todas las causas. Hubo además pruebas de muy baja calidad no confiables sobre el efecto en la calidad de vida del paciente. Las pruebas de los eventos adversos y el costo del tratamiento fueron de baja calidad y no fue posible agrupar los resultados.
PICO
Resumen en términos sencillos
Tratamiento guiado por el péptido natriurético tipo B para pacientes con insuficiencia cardíaca
Pregunta de la revisión
Se intentó determinar si el uso del tratamiento guiado por el péptido natriurético tipo B o de un plan de salud solo es más efectivo para tratar a los pacientes con insuficiencia cardíaca.
Antecedentes
La insuficiencia cardíaca es una afección compleja que se presenta cuando el corazón no bombea de forma efectiva la sangre suficiente para satisfacer las necesidades del cuerpo. Es provocada por varias enfermedades que deterioran la estructura y la funcionalidad del corazón y puede dar lugar a disnea, fatiga y retención de líquido. Los pacientes con insuficiencia cardíaca son usuarios frecuentes de la práctica general y hospitalaria, en particular como pacientes hospitalizados. Además, tienen una esperanza de vida reducida, aunque los medicamentos y otros tratamientos pueden mejorar las probabilidades de supervivencia.
El péptido natriurético (PN) tipo B es una sustancia producida en el corazón. La medición del PN se puede utilizar para indicar el estado del corazón. El PN se ha utilizado durante algún tiempo para diagnosticar la insuficiencia cardíaca y predecir lo que es probable que suceda. Se deseaba determinar si el PN también puede ofrecer una manera de controlar y mejorar el uso de los medicamentos.
Selección y características de los estudios
Se realizó una revisión de todos los estudios y las pruebas actualizadas hasta el 15 de marzo de 2016. Se encontraron 18 estudios del tratamiento guiado por el PN en los que participaron 3660 pacientes con insuficiencia cardíaca. Los pacientes tenían entre 62 a 80 años de edad al comienzo de los estudios. La duración de cada estudio varió de uno a 54 meses.
Ocho de los 18 estudios fueron patrocinados en parte o completamente por compañías farmacéuticas, uno fue financiado por un organismo de investigación nacional, cinco fueron financiados parcialmente por subvenciones nacionales para investigación, loterías, fondos hospitalarios o compañías farmacéuticas y cuatro estudios no informaron la fuente de financiamiento.
Resultados clave
Las pruebas con respecto a si el número de muertes por cualquier causa varió entre los pacientes con insuficiencia cardíaca que utilizaron el tratamiento guiado por el PN en comparación con los pacientes que utilizaron un plan de salud solo no fueron claras. Tampoco estuvo claro si hubo menos muertes cuando los resultados se separaron en pacientes con edad más avanzada o menores de 75 años de edad (los resultados por edad sólo se incluyeron en tres estudios). Además, se encontró que tampoco fueron claras las pruebas con respecto a si el número de muertes por insuficiencia cardíaca sola varió entre los grupos con tratamiento guiado por el PN o con plan de salud solo.
Se determinó que el ingreso hospitalario debido a insuficiencia cardíaca se puede reducir en los pacientes que utilizan el tratamiento guiado por el PN en comparación con un plan de salud solo. Según estos resultados se esperaría que, de 1000 pacientes con insuficiencia cardíaca guiados por un plan de salud solo, 377 tendrían un ingreso hospitalario debido a insuficiencia cardíaca. Por otra parte, entre 230 y 301 pacientes tendrían un ingreso hospitalario debido a insuficiencia cardíaca si recibieran tratamiento guiado por el PN. Sin embargo, las pruebas sobre si se afectó el número de ingresos hospitalarios por cualquier causa no están claras.
Hubo información limitada acerca de los efectos perjudiciales para los pacientes o el costo del tratamiento. No fue posible combinar los resultados de estos estudios para estos resultados. Sin embargo, cuatro de los seis estudios señalaron que no encontraron diferencias en los efectos perjudiciales ni en los daños entre los pacientes que utilizaron el tratamiento guiado por el PN en comparación con un plan de salud solo; los otros dos estudios no hicieron señalamientos al respecto. Cuatro estudios presentaron resultados sobre los costos, y tres informaron que los costos pueden ser menores en los grupos de tratamiento guiado por el PN en comparación con los grupos de plan de salud. Al parecer los menores costos se debieron a menos costos por estancia hospitalaria. Sin embargo, un estudio informó que fue poco probable que el tratamiento guiado por el PN fuera costo‐efectivo.
No fueron claras las pruebas con respecto a si hubo efectos beneficiosos en las respuestas a las encuestas de calidad de vida al comparar los grupos de tratamiento guiado por el PN y plan de salud solo.
Calidad de la evidencia
Las pruebas generales de la muerte por todas las causas, de la insuficiencia cardíaca sola y del ingreso hospitalario fueron de baja calidad. La calidad de las pruebas fue baja para los resultados efectos perjudiciales para los pacientes y costos, mientras que la calidad de las pruebas relacionadas con las encuestas de calidad de vida de los pacientes fue muy baja. Hubo pocas pruebas para todos los resultados debido a la manera en la que se realizaron los estudios. Además, en los efectos perjudiciales a los pacientes y el costo del tratamiento hubo diferencias en el tipo de información disponible.
Conclusiones de los autores
Summary of findings
| Does treatment guided by serial BNP or NT‐proBNP monitoring improve outcomes compared to treatment guided by clinical assessment alone? | ||||||
| Patient or population: patients with heart failure | ||||||
| Outcomes | Illustrative comparative risks* (95% CI) | Relative effect | No of Participants | Quality of the evidence | Comments | |
| Assumed risk | Corresponding risk | |||||
| No BNP or NT‐proBNP‐guided treatment | Serial BNP or NT‐proBNP‐guided treatment | |||||
| All‐cause mortality | 218 per 1000 | 190 per 1000 | RR 0.87 | 3169 | ⊕⊕⊝⊝ | 16 studies reported on all‐cause mortality (n = 3292), but only 15 studies are included in the meta‐analysis (n = 3169). For one study data could not be extracted or obtained in a format useable in the review. Funnel plot analysis suggests possible lack of small studies (beneficial control effect). Insufficient to justify downgrading the quality of evidence. |
| Heart failure mortality | 91 per 1000 | 76 per 1000 | RR 0.84 | 853 | ⊕⊕⊝⊝ | |
| Heart failure admissions | 377 per 10002 | 264 per 1000 | RR 0.70 | 1928 | ⊕⊕⊝⊝ | |
| All‐cause admissions | 573 per 10002 | 533 per 1000 | RR 0.93 | 1142 | ⊕⊕⊝⊝ | |
| Adverse events | See comment | See comment | Not estimable | 1144 | ⊕⊕⊝⊝ | 3/6 studies commented on the difference between the intervention and control groups: no significant difference in one and two favoured the intervention group |
| Cost | See comment | See comment | Not estimable | 1051 | ⊕⊕⊝⊝ | 3/4 studies suggested reduced cost in the intervention groups. One study suggested NP‐guided treatment was unlikely to be cost‐effective. |
| Quality of life | The mean quality of life ranged across control groups from | The mean quality of life in the intervention groups was | 1812 | ⊕⊝⊝⊝ | Lower score indicates better quality of life | |
| *The basis for the assumed risk (e.g. the median control group risk across studies) is provided in footnotes. The corresponding risk (and its 95% confidence interval) is based on the assumed risk in the comparison group and the relative effect of the intervention (and its 95% CI). | ||||||
| GRADE Working Group grades of evidence | ||||||
| 1 The comparisons (controls) fell into two groups: same as the intervention without BNP or NT‐proBNP measures or usual care | ||||||
Antecedentes
Descripción de la afección
La insuficiencia cardíaca es una afección en la que el corazón no bombea suficiente sangre para satisfacer todas las necesidades del cuerpo. Es provocada por la disfunción del corazón debido a daño muscular (disfunción sistólica o diastólica), disfunción valvular, arritmias u otras causas poco frecuentes (NICE 2014). Clínicamente es un síndrome en el que los pacientes presentan síntomas (p.ej. disnea, edema de los tobillos y fatiga) y signos (p.ej. presión venosa yugular elevada, estertores crepitantes pulmonares y desplazamiento del latido de la punta) característicos. El diagnóstico puede ser difícil ya que los síntomas de la insuficiencia cardíaca no son discriminatorios, por lo que la demostración de una causa cardíaca subyacente es fundamental para el diagnóstico. La identificación del problema cardíaco subyacente también es fundamental por motivos terapéuticos, ya que la patología precisa determina el tratamiento específico a utilizar (p.ej. cirugía de la válvula para la valvulopatía, tratamiento farmacológico específico para la disfunción sistólica del ventrículo izquierdo, etc.) (McMurray 2012).
La insuficiencia cardíaca debido a disfunción sistólica del ventrículo izquierdo (DSVI) es provocada por una deficiencia en la contracción del ventrículo izquierdo y generalmente se caracteriza por una reducción en la fracción de expulsión del ventrículo izquierdo (FEVI). La insuficiencia cardíaca con fracción de expulsión conservada se asocia generalmente con deficiencia en la relajación del ventrículo izquierdo, en lugar de en la contracción del ventrículo izquierdo, y se caracteriza por una fracción de expulsión del ventrículo izquierdo normal o conservada (NICE 2010).
Aproximadamente del 1% al 2% de la población adulta en los países desarrollados presenta insuficiencia cardíaca, con una prevalencia que asciende a ≥ 10% entre las personas de 70 años de edad o más (McMurray 2012). Se espera que la prevalencia aumente en el futuro como resultado del envejecimiento poblacional, la mejoría en la supervivencia de los pacientes con cardiopatía isquémica y los tratamientos más efectivos para la insuficiencia cardíaca (Owan 2006).
La insuficiencia cardíaca tiene un pronóstico deficiente: del 30% al 40% de los pacientes con diagnóstico de insuficiencia cardíaca mueren en el transcurso de un año, pero posteriormente la mortalidad es menor del 10% por año. Existen pruebas de una tendencia hacia una mejoría en el pronóstico en los últimos diez años. La tasa de mortalidad a los seis meses disminuyó del 26% en 1995 al 14% en 2005. En el NHS, la insuficiencia cardíaca representa un total de 1 000 000 de días de hospitalización en cama (2% de todos los días de hospitalización en cama del NHS) y el 5% de todos los ingresos médicos de urgencia en el hospital. Se prevé que los ingresos hospitalarios debido a insuficiencia cardíaca aumenten en el 50% durante los próximos 25 años, debido en gran parte al envejecimiento poblacional. Lo anterior ocurrirá a pesar de una disminución progresiva de la tasa de hospitalización ajustada para la edad del 1% al 1,5% por año desde 1992/1993 (NICE 2010).
Descripción de la intervención
Todos los pacientes con insuficiencia cardíaca crónica requieren monitorización, que debe abarcar una evaluación clínica detallada y una revisión de la medicación, que incluye la necesidad de ajustar la dosis y la optimización según las guías y la detección de los posibles efectos secundarios. Las opciones de tratamiento farmacológico para los pacientes con DSVI (clase funcional II‐IV de la New York Heart Association [NYHA]) incluyen diuréticos, inhibidores de la enzima convertidora de angiotensina (ECA) (bloqueadores de los receptores de angiotensina si no se toleran los inhibidores de la ECA), betabloqueantes y antagonistas de los receptores mineralocorticoides (ARM).
La frecuencia de monitorización depende del estado clínico y la estabilidad del paciente. El intervalo de monitorización debe ser corto (días a dos semanas) si la afección clínica o la medicación han cambiado, pero se requiere que sea de al menos seis veces al mes para los pacientes estables con insuficiencia cardíaca comprobada.
La intervención requiere la monitorización de las concentraciones del péptido natriurético tipo B para guiar el tratamiento de la insuficiencia cardíaca con la intención de mejorar el tratamiento de los pacientes individuales. El péptido natriurético tipo B, junto con el NT‐proPNB, es un péptido natriurético secretado cuando el corazón se dilata. El péptido natriurético tipo B tiene una vida media menor de 20 minutos en comparación con una a dos horas en el caso del NT‐proPNB, y ambos pueden aumentar en los pacientes con disfunción sistólica o diastólica (Atisha 2004). Estos dos marcadores biológicos han demostrado ser útiles en el diagnóstico y pronóstico de la insuficiencia cardíaca (Clerico 2007; Doust 2005; McMurray 2012 NICE 2014). La monitorización de la concentración del PN le proporciona información al médico acerca del nivel de volemia intravascular, que se puede utilizar en combinación con el estado clínico del paciente para facilitar las decisiones de tratamiento.
De qué manera podría funcionar la intervención
El PNB y el NT‐proPNB (denominados en conjunto PN) son marcadores biológicos para la insuficiencia cardíaca que han demostrado ser útiles en el diagnóstico y el pronóstico (Clerico 2007; Doust 2005, McMurray 2012, NICE 2014). El precursor, preproPNB, se transforma en proPNB dentro del cardiomiocito y se almacena en los gránulos secretores; El proPNB se transforma en NT proPNB y PNB al secretarse hacia la sangre en respuesta a un aumento del volumen intracardíaco (Chen 2010; Ichiki 2013). La monitorización de las concentraciones de PN le proporciona información al médico acerca del nivel de volemia intravascular, que se puede utilizar en combinación con el estado clínico del paciente para facilitar las decisiones de tratamiento.
Por qué es importante realizar esta revisión
Hasta la fecha, cinco de siete revisiones sistemáticas con metanálisis han demostrado que el tratamiento guiado por el PN reduce la mortalidad por todas las causas en los pacientes con insuficiencia cardíaca congestiva en comparación con la atención clínica habitual (Felker 2009; Li 2013; Li 2014; Porapakkham 2010; Savarese 2013), especialmente en los pacientes con menos de 75 años de edad (Porapakkham 2010). En 2014, Troughton y cols. (Troughton 2014) publicaron un metanálisis de pacientes individuales y Xin y cols. (Xin 2015) publicaron un metanálisis que contradijo este hallazgo para la mortalidad por todas las causas en todos los pacientes. Todavía no hay seguridad con respecto a si la monitorización del PN puede dar lugar a más efectos perjudiciales que beneficiosos en comparación con la atención habitual. Ninguna otra revisión ha examinado la mortalidad por insuficiencia cardíaca. En pocas revisiones se ha examinado si el tratamiento guiado por el PN aumenta o reduce los ingresos por insuficiencia cardíaca ( Li 2013; Li 2014; Savarese 2013, Troughton 2014; Xin 2015) o los ingresos hospitalarios por todas las causas (Porapakkham 2010; Savarese 2013; Troughton 2014; Xin 2015).
Dos revisiones han examinado los eventos adversos (Li 2014; Xin 2015) y ninguna revisión ha examinado el coste del tratamiento. Sólo Xin 2015 ha examinado los datos de calidad de vida.
NICE recomienda la monitorización con PN en sólo algunos pacientes por un especialista después del ingreso hospitalario o cuando el ajuste a una dosis mayor del fármaco es problemático (NICE 2010). La guía de la European Society of Cardiology (ESC) (McMurray 2012) no la recomienda debido a que no hay seguridad acerca de si es un enfoque más efectivo que simplemente optimizar el tratamiento (combinaciones y dosis de fármacos, dispositivos) según las guías.
En esta revisión se examinaron los siete resultados descritos anteriormente y además se incluyó la mortalidad por insuficiencia cardíaca, que no se ha examinado previamente. Además, se intentó evaluar si factores como la edad, el sexo, la gravedad de los síntomas o el estadio de la insuficiencia cardíaca y el ámbito de atención (comunitario u hospitalario) predicen si un paciente se beneficiará de la monitorización del PN, así como si la monitorización da lugar a un mayor cambio en el PN. Sin embargo, sólo fue posible realizar uno de estos análisis de subgrupos predeterminados debido a la falta de datos o la inconsistencia al informar estos factores. Cuatro análisis de subgrupos adicionales se consideraron post hoc: FEVI inicial, duración del seguimiento, tipo de control y tipo de biomarcador.
Objetivos
Los objetivos son:
-
evaluar si el tratamiento guiado* por la monitorización seriada del PNB o el NT‐proPNB (denominados en conjunto PN) mejora los resultados en comparación con el tratamiento guiado por la evaluación clínica sola;
-
evaluar el grado en el que las mejorías en los resultados se explican por un ajuste a una dosis mayor del fármaco o por reducciones en los niveles del PNB; y
-
determinar qué grupos de pacientes se benefician más de la monitorización según la edad, el sexo, la gravedad de los síntomas o el estadio de la insuficiencia cardíaca (con el uso de la clasificación de la NYHA), y el PN inicial.
*En esta revisión el tratamiento guiado se refiere a cambios en el estilo de vida y la medicación para el tratamiento de la insuficiencia cardíaca (es decir, ningún tratamiento con dispositivos o trasplante).
Métodos
Criterios de inclusión de estudios para esta revisión
Tipos de estudios
Todos fueron ensayos controlados aleatorios de tratamiento de la insuficiencia cardíaca guiado por el PNB o el NT‐proPNB (en conjunto, guiado por el PN), en ámbitos hospitalarios y extrahospitalarios, que informaron un resultado clínico. No hubo ninguna restricción en la duración del seguimiento.
Tipos de participantes
Todos los pacientes de 18 años y más tratados por insuficiencia cardíaca.
Tipos de intervenciones
Comparación del tratamiento guiado por los niveles del PN versus el tratamiento guiado por la evaluación clínica sola.
Tipos de medida de resultado
Resultados primarios
El resultado primario fue la mortalidad por todas las causas.
Resultados secundarios
Los resultados secundarios fueron los siguientes:
-
mortalidad por insuficiencia cardíaca;
-
ingreso por insuficiencia cardíaca;
-
ingreso por todas las causas;
-
eventos adversos;
-
costo; y
-
calidad de vida.
Results
Description of studies
Results of the search
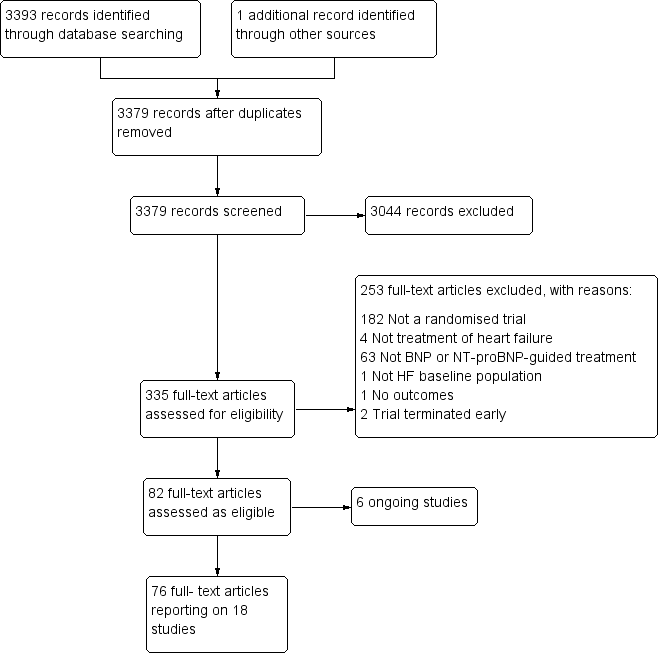
The search identified 3394 references. Once duplicates were removed, the titles and abstracts of the remaining 3379 references were screened using our inclusion /exclusion criteria and 3044 removed as not relevant to the review. Full texts were examined for the remaining 335 references and from these 18 studies were included in this review (see Figure 1). Full details of all the studies are given in the Characteristics of included studies, Table 1, Table 2, Characteristics of excluded studies, and Characteristics of ongoing studies. Each study is identified by the name of the first author and year of publication of the main results paper (Study ID). Additional references are listed together with this main publication under the study ID.

Study flow diagram.
| Study | Participants treated in community or secondary care | Baseline NYHA classification (stages I ‐ IV) | Baseline left ventricular ejection fraction (LVEF, %) | |||||
| Study inclusion criteria | Intervention group | Control group | Comment in text | Study inclusion criteria | Intervention group (mean, SD unless stated) | Control group (mean, SD unless stated) | ||
| Hospital | Stage ≥ III | Stage III 73%, IV 27% | Stage III 63%, IV 37% | Not inclusion criterion | 44 (18) | 46 (18) | ||
| Hospital (outpatient) | Stages II ‐ III | 2.6 ± 0.7 (mean, SD) | 2.4 ± 0.6 (mean, SD) | <40% | 23.8 ± 8.8 | 20.9 ± 9.2 | ||
| Hospital & community | Stages III ‐ IV | Not stated | Not stated | <40% | NS | NS | ||
| Hospital | Not inclusion criterion | Stage I = 11.5%, II = 64.9%, III = 23.6% | stage I = 9.9%, II = 70.8%, III = 19.3% | Not inclusion criterion | 34.9 ± 13.7 | 36.7 ± 14.8 | ||
| Hospital | Stages II ‐ IV | Stage II or III = 85.5% | Stage II or III = 84.2% | ≤ 40% | 28 ± 8.7 | 25.9 ± 8.3 | ||
| Hospital (outpatient) | Stages II ‐ III | 2.29 ±0.6 (mean, SD) | 2.21 ± 0.62 (mean, SD) | <45% | 29.9 ± 7.7 | 31.8 ± 8.4 | ||
| Hospital | Stages II ‐ IV | Stage II = 32%, III = 52%, IV = 15% | Stage II = 27%, III = 59%, IV = 14% | <40% | <30% = 57% | <30% = 58% | ||
| Hospital | Stages III ‐ IV | 2.1 (0.3) (mean, SD) | 2.1 (0.3) (mean, SD) | ≤ 45% | 36.1% (7.2) | 32.3% (9.6) | ||
| Hospital & community | Not inclusion criterion | NT‐proBNP group: stage I 12%, II 68%, III 18%, IV 2% | Clinically‐guided group: Stage I 7%, II 66%, III 25%, IV 2%; Usual care: stage I 7%, II 67%, III 25%, IV 1% | Not inclusion criterion though deliberated included patients with preserved LVEF | 40 ±15 | CG = 39 ± 15, UC = 37 ± 15 | ||
| Hospital | Stages III ‐ IV | NS | NS | Not inclusion criterion | 30 ± 8.1 | 28 ± 7.9 | ||
| Hospital (outpatient) | Stages ≤ II | 49 (83) ≥ III (median, IQR) | 53 (83) ≥ III (median, IQR) | 'symptoms improved similarly' (at 6 months) | > 45% | 56 ± 6 | 56 ± 7 | |
| Community | Stage II ‐ IV | Stage II 62%, III 38% | Stage II 61%, III 39% | 'Improvements in NYHA class and dyspnoea symptoms were seen in both allocation groups, but with no significant differences between the groups' | <50% | 31 (9) | 33 (7) | |
| Hospital (outpatient) | Stages ≤ II | 186 ≥ III (n) | 185 ≥ III (n) | ≤ 45% | 29.8 (7.7) | 29.7 (7.9) | ||
| Hospital | Not inclusion criterion | Stage I ‐ II 86 % | Stage I ‐ II 85 % | <45% | 30 (14‐45) median (range) | 30 (15‐45) median (range) | ||
| Hospital | Stage III ‐ IV | Authors have no data for baseline NYHA | Authors have no data for baseline NYHA | <35% | 20 (15‐25) median (range) | 20 (15‐25) median (range) | ||
| Hospital | Not stated | 2.53 (mean) | 2.34 (mean) | Not inclusion criterion | 23 (6) | 23 (7) | ||
| Hospital (outpatient) | Stage III ‐ IV | Stage III 23%, IV 76% | Stage III 26%, IV 74% | At hospital admission | <40% | 29.2 (6.1) | 29.4 (6.1) | |
| Hospital | Stages II ‐ IV | Stage II 72%, overall 2.3 (mean) | Stage II 67%, overall 2.3 (mean) | <40% | 28 | 26 | ||
| Study | Target BNP/NT‐proBNP (pg/mL, unless stated) | Baseline BNP or NT‐proBNP measurement (units in pg/mL and given as mean (SD), unless stated) | BNP/NT‐proBNP drop (as % of baseline) (units in pg/mL and given as mean (SD), unless stated) | ||||
| Biomarker | Study inclusion criteria | Intervention group | Control group | Comment in text | |||
| 100 | BNP | No inclusion threshold | 57 (77) | 65 (97) | No percentage drop reported. BNP at 18 months follow‐up: BNP‐guided group 14 (20); control group 111 (71) | ||
| No target set/stated | BNP | No inclusion threshold | 502.3 (411.3) | 701.6 (409.9) | No percentage drop reported. BNP at follow‐up: control arm 626.8 (325.8); BNP arm 477.8 (406.9) | ||
| < 2200 NT = proBNP (reported in IPD analysis by Troughton 2014) | NT‐proBNP | No inclusion threshold | 2216 (355‐9649) mean (95% CI) | Multidisplinary care 2469 (355 ‐18487; Usual care 2359 (355 ‐15603) mean (95% CI) | No percentage drop reported. NT ‐proBNP change from baseline to FU graphically shown in Berger 2010 (Figure 4). Decrease in NT‐proBNP more apparent in NT‐proBNP‐guided group than multidisplinary group. No decrease in usual care group | ||
| Set individually for each participant as the lowest level at discharge or at 2 weeks follow‐up | NT‐proBNP | NT‐proBNP levels at admission: minimum 1,700 pg/ml. Additionally NT‐proBNP levels during hospitalisation, defined as a decrease of more than 10%, with a drop in NT‐proBNP levels of at least 850 pg/ml, from admission to discharge. | 2961 (1383 ‐ 5144) median (IQR) | 2936 (1291‐5525) median (IQR) | Outcome data available by subgroup baseline BNP (above or below discharge NT‐proBNP 2950 pg/ml) | No percentage drop reported. Median (IQR) at 12 months follow‐up: NT‐proBNP‐guided group ‐432 (‐1392 to 297); Clincially‐guided group ‐572 (‐1329 to 434). | |
| ≤ 1000 | NT‐proBNP | No inclusion threshold | 2344 (median) | 1946 (median) | No percentage drop reported. Median NT‐proBNP at follow‐up: Standard care group 1844 (P = 0.61 follow‐up vs baseline); NT‐proBNP‐guided group 1125 (P = 0.01 vs baseline) | ||
| < 100 | BNP | No inclusion threshold | 352 (260) mean (SD) | Not measured | No percentage drop reported. BNP‐guided group only shown graphically in Jourdain 2007 (figure 5): mean BNP level drops over time and % of patients achieving target increases. | ||
| <150 ng/L in patients under 75; <300 ng/L in patients over 75 yrs | BNP | No inclusion threshold | 808.2 (676.1) ng/L, mean (SD) | 898.9 (915.3 ng/L, mean (SD) | No percentage drop reported. BNP at follow‐up: control group 457 (603), BNP‐guided group 403 (468) | ||
| <100 | BNP | No inclusion threshold | 704 (228‐2852) median (range) | 633 (276‐3756) median (range) | No percentage drop reported. In the BNP group 90% of patients manage to reduce BNP to <400 pg/mL; of this 90%, 2/3 of patients to achieve <100 pg/mL. Email from author "We do not have BNP values of the Clinical group at the end of follow‐up. Median BNP value after 6 months in BNP group was 235pg/ml. (At hospital discharge 704pg/ml; after 1 month 328.5pg/ml; after 3 months 253pg/ml)." | ||
| < 150 µmol/L | NT‐proBNP | No inclusion threshold | 2012 (516‐10233) median (IQR) | Clinically‐guided group: 1996 (425‐6588); Usual care: 2012 (425‐10571) median (IQR) | No percentage drop reported. No follow‐up data. Comment in text 'Plasma NT‐proBNP levels fell similarly within 6 months of randomisation in both the NT‐proBNP and CG groups (by 20% and 23%, respectively; P 0.001)'. | ||
| 50% of basal level or < 300 | BNP | No inclusion threshold | 1167.8 (219.9) mean (SD) | 1145.8 (224.9) mean (SD) | No percentage drop reported. Change in BNP level shown in Figure 2 (Li 2015). 'BNP value decreased dramatically over the duration of medication, but there was no difference between the two groups.' | ||
| < 400 in patients younger than 75 years; < 800 in patients aged 75 years or older | NT‐proBNP | N‐terminal BNP level of 400 pg/mL or higher in patients younger than 75 years and a level of 800 pg/mL or higher in patients aged 75 years or older | 2210 (1514‐4081) ng/L, median (IQR) | 2191 (1478‐4890) ng/L, median (IQR) | Maeder 2013 reports: 'NT‐proBNP was reduced similarly in patients allocated to NT‐proBNP‐guided or symptom‐guided management. The proportion of patients with NT‐proBNP below the target was low throughout the study period and did not significantly differ between groups (Figure 2C) although it tended to be lower in the NT‐proBNP‐guided group. | ||
| At least a 50% reduction from baseline NT‐proBNP | NT‐proBNP | Elevated NT‐proBNP levels (males > 800 ng/L, females > 1000 ng/L) | 2661 (2.1) ng/L, geometric mean(coefficient of variation, %) | 2429 (2.1) ng/L, geometric mean(coefficient of variation, %) | No percentage drop reported. Geometric Mean (SD) at follow‐up: NT‐proBNP‐guided group ‐ 301 ng/L to 2360 ng/L; control group ‐362 ng/L to 2067 ng/L. Comment in text 'similar modest decrease ( 10%) in NT‐proBNP from baseline to end‐of study was observed in both groups……NT‐proBNP levels were reduced by .50% in 24 (19%) and 27 (22%), of patients with and without NT‐proBNP‐guided treatment, respectively'. | ||
| < 400 in patients younger than 75 years; < 800 in patients aged 75 years or older | NT‐proBNP | N‐terminal BNP level of 400 pg/mL or higher in patients younger than 75 years and a level of 800 pg/mL or higher in patients aged 75 years or older | 3998 (2075‐7220) median (IQR) | 4657 (2455‐7520) median (IQR) | No percentage drop reported. No follow‐up data. Pfisterer 2009 (figure 3b) graphically shows data for NT‐proBNP changes over 6 months (by age). Comment in text 'There were no significant differences between the 2 treatment groups by by N‐terminal BNP level (P=.06 vs P=.30).' | ||
| No target set/stated | NT‐proBNP | NT‐proBNP ≥ 1000 pg/mL after up‐titration (i.e. at the randomisation visit) | 1884 (1033‐10435) average statistic not stated) | 2042 (1023‐9668) average statistic not stated | No percentage drop reported. Change in NT‐proBNP during follow‐up: NT‐proBNP‐guided group ‐129 (‐722 to 674) median (IQR); Clinically managed group ‐26 (‐681 to 751) median (IQR). Comment in text: 'Patients in whom NT‐proBNP increased ≤ 30% during the follow up period had a higher frequency of admission (69% vs. 47%, P = 0.002), a higher number of admission days (median) (14 days vs. 5 days, P= 0.003), a higher number of admissions (median) (2 vs. 1, P = 0.009), a lower quality of life (mean difference) (6 points, P = 0.032), and a poorer functional class (37% vs. 18% in functional class III–IV, P = 0.001).' | ||
| Discharge BNP | BNP | No inclusion threshold | 453 (221‐1135) median (IQR) | 440 (189 ‐981) median (IQR) | No percentage drop reported. Median (IQR) BNP at follow‐up: BNP‐guided group 412.5 (111,894); control (congestion score) group 471 (235.5, 1180) | ||
| No target set/stated | NT‐proBNP | Email from author confirmed 'NT‐ProBNP > 2000 at day of randomisation' | 5868 (2532) | 5820 (2434) | No percentage drop reported. | ||
| <1000 pg/mL or at least 50% reduction from baseline NT‐proBNP at discharge | NT‐proBNP | > 1400 pg/mL at hospital admission | 3750 (2224‐ 6613) median (IQR) | 2783.0 (2021.5‐ 4827.5) median (IQR) | At hospital discharge | At 6 months: NT‐proBNP‐guided group: 53% (Median drop (QR): 1585.5 (976.6, 2742.5)) Control group: 10.2% (median (IQR): 2189.0 (1954.0, 3688.5)) | |
| 200 µmol/L | NT‐proBNP | No inclusion threshold | 217 µmol/L, mean | 251 µmol/l, mean | No percentage drop reported. At 6 months follow‐up: Nt‐proBNP‐guided group decreased by 79 pmol/L, mean; clinically‐guided group decreased by 3 pmol/L, mean (P = 0.16) | ||

Funnel plot of comparison: NP‐guided versus no NP‐guided treatment for all‐cause mortality.
Included studies
The Characteristics of included studies, Table 1 and Table 2 provide details of each of the 18 included studies.
The earliest study was published in 2000 (Troughton 2000) and the latest in 2015 (Skvortsov 2015). For two of the studies, data were only available through conference abstracts and direct contact with the authors (Krupicka 2010; Shochat 2012).
Ten of the studies were completed in Europe (two in Sweden/Norway (Karlstrom 2011; Persson 2010), two in Switzerland/Germany (Maeder 2013; Pfisterer 2009), one in Austria (Berger 2010), France (Jourdain 2007), the Netherlands (Eurlings 2010), Spain (Anguita 2010), Denmark (Schou 2013). and the Czech Republic (Krupicka 2010)); three studies were completed in North America (two in the USA (Januzzi 2011; Shah 2011) and one in Canada (Beck‐da‐Silva 2005)); two were completed in New Zealand (Lainchbury 2010; Troughton 2000), one in Israel (Shochat 2012), one in Russia (Skvortsov 2015), and one in China (Li 2015).
Two of the 18 studies (Berger 2010; Lainchbury 2010) had three comparison arms comparing NP‐guided treatment both to clinical assessment and to usual care. For usual care there were no scheduled visits and the participants were managed in primary care. Studies recruited 3660 participants ranging from 41 to 499 participants per study. The average age of participants in all the studies ranged from 62 to 80 years old. Studies followed up participants from baseline to between one and 54 months.
Seven studies (Anguita 2010; Beck‐da‐Silva 2005; Jourdain 2007; Karlstrom 2011; Krupicka 2010; Li 2015; Shah 2011) used BNP as the biomarker; the remainder used NT‐proBNP. Only seven studies (Eurlings 2010; Maeder 2013; Persson 2010; Pfisterer 2009; Schou 2013; Shochat 2012; Skvortsov 2015) stated an NP level as an inclusion criterion. All studies set a NP target except for Beck‐da‐Silva 2005; Schou 2013 and Shochat 2012 who stated a change in NP level (See Table 2).
Two studies (Beck‐da‐Silva 2005; Li 2015), compared the effect of NP‐guided treatment with clinical assessment exclusively for the up‐titration of beta‐blockers. Beck‐da‐Silva 2005 changed the dose of bisoprolol, but all other drugs remained unchanged, during a three‐month follow‐up period. Li 2015 started and increased the dose of metoprolol succinate over one month; for these patients intravenous cardiotonic, vasodilator or diuretic was applied if signs or symptoms of heart failure were observed.
Beck‐da‐Silva 2005 was the only study to report an algorithm where medication (beta blocker) was decreased for patients whom the BNP measurement was increasing, but the clinical assessment was worse.
All, bar three studies (Eurlings 2010, Lainchbury 2010; Schou 2013), reported inclusion criteria for classifying participants according to the New York Heart Association (NYHA) functional classification. This classifies patients with heart disease into four stages based on limitations on physical activity, symptoms with ordinary physical activity and status at rest. Stage four indicating the highest severity of symptoms. At baseline, most studies grouped participants by NYHA stage and overall, the participants ranged between stages II and IV. Three studies reported baseline NYHA as percentages in each stage: for Eurlings 2010 and Lainchbury 2010, over 60% of participants were in class II and for Schou 2013 over 85% were in stages I to II.
Further classification was determined by percentage left ventricular ejection fraction (LVEF); 12 of the studies stated as an inclusion criterion a maximum level for percentage LVEF which ranged between < 35% to < 50%; five studies did not stipulate any inclusion level (Anguita 2010; Eurlings 2010; Lainchbury 2010; Li 2015; Shochat 2012); and Maeder 2013 was the only study to have participants solely with percentage > 45% LVEF or preserved LVEF. Although six of the studies did not stipulate an inclusion level percentage LVEF, Lainchbury 2010 was the only other study to state participants with preserved LVEF were not excluded. At baseline, Berger 2010 did not report LVEF percentage, Maeder 2013 reported all participants averaged 56% LVEF, Karlstrom 2011 reported 57% of participants were < 30% LVEF, whilst the remaining studies reported overall averages ranging from 20% to 46% LVEF.
Six studies (Felker 2014; Jourdain 2014; Metra 2012; Moe 2007; Saraya 2015; Steinen 2014) are classified as ongoing. Of these, four studies (Felker 2014; Jourdain 2014; Moe 2007; Steinen 2014) are currently recruiting or have just finished recruiting. Metra 2012 finished recruiting in August 2009 and is due to publish shortly. Saraya 2015 has been completed, but currently only published as a conference abstract. All six are listed in the Characteristics of ongoing studies.
Excluded studies
Thirty‐five references are included in the Characteristics of excluded studies tables where the title or abstract or both appeared to suggest a relevant study to this review. Of these 68% were excluded as the study was not a randomised control trial. Other reasons included not NP‐guided treatment (20%), trial terminated, not treatment for heart failure, or not a baseline heart failure population.
Risk of bias in included studies

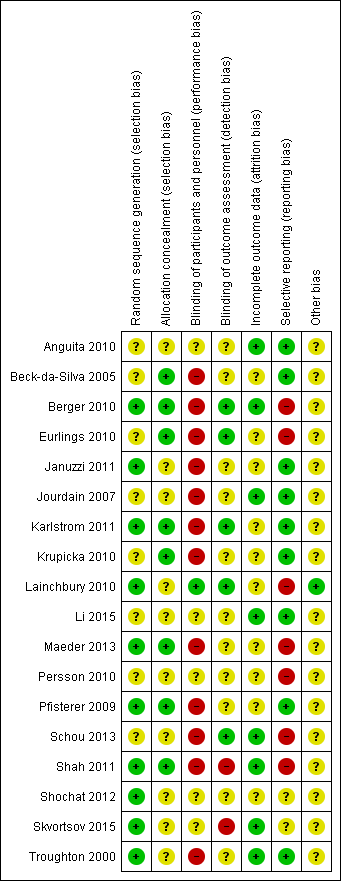
'Risk of bias' summary: review authors' judgements about methodological quality for each included study

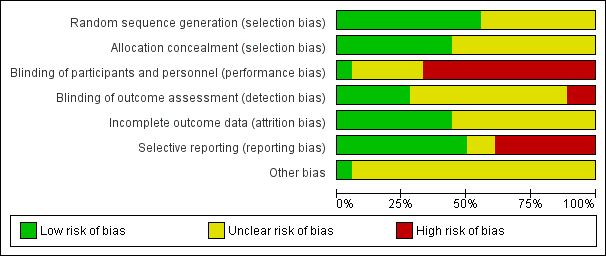
'Risk of bias' graph: review authors' judgements about methodological quality presented as percentages across all included studies.
Allocation
All studies clearly stated the study was randomised, but not all studies reported on how randomisation was completed or if allocation concealment was achieved. Five studies confirmed sequence generation and allocation concealment and methods were judged to be at low risk of bias (Berger 2010; Karlstrom 2011; Maeder 2013; Pfisterer 2009; Shah 2011). Januzzi 2011; Lainchbury 2010; Shochat 2012; Skvortsov 2015 and Troughton 2000 were low risk for sequence generation only and Beck‐da‐Silva 2005; Eurlings 2010 and Krupicka 2010 only for allocation concealment. The remaining studies were classified as unclear.
Blinding
Blinding of participants and study personnel was only judged to be low risk if both were blinded to the treatment allocation; only one study met this standard (Lainchbury 2010). Five studies did not report or it was unclear whether participants or personnel were blinded to treatment allocation (Anguita 2010; Li 2015; Persson 2010; Shochat 2012; Skvortsov 2015). In all the remaining studies one or more of these groups were not blinded. Blinding of outcome assessments was not achieved or not reported in the majority of studies; only five studies blinded outcome assessment (Berger 2010; Eurlings 2010; Karlstrom 2011; Lainchbury 2010; Schou 2013).
Incomplete outcome data
For the primary outcome, all‐cause mortality, eight studies (Anguita 2010; Berger 2010; Jourdain 2007; Li 2015; Schou 2013; Shah 2011; Skvortsov 2015; Troughton 2000) were judged to be low risk with regard to incomplete outcome data, in fact they all had no attrition except for Skvortsov 2015 where the numbers and reasons were fully reported. The remaining studies either did not report attrition, or the studies did confirm attrition with break down by intervention arm, but did not explain how missing data were handled. For those studies reporting dropouts, the overall attrition rates were no more than 23%.
All of the studies, bar four, completed intention‐to‐treat (ITT) analyses; Beck‐da‐Silva 2005 did not complete an ITT analysis, whilst Anguita 2010; Jourdain 2007 and Li 2015 did not report whether this method was used.
Selective reporting
Nine out of 18 studies reported on all stated outcomes and were considered low risk for reporting bias. Six studies have not yet reported on some secondary outcomes (Berger 2010 on heart failure mortality and all‐cause admission, Eurlings 2010 on all‐cause admission, Persson 2010 and Maeder 2013 on quality of life, Schou 2013 and Shah 2011 on treatment costs). Lainchbury 2010 partially reported quality of life data. Skvortsov 2015 is currently awaiting further publications. It was not possible to assess reporting bias for Shochat 2012 as data were provided from conference abstracts and direct contact with the author and any pre‐specified outcomes were not stated.
Other potential sources of bias
Eight of the studies were part or fully funded by pharmaceutical companies (Berger 2010; Januzzi 2011; Jourdain 2007; Krupicka 2010; Maeder 2013; Persson 2010; Pfisterer 2009; Shochat 2012). Five studies (Eurlings 2010; Karlstrom 2011; Schou 2013; Shah 2011; Troughton 2000) were partially funded by either national research grants, lotteries, hospital funds and/or pharmaceutical companies. Four studies did report funding sources (Anguita 2010, Beck‐da‐Silva 2005; Li 2015; Skvortsov 2015). These studies were judged to be of unclear risk of bias.
One study (Lainchbury 2010) was solely funded from a national research body and therefore considered at low risk of bias from the funding source.
Effects of interventions
(See summary of findings Table for the main comparison)
All‐cause mortality
(See Analysis 1.1)
Sixteen studies (Anguita 2010; Beck‐da‐Silva 2005; Berger 2010; Eurlings 2010; Jourdain 2007; Karlstrom 2011; Krupicka 2010; Lainchbury 2010; Maeder 2013; Persson 2010; Pfisterer 2009; Schou 2013; Shah 2011; Shochat 2012; Skvortsov 2015; Troughton 2000) with 3292 participants recruited, reported results for all‐cause mortality. Follow‐up ranged from one month to four and a half years. However, data for Maeder 2013 was presented as survival curves and it was not possible to extract or obtain data for this study. Therefore meta‐analysis was only possible for the remaining 15 studies: During the follow‐up period, 265 (18%) participants died in the NP‐guided treatment groups compared to 368 (22%) in the control groups. When the data were pooled for all studies using a fixed‐effect model, the evidence favoured the guided treatment groups, but overall the evidence showed uncertainty (risk ratio (RR) 0.87, 95% confidence interval (CI) 0.76 to 1.01; patients = 3169; studies = 15; low quality of evidence). Heterogeneity was low (I2 = 16%).
The two studies that did not report results for all‐cause mortality were Januzzi 2011 and Li 2015.
Heart failure mortality
(See Analysis 1.2)
Only six studies (Jourdain 2007; Karlstrom 2011; Krupicka 2010; Li 2015; Skvortsov 2015; Troughton 2000) with 853 participants recruited reported results for heart failure mortality. In the NP‐guided treatment groups, 34 participants died and in the control groups 38 participants died due to heart failure, representing 8% and 9% respectively. Similar to all‐cause mortality, the pooled result, using a fixed‐effect model, favoured the intervention, but overall, the evidence showed uncertainty (RR 0.84, 95% CI 0.54 to 1.30; participants = 853; studies = 6; low quality of evidence). The heterogeneity was low (I2 = 21%).
Heart failure admission
(See Analysis 1.3)
Ten studies (Anguita 2010; Berger 2010; Januzzi 2011; Jourdain 2007; Karlstrom 2011; Krupicka 2010; Lainchbury 2010; Schou 2013; Skvortsov 2015; Troughton 2000) with 1928 participants reported on heart failure admission. Out of 858 participants, 219 (26%) experienced a heart failure event causing an admission in the NP‐guided treatment groups; this compared to 403 out of 1070 (38%) participants in the control groups. Overall, the pooled evidence for all 10 studies, with a fixed‐effect model, showed an effect favouring NP‐guided treatment (RR 0.70, 95% CI 0.61 to 0.80; participants = 1928; studies = 10; low quality of evidence). Heterogeneity was substantial (I2 = 60%). The robustness of this finding was tested by converting to a random‐effects model; the effect remained consistent (RR 0.67, 95% CI 0.53 to 0.84; participants = 1928; studies = 10; low quality of evidence).
All‐cause admission
(See Analysis 1.4)
Six studies (Beck‐da‐Silva 2005; Jourdain 2007; Karlstrom 2011; Schou 2013; Shah 2011; Troughton 2000) with 1142 participants recruited reported data for all‐cause admission. During the follow‐up, 304 (53%) participants experienced an event requiring admission in the NP‐guided treatment groups. This compared to 327 (57%) participants in the control groups. The pooled results for all studies, with a fixed‐effect model, favoured the intervention, but overall, the evidence showed uncertainty (RR 0.93, 95% CI 0.84 to 1.03; participants = 1142; studies = 6; low quality of evidence). No heterogeneity was identified (I2 = 0%). Lainchbury 2010 commented that no difference was seen between intervention and control groups for all‐cause admission, but the data were not provided.
Adverse events
(See Table 3)
| Study | Adverse events | |||||||||
| Participants (N) | Missing participants (N) | Number of adverse events (definitions not consistent or not stated; not clear whether first event per participant or every event) | Additional data either from published articles or supplied by author | |||||||
| Intervention group | Control group | Total | Intervention group | Control group | Total | Intervention group | Control group | Total | ||
| 75 | 76 | 151 | 6 | 6 | 12 | 30 | 23 | 53 | No significant differences between groups. No specific event showed a significant difference between groups Events in intervention group: Abdominal pain (1); acute renal failure (4); anaemia (1); atrial fibrillation (2); cough (2); diarrhoea (2); dizziness (5); fever (1); gastrointestinal bleeding (1); hyper/hypokalaemia (3); hypotension (4); respiratory infection (2); syncope(2) Events in control group: Abdominal pain (1); acute renal failure (3); anaemia (0); atrial fibrillation (5); cough (1); diarrhoea (1); dizziness (4); fever (1); gastrointestinal bleeding (1); hyper/hypokalaemia (1); hypotension (0); respiratory infection (4); syncope(1) | |
| 26 | 26 | 52 | 0 | 0 | 0 | 7 | 0 | 7 | Email from author 17.10.14 confirmed: Hyperkalaemia (n = 2); orthostatic hypotension (n = 2); bradycardia (n = 3) | |
| 59 | 64 | 123 | 12 | 12 | 24 | Not reported | Not reported | 66 | Maeder 2013 reported: "58% of the patients in the NT‐proBNP‐guided and 50% in the symptom‐guided group had at least one SAE (p=0.32). SAE’s related to renal failure (14% versus 2%, p=0.01) were more common in the NT‐proBNP‐guided group, whereas hypotension tended to be less common (0% versus 8%, p=0.06)." No additional information | |
| 126 | 124 | 250 | 8 | 7 | 15 | 42 | 39 | 81 | No additional information provided | |
| 251 | 248 | 499 | 32 | 29 | 61 | 123 | 113 | 236 | P = 0.47 Renal impairment: intervention group n = 4, control group n = 5 (P = 0.64) Hypotension: intervention group n = 6, control group n = 3 (P = 0.22) No other type of adverse event described. Adverse events ≥ 75 years old patients: intervention group 10.5% vs control group 5.5% (P = 0.12) Adverse events in < 75 years old patients: intervention group 3.7% vs. control group 4.9% (P = 0.74) | |
| 33 | 36 | 69 | 0 | 0 | 0 | 13 | 9 | 22 | P = 0.32 No additional information provided | |
Six studies (Januzzi 2011; Krupicka 2010; Maeder 2013; Persson 2010; Pfisterer 2009; Troughton 2000) with 1144 participants reported number of adverse events during follow‐up. Maeder 2013 did not report the number of adverse events broken down by intervention group, only as a total for the study. For the remaining five studies, the NP‐guided treatment groups (511 participants) experienced 215 compared to 184 adverse events in the control groups (510 participants). Meta‐analysis was not viable for this outcome since it was possible to have multiple events per individual. Therefore, the results have been tabulated. Quality of evidence was low.
Nevertheless, three studies (Januzzi 2011; Pfisterer 2009; Troughton 2000) commented there was no difference between the NP‐guided treatment and control groups: Januzzi 2011 reported that there was no significant differences between the groups, whilst Pfisterer 2009 and Troughton 2000 reported P values greater than 0.05. Maeder 2013 reported the number of patients experiencing a serious adverse event did not differ between the groups. Two studies (Januzzi 2011; Krupicka 2010) reported a complete breakdown of the nature of the adverse events, whilst Pfisterer 2009 and Maeder 2013 only highlighted two areas (renal impairment and hypotension). For Maeder 2013, adverse events for renal failure were more frequent in the NP‐guided group, where as events were less frequent for hypotension compared to the control group. However, both Januzzi 2011 and Pfisterer 2009 confirmed no difference between the groups based on specific adverse events. Incomplete data meant it was not possible to comment on the most frequent types of adverse events.
Cost
Four studies (Berger 2010; Januzzi 2011; Maeder 2013; Pfisterer 2009) presented data on costs, two only as conference abstracts. It was not possible to pool results for these four studies because the outcome measure differed for each study. Pfisterer 2009 reported on total overall costs per intervention arm: $20,949 for the NT‐proBNP‐guided treatment group versus $23,928 in the symptom‐guided group (control). Generally, costs were comparable, the main difference occurred in the residency costs (staying in a nursing home or home for the elderly): $4157 in the NT‐proBNP‐guided treatment group versus $7564 in the symptom‐guided group.
Januzzi 2011 examined the mean costs in the duration of the study. Overall costs for the NT‐proBNP group totaled $35,262 ($451 per day) versus overall costs for the standard of care management (control) group of $42, 629 ($580 per day). Similar to Pfisterer 2009, the lower costs in the NT‐proBNP group was predominantly due to inpatient costs. Januzzi et al concluded that costs were reduced by approximately 20% in the NT‐proBNP‐guided treatment group over the 10‐month follow‐up period.
In Berger 2010 an economic analysis was completed for a subgroup of participants (n = 190) who had complete follow‐up data. This analysis suggested NP‐guided treatment was cost‐effective and cheaper than in the usual care control group (for the multidisciplinary care control group this was cost neutral).
In contrast to the above three studies Maeder 2013 reported NP‐guided therapy as unlikely to be cost‐effective. Overall costs being $38,876 per patient for the NP‐guided group compared to $21,419 per patient in the control group over 18 months.
Quality of evidence was low.
Quality of Life
(See Analysis 1.5)
Quality of life data were reported in eight studies ((Beck‐da‐Silva 2005; Eurlings 2010; Karlstrom 2011; Lainchbury 2010; Pfisterer 2009; Schou 2013; Skvortsov 2015; Troughton 2000) with 1812 participants recruited using the Minnesota Living with Heart Failure questionnaire. Lainchbury 2010 is only represented by one data set as data were only reported for the usual care control group. The pooled evidence for all studies, using a fixed‐effect model, marginally favoured NP‐guided groups, but overall, the evidence showed uncertainty (mean difference (MD) ‐0.03, 95% CI ‐1.18 to 1.13; very low quality of evidence). Heterogeneity was judged to be substantial (I2 = 75%).
Pfisterer 2009 also reported results for quality of life using the Short Form 12 and Duke Activity Status Index questionnaires; though not included due to incompatibility, both of these showed an improvement in both guided treatment and control groups with no differences in the degree of improvement.
In Karlstrom 2011, changes in quality of life for participants was measured using the Swedish and Norwegian Short Form Health Survey 36; 68% from the NP‐guided group and 74% from the control group completed the survey at both the start and end of the study. For these participants NP‐guided treatment did not improve quality of life compared to clinical assessment alone.
Participants in Persson 2010 completed the Kanas City Cardiomyopathy Questionnaire at baseline and follow‐up. This symptom score tool contains a quality of life element. In Persson 2010, the scores improved in both groups (+3.6 (SEM 1.65) in the NT‐proBNP group and +6.2 (SEM 1.66) in the control group). There was no differences between the groups (P = 0.28).
Subgroup analysis
Except for age, it was not possible to explore subgroups within the study populations. Data were reported for severity of heart failure, baseline NT‐proBNP, target NT‐proBNP, achieved NT‐proBNP/BNP drop and gender, but generally only as totals, in varying categories, or as averages, for intervention and control groups (Table 1, Table 2). Post hoc, consideration was given to subgrouping by left ventricular ejection fraction, (LVEF), but this too was not reported in an appropriate form (Table 1). All studies were completed under supervision of the hospital, except for Berger 2010 and Lainchbury 2010 where supervision was jointly in hospital and the community, and therefore subgroup analysis for this factor was not completed.
Subgroup analysis was only possible by age for three studies (Eurlings 2010; Lainchbury 2010; Shochat 2012) and only for the primary outcome of all‐cause mortality (see Analysis 3.1). From the three studies, including Lainchbury 2010 with two control groups, there were 830 participants. For this analysis, the age threshold was set as equal or greater than 75 years old versus under 75 years old, though the data from Eurlings 2010 are reported marginally different as greater than 74 versus equal to or less than 74 years old. When the data from these three studies were pooled, the evidence showed uncertainty for either age subgroup. However, whilst showing uncertainty for either age subgroup the results suggest that for participants equal to or greater than 75 years old, the effect favoured the control groups (RR 1.23, 95% CI 0.96 to 1.57; participants = 410; studies = 3) whilst for participants less than 75, the effect favoured the guided‐treatment groups ((RR 0.73, 95% CI 0.49 to 1.10; participants = 420; studies = 3) (Analysis 3.1).
Lainchbury 2010 further reported data by age for heart failure admission (=/< 75 years: RR 1.13, 95% CI 0.77 to 1.64; participants = 188; < 75 years: RR 0.73, 95% CI 0.45 to 1.17; participants = 177) (Analysis 3.2). The data followed a similar trend to the pooled data for age and all‐cause mortality.
Despite data not being available to pool, three further studies did comment on the age of participants in their results. Januzzi 2011 concluded for their study that 'no interaction between NT‐proBNP‐guided care and age was found (P = 0.11)'. Persson 2010 commented 'levels of NT‐proBNP tended to decrease more in patients younger than 75 years than in patients older than 75 years (change ‐2.4% ≥75 versus ‐20.3% <75 years, P = 0.06). Finally, Pfisterer 2009 reported that in the first six months the BNP levels decreased similarly for both guided treatment and control groups and were similar for participants under 75 and equal to or over 75 years of age. Though Pfisterer 2009 did state that "there was a significant interaction between treatment and age groups, i.e. patients aged ≥ 75 years in the NT‐proBNP group had a smaller relative benefit on NT‐proBNP levels (p = 0.04) and symptoms (p = 0.05) than younger patients". At eighteen months, the interaction between treatment and age was significant for mortality (P = 0.01, Cox regression adjusting for baseline characteristics) indicating that 'NT‐proBNP‐guided treatment differed significantly between younger and older patients'.
Post hoc subgroup analysis was carried out to explore whether data from two studies (Berger 2010; Lainchbury 2010) using usual care differed to all other studies using clinical assessment as the comparator to NP‐guided treatment (Analysis 2.1). This was only possible for two outcomes. For the primary outcome of all‐cause mortality, the evidence showed very little difference for either subgroup (usual care RR 0.79, 95% CI 0.56 to 1.13; participants = 319; studies =2; clinical assessment RR 0.89, 95% CI 0.76 to 1.04; participants = 2850; studies = 15) to each other or compared to the overall pooled result (RR 0.87, 95% CI 0.76 to 1.01; participants = 3169; studies = 15; low quality evidence) (Analysis 1.1). Similarly, for heart failure admission there was very little difference for either subgroup (usual care RR 0.72, 95% CI 0.53 to 0.99; participants = 319, studies = 2; clinical assessment RR 0.70, 95% CI 0.60 to 0.81; participants = 1609, studies = 10) to each other or the overall pooled result (RR 0.70, 95% CI 0.61 to 0.80; participants = 1928; studies = 10; low quality evidence) (Analysis 1.3).
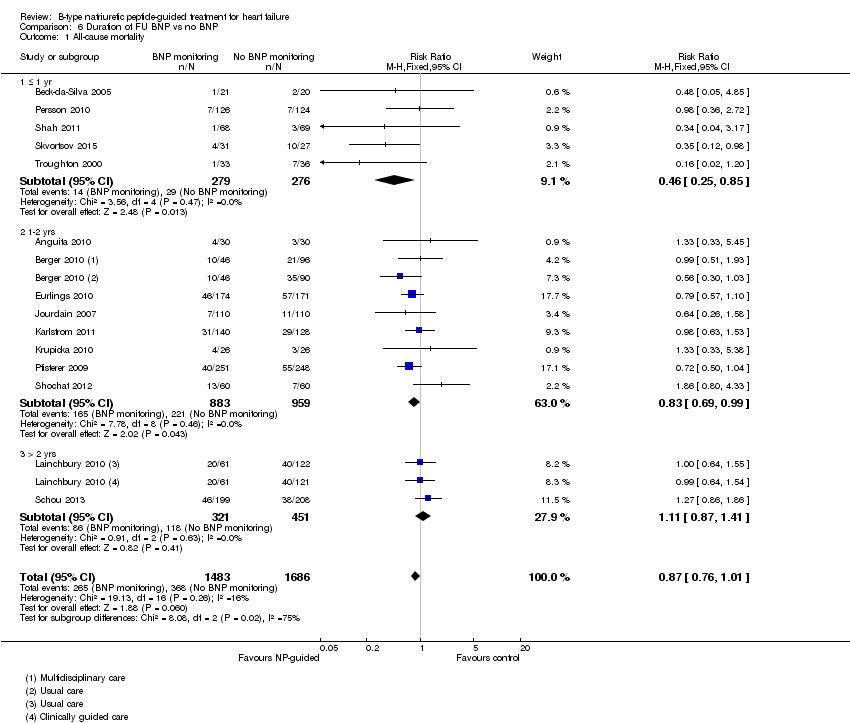
Post‐hoc we explored the effect of duration of the intervention on outcomes. Analysis 6.1 shows that both at ≤ one year (RR 0.46, 95% CI 0.25 to 0.85; participants = 555; studies = 5; P =0.01; I2 = 0%) and between one and two years (RR 0.83, 95% CI 0.69 to 0.99; participants = 1842; studies = 8; P =0.04; I2 = 0%), there was a potential reduction for all‐cause mortality, but the evidence showed uncertainty at > two years (RR 1.11, 95% CI 0.87 to 1.41; participants = 772; studies = 2; P = 0.41; I2 = 0%) and the subgroup test for difference was significant (P =0.02). The effect of duration on heart failure admission shows a similar trend for each subgroup (≤ one year: RR 0.37, 95% CI 0.23 to 0.58; participants = 278; studies = 3, one to two years: RR 0.65, 95% CI 0.54 to 0.79; participants = 878; studies = 5; > two years: RR 0.97, 95% CI 0.77 to 1.23; participants = 772; studies = 2), again the test for subgroup effect was significant (P = 0.0004) Analysis 6.3. For heart failure mortality (Analysis 6.2), all‐cause admission (Analysis 6.4) and quality of life (Analysis 6.5), the subgroups all showed uncertainty similar to the overall pooled result for each outcome.
Post hoc we also explored the assumption that the two biomarkers were sufficiently biologically and clinical similar to evaluate together. We investigated this by separating the pooled data by each biomarker. For all‐cause mortality (Analysis 7.1), heart failure mortality (Analysis 7.2), all‐cause admission (Analysis 7.4) and quality of life (Analysis 7.5), the pooled data for each biomarker showed uncertainty and were similar to the overall pooled result for each outcome. For heart failure admission, using a fixed‐effect model, the result grouping the trials by BNP (Anguita 2010; Jourdain 2007; Karlstrom 2011; Krupicka 2010), or NT‐ProBNP (Berger 2010; Januzzi 2011; Lainchbury 2010; Schou 2013; Skvortsov 2015; Troughton 2000) did not make a difference to the main findings (BNP: RR 0.70, 95% CI 0.56 to 0.87; participants = 600; studies = 4; NT‐proBNP: RR 0.70, 95% CI 0.59 to 0.84; participants = 1328; studies 6) Analysis 7.3. In view of the substantial heterogeneity we tested the robustness of this finding using a random‐effects model and found that the pooled result for studies using the BNP marker continued to favour NP‐guided treatment but now showed uncertainty (BNP: RR 0.68, 95% CI 0.43 to 1.05; participants = 600; studies = 4; NT‐proBNP: RR 0.65, 95% CI 0.48 to 0.89; participants = 1328; studies 6).
Sensitivity analysis
Risk of bias within the studies varied across the aspects of bias assessed. Blinding of participants and study personnel appeared to be poor (see Figure 2 and Figure 3), nevertheless, it was not always practical to blind participants and personnel in some studies. High risk in this category could still mean one party was blinded. Blinding of outcome assessment and attrition was judged to potentially impact on the pooled results.
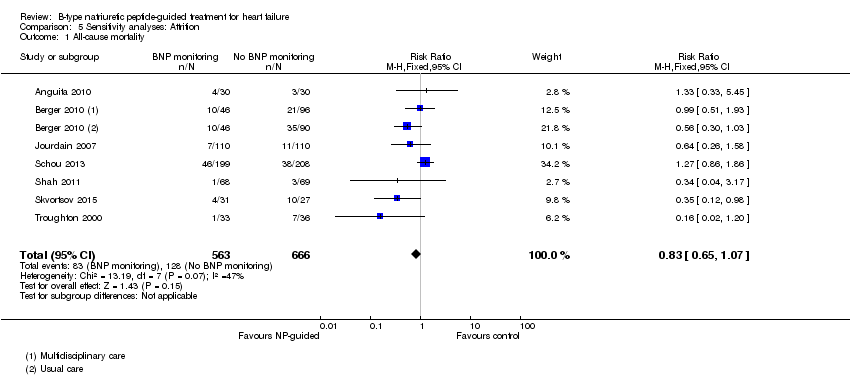
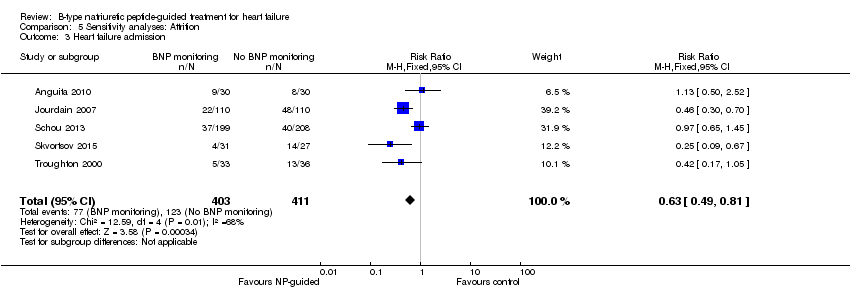
Sensitivity analyses were completed restricting studies to those with low risk of bias for blinding of outcome assessment (Berger 2010; Eurlings 2010; Karlstrom 2011; Lainchbury 2010; Schou 2013) and for attrition (Anguita 2010; Berger 2010; Jourdain 2007; Li 2015; Schou 2013; Shah 2011; Skvortsov 2015; Troughton 2000). For all outcomes, the analyses produced a similar effect to the main findings (see Table 4). Though there was only one study (Karlstrom 2011) assessed as low risk for detection bias for heart failure mortality and therefore no comparison with the main findings could be made in this instance.
| Outcome | Studies(N) | Participants (n) | Risk ratio | 95% Confidence intervals | |
| Outcome blinding (low risk of bias studies only) | |||||
| All‐cause mortality | 5 | 1663 | 0.94 | 0.80 to 1.11 | |
| Heart failure mortality | 1 | 268 | 1.20 | 0.66 to 2.20 | |
| Heart failure admission | 4 | 1318 | 0.83 | 0.71 to 0.98 | |
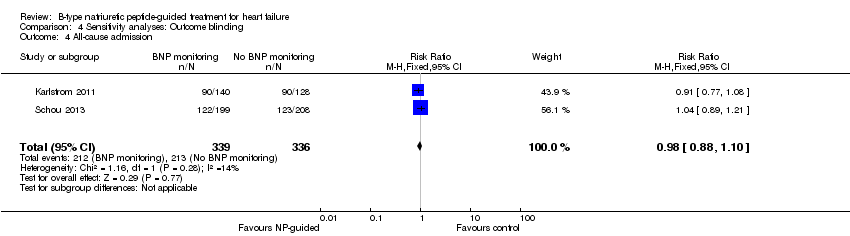
| All‐cause admission | 2 | 675 | 0.98 | 0.88 to 1.10 | |
| Quality of life | 3 | 994 | ‐0.01 | ‐1.28 to 1.27 | |
| Incomplete data (low risk of bias studies only) | |||||
| All‐cause mortality | 7 | 1229 | 0.83 | 0.65 to 1.07 | |
| Heart failure mortality | 4 | 533 | 0.52 | 0.26 to 1.03 | |
| Heart failure admission | 5 | 814 | 0.63 | 0.49 to 0.81 | |
| All‐cause admission | 4 | 833 | 0.94 | 0.83 to 1.07 | |
| Quality of life | 3 | 534 | ‐0.57 | ‐1.92 to 0.78 | |
Discusión
Resumen de los resultados principales
Se encontraron pruebas no confiables del tratamiento guiado por el PN en pacientes con insuficiencia cardíaca para la mortalidad por todas las causas o la mortalidad por insuficiencia cardíaca. Además, las pruebas tampoco fueron confiables para la mortalidad por todas las causas cuando se examinaron los subgrupos con menos o más de 75 años de edad. El ingreso por insuficiencia cardíaca se redujo, pero las pruebas para el ingreso por todas las causas no fueron confiables. Además, hubo pruebas no confiables de que el tratamiento guiado por el PN mejora la calidad de vida. No fue posible agrupar los resultados para los eventos adversos y el costo. En todos los resultados agrupados las pruebas son de baja calidad, excepto el resultado calidad de vida, donde el nivel de calidad de las pruebas fue muy bajo (ver Resumen de los hallazgos para la comparación principal). El ajuste a una dosis mayor o menor de la medicación varió entre los estudios en cuanto a las guías o algoritmos utilizados y los cambios en la medicación; tampoco se informaron los niveles de NT de manera consistente entre los estudios. Este hecho hizo que no fuera posible evaluar la repercusión de alguno de estos aspectos sobre el ingreso por insuficiencia cardíaca.
Compleción y aplicabilidad general de las pruebas
La revisión incluyó 18 estudios que reclutaron a 3660 participantes. La edad de los participantes en los estudios puede haber favorecido a los pacientes más jóvenes, ya que la edad promedio de los participantes varió de 62 a 80 años de edad; sin embargo, la clasificación funcional de la New York Heart Association (NYHA) varió de manera suficiente entre los ensayos para asegurar una variedad amplia en la gravedad. No fue posible evaluar varios subgrupos importantes; en particular, la gravedad de la insuficiencia cardíaca al inicio, que puede apoyar un efecto importante del tratamiento guiado por el PN sobre los resultados de mortalidad. Una revisión sistemática en pacientes con insuficiencia cardíaca que incluyó 19 estudios informó que cada aumento de 100 pg/ml del PNB tuvo un aumento asociado del 35% en el riesgo relativo de muerte (Doust 2005). Con respecto a lo anterior, no fue posible realizar el análisis de subgrupos del PN inicial y la disminución del PN, lo que podría apoyar el mecanismo del efecto. Además, varios análisis estuvieron limitados por la falta de información: sólo seis estudios informaron el ingreso por todas las causas, hubo datos limitados sobre los costos y sólo seis estudios informaron los eventos adversos.
Calidad de la evidencia
Todos los estudios incluidos se informaron como aleatorios, pero no todos informaron los métodos de asignación al azar. Ocho confirmaron la ocultación de la asignación y se consideraron con bajo riesgo de sesgo, y los otros diez se consideraron con riesgo de sesgo incierto. Con frecuencia el cegamiento se realizó de manera deficiente; sólo un estudio informó el cegamiento de los participantes y el personal del estudio a la asignación al tratamiento y sólo cinco estudios informaron el cegamiento de los evaluadores de resultado. Catorce estudios informaron los resultados sobre una base por intención de tratar y el sesgo de deserción, ocho estudios se consideraron con bajo riesgo ya que siete estudios no tuvieron pérdidas durante el seguimiento y el otro documentó completamente las pérdidas informadas.
La calidad de las pruebas se evaluó mediante el enfoque Grading of Recommendations Assessment, Development and Evaluation (GRADE) y se utilizó GRADE profiler (GRADEPRO) para importar los datos de Review Manager y crear una tabla "Resumen de los hallazgos". Para la calidad general de las pruebas, el resultado primario más la mortalidad por insuficiencia cardíaca, el ingreso por insuficiencia cardíaca y el ingreso por todas las causas se consideraron de baja calidad y la calidad de vida se consideró de muy baja calidad, lo que indica poca/muy poca confiabilidad en el resultado agrupado, pero el resultado podría variar y es probable que se vea influido por los estudios de investigación futuros. La calidad de las pruebas para los eventos adversos y el costo, que no se agruparon, también se consideró baja. La calidad de las pruebas se disminuyó principalmente por las limitaciones en el diseño de los estudios o la inconsistencia en los datos.
Sesgos potenciales en el proceso de revisión
Aunque se realizó una búsqueda minuciosa sin restricciones de fecha ni de idioma, es posible que algunos estudios se hayan pasado por alto en la búsqueda y la selección de los estudios. No fue posible incluir datos de un estudio en el resultado primario. Aunque sólo 15 estudios contribuyeron con datos al gráfico en embudo de la mortalidad por todas las causas, el gráfico muestra una asimetría leve, con una falta de estudios más pequeños que muestren un efecto control beneficioso. Lo anterior indica la posibilidad de sesgo de publicación (ver Figura 4).
Acuerdos y desacuerdos con otros estudios o revisiones
Se han realizado al menos 12 revisiones sobre los efectos del tratamiento guiado por el PN: tres revisiones narrativas (De Vecchis 2013a; De Beradinis 2012; Richards 2012), una revisión sistemática sin metanálisis (Balion 2014), y ocho revisiones que incluyeron metanálisis (De Vecchis 2014; Felker 2009; Li 2013; Li 2014; Porapakkham 2010; Savarese 2013; Troughton 2014; Xin 2015). De estos metanálisis, siete informaron una o más de las mismas medidas de resultado de esta revisión, mientras De Vecchis 2014 sólo examinó un resultado compuesto.
Cinco de las siete revisiones anteriores informaron que el PN redujo la mortalidad por todas las causas en los pacientes con insuficiencia cardíaca y las otras dos, al igual que esta revisión, no informaron efectos en la mortalidad por todas las causas. Ninguna revisión previa ha examinado la mortalidad por insuficiencia cardíaca como un resultado. El ingreso por todas las causas se analizó en tres de las revisiones anteriores y no se informaron efectos, lo que coincide con los resultados de la presente revisión. Al igual que en esta revisión, cinco revisiones anteriores informaron un efecto a favor del tratamiento guiado por el PN cuando se examinó el ingreso por insuficiencia cardíaca y todos informaron un nivel moderado de heterogeneidad. Dos revisiones examinaron los eventos adversos y no informaron una reducción de los eventos en los pacientes que recibieron tratamiento guiado por el PN en comparación con el tratamiento guiado por la evaluación clínica. Hasta el momento ninguna revisión ha examinado los costos, y sólo una revisión anterior (Xin 2015) informó sobre la calidad de vida (ver Tabla 5).
El metanálisis publicado en 2014, Troughton 2014, incluyó datos de pacientes individuales (DPI) de nueve ensayos, agregó conjuntos de datos de dos ensayos y no informó efectos sobre la mortalidad por todas las causas. No obstante, con la ventaja de los DPI, Troughton y colegas pudieron ajustar por las características de los pacientes y utilizaron las curvas de Kaplan Meier para comparar el tiempo hasta la mortalidad por todas las causas entre los grupos de tratamiento guiado por PN y guiado clínicamente e informaron una reducción en la mortalidad por todas las causas (cociente de riesgos instantáneos [CRI]) 0,62; IC del 95%: 0,45 a 0,86; p = 0,004; nueve estudios de DPI). De manera similar a Porapakkham 2010, pero nuevamente con el uso de los datos del tiempo transcurrido hasta el evento, la mortalidad se redujo en los pacientes con menos de 75 años de edad (CRI 0,62; IC del 95%: 0,45 a 0,85; p = 0,004), pero no en los que tenían 75 años y más (CRI 0,98; IC del 95%: 0,75 a 1,3; p = 0,96), y la prueba de interacción entre la edad y el efecto del tratamiento fue significativa (P = 0,028). La hospitalización debido a insuficiencia cardíaca se redujo en los pacientes con tratamiento guiado por el PN al utilizar los datos de tiempo hasta el evento (CRI 0,80; IC del 95%: 0,67 a 0,94; p = 0,009); sin embargo, no hubo un efecto en la hospitalización por todas las causas cuando se utilizó el tiempo hasta el evento (CRI 0,94; IC del 95%: 0,84 a 1,07; P = 0,38).
Aunque no es directamente comparable con esta revisión, De Vecchis 2014 incluyó seis ensayos controlados aleatorios (ECA) (n = 1775 pacientes) en una revisión sistemática de tratamiento guiado por PNB versus guiado por los síntomas en pacientes ambulatorios con insuficiencia cardíaca crónica. Dicha revisión informó que el tratamiento guiado disminuyó un resultado compuesto de mortalidad y hospitalizaciones por insuficiencia cardíaca durante el período de seguimiento (odds ratio [OR] 0,64; IC del 95%: 0,43 a 0,95; P = 0,028, I2 = no informada).
Las revisiones anteriores han completado algunos análisis de subgrupos que se pueden comparar con los análisis de subgrupos de esta revisión (ver Tabla 6). Sólo Porapakkham 2010 es directamente comparable con esta revisión e informó, de manera similar, un resultado no confiable para la mortalidad por todas las causas en los pacientes con más de 75 años de edad. Sin embargo, en los pacientes con menos de 75 años, a diferencia de esta revisión Porapakkham 2010 informó un efecto significativo para la monitorización del PN en comparación con la evaluación clínica.
Li 2013 informó que los ingresos por insuficiencia cardíaca se redujeron en los pacientes con mayor PNB inicial ≥ 2114 pg/ml (CR 0,53; IC del 95%: 0,39 a 0,72; P < 0,0001, I2 = 21,8%). Además, Li 2014 completó análisis de sensibilidad que muestran una reducción en la mortalidad por todas las causas y el ingreso por insuficiencia cardíaca se observó especialmente en los pacientes con una reducción de la función de expulsión.
Esta revisión es consistente con revisiones anteriores en todos los resultados, excepto en la mortalidad por todas las causas. Para este resultado, las primeras cinco revisiones (cronológicamente) (Felker 2009; Porapakkham 2010; Li 2013; Savarese 2013; Li 2014) encontraron una reducción, mientras que Troughton 2014 encontró una reducción después del ajuste por las características de los pacientes. La última revisión sistemática realizada por Xin 2015 no informó un efecto sobre este resultado, similar a esta revisión. Uno de los últimos ensayos publicados (Schou 2013) informa que la mortalidad por todas las causas fue mayor en el grupo guiado por el PN. La estimación agrupada del efecto basada en la exclusión de este estudio muestra una reducción en la mortalidad por todas las causas similar a las revisiones sistemáticas anteriores. Por lo tanto, la inconsistencia en esta estimación hace que se recomiende la necesidad de evaluación adicional.
Study flow diagram.

Funnel plot of comparison: NP‐guided versus no NP‐guided treatment for all‐cause mortality.
'Risk of bias' summary: review authors' judgements about methodological quality for each included study
'Risk of bias' graph: review authors' judgements about methodological quality presented as percentages across all included studies.
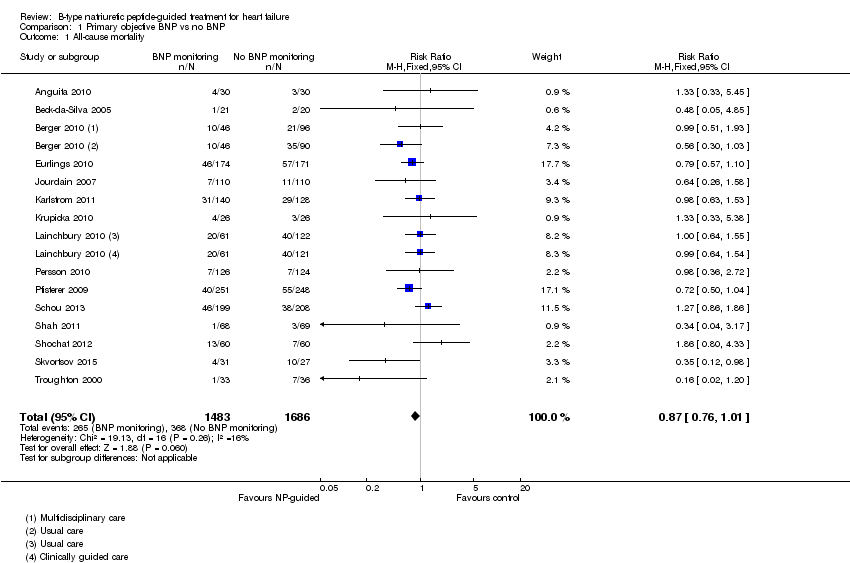
Comparison 1 Primary objective BNP vs no BNP, Outcome 1 All‐cause mortality.

Comparison 1 Primary objective BNP vs no BNP, Outcome 2 Heart failure mortality.

Comparison 1 Primary objective BNP vs no BNP, Outcome 3 Heart failure admission.

Comparison 1 Primary objective BNP vs no BNP, Outcome 4 All‐cause admission.
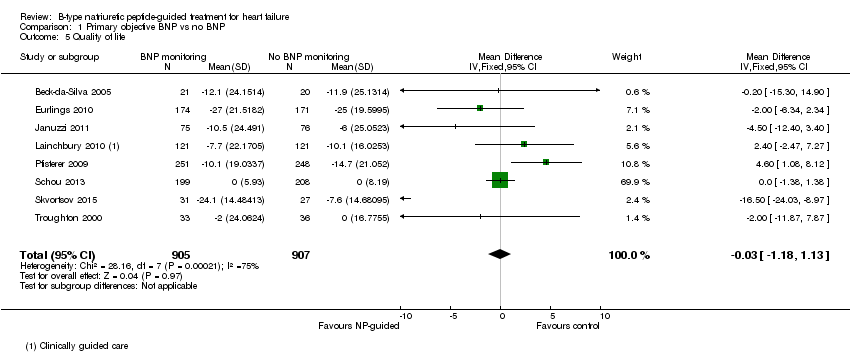
Comparison 1 Primary objective BNP vs no BNP, Outcome 5 Quality of life.
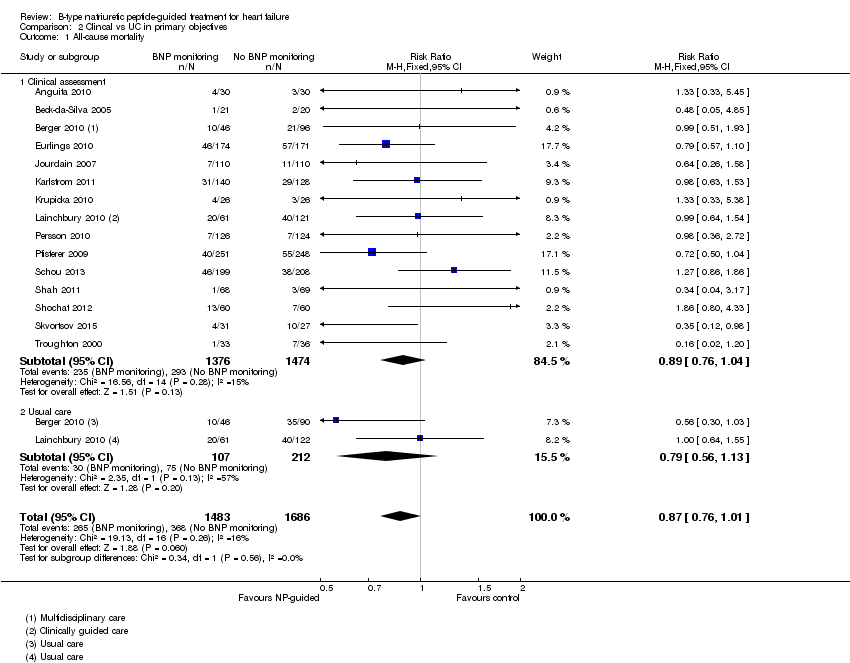
Comparison 2 Clincal vs UC in primary objectives, Outcome 1 All‐cause mortality.
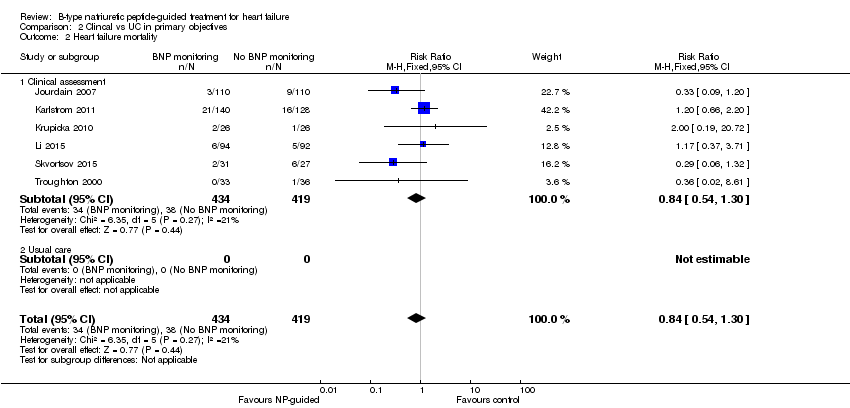
Comparison 2 Clincal vs UC in primary objectives, Outcome 2 Heart failure mortality.
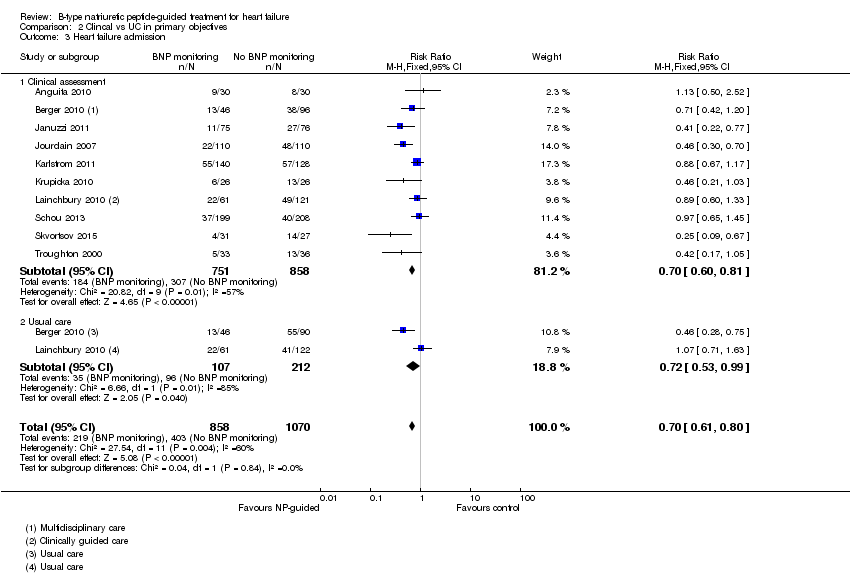
Comparison 2 Clincal vs UC in primary objectives, Outcome 3 Heart failure admission.
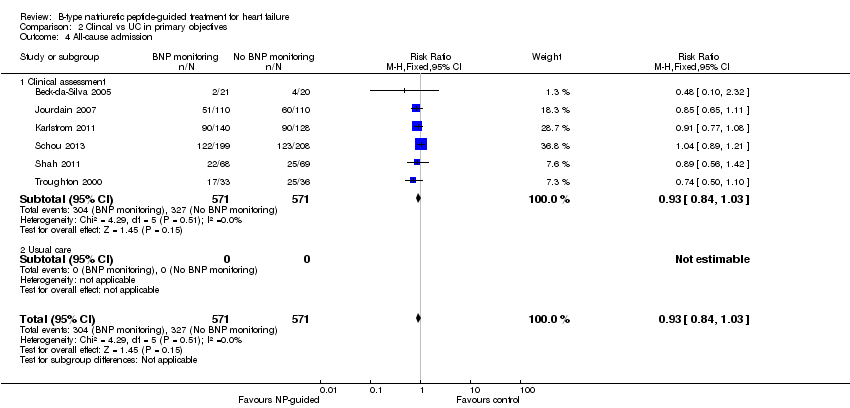
Comparison 2 Clincal vs UC in primary objectives, Outcome 4 All‐cause admission.

Comparison 2 Clincal vs UC in primary objectives, Outcome 5 Quality of life.

Comparison 3 Subgroup analyses, Outcome 1 All‐cause mortality and age.
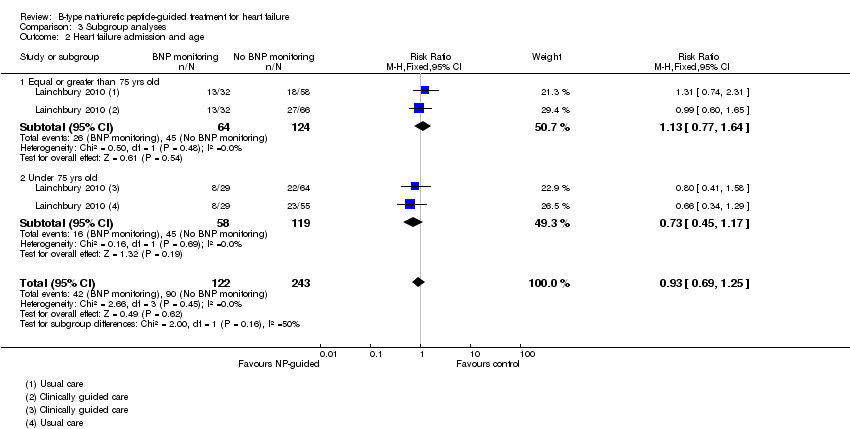
Comparison 3 Subgroup analyses, Outcome 2 Heart failure admission and age.

Comparison 4 Sensitivity analyses: Outcome blinding, Outcome 1 All‐cause mortality.
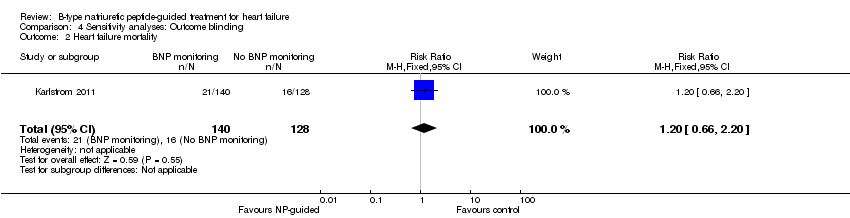
Comparison 4 Sensitivity analyses: Outcome blinding, Outcome 2 Heart failure mortality.
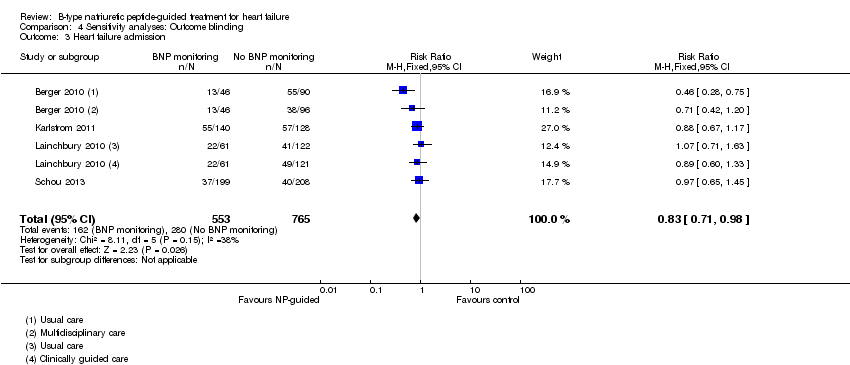
Comparison 4 Sensitivity analyses: Outcome blinding, Outcome 3 Heart failure admission.
Comparison 4 Sensitivity analyses: Outcome blinding, Outcome 4 All‐cause admission.

Comparison 4 Sensitivity analyses: Outcome blinding, Outcome 5 Quality of life.
Comparison 5 Sensitivity analyses: Attrition, Outcome 1 All‐cause mortality.

Comparison 5 Sensitivity analyses: Attrition, Outcome 2 Heart failure mortality.
Comparison 5 Sensitivity analyses: Attrition, Outcome 3 Heart failure admission.

Comparison 5 Sensitivity analyses: Attrition, Outcome 4 All‐cause admission.

Comparison 5 Sensitivity analyses: Attrition, Outcome 5 Quality of life.
Comparison 6 Duration of FU BNP vs no BNP, Outcome 1 All‐cause mortality.
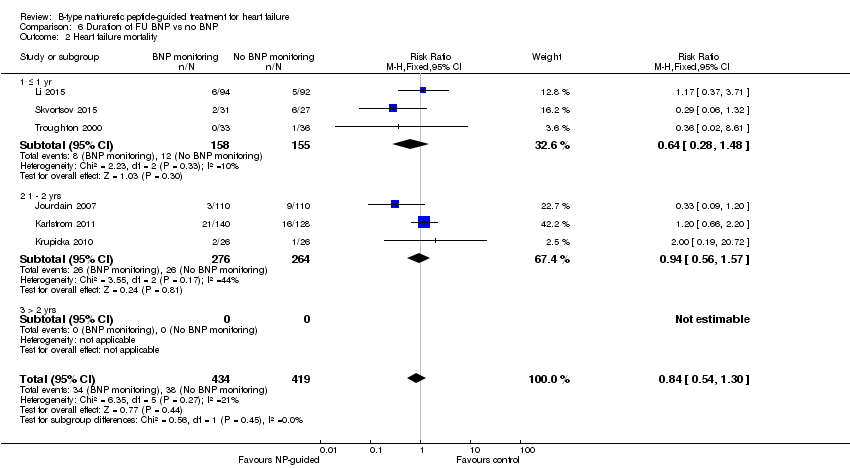
Comparison 6 Duration of FU BNP vs no BNP, Outcome 2 Heart failure mortality.

Comparison 6 Duration of FU BNP vs no BNP, Outcome 3 Heart failure admission.
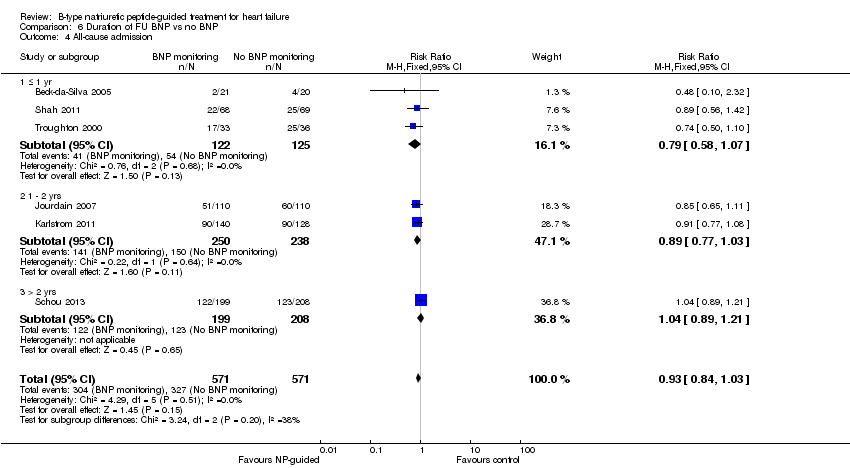
Comparison 6 Duration of FU BNP vs no BNP, Outcome 4 All‐cause admission.
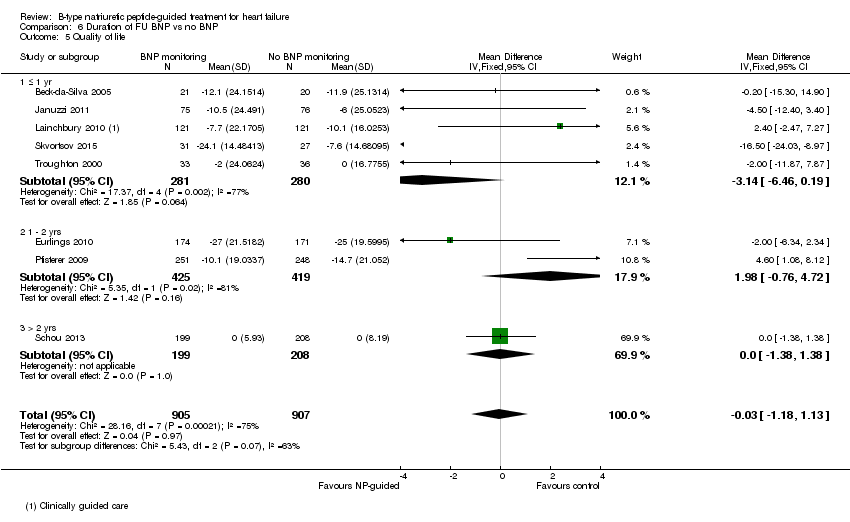
Comparison 6 Duration of FU BNP vs no BNP, Outcome 5 Quality of life.

Comparison 7 Subgroup: BNP vs NT‐proBNP, Outcome 1 All‐cause mortality.

Comparison 7 Subgroup: BNP vs NT‐proBNP, Outcome 2 Heart failure mortality.
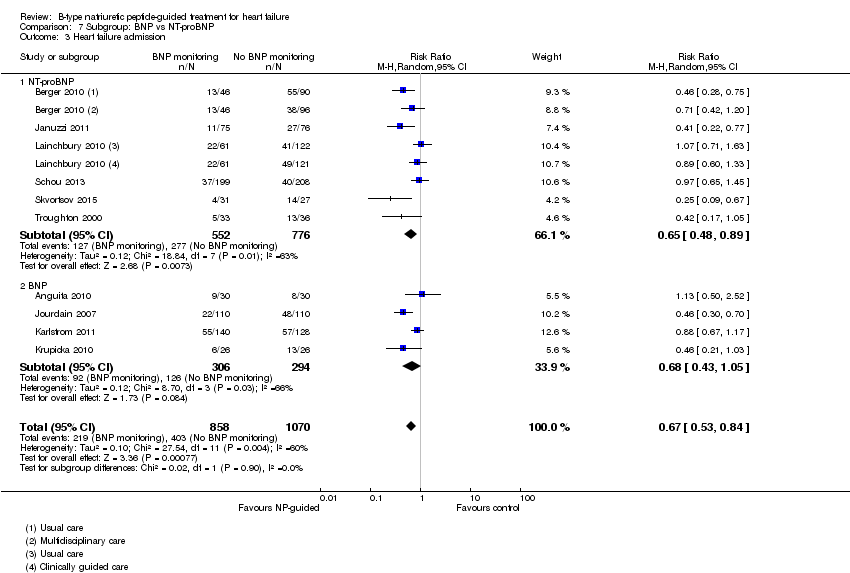
Comparison 7 Subgroup: BNP vs NT‐proBNP, Outcome 3 Heart failure admission.

Comparison 7 Subgroup: BNP vs NT‐proBNP, Outcome 4 All‐cause admission.
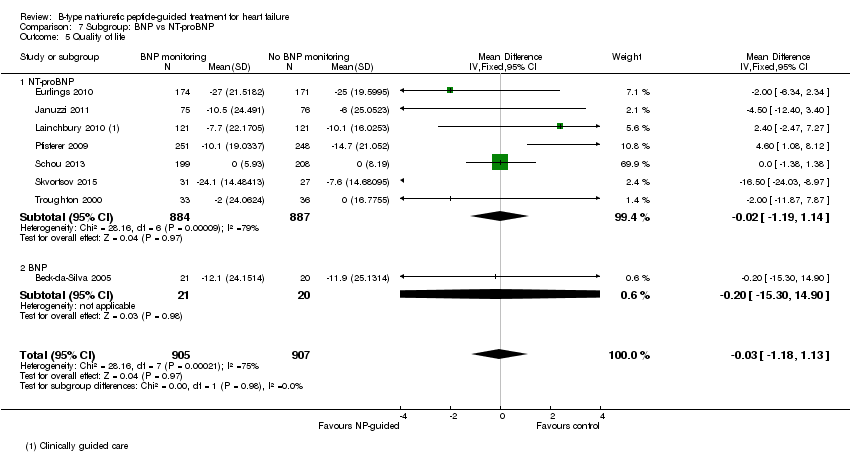
Comparison 7 Subgroup: BNP vs NT‐proBNP, Outcome 5 Quality of life.
| Does treatment guided by serial BNP or NT‐proBNP monitoring improve outcomes compared to treatment guided by clinical assessment alone? | ||||||
| Patient or population: patients with heart failure | ||||||
| Outcomes | Illustrative comparative risks* (95% CI) | Relative effect | No of Participants | Quality of the evidence | Comments | |
| Assumed risk | Corresponding risk | |||||
| No BNP or NT‐proBNP‐guided treatment | Serial BNP or NT‐proBNP‐guided treatment | |||||
| All‐cause mortality | 218 per 1000 | 190 per 1000 | RR 0.87 | 3169 | ⊕⊕⊝⊝ | 16 studies reported on all‐cause mortality (n = 3292), but only 15 studies are included in the meta‐analysis (n = 3169). For one study data could not be extracted or obtained in a format useable in the review. Funnel plot analysis suggests possible lack of small studies (beneficial control effect). Insufficient to justify downgrading the quality of evidence. |
| Heart failure mortality | 91 per 1000 | 76 per 1000 | RR 0.84 | 853 | ⊕⊕⊝⊝ | |
| Heart failure admissions | 377 per 10002 | 264 per 1000 | RR 0.70 | 1928 | ⊕⊕⊝⊝ | |
| All‐cause admissions | 573 per 10002 | 533 per 1000 | RR 0.93 | 1142 | ⊕⊕⊝⊝ | |
| Adverse events | See comment | See comment | Not estimable | 1144 | ⊕⊕⊝⊝ | 3/6 studies commented on the difference between the intervention and control groups: no significant difference in one and two favoured the intervention group |
| Cost | See comment | See comment | Not estimable | 1051 | ⊕⊕⊝⊝ | 3/4 studies suggested reduced cost in the intervention groups. One study suggested NP‐guided treatment was unlikely to be cost‐effective. |
| Quality of life | The mean quality of life ranged across control groups from | The mean quality of life in the intervention groups was | 1812 | ⊕⊝⊝⊝ | Lower score indicates better quality of life | |
| *The basis for the assumed risk (e.g. the median control group risk across studies) is provided in footnotes. The corresponding risk (and its 95% confidence interval) is based on the assumed risk in the comparison group and the relative effect of the intervention (and its 95% CI). | ||||||
| GRADE Working Group grades of evidence | ||||||
| 1 The comparisons (controls) fell into two groups: same as the intervention without BNP or NT‐proBNP measures or usual care | ||||||
| Study | Participants treated in community or secondary care | Baseline NYHA classification (stages I ‐ IV) | Baseline left ventricular ejection fraction (LVEF, %) | |||||
| Study inclusion criteria | Intervention group | Control group | Comment in text | Study inclusion criteria | Intervention group (mean, SD unless stated) | Control group (mean, SD unless stated) | ||
| Hospital | Stage ≥ III | Stage III 73%, IV 27% | Stage III 63%, IV 37% | Not inclusion criterion | 44 (18) | 46 (18) | ||
| Hospital (outpatient) | Stages II ‐ III | 2.6 ± 0.7 (mean, SD) | 2.4 ± 0.6 (mean, SD) | <40% | 23.8 ± 8.8 | 20.9 ± 9.2 | ||
| Hospital & community | Stages III ‐ IV | Not stated | Not stated | <40% | NS | NS | ||
| Hospital | Not inclusion criterion | Stage I = 11.5%, II = 64.9%, III = 23.6% | stage I = 9.9%, II = 70.8%, III = 19.3% | Not inclusion criterion | 34.9 ± 13.7 | 36.7 ± 14.8 | ||
| Hospital | Stages II ‐ IV | Stage II or III = 85.5% | Stage II or III = 84.2% | ≤ 40% | 28 ± 8.7 | 25.9 ± 8.3 | ||
| Hospital (outpatient) | Stages II ‐ III | 2.29 ±0.6 (mean, SD) | 2.21 ± 0.62 (mean, SD) | <45% | 29.9 ± 7.7 | 31.8 ± 8.4 | ||
| Hospital | Stages II ‐ IV | Stage II = 32%, III = 52%, IV = 15% | Stage II = 27%, III = 59%, IV = 14% | <40% | <30% = 57% | <30% = 58% | ||
| Hospital | Stages III ‐ IV | 2.1 (0.3) (mean, SD) | 2.1 (0.3) (mean, SD) | ≤ 45% | 36.1% (7.2) | 32.3% (9.6) | ||
| Hospital & community | Not inclusion criterion | NT‐proBNP group: stage I 12%, II 68%, III 18%, IV 2% | Clinically‐guided group: Stage I 7%, II 66%, III 25%, IV 2%; Usual care: stage I 7%, II 67%, III 25%, IV 1% | Not inclusion criterion though deliberated included patients with preserved LVEF | 40 ±15 | CG = 39 ± 15, UC = 37 ± 15 | ||
| Hospital | Stages III ‐ IV | NS | NS | Not inclusion criterion | 30 ± 8.1 | 28 ± 7.9 | ||
| Hospital (outpatient) | Stages ≤ II | 49 (83) ≥ III (median, IQR) | 53 (83) ≥ III (median, IQR) | 'symptoms improved similarly' (at 6 months) | > 45% | 56 ± 6 | 56 ± 7 | |
| Community | Stage II ‐ IV | Stage II 62%, III 38% | Stage II 61%, III 39% | 'Improvements in NYHA class and dyspnoea symptoms were seen in both allocation groups, but with no significant differences between the groups' | <50% | 31 (9) | 33 (7) | |
| Hospital (outpatient) | Stages ≤ II | 186 ≥ III (n) | 185 ≥ III (n) | ≤ 45% | 29.8 (7.7) | 29.7 (7.9) | ||
| Hospital | Not inclusion criterion | Stage I ‐ II 86 % | Stage I ‐ II 85 % | <45% | 30 (14‐45) median (range) | 30 (15‐45) median (range) | ||
| Hospital | Stage III ‐ IV | Authors have no data for baseline NYHA | Authors have no data for baseline NYHA | <35% | 20 (15‐25) median (range) | 20 (15‐25) median (range) | ||
| Hospital | Not stated | 2.53 (mean) | 2.34 (mean) | Not inclusion criterion | 23 (6) | 23 (7) | ||
| Hospital (outpatient) | Stage III ‐ IV | Stage III 23%, IV 76% | Stage III 26%, IV 74% | At hospital admission | <40% | 29.2 (6.1) | 29.4 (6.1) | |
| Hospital | Stages II ‐ IV | Stage II 72%, overall 2.3 (mean) | Stage II 67%, overall 2.3 (mean) | <40% | 28 | 26 | ||
| Study | Target BNP/NT‐proBNP (pg/mL, unless stated) | Baseline BNP or NT‐proBNP measurement (units in pg/mL and given as mean (SD), unless stated) | BNP/NT‐proBNP drop (as % of baseline) (units in pg/mL and given as mean (SD), unless stated) | ||||
| Biomarker | Study inclusion criteria | Intervention group | Control group | Comment in text | |||
| 100 | BNP | No inclusion threshold | 57 (77) | 65 (97) | No percentage drop reported. BNP at 18 months follow‐up: BNP‐guided group 14 (20); control group 111 (71) | ||
| No target set/stated | BNP | No inclusion threshold | 502.3 (411.3) | 701.6 (409.9) | No percentage drop reported. BNP at follow‐up: control arm 626.8 (325.8); BNP arm 477.8 (406.9) | ||
| < 2200 NT = proBNP (reported in IPD analysis by Troughton 2014) | NT‐proBNP | No inclusion threshold | 2216 (355‐9649) mean (95% CI) | Multidisplinary care 2469 (355 ‐18487; Usual care 2359 (355 ‐15603) mean (95% CI) | No percentage drop reported. NT ‐proBNP change from baseline to FU graphically shown in Berger 2010 (Figure 4). Decrease in NT‐proBNP more apparent in NT‐proBNP‐guided group than multidisplinary group. No decrease in usual care group | ||
| Set individually for each participant as the lowest level at discharge or at 2 weeks follow‐up | NT‐proBNP | NT‐proBNP levels at admission: minimum 1,700 pg/ml. Additionally NT‐proBNP levels during hospitalisation, defined as a decrease of more than 10%, with a drop in NT‐proBNP levels of at least 850 pg/ml, from admission to discharge. | 2961 (1383 ‐ 5144) median (IQR) | 2936 (1291‐5525) median (IQR) | Outcome data available by subgroup baseline BNP (above or below discharge NT‐proBNP 2950 pg/ml) | No percentage drop reported. Median (IQR) at 12 months follow‐up: NT‐proBNP‐guided group ‐432 (‐1392 to 297); Clincially‐guided group ‐572 (‐1329 to 434). | |
| ≤ 1000 | NT‐proBNP | No inclusion threshold | 2344 (median) | 1946 (median) | No percentage drop reported. Median NT‐proBNP at follow‐up: Standard care group 1844 (P = 0.61 follow‐up vs baseline); NT‐proBNP‐guided group 1125 (P = 0.01 vs baseline) | ||
| < 100 | BNP | No inclusion threshold | 352 (260) mean (SD) | Not measured | No percentage drop reported. BNP‐guided group only shown graphically in Jourdain 2007 (figure 5): mean BNP level drops over time and % of patients achieving target increases. | ||
| <150 ng/L in patients under 75; <300 ng/L in patients over 75 yrs | BNP | No inclusion threshold | 808.2 (676.1) ng/L, mean (SD) | 898.9 (915.3 ng/L, mean (SD) | No percentage drop reported. BNP at follow‐up: control group 457 (603), BNP‐guided group 403 (468) | ||
| <100 | BNP | No inclusion threshold | 704 (228‐2852) median (range) | 633 (276‐3756) median (range) | No percentage drop reported. In the BNP group 90% of patients manage to reduce BNP to <400 pg/mL; of this 90%, 2/3 of patients to achieve <100 pg/mL. Email from author "We do not have BNP values of the Clinical group at the end of follow‐up. Median BNP value after 6 months in BNP group was 235pg/ml. (At hospital discharge 704pg/ml; after 1 month 328.5pg/ml; after 3 months 253pg/ml)." | ||
| < 150 µmol/L | NT‐proBNP | No inclusion threshold | 2012 (516‐10233) median (IQR) | Clinically‐guided group: 1996 (425‐6588); Usual care: 2012 (425‐10571) median (IQR) | No percentage drop reported. No follow‐up data. Comment in text 'Plasma NT‐proBNP levels fell similarly within 6 months of randomisation in both the NT‐proBNP and CG groups (by 20% and 23%, respectively; P 0.001)'. | ||
| 50% of basal level or < 300 | BNP | No inclusion threshold | 1167.8 (219.9) mean (SD) | 1145.8 (224.9) mean (SD) | No percentage drop reported. Change in BNP level shown in Figure 2 (Li 2015). 'BNP value decreased dramatically over the duration of medication, but there was no difference between the two groups.' | ||
| < 400 in patients younger than 75 years; < 800 in patients aged 75 years or older | NT‐proBNP | N‐terminal BNP level of 400 pg/mL or higher in patients younger than 75 years and a level of 800 pg/mL or higher in patients aged 75 years or older | 2210 (1514‐4081) ng/L, median (IQR) | 2191 (1478‐4890) ng/L, median (IQR) | Maeder 2013 reports: 'NT‐proBNP was reduced similarly in patients allocated to NT‐proBNP‐guided or symptom‐guided management. The proportion of patients with NT‐proBNP below the target was low throughout the study period and did not significantly differ between groups (Figure 2C) although it tended to be lower in the NT‐proBNP‐guided group. | ||
| At least a 50% reduction from baseline NT‐proBNP | NT‐proBNP | Elevated NT‐proBNP levels (males > 800 ng/L, females > 1000 ng/L) | 2661 (2.1) ng/L, geometric mean(coefficient of variation, %) | 2429 (2.1) ng/L, geometric mean(coefficient of variation, %) | No percentage drop reported. Geometric Mean (SD) at follow‐up: NT‐proBNP‐guided group ‐ 301 ng/L to 2360 ng/L; control group ‐362 ng/L to 2067 ng/L. Comment in text 'similar modest decrease ( 10%) in NT‐proBNP from baseline to end‐of study was observed in both groups……NT‐proBNP levels were reduced by .50% in 24 (19%) and 27 (22%), of patients with and without NT‐proBNP‐guided treatment, respectively'. | ||
| < 400 in patients younger than 75 years; < 800 in patients aged 75 years or older | NT‐proBNP | N‐terminal BNP level of 400 pg/mL or higher in patients younger than 75 years and a level of 800 pg/mL or higher in patients aged 75 years or older | 3998 (2075‐7220) median (IQR) | 4657 (2455‐7520) median (IQR) | No percentage drop reported. No follow‐up data. Pfisterer 2009 (figure 3b) graphically shows data for NT‐proBNP changes over 6 months (by age). Comment in text 'There were no significant differences between the 2 treatment groups by by N‐terminal BNP level (P=.06 vs P=.30).' | ||
| No target set/stated | NT‐proBNP | NT‐proBNP ≥ 1000 pg/mL after up‐titration (i.e. at the randomisation visit) | 1884 (1033‐10435) average statistic not stated) | 2042 (1023‐9668) average statistic not stated | No percentage drop reported. Change in NT‐proBNP during follow‐up: NT‐proBNP‐guided group ‐129 (‐722 to 674) median (IQR); Clinically managed group ‐26 (‐681 to 751) median (IQR). Comment in text: 'Patients in whom NT‐proBNP increased ≤ 30% during the follow up period had a higher frequency of admission (69% vs. 47%, P = 0.002), a higher number of admission days (median) (14 days vs. 5 days, P= 0.003), a higher number of admissions (median) (2 vs. 1, P = 0.009), a lower quality of life (mean difference) (6 points, P = 0.032), and a poorer functional class (37% vs. 18% in functional class III–IV, P = 0.001).' | ||
| Discharge BNP | BNP | No inclusion threshold | 453 (221‐1135) median (IQR) | 440 (189 ‐981) median (IQR) | No percentage drop reported. Median (IQR) BNP at follow‐up: BNP‐guided group 412.5 (111,894); control (congestion score) group 471 (235.5, 1180) | ||
| No target set/stated | NT‐proBNP | Email from author confirmed 'NT‐ProBNP > 2000 at day of randomisation' | 5868 (2532) | 5820 (2434) | No percentage drop reported. | ||
| <1000 pg/mL or at least 50% reduction from baseline NT‐proBNP at discharge | NT‐proBNP | > 1400 pg/mL at hospital admission | 3750 (2224‐ 6613) median (IQR) | 2783.0 (2021.5‐ 4827.5) median (IQR) | At hospital discharge | At 6 months: NT‐proBNP‐guided group: 53% (Median drop (QR): 1585.5 (976.6, 2742.5)) Control group: 10.2% (median (IQR): 2189.0 (1954.0, 3688.5)) | |
| 200 µmol/L | NT‐proBNP | No inclusion threshold | 217 µmol/L, mean | 251 µmol/l, mean | No percentage drop reported. At 6 months follow‐up: Nt‐proBNP‐guided group decreased by 79 pmol/L, mean; clinically‐guided group decreased by 3 pmol/L, mean (P = 0.16) | ||
| Study | Adverse events | |||||||||
| Participants (N) | Missing participants (N) | Number of adverse events (definitions not consistent or not stated; not clear whether first event per participant or every event) | Additional data either from published articles or supplied by author | |||||||
| Intervention group | Control group | Total | Intervention group | Control group | Total | Intervention group | Control group | Total | ||
| 75 | 76 | 151 | 6 | 6 | 12 | 30 | 23 | 53 | No significant differences between groups. No specific event showed a significant difference between groups Events in intervention group: Abdominal pain (1); acute renal failure (4); anaemia (1); atrial fibrillation (2); cough (2); diarrhoea (2); dizziness (5); fever (1); gastrointestinal bleeding (1); hyper/hypokalaemia (3); hypotension (4); respiratory infection (2); syncope(2) Events in control group: Abdominal pain (1); acute renal failure (3); anaemia (0); atrial fibrillation (5); cough (1); diarrhoea (1); dizziness (4); fever (1); gastrointestinal bleeding (1); hyper/hypokalaemia (1); hypotension (0); respiratory infection (4); syncope(1) | |
| 26 | 26 | 52 | 0 | 0 | 0 | 7 | 0 | 7 | Email from author 17.10.14 confirmed: Hyperkalaemia (n = 2); orthostatic hypotension (n = 2); bradycardia (n = 3) | |
| 59 | 64 | 123 | 12 | 12 | 24 | Not reported | Not reported | 66 | Maeder 2013 reported: "58% of the patients in the NT‐proBNP‐guided and 50% in the symptom‐guided group had at least one SAE (p=0.32). SAE’s related to renal failure (14% versus 2%, p=0.01) were more common in the NT‐proBNP‐guided group, whereas hypotension tended to be less common (0% versus 8%, p=0.06)." No additional information | |
| 126 | 124 | 250 | 8 | 7 | 15 | 42 | 39 | 81 | No additional information provided | |
| 251 | 248 | 499 | 32 | 29 | 61 | 123 | 113 | 236 | P = 0.47 Renal impairment: intervention group n = 4, control group n = 5 (P = 0.64) Hypotension: intervention group n = 6, control group n = 3 (P = 0.22) No other type of adverse event described. Adverse events ≥ 75 years old patients: intervention group 10.5% vs control group 5.5% (P = 0.12) Adverse events in < 75 years old patients: intervention group 3.7% vs. control group 4.9% (P = 0.74) | |
| 33 | 36 | 69 | 0 | 0 | 0 | 13 | 9 | 22 | P = 0.32 No additional information provided | |
| Outcome | Studies(N) | Participants (n) | Risk ratio | 95% Confidence intervals | |
| Outcome blinding (low risk of bias studies only) | |||||
| All‐cause mortality | 5 | 1663 | 0.94 | 0.80 to 1.11 | |
| Heart failure mortality | 1 | 268 | 1.20 | 0.66 to 2.20 | |
| Heart failure admission | 4 | 1318 | 0.83 | 0.71 to 0.98 | |
| All‐cause admission | 2 | 675 | 0.98 | 0.88 to 1.10 | |
| Quality of life | 3 | 994 | ‐0.01 | ‐1.28 to 1.27 | |
| Incomplete data (low risk of bias studies only) | |||||
| All‐cause mortality | 7 | 1229 | 0.83 | 0.65 to 1.07 | |
| Heart failure mortality | 4 | 533 | 0.52 | 0.26 to 1.03 | |
| Heart failure admission | 5 | 814 | 0.63 | 0.49 to 0.81 | |
| All‐cause admission | 4 | 833 | 0.94 | 0.83 to 1.07 | |
| Quality of life | 3 | 534 | ‐0.57 | ‐1.92 to 0.78 | |
| Outcome | Review | Number of RCTs | N | Summary measure (hazard ratio HR, risk ratio RR, odds ratio OR, weighted mean difference WMD) | 95% Confidence intervals | p‐value | Heterogeneity (I2) | |
| All‐cause mortality (all patients) | 6 | 1627 | HR | 0.69 | 0.55 to 0.86 | Not reported | Not reported | |
| 8 | 1726 | RR | 0.76 | 0.63 to 0.91 | 0.003 | Not reported | ||
| 11 | 2414 | RR | 0.83 | 0.69 to 0.99 | 0.0.35 | 0% | ||
| 12 | 2686 | OR | 0.74 | 0.6 to 0.91 | 0.005 | 0% | ||
| Not reported | Not reported | RR | 0.79 | 0.67 to 0.92 | 0.004 | Not reported | ||
| 10 | 2280 | HR | 0.82 | 0.67 to 1.00 | 0.05 | 0% | ||
| 14 | 3004 | RR | 0.94 | 0.81 to 1.08 | 0.39 | 3% | ||
| This review | 15 | 3169 | RR | 0.87 | 0.76 to 1.01 | 0.06 | 16% | |
| Heart failure admission | 7 | 1190 | RR | 0.65 | 0.5 to 0.84 | 0.001 | 52.30% | |
| 8 | 1920 | OR | 0.55 | 0.4 to 0.77 | <0.0001 | 58.20% | ||
| Not reported | Not reported | RR | 0.67 | 0.46 to 0.97 | 0.03 | Not reported | ||
| 11 | 2431 | HR | 0.74 | 0.60 to 0.90 | 0.002 | 24.00% | ||
| 11 | 2572 | RR | 0.79 | 0.63 to 0.98 | 0.03 | 67.00% | ||
| This review | 10 | 1928 | RR | 0.7 | 0.61 to 0.80 | <0.0001 | 60.00% | |
| All‐cause admission | 3 | 330 | RR | 0.82 | 0.64 to 1.05 | 0.12 | Not reported | |
| 5 | 1108 | OR | 0.8 | 0.63‐ 1.02 | 0.077 | 0% | ||
| 7 | 1627 | RR | 0.97 | 0.89 to 1.07 | 0.56 | 8% | ||
| This review | 6 | 1142 | RR | 0.93 | 0.84 to 1.03 | 0.15 | 0% | |
| Adverse events | Not reported | Not reported | RR | 1.15 | 0.99 to 1.342 | 0.69 | Not reported | |
| Adverse events (symptomatic hypotension) | 4 | 838 | RR | 1.72 | 0.59 to 5.05 | 0.32 | 43% | |
| Adverse events (hyper/hypokalemia) | 2 | 354 | RR | 1.34 | 0.42 to 4.34 | 0.62 | 0% | |
| Adverse events (renal dysfunction) | 3 | 769 | RR | 1.46 | 0.34 to 6.24 | 0.21 | 0% | |
| Adverse events (severe cough) | 2 | 220 | RR | 1.93 | 0.69 to 5.37 | 0.21 | 0% | |
| Quality of life | 5 | 1172 | WMD | ‐1.29 | ‐3.81 to 1.22 | 0.31 | 49% | |
| This review | 8 | 1812 | WMD | ‐0.03 | ‐1.18 to 1.13 | 0.97 | 75% | |
| Outcome | Review | Number of RCTs | N | Summary measure (hazard ratio HR, risk ratio RR, odds ratio OR, weighted mean difference WMD) | 95% Confidence intervals | P value | Heterogeneity (I2) | |
| All‐cause mortality (< 75 years) | 2 | 741 | RR | 0.52 | 0.33 to 0.82 | 0.005 | Not reported | |
| This review | 3 | 420 | RR | 0.73 | 0.49 to 1.10 | 0.13 | 58% | |
| All‐cause mortality (> 75 years) | 2 | 741 | RR | 0.94 | 0.71 to 1.25 | 0.7 | Not reported | |
| This review | 3 | 410 | RR | 1.23 | 0.96 to 1.57 | 0.1 | 58% | |
| All‐cause mortality (< 72 years) | 7 | Not reported | RR | 0.82 | 0.58 to 1.17 | Not reported | 0% | |
| All‐cause mortality (≥ 72 years) | 7 | Not reported | RR | 0.96 | 0.83 to 1.13 | Not reported | 24% | |
| Heart failure admission (<70 years) | Not reported | Not reported | RR | 0.45 | 0.33 to 0.61 | < 0.0001 | 0% | |
| Not reported | Not reported | RR | 0.44 | 0.31 to 0.63 | Not reported | Not reported | ||
| Heart failure admission (>70 years) | Not reported | |||||||
| Not reported | Not reported | RR | 0.89 | 0.74 ‐ 1.07 | Not reported | Not reported | ||
| All‐cause admission (< 72 years) | 5 | Not reported | RR | 0.61 | 0.41 to 0.93 | Not reported | 65% | |
| All‐cause admission (≥ 72 years) | 6 | Not reported | RR | 0.95 | 0.79 to 1.14 | Not reported | 38% | |
| All‐cause admission (< 72 years) | 4 | Not reported | RR | 0.88 | 0.77 to 1.00 | Not reported | 0% | |
| Outcome or subgroup title | No. of studies | No. of participants | Statistical method | Effect size |
| 1 All‐cause mortality Show forest plot | 15 | 3169 | Risk Ratio (M‐H, Fixed, 95% CI) | 0.87 [0.76, 1.01] |
| 2 Heart failure mortality Show forest plot | 6 | 853 | Risk Ratio (M‐H, Fixed, 95% CI) | 0.84 [0.54, 1.30] |
| 3 Heart failure admission Show forest plot | 10 | 1928 | Risk Ratio (M‐H, Fixed, 95% CI) | 0.70 [0.61, 0.80] |
| 4 All‐cause admission Show forest plot | 6 | 1142 | Risk Ratio (M‐H, Fixed, 95% CI) | 0.93 [0.84, 1.03] |
| 5 Quality of life Show forest plot | 8 | 1812 | Mean Difference (IV, Fixed, 95% CI) | ‐0.03 [‐1.18, 1.13] |
| Outcome or subgroup title | No. of studies | No. of participants | Statistical method | Effect size |
| 1 All‐cause mortality Show forest plot | 15 | 3169 | Risk Ratio (M‐H, Fixed, 95% CI) | 0.87 [0.76, 1.01] |
| 1.1 Clinical assessment | 15 | 2850 | Risk Ratio (M‐H, Fixed, 95% CI) | 0.89 [0.76, 1.04] |
| 1.2 Usual care | 2 | 319 | Risk Ratio (M‐H, Fixed, 95% CI) | 0.79 [0.56, 1.13] |
| 2 Heart failure mortality Show forest plot | 6 | 853 | Risk Ratio (M‐H, Fixed, 95% CI) | 0.84 [0.54, 1.30] |
| 2.1 Clinical assessment | 6 | 853 | Risk Ratio (M‐H, Fixed, 95% CI) | 0.84 [0.54, 1.30] |
| 2.2 Usual care | 0 | 0 | Risk Ratio (M‐H, Fixed, 95% CI) | 0.0 [0.0, 0.0] |
| 3 Heart failure admission Show forest plot | 10 | 1928 | Risk Ratio (M‐H, Fixed, 95% CI) | 0.70 [0.61, 0.80] |
| 3.1 Clinical assessment | 10 | 1609 | Risk Ratio (M‐H, Fixed, 95% CI) | 0.70 [0.60, 0.81] |
| 3.2 Usual care | 2 | 319 | Risk Ratio (M‐H, Fixed, 95% CI) | 0.72 [0.53, 0.99] |
| 4 All‐cause admission Show forest plot | 6 | 1142 | Risk Ratio (M‐H, Fixed, 95% CI) | 0.93 [0.84, 1.03] |
| 4.1 Clinical assessment | 6 | 1142 | Risk Ratio (M‐H, Fixed, 95% CI) | 0.93 [0.84, 1.03] |
| 4.2 Usual care | 0 | 0 | Risk Ratio (M‐H, Fixed, 95% CI) | 0.0 [0.0, 0.0] |
| 5 Quality of life Show forest plot | 8 | 1812 | Mean Difference (IV, Fixed, 95% CI) | ‐0.03 [‐1.18, 1.13] |
| 5.1 Clincial assessment | 8 | 1812 | Mean Difference (IV, Fixed, 95% CI) | ‐0.03 [‐1.18, 1.13] |
| 5.2 Usual care | 0 | 0 | Mean Difference (IV, Fixed, 95% CI) | 0.0 [0.0, 0.0] |
| Outcome or subgroup title | No. of studies | No. of participants | Statistical method | Effect size |
| 1 All‐cause mortality and age Show forest plot | 3 | 830 | Risk Ratio (M‐H, Fixed, 95% CI) | 1.02 [0.83, 1.27] |
| 1.1 Equal or greater than 75 yrs old | 3 | 410 | Risk Ratio (M‐H, Fixed, 95% CI) | 1.23 [0.96, 1.57] |
| 1.2 Under 75 yrs old | 3 | 420 | Risk Ratio (M‐H, Fixed, 95% CI) | 0.73 [0.49, 1.10] |
| 2 Heart failure admission and age Show forest plot | 1 | 365 | Risk Ratio (M‐H, Fixed, 95% CI) | 0.93 [0.69, 1.25] |
| 2.1 Equal or greater than 75 yrs old | 1 | 188 | Risk Ratio (M‐H, Fixed, 95% CI) | 1.13 [0.77, 1.64] |
| 2.2 Under 75 yrs old | 1 | 177 | Risk Ratio (M‐H, Fixed, 95% CI) | 0.73 [0.45, 1.17] |
| Outcome or subgroup title | No. of studies | No. of participants | Statistical method | Effect size |
| 1 All‐cause mortality Show forest plot | 5 | 1663 | Risk Ratio (M‐H, Fixed, 95% CI) | 0.94 [0.80, 1.11] |
| 2 Heart failure mortality Show forest plot | 1 | 268 | Risk Ratio (M‐H, Fixed, 95% CI) | 1.2 [0.66, 2.20] |
| 3 Heart failure admission Show forest plot | 4 | 1318 | Risk Ratio (M‐H, Fixed, 95% CI) | 0.83 [0.71, 0.98] |
| 4 All‐cause admission Show forest plot | 2 | 675 | Risk Ratio (M‐H, Fixed, 95% CI) | 0.98 [0.88, 1.10] |
| 5 Quality of life Show forest plot | 3 | 994 | Mean Difference (IV, Fixed, 95% CI) | ‐0.01 [‐1.28, 1.27] |
| Outcome or subgroup title | No. of studies | No. of participants | Statistical method | Effect size |
| 1 All‐cause mortality Show forest plot | 7 | 1229 | Risk Ratio (M‐H, Fixed, 95% CI) | 0.83 [0.65, 1.07] |
| 2 Heart failure mortality Show forest plot | 4 | 533 | Risk Ratio (M‐H, Fixed, 95% CI) | 0.52 [0.26, 1.03] |
| 3 Heart failure admission Show forest plot | 5 | 814 | Risk Ratio (M‐H, Fixed, 95% CI) | 0.63 [0.49, 0.81] |
| 4 All‐cause admission Show forest plot | 4 | 833 | Risk Ratio (M‐H, Fixed, 95% CI) | 0.94 [0.83, 1.07] |
| 5 Quality of life Show forest plot | 3 | 534 | Mean Difference (IV, Fixed, 95% CI) | ‐0.57 [‐1.92, 0.78] |
| Outcome or subgroup title | No. of studies | No. of participants | Statistical method | Effect size |
| 1 All‐cause mortality Show forest plot | 15 | 3169 | Risk Ratio (M‐H, Fixed, 95% CI) | 0.87 [0.76, 1.01] |
| 1.1 ≤ 1 yr | 5 | 555 | Risk Ratio (M‐H, Fixed, 95% CI) | 0.46 [0.25, 0.85] |
| 1.2 1‐2 yrs | 8 | 1842 | Risk Ratio (M‐H, Fixed, 95% CI) | 0.83 [0.69, 0.99] |
| 1.3 > 2 yrs | 2 | 772 | Risk Ratio (M‐H, Fixed, 95% CI) | 1.11 [0.87, 1.41] |
| 2 Heart failure mortality Show forest plot | 6 | 853 | Risk Ratio (M‐H, Fixed, 95% CI) | 0.84 [0.54, 1.30] |
| 2.1 ≤ 1 yr | 3 | 313 | Risk Ratio (M‐H, Fixed, 95% CI) | 0.64 [0.28, 1.48] |
| 2.2 1 ‐ 2 yrs | 3 | 540 | Risk Ratio (M‐H, Fixed, 95% CI) | 0.94 [0.56, 1.57] |
| 2.3 > 2 yrs | 0 | 0 | Risk Ratio (M‐H, Fixed, 95% CI) | 0.0 [0.0, 0.0] |
| 3 Heart failure admission Show forest plot | 10 | 1928 | Risk Ratio (M‐H, Fixed, 95% CI) | 0.70 [0.61, 0.80] |
| 3.1 ≤ 1 yr | 3 | 278 | Risk Ratio (M‐H, Fixed, 95% CI) | 0.37 [0.23, 0.58] |
| 3.2 1 ‐ 2 yrs | 5 | 878 | Risk Ratio (M‐H, Fixed, 95% CI) | 0.65 [0.54, 0.79] |
| 3.3 > 2 ys | 2 | 772 | Risk Ratio (M‐H, Fixed, 95% CI) | 0.97 [0.77, 1.23] |
| 4 All‐cause admission Show forest plot | 6 | 1142 | Risk Ratio (M‐H, Fixed, 95% CI) | 0.93 [0.84, 1.03] |
| 4.1 ≤ 1 yr | 3 | 247 | Risk Ratio (M‐H, Fixed, 95% CI) | 0.79 [0.58, 1.07] |
| 4.2 1 ‐ 2 yrs | 2 | 488 | Risk Ratio (M‐H, Fixed, 95% CI) | 0.89 [0.77, 1.03] |
| 4.3 > 2 yrs | 1 | 407 | Risk Ratio (M‐H, Fixed, 95% CI) | 1.04 [0.89, 1.21] |
| 5 Quality of life Show forest plot | 8 | 1812 | Mean Difference (IV, Fixed, 95% CI) | ‐0.03 [‐1.18, 1.13] |
| 5.1 ≤ 1 yr | 5 | 561 | Mean Difference (IV, Fixed, 95% CI) | ‐3.14 [‐6.46, 0.19] |
| 5.2 1 ‐ 2 yrs | 2 | 844 | Mean Difference (IV, Fixed, 95% CI) | 1.98 [‐0.76, 4.72] |
| 5.3 > 2 yrs | 1 | 407 | Mean Difference (IV, Fixed, 95% CI) | 0.0 [‐1.38, 1.38] |
| Outcome or subgroup title | No. of studies | No. of participants | Statistical method | Effect size |
| 1 All‐cause mortality Show forest plot | 15 | 3169 | Risk Ratio (M‐H, Fixed, 95% CI) | 0.87 [0.76, 1.01] |
| 1.1 NT‐proBNP | 9 | 2391 | Risk Ratio (M‐H, Fixed, 95% CI) | 0.87 [0.75, 1.01] |
| 1.2 BNP | 6 | 778 | Risk Ratio (M‐H, Fixed, 95% CI) | 0.89 [0.62, 1.28] |
| 2 Heart failure mortality Show forest plot | 6 | 853 | Risk Ratio (M‐H, Fixed, 95% CI) | 0.84 [0.54, 1.30] |
| 2.1 NT‐proBNP | 2 | 127 | Risk Ratio (M‐H, Fixed, 95% CI) | 0.30 [0.08, 1.19] |
| 2.2 BNP | 4 | 726 | Risk Ratio (M‐H, Fixed, 95% CI) | 0.98 [0.61, 1.56] |
| 3 Heart failure admission Show forest plot | 10 | 1928 | Risk Ratio (M‐H, Random, 95% CI) | 0.67 [0.53, 0.84] |
| 3.1 NT‐proBNP | 6 | 1328 | Risk Ratio (M‐H, Random, 95% CI) | 0.65 [0.48, 0.89] |
| 3.2 BNP | 4 | 600 | Risk Ratio (M‐H, Random, 95% CI) | 0.68 [0.43, 1.05] |
| 4 All‐cause admission Show forest plot | 6 | 1142 | Risk Ratio (M‐H, Fixed, 95% CI) | 0.93 [0.84, 1.03] |
| 4.1 NT‐proBNP | 2 | 476 | Risk Ratio (M‐H, Fixed, 95% CI) | 0.99 [0.85, 1.14] |
| 4.2 BNP | 4 | 666 | Risk Ratio (M‐H, Fixed, 95% CI) | 0.88 [0.77, 1.01] |
| 5 Quality of life Show forest plot | 8 | 1812 | Mean Difference (IV, Fixed, 95% CI) | ‐0.03 [‐1.18, 1.13] |
| 5.1 NT‐proBNP | 7 | 1771 | Mean Difference (IV, Fixed, 95% CI) | ‐0.02 [‐1.19, 1.14] |
| 5.2 BNP | 1 | 41 | Mean Difference (IV, Fixed, 95% CI) | ‐0.20 [‐15.30, 14.90] |