Tratamiento guiado por el péptido natriurético tipo B para la insuficiencia cardíaca
Información
- DOI:
- https://doi.org/10.1002/14651858.CD008966.pub2Copiar DOI

- Base de datos:
-
- Cochrane Database of Systematic Reviews
- Versión publicada:
-
- 22 diciembre 2016see what's new
- Tipo:
-
- Intervention
- Etapa:
-
- Review
- Grupo Editorial Cochrane:
-
Grupo Cochrane de Corazón
- Copyright:
-
- Copyright © 2016 The Authors. Cochrane Database of Systematic Reviews published by John Wiley & Sons, Ltd. on behalf of The Cochrane Collaboration.
- This is an open access article under the terms of the Creative Commons Attribution Licence, which permits use, distribution and reproduction in any medium, provided the original work is properly cited.
Cifras del artículo
Altmetric:
Citado por:
Autores
Contributions of authors
Rafael Perera: Publication screening, data extraction, analysed and interpreted data, prepared the manuscript
Julie McLellan: Publication screening, assessed relevance and quality of papers, data extraction, correspondence with authors, organised, analysed and interpreted data, wrote and prepared the manuscript
Paul Glasziou: Interpretation of data, prepared the manuscript
Lucy Wright: Reviewed protocol, publication screening, assessed quality of papers, extracted data
Clare Bankhead: Publication screening, prepared the manuscript
Carl J Heneghan: Contributed to the protocol, wrote the discussion and conclusion, prepared the manuscript
Karen Kearley: Wrote the protocol, publication screening, wrote the background section, prepared the manuscript
Nicola Piddick: Obtained papers, publication screening, assessed quality of papers, data extraction, organised data
Nia W Roberts: Developed search strategy, ran searches, reviewed protocol
Sally Tyndal: Wrote the protocol
Alison Clements: Publication screening
Sources of support
Internal sources
-
No sources of support supplied
External sources
-
National Institute for Health Research, UK.
This article presents independent research partially funded by the National Institute for Health Research (NIHR) under the Programme Grants for Applied Research programme (RP‐PG‐1210‐12003). The views expressed are those of the authors and not necessarily those of the NHS, the NIHR or the Department of Health.
Declarations of interest
Julie McLellan has no known potential conflicts of interest.
Carl Heneghan receives funding from the NIHR School of Primary Care Research (SPCR) and the NIHR Diagnostic Evidence Co‐operative (DEC).
Rafael Perera receives funding from the NIHR Oxford Biomedical Research Centre Programme, the NIHR Programme for Applied Research, the NIHR HPRU Gastrointestinal Infections Group, and the NIHR Diagnostic Evidence Co‐operative (DEC).
Alison M Clements has no known potential conflicts of interest.
Paul P Glasziou has no known potential conflicts of interest.
Karen E Kearley has no known potential conflicts of interest.
Nicola Pidduck has no known potential conflicts of interest.
Nia W Roberts has no known potential conflicts of interest.
Sally Tyndel has no known potential conflicts of interest.
F Lucy Wright has no known potential conflicts of interest.
Clare Bankhead has no known potential conflicts of interest.
Acknowledgements
Many thanks to the following for their help in clarifying study information or providing further data: Dr Tariq Ahmad & Karen Pieper on behalf of STARBRITE study, Dr Morten Schou on behalf of the NorthStar monitoring study, Dr Patric Karlstrom on behalf of UPSTEP study, Dr Michael Shochat, Dr Beck da Silva, Dr Jan Krupicka on behalf of Optima study, Professor Henry J Dargie, Professor Marco Metra, Dr Troughton, Dr L Eurlings on behalf of PRIMA study and Dr AA Skvortsov.
Thank you to Peter Kirby and Marion Judd (members of the Patient & Public Involvement Group) and Dr Amitava Banerjee (Senior Lecturer and Honorary Consultant in Cardology at the Farr Institute of Health Informatics Research, UCL), who provided invaluable feedback on the Plain language summary.
Version history
| Published | Title | Stage | Authors | Version |
| 2016 Dec 22 | B‐type natriuretic peptide‐guided treatment for heart failure | Review | Julie McLellan, Carl J Heneghan, Rafael Perera, Alison M Clements, Paul P Glasziou, Karen E Kearley, Nicola Pidduck, Nia W Roberts, Sally Tyndel, F Lucy Wright, Clare Bankhead | |
| 2011 Jan 19 | B‐type natriuretic peptide‐guided treatment for heart failure | Protocol | Karen E Kearley, F Lucy Wright, Sally Tyndel, Nia Wyn Roberts, Rafael Perera, Paul P Glasziou, Carl J Heneghan | |
Differences between protocol and review
The search strategies in the final review differ slightly from those published in the protocol. Since the original protocol Cochrane updated the filter for Embase, which introduced terms making the search more specific for trial design. The current search reflects these updates.
Post hoc subgroup analyses were considered for baseline left ventricular ejection fraction (LVEF), control type and duration of follow‐up. LVEF was considered after extraction of data from the studies when it was identified that LVEF frequently formed one of the inclusion/exclusion criteria for participants and was usually recorded in the baseline characteristics of participants in studies. It was not anticipated that there could be more than one type of control group in the original protocol. Finally, most included studies had a follow‐up period of one to two years, only two studies monitored for a longer period and only two concentrated on up‐titration of heart failure drug(s). Similarly, this had not been anticipated in the original protocol. We wanted to assess if studies subgrouped by either of these aspects could lead to further understanding of NP‐guided treatment.
Post hoc, in response to peer reviewer comments, we completed a sensitivity analysis for all outcomes to evaluate the impact of any differences between the two biomarkers: BNP and NT‐proBNP.
Whilst not pre‐specified in the protocol, a 'Summary of findings' table and GRADE assessment were completed. These now form a mandatory, and desirable, part of the Cochrane review process.
PICO
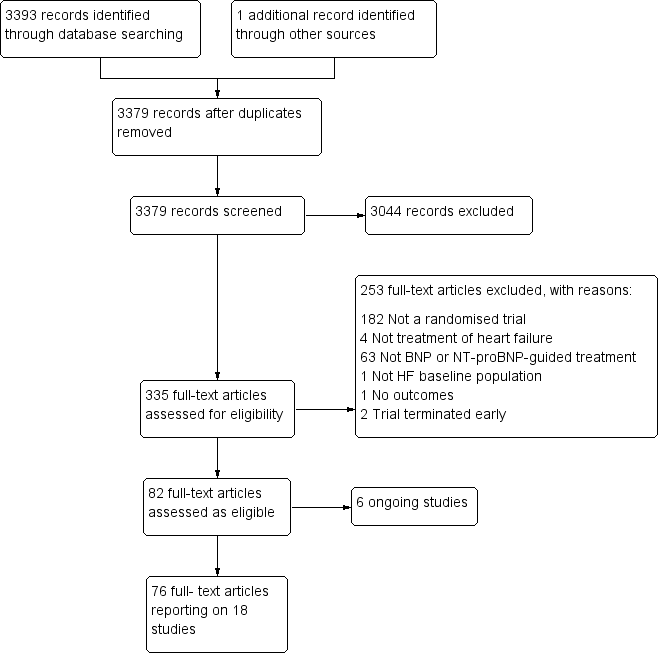
Study flow diagram.

Funnel plot of comparison: NP‐guided versus no NP‐guided treatment for all‐cause mortality.
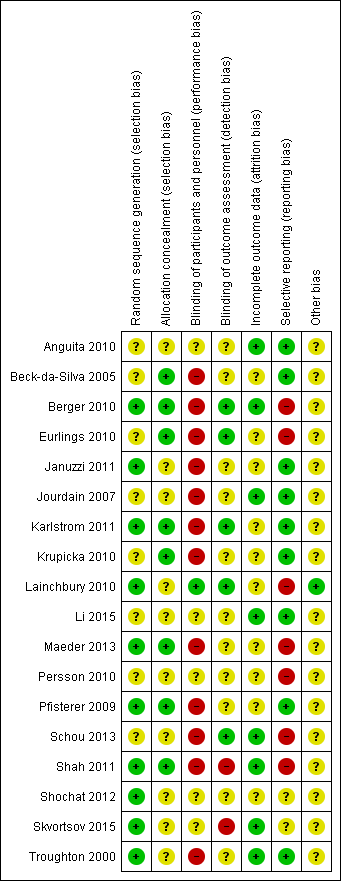
'Risk of bias' summary: review authors' judgements about methodological quality for each included study
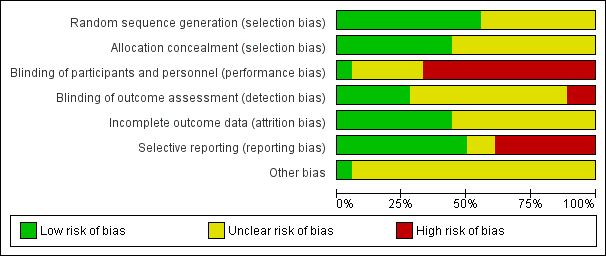
'Risk of bias' graph: review authors' judgements about methodological quality presented as percentages across all included studies.
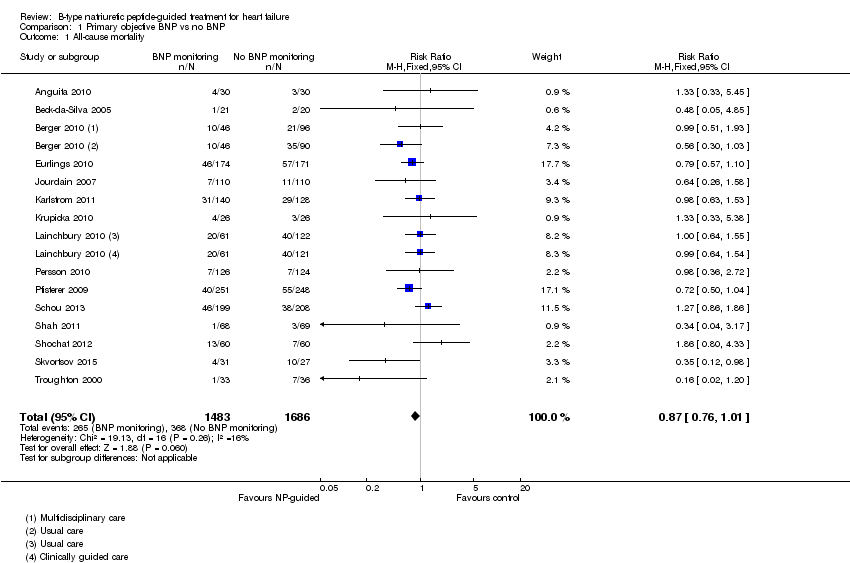
Comparison 1 Primary objective BNP vs no BNP, Outcome 1 All‐cause mortality.

Comparison 1 Primary objective BNP vs no BNP, Outcome 2 Heart failure mortality.

Comparison 1 Primary objective BNP vs no BNP, Outcome 3 Heart failure admission.

Comparison 1 Primary objective BNP vs no BNP, Outcome 4 All‐cause admission.
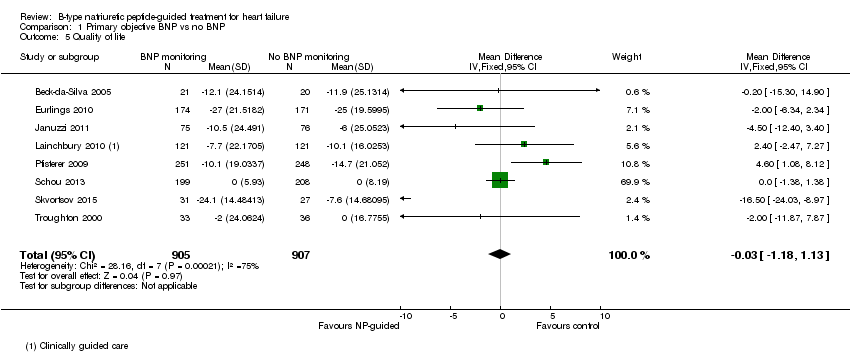
Comparison 1 Primary objective BNP vs no BNP, Outcome 5 Quality of life.
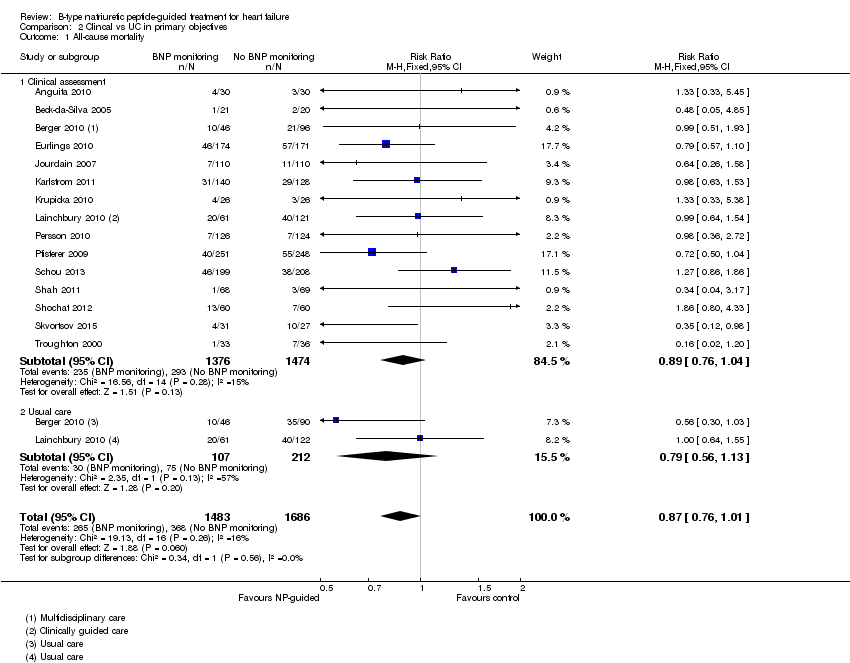
Comparison 2 Clincal vs UC in primary objectives, Outcome 1 All‐cause mortality.
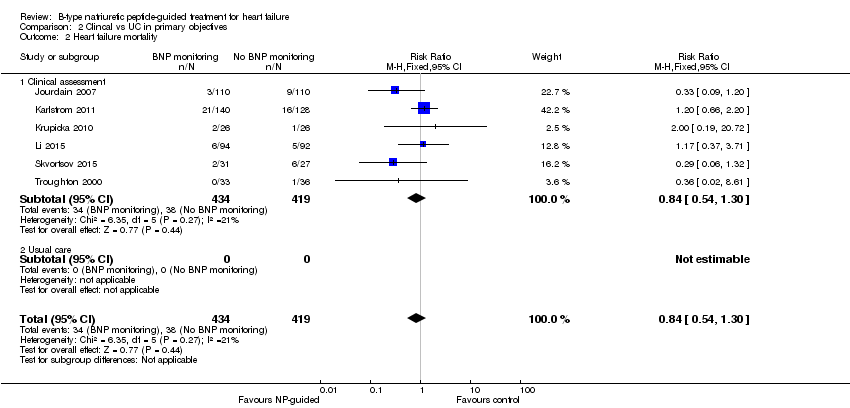
Comparison 2 Clincal vs UC in primary objectives, Outcome 2 Heart failure mortality.
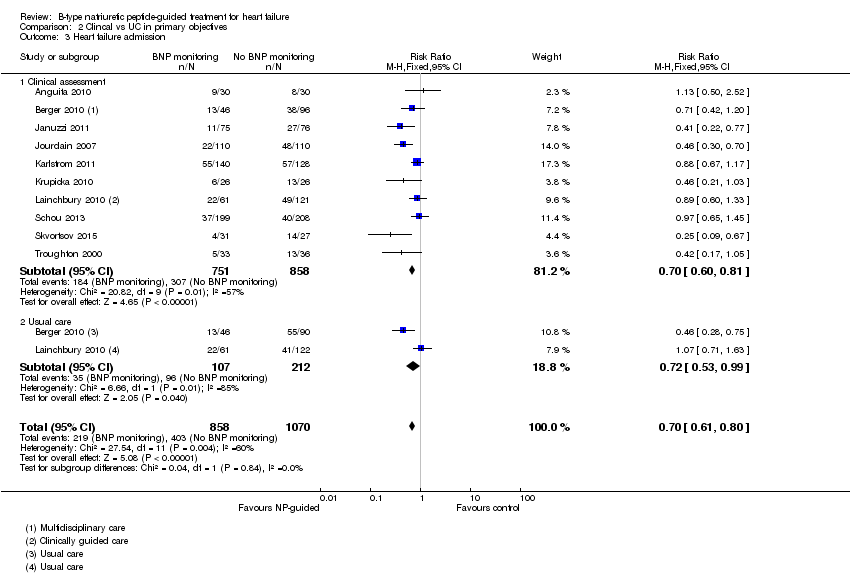
Comparison 2 Clincal vs UC in primary objectives, Outcome 3 Heart failure admission.
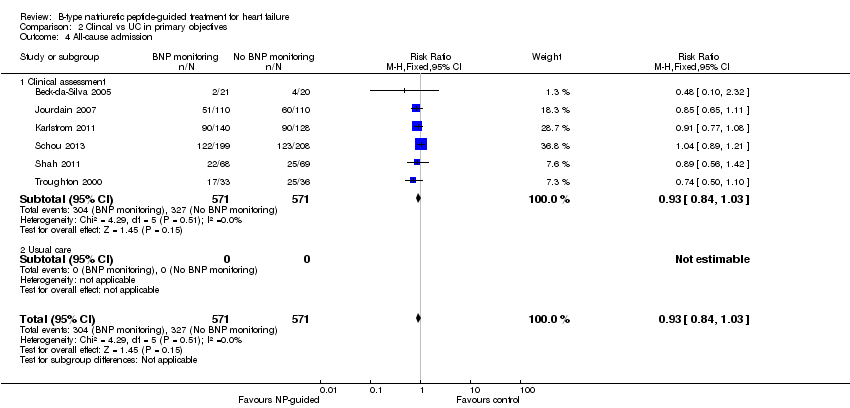
Comparison 2 Clincal vs UC in primary objectives, Outcome 4 All‐cause admission.

Comparison 2 Clincal vs UC in primary objectives, Outcome 5 Quality of life.

Comparison 3 Subgroup analyses, Outcome 1 All‐cause mortality and age.
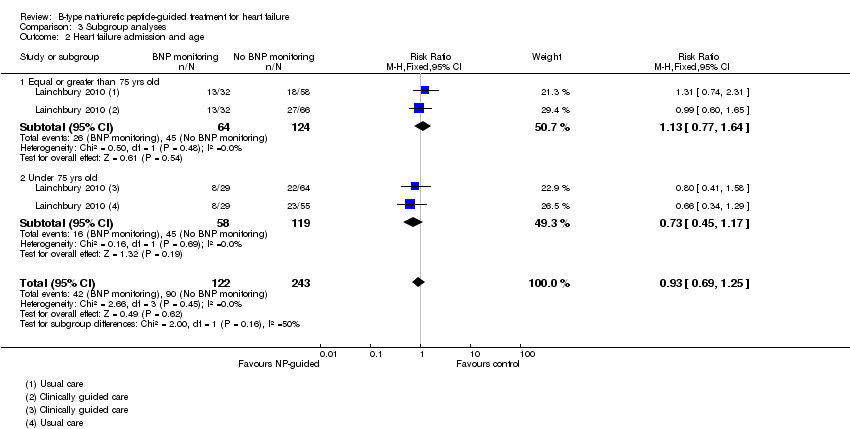
Comparison 3 Subgroup analyses, Outcome 2 Heart failure admission and age.

Comparison 4 Sensitivity analyses: Outcome blinding, Outcome 1 All‐cause mortality.
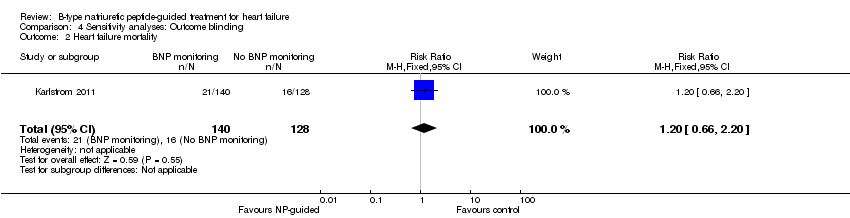
Comparison 4 Sensitivity analyses: Outcome blinding, Outcome 2 Heart failure mortality.
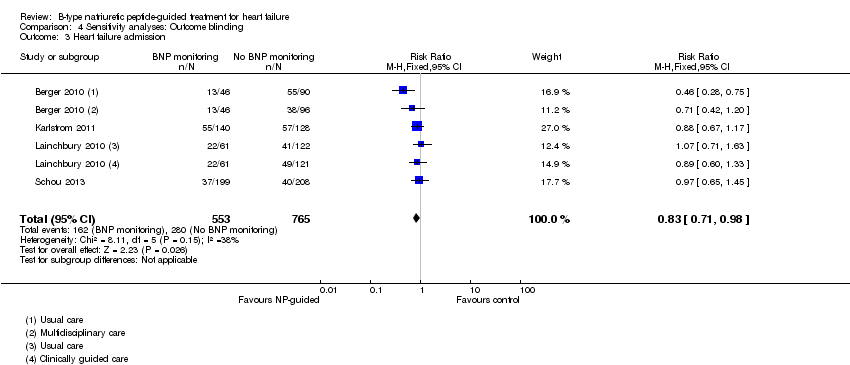
Comparison 4 Sensitivity analyses: Outcome blinding, Outcome 3 Heart failure admission.
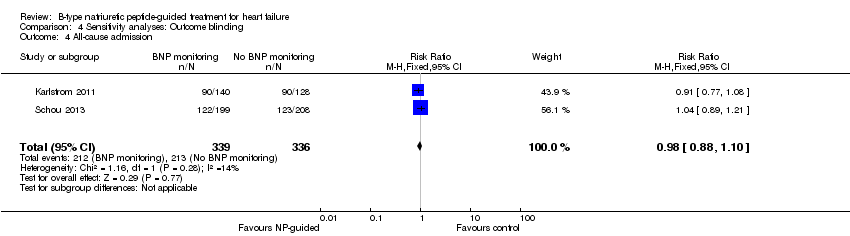
Comparison 4 Sensitivity analyses: Outcome blinding, Outcome 4 All‐cause admission.

Comparison 4 Sensitivity analyses: Outcome blinding, Outcome 5 Quality of life.
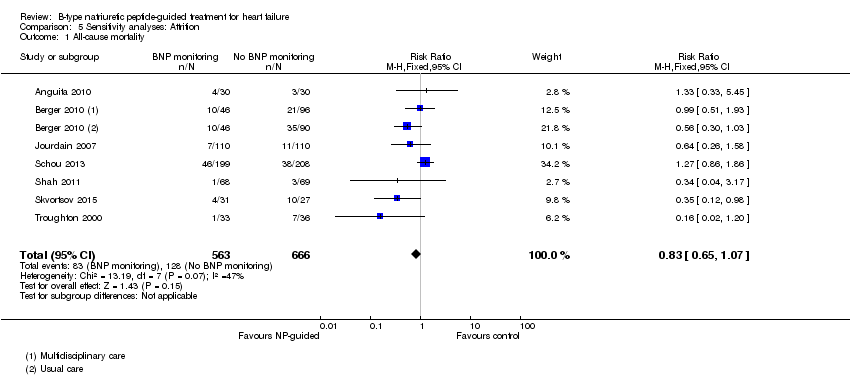
Comparison 5 Sensitivity analyses: Attrition, Outcome 1 All‐cause mortality.

Comparison 5 Sensitivity analyses: Attrition, Outcome 2 Heart failure mortality.
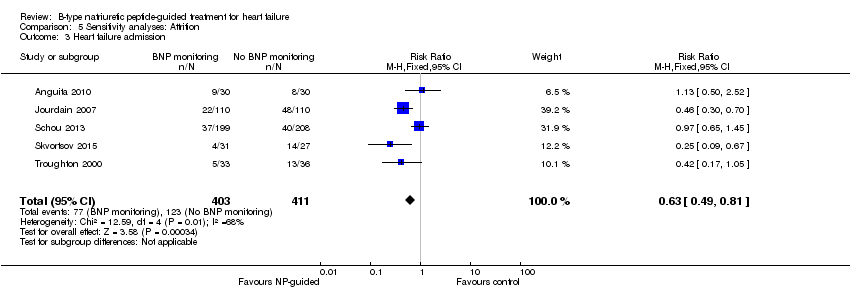
Comparison 5 Sensitivity analyses: Attrition, Outcome 3 Heart failure admission.

Comparison 5 Sensitivity analyses: Attrition, Outcome 4 All‐cause admission.

Comparison 5 Sensitivity analyses: Attrition, Outcome 5 Quality of life.
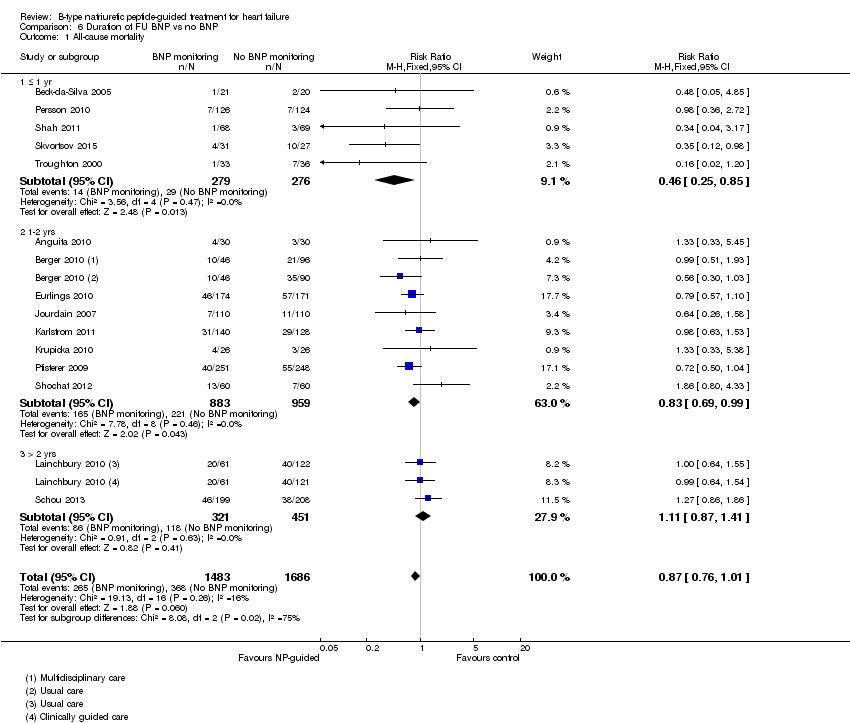
Comparison 6 Duration of FU BNP vs no BNP, Outcome 1 All‐cause mortality.
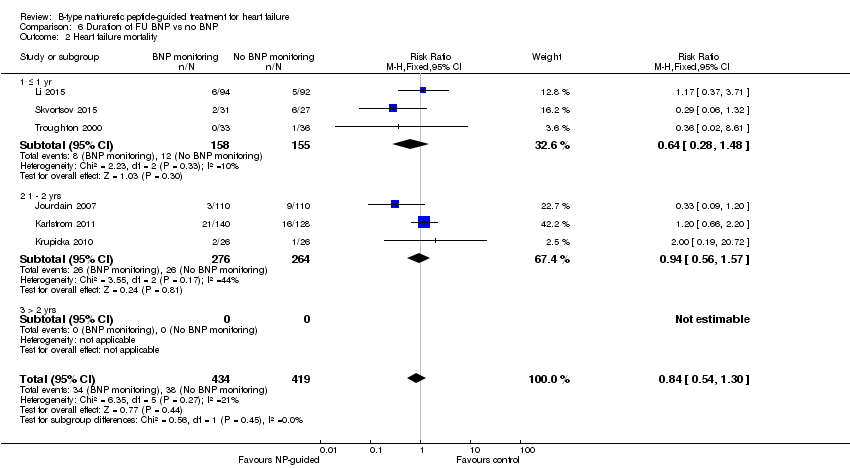
Comparison 6 Duration of FU BNP vs no BNP, Outcome 2 Heart failure mortality.

Comparison 6 Duration of FU BNP vs no BNP, Outcome 3 Heart failure admission.
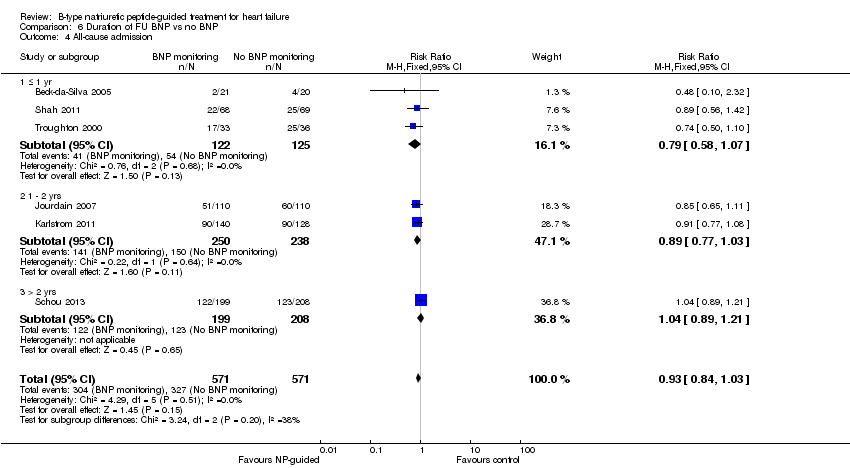
Comparison 6 Duration of FU BNP vs no BNP, Outcome 4 All‐cause admission.
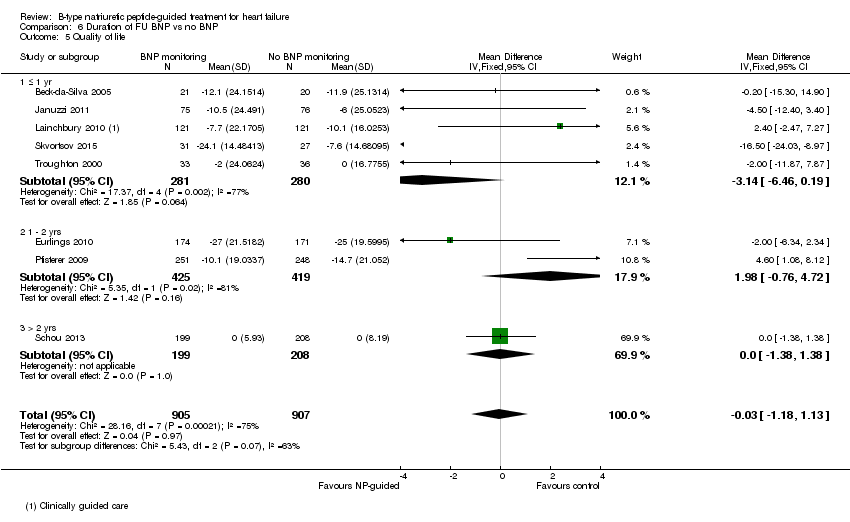
Comparison 6 Duration of FU BNP vs no BNP, Outcome 5 Quality of life.

Comparison 7 Subgroup: BNP vs NT‐proBNP, Outcome 1 All‐cause mortality.

Comparison 7 Subgroup: BNP vs NT‐proBNP, Outcome 2 Heart failure mortality.
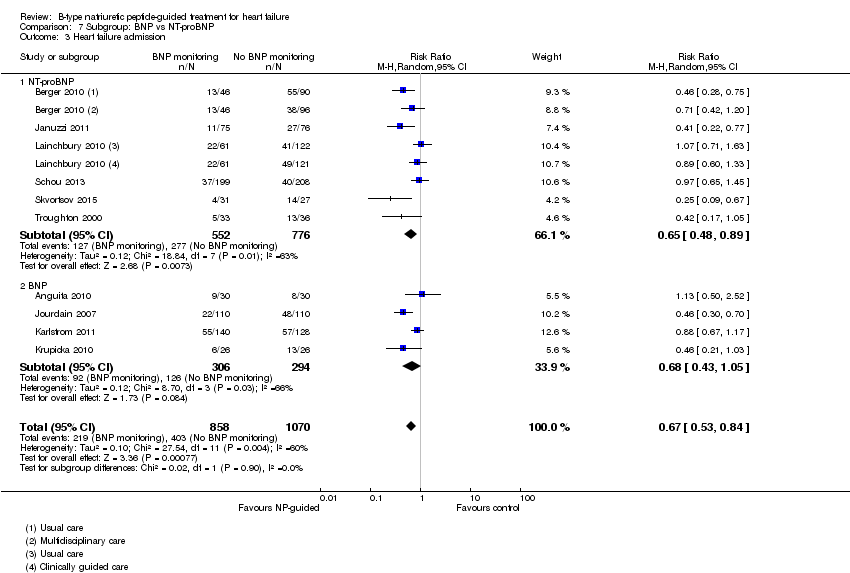
Comparison 7 Subgroup: BNP vs NT‐proBNP, Outcome 3 Heart failure admission.

Comparison 7 Subgroup: BNP vs NT‐proBNP, Outcome 4 All‐cause admission.
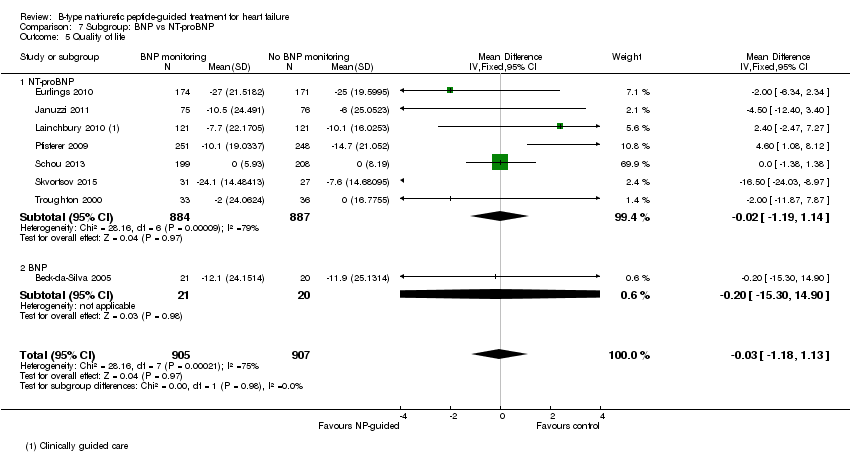
Comparison 7 Subgroup: BNP vs NT‐proBNP, Outcome 5 Quality of life.
| Does treatment guided by serial BNP or NT‐proBNP monitoring improve outcomes compared to treatment guided by clinical assessment alone? | ||||||
| Patient or population: patients with heart failure | ||||||
| Outcomes | Illustrative comparative risks* (95% CI) | Relative effect | No of Participants | Quality of the evidence | Comments | |
| Assumed risk | Corresponding risk | |||||
| No BNP or NT‐proBNP‐guided treatment | Serial BNP or NT‐proBNP‐guided treatment | |||||
| All‐cause mortality | 218 per 1000 | 190 per 1000 | RR 0.87 | 3169 | ⊕⊕⊝⊝ | 16 studies reported on all‐cause mortality (n = 3292), but only 15 studies are included in the meta‐analysis (n = 3169). For one study data could not be extracted or obtained in a format useable in the review. Funnel plot analysis suggests possible lack of small studies (beneficial control effect). Insufficient to justify downgrading the quality of evidence. |
| Heart failure mortality | 91 per 1000 | 76 per 1000 | RR 0.84 | 853 | ⊕⊕⊝⊝ | |
| Heart failure admissions | 377 per 10002 | 264 per 1000 | RR 0.70 | 1928 | ⊕⊕⊝⊝ | |
| All‐cause admissions | 573 per 10002 | 533 per 1000 | RR 0.93 | 1142 | ⊕⊕⊝⊝ | |
| Adverse events | See comment | See comment | Not estimable | 1144 | ⊕⊕⊝⊝ | 3/6 studies commented on the difference between the intervention and control groups: no significant difference in one and two favoured the intervention group |
| Cost | See comment | See comment | Not estimable | 1051 | ⊕⊕⊝⊝ | 3/4 studies suggested reduced cost in the intervention groups. One study suggested NP‐guided treatment was unlikely to be cost‐effective. |
| Quality of life | The mean quality of life ranged across control groups from | The mean quality of life in the intervention groups was | 1812 | ⊕⊝⊝⊝ | Lower score indicates better quality of life | |
| *The basis for the assumed risk (e.g. the median control group risk across studies) is provided in footnotes. The corresponding risk (and its 95% confidence interval) is based on the assumed risk in the comparison group and the relative effect of the intervention (and its 95% CI). | ||||||
| GRADE Working Group grades of evidence | ||||||
| 1 The comparisons (controls) fell into two groups: same as the intervention without BNP or NT‐proBNP measures or usual care | ||||||
| Study | Participants treated in community or secondary care | Baseline NYHA classification (stages I ‐ IV) | Baseline left ventricular ejection fraction (LVEF, %) | |||||
| Study inclusion criteria | Intervention group | Control group | Comment in text | Study inclusion criteria | Intervention group (mean, SD unless stated) | Control group (mean, SD unless stated) | ||
| Hospital | Stage ≥ III | Stage III 73%, IV 27% | Stage III 63%, IV 37% | Not inclusion criterion | 44 (18) | 46 (18) | ||
| Hospital (outpatient) | Stages II ‐ III | 2.6 ± 0.7 (mean, SD) | 2.4 ± 0.6 (mean, SD) | <40% | 23.8 ± 8.8 | 20.9 ± 9.2 | ||
| Hospital & community | Stages III ‐ IV | Not stated | Not stated | <40% | NS | NS | ||
| Hospital | Not inclusion criterion | Stage I = 11.5%, II = 64.9%, III = 23.6% | stage I = 9.9%, II = 70.8%, III = 19.3% | Not inclusion criterion | 34.9 ± 13.7 | 36.7 ± 14.8 | ||
| Hospital | Stages II ‐ IV | Stage II or III = 85.5% | Stage II or III = 84.2% | ≤ 40% | 28 ± 8.7 | 25.9 ± 8.3 | ||
| Hospital (outpatient) | Stages II ‐ III | 2.29 ±0.6 (mean, SD) | 2.21 ± 0.62 (mean, SD) | <45% | 29.9 ± 7.7 | 31.8 ± 8.4 | ||
| Hospital | Stages II ‐ IV | Stage II = 32%, III = 52%, IV = 15% | Stage II = 27%, III = 59%, IV = 14% | <40% | <30% = 57% | <30% = 58% | ||
| Hospital | Stages III ‐ IV | 2.1 (0.3) (mean, SD) | 2.1 (0.3) (mean, SD) | ≤ 45% | 36.1% (7.2) | 32.3% (9.6) | ||
| Hospital & community | Not inclusion criterion | NT‐proBNP group: stage I 12%, II 68%, III 18%, IV 2% | Clinically‐guided group: Stage I 7%, II 66%, III 25%, IV 2%; Usual care: stage I 7%, II 67%, III 25%, IV 1% | Not inclusion criterion though deliberated included patients with preserved LVEF | 40 ±15 | CG = 39 ± 15, UC = 37 ± 15 | ||
| Hospital | Stages III ‐ IV | NS | NS | Not inclusion criterion | 30 ± 8.1 | 28 ± 7.9 | ||
| Hospital (outpatient) | Stages ≤ II | 49 (83) ≥ III (median, IQR) | 53 (83) ≥ III (median, IQR) | 'symptoms improved similarly' (at 6 months) | > 45% | 56 ± 6 | 56 ± 7 | |
| Community | Stage II ‐ IV | Stage II 62%, III 38% | Stage II 61%, III 39% | 'Improvements in NYHA class and dyspnoea symptoms were seen in both allocation groups, but with no significant differences between the groups' | <50% | 31 (9) | 33 (7) | |
| Hospital (outpatient) | Stages ≤ II | 186 ≥ III (n) | 185 ≥ III (n) | ≤ 45% | 29.8 (7.7) | 29.7 (7.9) | ||
| Hospital | Not inclusion criterion | Stage I ‐ II 86 % | Stage I ‐ II 85 % | <45% | 30 (14‐45) median (range) | 30 (15‐45) median (range) | ||
| Hospital | Stage III ‐ IV | Authors have no data for baseline NYHA | Authors have no data for baseline NYHA | <35% | 20 (15‐25) median (range) | 20 (15‐25) median (range) | ||
| Hospital | Not stated | 2.53 (mean) | 2.34 (mean) | Not inclusion criterion | 23 (6) | 23 (7) | ||
| Hospital (outpatient) | Stage III ‐ IV | Stage III 23%, IV 76% | Stage III 26%, IV 74% | At hospital admission | <40% | 29.2 (6.1) | 29.4 (6.1) | |
| Hospital | Stages II ‐ IV | Stage II 72%, overall 2.3 (mean) | Stage II 67%, overall 2.3 (mean) | <40% | 28 | 26 | ||
| Study | Target BNP/NT‐proBNP (pg/mL, unless stated) | Baseline BNP or NT‐proBNP measurement (units in pg/mL and given as mean (SD), unless stated) | BNP/NT‐proBNP drop (as % of baseline) (units in pg/mL and given as mean (SD), unless stated) | ||||
| Biomarker | Study inclusion criteria | Intervention group | Control group | Comment in text | |||
| 100 | BNP | No inclusion threshold | 57 (77) | 65 (97) | No percentage drop reported. BNP at 18 months follow‐up: BNP‐guided group 14 (20); control group 111 (71) | ||
| No target set/stated | BNP | No inclusion threshold | 502.3 (411.3) | 701.6 (409.9) | No percentage drop reported. BNP at follow‐up: control arm 626.8 (325.8); BNP arm 477.8 (406.9) | ||
| < 2200 NT = proBNP (reported in IPD analysis by Troughton 2014) | NT‐proBNP | No inclusion threshold | 2216 (355‐9649) mean (95% CI) | Multidisplinary care 2469 (355 ‐18487; Usual care 2359 (355 ‐15603) mean (95% CI) | No percentage drop reported. NT ‐proBNP change from baseline to FU graphically shown in Berger 2010 (Figure 4). Decrease in NT‐proBNP more apparent in NT‐proBNP‐guided group than multidisplinary group. No decrease in usual care group | ||
| Set individually for each participant as the lowest level at discharge or at 2 weeks follow‐up | NT‐proBNP | NT‐proBNP levels at admission: minimum 1,700 pg/ml. Additionally NT‐proBNP levels during hospitalisation, defined as a decrease of more than 10%, with a drop in NT‐proBNP levels of at least 850 pg/ml, from admission to discharge. | 2961 (1383 ‐ 5144) median (IQR) | 2936 (1291‐5525) median (IQR) | Outcome data available by subgroup baseline BNP (above or below discharge NT‐proBNP 2950 pg/ml) | No percentage drop reported. Median (IQR) at 12 months follow‐up: NT‐proBNP‐guided group ‐432 (‐1392 to 297); Clincially‐guided group ‐572 (‐1329 to 434). | |
| ≤ 1000 | NT‐proBNP | No inclusion threshold | 2344 (median) | 1946 (median) | No percentage drop reported. Median NT‐proBNP at follow‐up: Standard care group 1844 (P = 0.61 follow‐up vs baseline); NT‐proBNP‐guided group 1125 (P = 0.01 vs baseline) | ||
| < 100 | BNP | No inclusion threshold | 352 (260) mean (SD) | Not measured | No percentage drop reported. BNP‐guided group only shown graphically in Jourdain 2007 (figure 5): mean BNP level drops over time and % of patients achieving target increases. | ||
| <150 ng/L in patients under 75; <300 ng/L in patients over 75 yrs | BNP | No inclusion threshold | 808.2 (676.1) ng/L, mean (SD) | 898.9 (915.3 ng/L, mean (SD) | No percentage drop reported. BNP at follow‐up: control group 457 (603), BNP‐guided group 403 (468) | ||
| <100 | BNP | No inclusion threshold | 704 (228‐2852) median (range) | 633 (276‐3756) median (range) | No percentage drop reported. In the BNP group 90% of patients manage to reduce BNP to <400 pg/mL; of this 90%, 2/3 of patients to achieve <100 pg/mL. Email from author "We do not have BNP values of the Clinical group at the end of follow‐up. Median BNP value after 6 months in BNP group was 235pg/ml. (At hospital discharge 704pg/ml; after 1 month 328.5pg/ml; after 3 months 253pg/ml)." | ||
| < 150 µmol/L | NT‐proBNP | No inclusion threshold | 2012 (516‐10233) median (IQR) | Clinically‐guided group: 1996 (425‐6588); Usual care: 2012 (425‐10571) median (IQR) | No percentage drop reported. No follow‐up data. Comment in text 'Plasma NT‐proBNP levels fell similarly within 6 months of randomisation in both the NT‐proBNP and CG groups (by 20% and 23%, respectively; P 0.001)'. | ||
| 50% of basal level or < 300 | BNP | No inclusion threshold | 1167.8 (219.9) mean (SD) | 1145.8 (224.9) mean (SD) | No percentage drop reported. Change in BNP level shown in Figure 2 (Li 2015). 'BNP value decreased dramatically over the duration of medication, but there was no difference between the two groups.' | ||
| < 400 in patients younger than 75 years; < 800 in patients aged 75 years or older | NT‐proBNP | N‐terminal BNP level of 400 pg/mL or higher in patients younger than 75 years and a level of 800 pg/mL or higher in patients aged 75 years or older | 2210 (1514‐4081) ng/L, median (IQR) | 2191 (1478‐4890) ng/L, median (IQR) | Maeder 2013 reports: 'NT‐proBNP was reduced similarly in patients allocated to NT‐proBNP‐guided or symptom‐guided management. The proportion of patients with NT‐proBNP below the target was low throughout the study period and did not significantly differ between groups (Figure 2C) although it tended to be lower in the NT‐proBNP‐guided group. | ||
| At least a 50% reduction from baseline NT‐proBNP | NT‐proBNP | Elevated NT‐proBNP levels (males > 800 ng/L, females > 1000 ng/L) | 2661 (2.1) ng/L, geometric mean(coefficient of variation, %) | 2429 (2.1) ng/L, geometric mean(coefficient of variation, %) | No percentage drop reported. Geometric Mean (SD) at follow‐up: NT‐proBNP‐guided group ‐ 301 ng/L to 2360 ng/L; control group ‐362 ng/L to 2067 ng/L. Comment in text 'similar modest decrease ( 10%) in NT‐proBNP from baseline to end‐of study was observed in both groups……NT‐proBNP levels were reduced by .50% in 24 (19%) and 27 (22%), of patients with and without NT‐proBNP‐guided treatment, respectively'. | ||
| < 400 in patients younger than 75 years; < 800 in patients aged 75 years or older | NT‐proBNP | N‐terminal BNP level of 400 pg/mL or higher in patients younger than 75 years and a level of 800 pg/mL or higher in patients aged 75 years or older | 3998 (2075‐7220) median (IQR) | 4657 (2455‐7520) median (IQR) | No percentage drop reported. No follow‐up data. Pfisterer 2009 (figure 3b) graphically shows data for NT‐proBNP changes over 6 months (by age). Comment in text 'There were no significant differences between the 2 treatment groups by by N‐terminal BNP level (P=.06 vs P=.30).' | ||
| No target set/stated | NT‐proBNP | NT‐proBNP ≥ 1000 pg/mL after up‐titration (i.e. at the randomisation visit) | 1884 (1033‐10435) average statistic not stated) | 2042 (1023‐9668) average statistic not stated | No percentage drop reported. Change in NT‐proBNP during follow‐up: NT‐proBNP‐guided group ‐129 (‐722 to 674) median (IQR); Clinically managed group ‐26 (‐681 to 751) median (IQR). Comment in text: 'Patients in whom NT‐proBNP increased ≤ 30% during the follow up period had a higher frequency of admission (69% vs. 47%, P = 0.002), a higher number of admission days (median) (14 days vs. 5 days, P= 0.003), a higher number of admissions (median) (2 vs. 1, P = 0.009), a lower quality of life (mean difference) (6 points, P = 0.032), and a poorer functional class (37% vs. 18% in functional class III–IV, P = 0.001).' | ||
| Discharge BNP | BNP | No inclusion threshold | 453 (221‐1135) median (IQR) | 440 (189 ‐981) median (IQR) | No percentage drop reported. Median (IQR) BNP at follow‐up: BNP‐guided group 412.5 (111,894); control (congestion score) group 471 (235.5, 1180) | ||
| No target set/stated | NT‐proBNP | Email from author confirmed 'NT‐ProBNP > 2000 at day of randomisation' | 5868 (2532) | 5820 (2434) | No percentage drop reported. | ||
| <1000 pg/mL or at least 50% reduction from baseline NT‐proBNP at discharge | NT‐proBNP | > 1400 pg/mL at hospital admission | 3750 (2224‐ 6613) median (IQR) | 2783.0 (2021.5‐ 4827.5) median (IQR) | At hospital discharge | At 6 months: NT‐proBNP‐guided group: 53% (Median drop (QR): 1585.5 (976.6, 2742.5)) Control group: 10.2% (median (IQR): 2189.0 (1954.0, 3688.5)) | |
| 200 µmol/L | NT‐proBNP | No inclusion threshold | 217 µmol/L, mean | 251 µmol/l, mean | No percentage drop reported. At 6 months follow‐up: Nt‐proBNP‐guided group decreased by 79 pmol/L, mean; clinically‐guided group decreased by 3 pmol/L, mean (P = 0.16) | ||
| Study | Adverse events | |||||||||
| Participants (N) | Missing participants (N) | Number of adverse events (definitions not consistent or not stated; not clear whether first event per participant or every event) | Additional data either from published articles or supplied by author | |||||||
| Intervention group | Control group | Total | Intervention group | Control group | Total | Intervention group | Control group | Total | ||
| 75 | 76 | 151 | 6 | 6 | 12 | 30 | 23 | 53 | No significant differences between groups. No specific event showed a significant difference between groups Events in intervention group: Abdominal pain (1); acute renal failure (4); anaemia (1); atrial fibrillation (2); cough (2); diarrhoea (2); dizziness (5); fever (1); gastrointestinal bleeding (1); hyper/hypokalaemia (3); hypotension (4); respiratory infection (2); syncope(2) Events in control group: Abdominal pain (1); acute renal failure (3); anaemia (0); atrial fibrillation (5); cough (1); diarrhoea (1); dizziness (4); fever (1); gastrointestinal bleeding (1); hyper/hypokalaemia (1); hypotension (0); respiratory infection (4); syncope(1) | |
| 26 | 26 | 52 | 0 | 0 | 0 | 7 | 0 | 7 | Email from author 17.10.14 confirmed: Hyperkalaemia (n = 2); orthostatic hypotension (n = 2); bradycardia (n = 3) | |
| 59 | 64 | 123 | 12 | 12 | 24 | Not reported | Not reported | 66 | Maeder 2013 reported: "58% of the patients in the NT‐proBNP‐guided and 50% in the symptom‐guided group had at least one SAE (p=0.32). SAE’s related to renal failure (14% versus 2%, p=0.01) were more common in the NT‐proBNP‐guided group, whereas hypotension tended to be less common (0% versus 8%, p=0.06)." No additional information | |
| 126 | 124 | 250 | 8 | 7 | 15 | 42 | 39 | 81 | No additional information provided | |
| 251 | 248 | 499 | 32 | 29 | 61 | 123 | 113 | 236 | P = 0.47 Renal impairment: intervention group n = 4, control group n = 5 (P = 0.64) Hypotension: intervention group n = 6, control group n = 3 (P = 0.22) No other type of adverse event described. Adverse events ≥ 75 years old patients: intervention group 10.5% vs control group 5.5% (P = 0.12) Adverse events in < 75 years old patients: intervention group 3.7% vs. control group 4.9% (P = 0.74) | |
| 33 | 36 | 69 | 0 | 0 | 0 | 13 | 9 | 22 | P = 0.32 No additional information provided | |
| Outcome | Studies(N) | Participants (n) | Risk ratio | 95% Confidence intervals | |
| Outcome blinding (low risk of bias studies only) | |||||
| All‐cause mortality | 5 | 1663 | 0.94 | 0.80 to 1.11 | |
| Heart failure mortality | 1 | 268 | 1.20 | 0.66 to 2.20 | |
| Heart failure admission | 4 | 1318 | 0.83 | 0.71 to 0.98 | |
| All‐cause admission | 2 | 675 | 0.98 | 0.88 to 1.10 | |
| Quality of life | 3 | 994 | ‐0.01 | ‐1.28 to 1.27 | |
| Incomplete data (low risk of bias studies only) | |||||
| All‐cause mortality | 7 | 1229 | 0.83 | 0.65 to 1.07 | |
| Heart failure mortality | 4 | 533 | 0.52 | 0.26 to 1.03 | |
| Heart failure admission | 5 | 814 | 0.63 | 0.49 to 0.81 | |
| All‐cause admission | 4 | 833 | 0.94 | 0.83 to 1.07 | |
| Quality of life | 3 | 534 | ‐0.57 | ‐1.92 to 0.78 | |
| Outcome | Review | Number of RCTs | N | Summary measure (hazard ratio HR, risk ratio RR, odds ratio OR, weighted mean difference WMD) | 95% Confidence intervals | p‐value | Heterogeneity (I2) | |
| All‐cause mortality (all patients) | 6 | 1627 | HR | 0.69 | 0.55 to 0.86 | Not reported | Not reported | |
| 8 | 1726 | RR | 0.76 | 0.63 to 0.91 | 0.003 | Not reported | ||
| 11 | 2414 | RR | 0.83 | 0.69 to 0.99 | 0.0.35 | 0% | ||
| 12 | 2686 | OR | 0.74 | 0.6 to 0.91 | 0.005 | 0% | ||
| Not reported | Not reported | RR | 0.79 | 0.67 to 0.92 | 0.004 | Not reported | ||
| 10 | 2280 | HR | 0.82 | 0.67 to 1.00 | 0.05 | 0% | ||
| 14 | 3004 | RR | 0.94 | 0.81 to 1.08 | 0.39 | 3% | ||
| This review | 15 | 3169 | RR | 0.87 | 0.76 to 1.01 | 0.06 | 16% | |
| Heart failure admission | 7 | 1190 | RR | 0.65 | 0.5 to 0.84 | 0.001 | 52.30% | |
| 8 | 1920 | OR | 0.55 | 0.4 to 0.77 | <0.0001 | 58.20% | ||
| Not reported | Not reported | RR | 0.67 | 0.46 to 0.97 | 0.03 | Not reported | ||
| 11 | 2431 | HR | 0.74 | 0.60 to 0.90 | 0.002 | 24.00% | ||
| 11 | 2572 | RR | 0.79 | 0.63 to 0.98 | 0.03 | 67.00% | ||
| This review | 10 | 1928 | RR | 0.7 | 0.61 to 0.80 | <0.0001 | 60.00% | |
| All‐cause admission | 3 | 330 | RR | 0.82 | 0.64 to 1.05 | 0.12 | Not reported | |
| 5 | 1108 | OR | 0.8 | 0.63‐ 1.02 | 0.077 | 0% | ||
| 7 | 1627 | RR | 0.97 | 0.89 to 1.07 | 0.56 | 8% | ||
| This review | 6 | 1142 | RR | 0.93 | 0.84 to 1.03 | 0.15 | 0% | |
| Adverse events | Not reported | Not reported | RR | 1.15 | 0.99 to 1.342 | 0.69 | Not reported | |
| Adverse events (symptomatic hypotension) | 4 | 838 | RR | 1.72 | 0.59 to 5.05 | 0.32 | 43% | |
| Adverse events (hyper/hypokalemia) | 2 | 354 | RR | 1.34 | 0.42 to 4.34 | 0.62 | 0% | |
| Adverse events (renal dysfunction) | 3 | 769 | RR | 1.46 | 0.34 to 6.24 | 0.21 | 0% | |
| Adverse events (severe cough) | 2 | 220 | RR | 1.93 | 0.69 to 5.37 | 0.21 | 0% | |
| Quality of life | 5 | 1172 | WMD | ‐1.29 | ‐3.81 to 1.22 | 0.31 | 49% | |
| This review | 8 | 1812 | WMD | ‐0.03 | ‐1.18 to 1.13 | 0.97 | 75% | |
| Outcome | Review | Number of RCTs | N | Summary measure (hazard ratio HR, risk ratio RR, odds ratio OR, weighted mean difference WMD) | 95% Confidence intervals | P value | Heterogeneity (I2) | |
| All‐cause mortality (< 75 years) | 2 | 741 | RR | 0.52 | 0.33 to 0.82 | 0.005 | Not reported | |
| This review | 3 | 420 | RR | 0.73 | 0.49 to 1.10 | 0.13 | 58% | |
| All‐cause mortality (> 75 years) | 2 | 741 | RR | 0.94 | 0.71 to 1.25 | 0.7 | Not reported | |
| This review | 3 | 410 | RR | 1.23 | 0.96 to 1.57 | 0.1 | 58% | |
| All‐cause mortality (< 72 years) | 7 | Not reported | RR | 0.82 | 0.58 to 1.17 | Not reported | 0% | |
| All‐cause mortality (≥ 72 years) | 7 | Not reported | RR | 0.96 | 0.83 to 1.13 | Not reported | 24% | |
| Heart failure admission (<70 years) | Not reported | Not reported | RR | 0.45 | 0.33 to 0.61 | < 0.0001 | 0% | |
| Not reported | Not reported | RR | 0.44 | 0.31 to 0.63 | Not reported | Not reported | ||
| Heart failure admission (>70 years) | Not reported | |||||||
| Not reported | Not reported | RR | 0.89 | 0.74 ‐ 1.07 | Not reported | Not reported | ||
| All‐cause admission (< 72 years) | 5 | Not reported | RR | 0.61 | 0.41 to 0.93 | Not reported | 65% | |
| All‐cause admission (≥ 72 years) | 6 | Not reported | RR | 0.95 | 0.79 to 1.14 | Not reported | 38% | |
| All‐cause admission (< 72 years) | 4 | Not reported | RR | 0.88 | 0.77 to 1.00 | Not reported | 0% | |
| Outcome or subgroup title | No. of studies | No. of participants | Statistical method | Effect size |
| 1 All‐cause mortality Show forest plot | 15 | 3169 | Risk Ratio (M‐H, Fixed, 95% CI) | 0.87 [0.76, 1.01] |
| 2 Heart failure mortality Show forest plot | 6 | 853 | Risk Ratio (M‐H, Fixed, 95% CI) | 0.84 [0.54, 1.30] |
| 3 Heart failure admission Show forest plot | 10 | 1928 | Risk Ratio (M‐H, Fixed, 95% CI) | 0.70 [0.61, 0.80] |
| 4 All‐cause admission Show forest plot | 6 | 1142 | Risk Ratio (M‐H, Fixed, 95% CI) | 0.93 [0.84, 1.03] |
| 5 Quality of life Show forest plot | 8 | 1812 | Mean Difference (IV, Fixed, 95% CI) | ‐0.03 [‐1.18, 1.13] |
| Outcome or subgroup title | No. of studies | No. of participants | Statistical method | Effect size |
| 1 All‐cause mortality Show forest plot | 15 | 3169 | Risk Ratio (M‐H, Fixed, 95% CI) | 0.87 [0.76, 1.01] |
| 1.1 Clinical assessment | 15 | 2850 | Risk Ratio (M‐H, Fixed, 95% CI) | 0.89 [0.76, 1.04] |
| 1.2 Usual care | 2 | 319 | Risk Ratio (M‐H, Fixed, 95% CI) | 0.79 [0.56, 1.13] |
| 2 Heart failure mortality Show forest plot | 6 | 853 | Risk Ratio (M‐H, Fixed, 95% CI) | 0.84 [0.54, 1.30] |
| 2.1 Clinical assessment | 6 | 853 | Risk Ratio (M‐H, Fixed, 95% CI) | 0.84 [0.54, 1.30] |
| 2.2 Usual care | 0 | 0 | Risk Ratio (M‐H, Fixed, 95% CI) | 0.0 [0.0, 0.0] |
| 3 Heart failure admission Show forest plot | 10 | 1928 | Risk Ratio (M‐H, Fixed, 95% CI) | 0.70 [0.61, 0.80] |
| 3.1 Clinical assessment | 10 | 1609 | Risk Ratio (M‐H, Fixed, 95% CI) | 0.70 [0.60, 0.81] |
| 3.2 Usual care | 2 | 319 | Risk Ratio (M‐H, Fixed, 95% CI) | 0.72 [0.53, 0.99] |
| 4 All‐cause admission Show forest plot | 6 | 1142 | Risk Ratio (M‐H, Fixed, 95% CI) | 0.93 [0.84, 1.03] |
| 4.1 Clinical assessment | 6 | 1142 | Risk Ratio (M‐H, Fixed, 95% CI) | 0.93 [0.84, 1.03] |
| 4.2 Usual care | 0 | 0 | Risk Ratio (M‐H, Fixed, 95% CI) | 0.0 [0.0, 0.0] |
| 5 Quality of life Show forest plot | 8 | 1812 | Mean Difference (IV, Fixed, 95% CI) | ‐0.03 [‐1.18, 1.13] |
| 5.1 Clincial assessment | 8 | 1812 | Mean Difference (IV, Fixed, 95% CI) | ‐0.03 [‐1.18, 1.13] |
| 5.2 Usual care | 0 | 0 | Mean Difference (IV, Fixed, 95% CI) | 0.0 [0.0, 0.0] |
| Outcome or subgroup title | No. of studies | No. of participants | Statistical method | Effect size |
| 1 All‐cause mortality and age Show forest plot | 3 | 830 | Risk Ratio (M‐H, Fixed, 95% CI) | 1.02 [0.83, 1.27] |
| 1.1 Equal or greater than 75 yrs old | 3 | 410 | Risk Ratio (M‐H, Fixed, 95% CI) | 1.23 [0.96, 1.57] |
| 1.2 Under 75 yrs old | 3 | 420 | Risk Ratio (M‐H, Fixed, 95% CI) | 0.73 [0.49, 1.10] |
| 2 Heart failure admission and age Show forest plot | 1 | 365 | Risk Ratio (M‐H, Fixed, 95% CI) | 0.93 [0.69, 1.25] |
| 2.1 Equal or greater than 75 yrs old | 1 | 188 | Risk Ratio (M‐H, Fixed, 95% CI) | 1.13 [0.77, 1.64] |
| 2.2 Under 75 yrs old | 1 | 177 | Risk Ratio (M‐H, Fixed, 95% CI) | 0.73 [0.45, 1.17] |
| Outcome or subgroup title | No. of studies | No. of participants | Statistical method | Effect size |
| 1 All‐cause mortality Show forest plot | 5 | 1663 | Risk Ratio (M‐H, Fixed, 95% CI) | 0.94 [0.80, 1.11] |
| 2 Heart failure mortality Show forest plot | 1 | 268 | Risk Ratio (M‐H, Fixed, 95% CI) | 1.2 [0.66, 2.20] |
| 3 Heart failure admission Show forest plot | 4 | 1318 | Risk Ratio (M‐H, Fixed, 95% CI) | 0.83 [0.71, 0.98] |
| 4 All‐cause admission Show forest plot | 2 | 675 | Risk Ratio (M‐H, Fixed, 95% CI) | 0.98 [0.88, 1.10] |
| 5 Quality of life Show forest plot | 3 | 994 | Mean Difference (IV, Fixed, 95% CI) | ‐0.01 [‐1.28, 1.27] |
| Outcome or subgroup title | No. of studies | No. of participants | Statistical method | Effect size |
| 1 All‐cause mortality Show forest plot | 7 | 1229 | Risk Ratio (M‐H, Fixed, 95% CI) | 0.83 [0.65, 1.07] |
| 2 Heart failure mortality Show forest plot | 4 | 533 | Risk Ratio (M‐H, Fixed, 95% CI) | 0.52 [0.26, 1.03] |
| 3 Heart failure admission Show forest plot | 5 | 814 | Risk Ratio (M‐H, Fixed, 95% CI) | 0.63 [0.49, 0.81] |
| 4 All‐cause admission Show forest plot | 4 | 833 | Risk Ratio (M‐H, Fixed, 95% CI) | 0.94 [0.83, 1.07] |
| 5 Quality of life Show forest plot | 3 | 534 | Mean Difference (IV, Fixed, 95% CI) | ‐0.57 [‐1.92, 0.78] |
| Outcome or subgroup title | No. of studies | No. of participants | Statistical method | Effect size |
| 1 All‐cause mortality Show forest plot | 15 | 3169 | Risk Ratio (M‐H, Fixed, 95% CI) | 0.87 [0.76, 1.01] |
| 1.1 ≤ 1 yr | 5 | 555 | Risk Ratio (M‐H, Fixed, 95% CI) | 0.46 [0.25, 0.85] |
| 1.2 1‐2 yrs | 8 | 1842 | Risk Ratio (M‐H, Fixed, 95% CI) | 0.83 [0.69, 0.99] |
| 1.3 > 2 yrs | 2 | 772 | Risk Ratio (M‐H, Fixed, 95% CI) | 1.11 [0.87, 1.41] |
| 2 Heart failure mortality Show forest plot | 6 | 853 | Risk Ratio (M‐H, Fixed, 95% CI) | 0.84 [0.54, 1.30] |
| 2.1 ≤ 1 yr | 3 | 313 | Risk Ratio (M‐H, Fixed, 95% CI) | 0.64 [0.28, 1.48] |
| 2.2 1 ‐ 2 yrs | 3 | 540 | Risk Ratio (M‐H, Fixed, 95% CI) | 0.94 [0.56, 1.57] |
| 2.3 > 2 yrs | 0 | 0 | Risk Ratio (M‐H, Fixed, 95% CI) | 0.0 [0.0, 0.0] |
| 3 Heart failure admission Show forest plot | 10 | 1928 | Risk Ratio (M‐H, Fixed, 95% CI) | 0.70 [0.61, 0.80] |
| 3.1 ≤ 1 yr | 3 | 278 | Risk Ratio (M‐H, Fixed, 95% CI) | 0.37 [0.23, 0.58] |
| 3.2 1 ‐ 2 yrs | 5 | 878 | Risk Ratio (M‐H, Fixed, 95% CI) | 0.65 [0.54, 0.79] |
| 3.3 > 2 ys | 2 | 772 | Risk Ratio (M‐H, Fixed, 95% CI) | 0.97 [0.77, 1.23] |
| 4 All‐cause admission Show forest plot | 6 | 1142 | Risk Ratio (M‐H, Fixed, 95% CI) | 0.93 [0.84, 1.03] |
| 4.1 ≤ 1 yr | 3 | 247 | Risk Ratio (M‐H, Fixed, 95% CI) | 0.79 [0.58, 1.07] |
| 4.2 1 ‐ 2 yrs | 2 | 488 | Risk Ratio (M‐H, Fixed, 95% CI) | 0.89 [0.77, 1.03] |
| 4.3 > 2 yrs | 1 | 407 | Risk Ratio (M‐H, Fixed, 95% CI) | 1.04 [0.89, 1.21] |
| 5 Quality of life Show forest plot | 8 | 1812 | Mean Difference (IV, Fixed, 95% CI) | ‐0.03 [‐1.18, 1.13] |
| 5.1 ≤ 1 yr | 5 | 561 | Mean Difference (IV, Fixed, 95% CI) | ‐3.14 [‐6.46, 0.19] |
| 5.2 1 ‐ 2 yrs | 2 | 844 | Mean Difference (IV, Fixed, 95% CI) | 1.98 [‐0.76, 4.72] |
| 5.3 > 2 yrs | 1 | 407 | Mean Difference (IV, Fixed, 95% CI) | 0.0 [‐1.38, 1.38] |
| Outcome or subgroup title | No. of studies | No. of participants | Statistical method | Effect size |
| 1 All‐cause mortality Show forest plot | 15 | 3169 | Risk Ratio (M‐H, Fixed, 95% CI) | 0.87 [0.76, 1.01] |
| 1.1 NT‐proBNP | 9 | 2391 | Risk Ratio (M‐H, Fixed, 95% CI) | 0.87 [0.75, 1.01] |
| 1.2 BNP | 6 | 778 | Risk Ratio (M‐H, Fixed, 95% CI) | 0.89 [0.62, 1.28] |
| 2 Heart failure mortality Show forest plot | 6 | 853 | Risk Ratio (M‐H, Fixed, 95% CI) | 0.84 [0.54, 1.30] |
| 2.1 NT‐proBNP | 2 | 127 | Risk Ratio (M‐H, Fixed, 95% CI) | 0.30 [0.08, 1.19] |
| 2.2 BNP | 4 | 726 | Risk Ratio (M‐H, Fixed, 95% CI) | 0.98 [0.61, 1.56] |
| 3 Heart failure admission Show forest plot | 10 | 1928 | Risk Ratio (M‐H, Random, 95% CI) | 0.67 [0.53, 0.84] |
| 3.1 NT‐proBNP | 6 | 1328 | Risk Ratio (M‐H, Random, 95% CI) | 0.65 [0.48, 0.89] |
| 3.2 BNP | 4 | 600 | Risk Ratio (M‐H, Random, 95% CI) | 0.68 [0.43, 1.05] |
| 4 All‐cause admission Show forest plot | 6 | 1142 | Risk Ratio (M‐H, Fixed, 95% CI) | 0.93 [0.84, 1.03] |
| 4.1 NT‐proBNP | 2 | 476 | Risk Ratio (M‐H, Fixed, 95% CI) | 0.99 [0.85, 1.14] |
| 4.2 BNP | 4 | 666 | Risk Ratio (M‐H, Fixed, 95% CI) | 0.88 [0.77, 1.01] |
| 5 Quality of life Show forest plot | 8 | 1812 | Mean Difference (IV, Fixed, 95% CI) | ‐0.03 [‐1.18, 1.13] |
| 5.1 NT‐proBNP | 7 | 1771 | Mean Difference (IV, Fixed, 95% CI) | ‐0.02 [‐1.19, 1.14] |
| 5.2 BNP | 1 | 41 | Mean Difference (IV, Fixed, 95% CI) | ‐0.20 [‐15.30, 14.90] |