| Study | Participants randomised | First intervention | Second intervention | Reported outcomes | baseline risk | Significant differences in outcome |
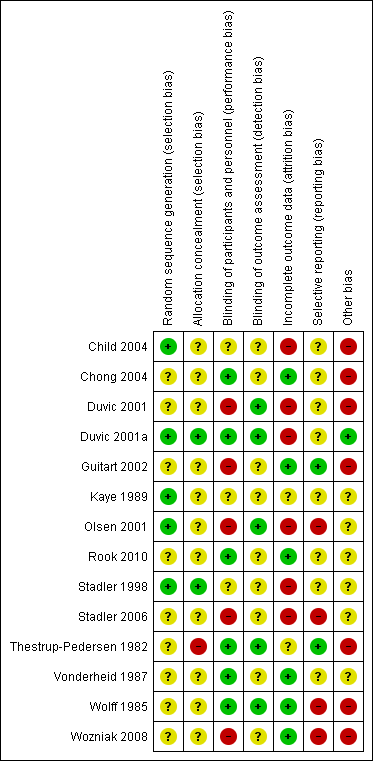
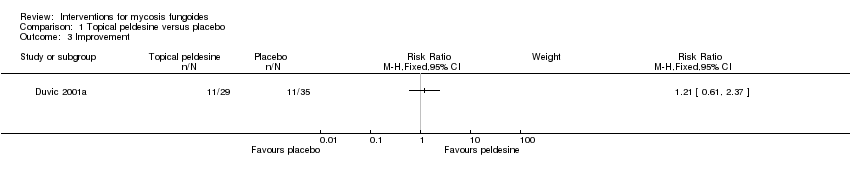
| Duvic 2001a | 89 participants stage I (IA: 45, IB:44) | topical peldesine 1% given for 24 weeks | placebo cream given for 24 weeks | common adverse effects clearance survival rates improvement | common adverse effects (rash): 3% with placebo cream | common adverse effects (rash): The relative risk of 7.24 (95% CI 0.92 to 56.76) showed a higher risk for peldesine (Fisher test P≤0.041). |
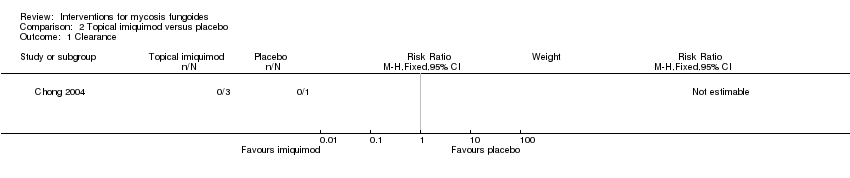
| Chong 2004 | 4 participants plaque stage IB | topical imiquimod 5% given for 16 weeks | placebo cream given for 16 weeks | common adverse effects clearance (assessed 16 weeks after end of intervention) improvement (assessed 16 weeks after end of intervention) rare adverse effects | | none |
| Rook 2010 | 12 participants patch or plaque stage, lesional comparison | hypericin 0.05‐0.25% in combination with visible light given for 6 weeks | placebo cream in combination with visible light given for 6 weeks | common adverse effects survival rates improvement | improvement: 8% with placebo cream | improvement: The relative risk of 7.00 (95% CI 1.01 to 48.54) favoured hypericin (Fisher test P≤0.028). |
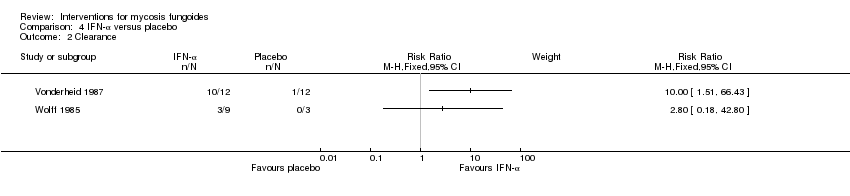
| Vonderheid 1987 | 6 participants stage IA to IIA (IA: 1; IB: 1; IIA: 4), lesional comparison | injections of interferon‐α 2b given for 4 weeks | injections of isotonic sterile water given for 4 weeks | common adverse effects (assessed after 3 weeks of intervention) clearance (assessed 4 weeks after end of intervention) | common adverse effects (mild erythema): 0% with injections of sterile water clearance: 8% injections of sterile water | common adverse effects (mild erythema): The relative risk of 11.00 (95% CI 0.74 to 163.49) favoured interferon‐α (Fisher test P≤0.016). clearance: The RR 10.00 (95% CI 1.51 to 66.43) favoured interferon‐α (Fisher test P≤0.0007). |
| Wolff 1985 | 12 participants stage IA (7) to IB (5) | injections of interferon‐α given for 4 weeks | injections of buffered glycine serum human albumin given for 4 weeks | common adverse effects clearance | common adverse effects (mild fever): 0% with injections of buffered glycine serum human albumin | common adverse effects (mild fever): The relative risk of 11.00 (95% CI 0.70‐173.66) showed a higher risk for interferon‐α (Fisher test P≤0.03). |
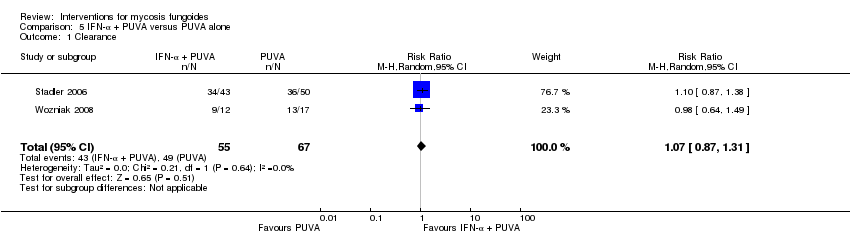
| Stadler 2006 | 124 participants stage lA to IIA | injections of interferon‐α in combination with PUVA given for up to 52 weeks | PUVA alone given for up to 52 weeks | clearance | | none |
| Wozniak 2008 | 29 participants stage lA to IIA (IA: 14; IB: 6; IIA: 9) | injections of interferon‐α in combination with PUVA given for 24 weeks | PUVA alone given for 24 weeks | clearance relapse disease‐free interval | | none |
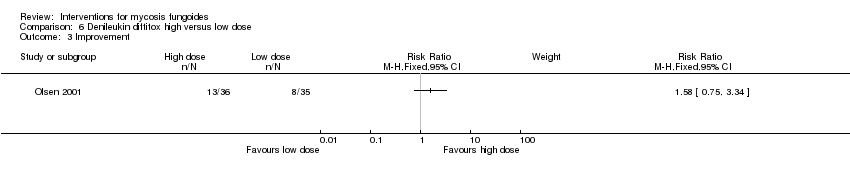
| Olsen 2001 | 71 participants stage IB‐IVA (IB:16, IIA: 10, IIB: 19, III: 11, IVA:15) | denileukin diftitox intravenous infusion 9µg/kg/day given for up to 6 months | denileukin diftitox intravenous infusion 18µg/kg/day given for up to 6 months | quality of life common adverse effects clearance survival rates (assessed 90 days after end of intervention) improvement rare adverse effects | | none |
| Duvic 2001 | 58 participants stage I to IIA (IA: 17, IB: 34, IIA: 6, IIB: 1) | bexarotene capsules dosed 300 to 650mg/m²/day given for 16 weeks | bexarotene capsules dosed 6.5mg/m²/day given for 16 weeks | quality of life common adverse effects clearance relapse survival rates (assessed 4 weeks after end of intervention) improvement rare adverse effects | | no calculations, due to methodological problems |
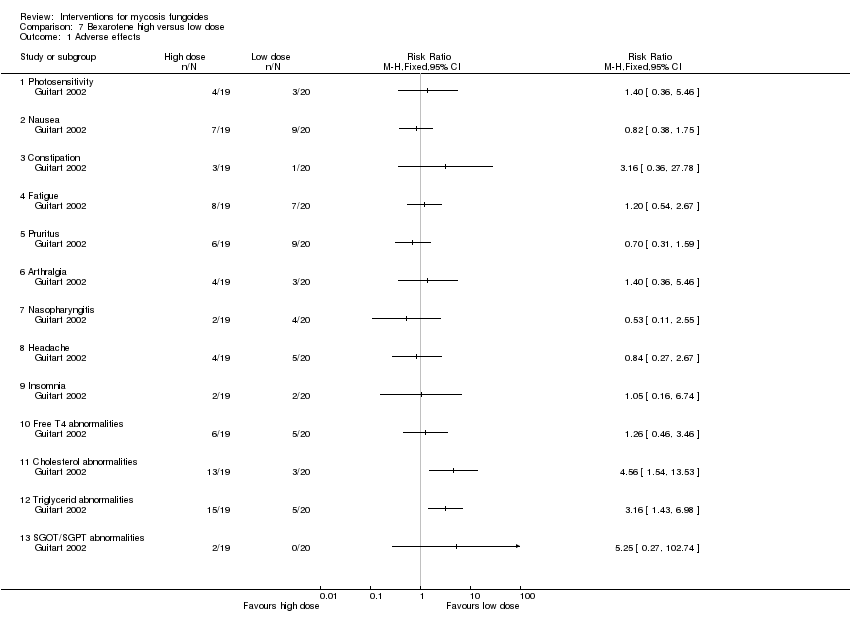
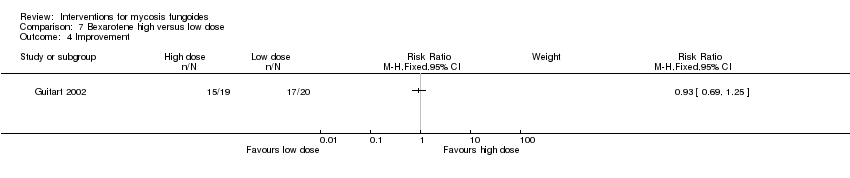
| Guitart 2002 | 43 participants stage IB (36) and IIA (7) | bexarotene 300mg/day in combination with PUVA and fenofibrate 54mg/day given for 24 weeks | bexarotene 150mg/day in combination with PUVA and fenofibrate 54mg/day given for 24 weeks | common adverse effects clearance relapse (assessed 6 months after end of intervention) disease‐free interval survival rates improvement | common adverse effects (cholesterol levels): 15% with bexarotene 150mg/day common adverse effects (triglyceride levels):25% with bexarotene 150mg/day | common adverse effects (cholesterol levels): The relative risk of 4.56 (5% CI 1.54 to 13.53) showed a higher risk for bexarotene 300mg/day (Fisher test P≤0.002). common adverse effects (triglyceride levels): The RR 3.16 (95% CI 1.93 to 6.98) showed a higher risk for bexarotene 300mg/day (Fisher test P≤0.002). |
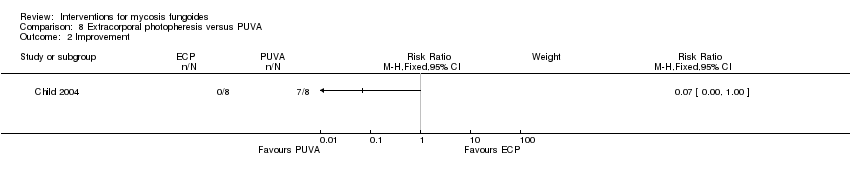
| Child 2004 | 8 participants plaque stage (Bunn Lamberg 1B) | extracorporeal photopheresis given for 6 months | PUVA given for 3 months | common adverse effects clearance survival rates (assessed 2‐21 months after end of intervention) improvement | improvement:0% with extracorporeal photopheresis | improvement: The relative risk of 0.07 (95% CI 0.00 to 1.00) favoured PUVA (Fisher test P≤0.002). |
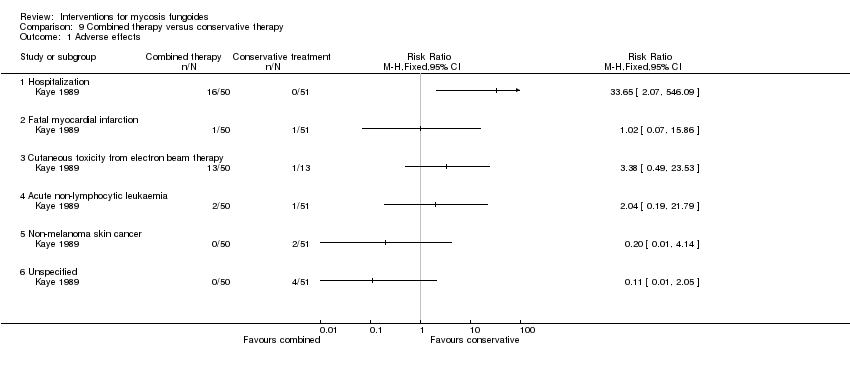
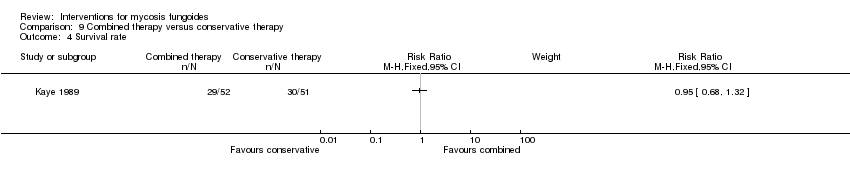
| Kaye 1989 | 103 participants of all stages (IA: 6, IB: 16, IIA: 9, IIB: 12; III: 2, IVA: 42, IVB: 16) | "combined therapy" (electron‐beam radiation and parenteral chemotherapy) given for 8 to 12 weeks | "conservative treatment" (topical treatment with mechlorethamine supported by a stepwise escalation of the therapy according to stage of disease) duration of intervention not reported | common adverse effects clearance relapse disease‐free interval survival rates (assessed more than 5 years after end of intervention) improvement | common adverse effects (hospitalisation): 0% with "conservative treatment" clearance: 18% with "conservative treatment" improvement: 65% with "conservative treatment" | common adverse effects (hospitalizations): The relative risk of 33.65 (95% CI 2.07 to 546.09) showed a higher risk for the "combined therapy" (Fisher test P≤0.0001). clearance: The relative risk of 2.18 (95% CI 1.10 to 4.33) favoured the "combined therapy" (Fisher test P≤0.03). improvement: The relative risk of 1.40 (95% CI 1.12 to 1.74) favoured the "combined therapy" (Fisher test P≤0.003). |
| Stadler 1998 | 82 participants stage I and II (IA: 36; IB: 28; IIA: 10; IIB: 8) | injections of interferon‐α in combination with PUVA given for up to 48 weeks | injections of interferon‐α in combination with acitretin given for up to 48 weeks | common adverse effects clearance improvement | common adverse effects (adverse effects grade III): 10% IFN‐α in combination with PUVA common adverse effects (requiring discontinuation): 5% IFN‐α in combination with PUVA common adverse effects (neurological disorders): 8% IFN‐α in combination with PUVA clearance: 38% with IFN‐α in combination with acitretin | common adverse effects (adverse effects grade III): The relative risk of 3.10 (95% CI 1.10 to 8.70) showed a higher risk for interferon‐α in combination with acitretin (Fisher test P≤0.03). common adverse effects (requiring discontinuation): The relative risk of 4.29 (95% CI 0.99 to 18.63) showed a higher risk for interferon‐α in combination with acitretin (Fisher test P≤0.049). common adverse effects (neurological disorders): The relative risk of 3.49 (95% CI 1.05 to 11.60) showed a higher risk for interferon‐α in combination with acitretin (Fisher test P≤0.04). clearance: The relative risk of 0.54 (95% CI 0.35 to 0.84) favoured interferon‐α in combination with PUVA (Fisher test P≤0.005). |
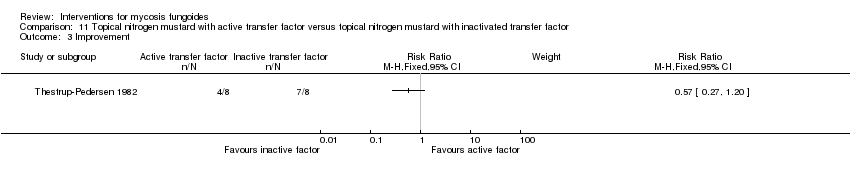
| Thestrup‐Pedersen 1982 | 16 participants van Scott stage II‐IV (II: 14; III: 1; IV: 1) | topically applied nitrogen mustard with active transfer factor given for 1 year | topically applied nitrogen mustard with inactivated transfer factor given for 1 year | common adverse effects clearance (assessed 1 year after end of intervention) survival rates (assessed 1 year after end of intervention) improvement (assessed 1 year after end of intervention) | clearance: 0% with topically applied nitrogen mustard with active transfer factor | clearance: The relative risk of 0.09 (95% CI 0.01 to 1.41) favoured topically applied nitrogen mustard with inactivated transfer factor (Fisher test P≤0.03). |