Pharmacothérapies pour la dépendance au cannabis
Información
- DOI:
- https://doi.org/10.1002/14651858.CD008940.pub2Copiar DOI

- Base de datos:
-
- Cochrane Database of Systematic Reviews
- Versión publicada:
-
- 17 diciembre 2014see what's new
- Tipo:
-
- Intervention
- Etapa:
-
- Review
- Grupo Editorial Cochrane:
-
Grupo Cochrane de Alcohol y drogas
- Copyright:
-
- Copyright © 2014 The Cochrane Collaboration. Published by John Wiley & Sons, Ltd.
Cifras del artículo
Altmetric:
Citado por:
Autores
Contributions of authors
All authors contributed to the review concept and design. Kushani Marshall and Linda Gowing undertook literature searches, assessed studies for inclusion, and wrote a first draft of the text. Bernard Le Foll and Robert Ali provided comments at all stages of the review.
Sources of support
Internal sources
-
DASSA‐WHO Collaborating Centre in the Treatment of Drug and Alcohol Problems, Australia.
External sources
-
No sources of support supplied
Declarations of interest
Dr Le Foll is performing clinical research evaluating the utility of nabiximols for cannabis dependence treatment using drug supplies donated by GW Pharma. The research is supported by the Centre for Addiction and Mental Health, the Canadian Institute of Health Research (CSU 115548) and the National Institute On Drug Abuse of the National Institutes of Health (R21DA031906).
Acknowledgements
None
Version history
| Published | Title | Stage | Authors | Version |
| 2019 Jan 28 | Pharmacotherapies for cannabis dependence | Review | Suzanne Nielsen, Linda Gowing, Pamela Sabioni, Bernard Le Foll | |
| 2014 Dec 17 | Pharmacotherapies for cannabis dependence | Review | Kushani Marshall, Linda Gowing, Robert Ali, Bernard Le Foll | |
| 2011 Jan 19 | Pharmacotherapies for cannabis withdrawal | Protocol | Kushani S Marshall, Linda Gowing, Robert Ali | |
Differences between protocol and review
The original protocol focused on the management of cannabis withdrawal. When it became clear that very few studies considered withdrawal as a distinct phase, the review was broadened to include interventions to support cessation or reduction of cannabis use as well as management of withdrawal symptoms. The broadening of the review made the specification of "the portion of the scheduled treatment episode that is completed on average" less relevant; hence this was dropped from the review.
The original protocol stipulated the inclusion of studies that involve participants who are diagnosed according to DSM‐IV or ICD‐10 criteria as cannabis dependent, or where dependence is likely based on reported dose, duration and frequency of use (daily or multiple days per week). Given the qualifier of "where dependence is likely" the specification of DSM‐IV or ICD‐10 criteria would not have resulted in the exclusion of any included studies and was dropped from the methods of the review in the interests of simplicity.
The approach to heterogeneity specified in the protocol (use of a random‐effects model in the presence of statistical heterogeneity) was changed based on statistical advice received in the interim. The routine use of a random‐effects model is preferred and was the approach used for the review.
PICO

Study flow diagram.
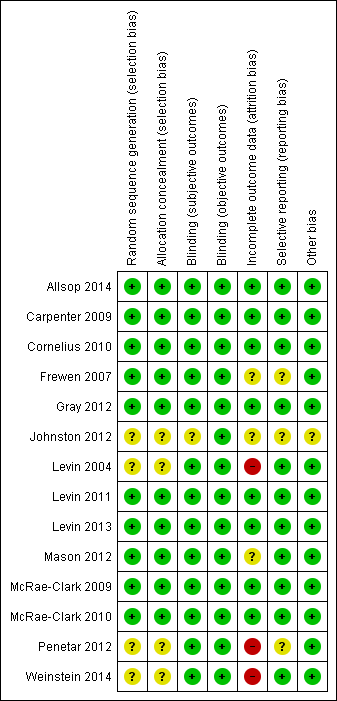
Methodological quality summary: review authors' judgements about each methodological quality item for each included study.

Methodological quality graph: review authors' judgements about each methodological quality item presented as percentages across all included studies.

Comparison 1 Active medication versus placebo, Outcome 1 Number abstinent at end of treatment.
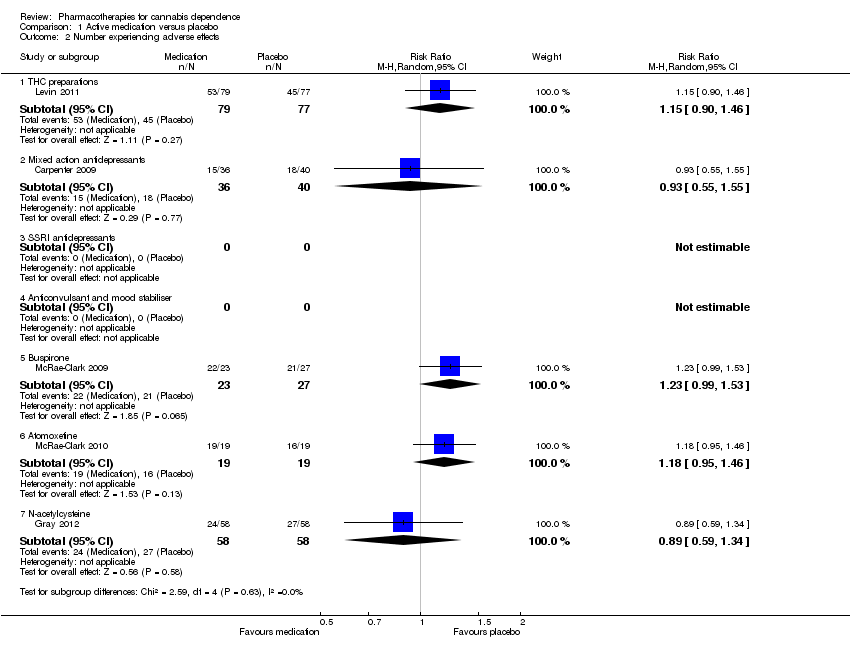
Comparison 1 Active medication versus placebo, Outcome 2 Number experiencing adverse effects.

Comparison 1 Active medication versus placebo, Outcome 3 Number withdrawn due to adverse effects.

Comparison 1 Active medication versus placebo, Outcome 4 Completion of treatment.
| Active medication compared with placebo | ||||||
| Outcomes | Illustrative comparative risks* (95% CI) | Relative effect | No of participants | Quality of the evidence | Comments | |
| Assumed risk | Corresponding risk | |||||
| Control | Active Medication | |||||
| Number abstinent at end of treatment ‐ mixed action antidepressants | Study population | RR 0.82 | 179 | ⊕⊝⊝⊝ | ||
| 250 per 1000 | 205 per 1000 | |||||
| Moderate | ||||||
| 233 per 1000 | 191 per 1000 | |||||
| *The basis for the assumed risk (e.g. the median control group risk across studies) is provided in footnotes. The corresponding risk (and its 95% confidence interval) is based on the assumed risk in the comparison group and the relative effect of the intervention (and its 95% CI). | ||||||
| GRADE Working Group grades of evidence | ||||||
| 1 Significant heterogeneity between studies | ||||||
| Active medication compared with placebo | ||||||
| Outcomes | Illustrative comparative risks* (95% CI) | Relative effect | No of participants | Quality of the evidence | Comments | |
| Assumed risk | Corresponding risk | |||||
| Control | Active Medication | |||||
| Number withdrawn due to adverse effects ‐ mixed action antidepressants | Study population | RR 1.44 | 179 | ⊕⊝⊝⊝ | ||
| 11 per 1000 | 16 per 1000 | |||||
| Moderate | ||||||
| 13 per 1000 | 19 per 1000 | |||||
| *The basis for the assumed risk (e.g. the median control group risk across studies) is provided in footnotes. The corresponding risk (and its 95% confidence interval) is based on the assumed risk in the comparison group and the relative effect of the intervention (and its 95% CI). | ||||||
| GRADE Working Group grades of evidence | ||||||
| 1 Studies differ in direction of effect without significant heterogeneity | ||||||
| Active medication compared with placebo | ||||||
| Outcomes | Illustrative comparative risks* (95% CI) | Relative effect | No of participants | Quality of the evidence | Comments | |
| Assumed risk | Corresponding risk | |||||
| Control | Active Medication | |||||
| Completion of treatment ‐ THC preparations | Study population | RR 1.29 | 207 | ⊕⊕⊕⊝ | ||
| 614 per 1000 | 792 per 1000 | |||||
| Moderate | ||||||
| 618 per 1000 | 797 per 1000 | |||||
| Completion of treatment ‐ mixed action antidepressants | Study population | RR 0.93 | 169 | ⊕⊕⊕⊝ | ||
| 573 per 1000 | 533 per 1000 | |||||
| Moderate | ||||||
| 551 per 1000 | 512 per 1000 | |||||
| Completion of treatment ‐ SSRI antidepressants | Study population | RR 0.82 | 122 | ⊕⊝⊝⊝ | ||
| 790 per 1000 | 648 per 1000 | |||||
| Moderate | ||||||
| 766 per 1000 | 628 per 1000 | |||||
| Completion of treatment ‐ anticonvulsant and mood stabiliser | Study population | RR 0.78 | 75 | ⊕⊝⊝⊝ | ||
| 405 per 1000 | 316 per 1000 | |||||
| Moderate | ||||||
| 387 per 1000 | 302 per 1000 | |||||
| Completion of treatment ‐ atypical antidepressant (bupropion) | Study population | RR 1.06 | 92 | ⊕⊝⊝⊝ | ||
| 429 per 1000 | 454 per 1000 | |||||
| Moderate | ||||||
| 400 per 1000 | 424 per 1000 | |||||
| *The basis for the assumed risk (e.g. the median control group risk across studies) is provided in footnotes. The corresponding risk (and its 95% confidence interval) is based on the assumed risk in the comparison group and the relative effect of the intervention (and its 95% CI). | ||||||
| GRADE Working Group grades of evidence | ||||||
| 1 Significant heterogeneity between studies | ||||||
| Outcome or subgroup title | No. of studies | No. of participants | Statistical method | Effect size |
| 1 Number abstinent at end of treatment Show forest plot | 5 | Risk Ratio (M‐H, Random, 95% CI) | Subtotals only | |
| 1.1 THC preparations | 1 | 156 | Risk Ratio (M‐H, Random, 95% CI) | 1.14 [0.56, 2.30] |
| 1.2 Mixed action antidepressants | 2 | 179 | Risk Ratio (M‐H, Random, 95% CI) | 0.82 [0.12, 5.41] |
| 1.3 SSRI antidepressants | 1 | 52 | Risk Ratio (M‐H, Random, 95% CI) | 2.33 [0.68, 8.05] |
| 1.4 Anticonvulsant and mood stabiliser | 1 | 19 | Risk Ratio (M‐H, Random, 95% CI) | 1.08 [0.50, 2.34] |
| 1.5 Buspirone | 0 | 0 | Risk Ratio (M‐H, Random, 95% CI) | 0.0 [0.0, 0.0] |
| 1.6 Atomoxetine | 0 | 0 | Risk Ratio (M‐H, Random, 95% CI) | 0.0 [0.0, 0.0] |
| 1.7 N‐acetylcysteine | 0 | 0 | Risk Ratio (M‐H, Random, 95% CI) | 0.0 [0.0, 0.0] |
| 2 Number experiencing adverse effects Show forest plot | 5 | Risk Ratio (M‐H, Random, 95% CI) | Subtotals only | |
| 2.1 THC preparations | 1 | 156 | Risk Ratio (M‐H, Random, 95% CI) | 1.15 [0.90, 1.46] |
| 2.2 Mixed action antidepressants | 1 | 76 | Risk Ratio (M‐H, Random, 95% CI) | 0.93 [0.55, 1.55] |
| 2.3 SSRI antidepressants | 0 | 0 | Risk Ratio (M‐H, Random, 95% CI) | 0.0 [0.0, 0.0] |
| 2.4 Anticonvulsant and mood stabiliser | 0 | 0 | Risk Ratio (M‐H, Random, 95% CI) | 0.0 [0.0, 0.0] |
| 2.5 Buspirone | 1 | 50 | Risk Ratio (M‐H, Random, 95% CI) | 1.23 [0.99, 1.53] |
| 2.6 Atomoxetine | 1 | 38 | Risk Ratio (M‐H, Random, 95% CI) | 1.18 [0.95, 1.46] |
| 2.7 N‐acetylcysteine | 1 | 116 | Risk Ratio (M‐H, Random, 95% CI) | 0.89 [0.59, 1.34] |
| 3 Number withdrawn due to adverse effects Show forest plot | 7 | Risk Ratio (M‐H, Random, 95% CI) | Subtotals only | |
| 3.1 THC preparations | 1 | 156 | Risk Ratio (M‐H, Random, 95% CI) | 0.97 [0.06, 15.31] |
| 3.2 Mixed action antidepressants | 2 | 179 | Risk Ratio (M‐H, Random, 95% CI) | 1.44 [0.11, 18.90] |
| 3.3 SSRI antidepressants | 0 | 0 | Risk Ratio (M‐H, Random, 95% CI) | 0.0 [0.0, 0.0] |
| 3.4 Anticonvulsant and mood stabiliser | 1 | 50 | Risk Ratio (M‐H, Random, 95% CI) | 1.0 [0.07, 15.12] |
| 3.5 Buspirone | 1 | 50 | Risk Ratio (M‐H, Random, 95% CI) | 1.17 [0.08, 17.74] |
| 3.6 Atomoxetine | 1 | 38 | Risk Ratio (M‐H, Random, 95% CI) | 3.0 [0.13, 69.31] |
| 3.7 N‐acetylcysteine | 1 | 116 | Risk Ratio (M‐H, Random, 95% CI) | 3.0 [0.12, 72.15] |
| 4 Completion of treatment Show forest plot | 12 | Risk Ratio (M‐H, Random, 95% CI) | Subtotals only | |
| 4.1 THC preparations | 2 | 207 | Risk Ratio (M‐H, Random, 95% CI) | 1.29 [1.08, 1.55] |
| 4.2 Mixed action antidepressants | 2 | 169 | Risk Ratio (M‐H, Random, 95% CI) | 0.93 [0.71, 1.21] |
| 4.3 SSRI antidepressants | 2 | 122 | Risk Ratio (M‐H, Random, 95% CI) | 0.82 [0.44, 1.53] |
| 4.4 Anticonvulsant and mood stabiliser | 2 | 75 | Risk Ratio (M‐H, Random, 95% CI) | 0.78 [0.42, 1.46] |
| 4.5 Buspirone | 1 | 50 | Risk Ratio (M‐H, Random, 95% CI) | 0.99 [0.56, 1.77] |
| 4.6 Atomoxetine | 1 | 38 | Risk Ratio (M‐H, Random, 95% CI) | 1.29 [0.60, 2.74] |
| 4.7 N‐acetylcysteine | 1 | 116 | Risk Ratio (M‐H, Random, 95% CI) | 1.12 [0.83, 1.51] |
| 4.8 Bupropion | 2 | 92 | Risk Ratio (M‐H, Random, 95% CI) | 1.06 [0.67, 1.67] |