妊娠中の女性に対するビタミンD補充
Abstract
Background
Vitamin D supplementation during pregnancy may be needed to protect against adverse pregnancy outcomes. This is an update of a review that was first published in 2012 and then in 2016.
Objectives
To examine whether vitamin D supplementation alone or in combination with calcium or other vitamins and minerals given to women during pregnancy can safely improve maternal and neonatal outcomes.
Search methods
For this update, we searched Cochrane Pregnancy and Childbirth’s Trials Register (12 July 2018), contacted relevant organisations (15 May 2018), reference lists of retrieved trials and registries at clinicaltrials.gov and WHO International Clinical Trials Registry Platform (12 July 2018). Abstracts were included if they had enough information to extract the data.
Selection criteria
Randomised and quasi‐randomised trials evaluating the effect of supplementation with vitamin D alone or in combination with other micronutrients for women during pregnancy in comparison to placebo or no intervention.
Data collection and analysis
Two review authors independently i) assessed the eligibility of trials against the inclusion criteria, ii) extracted data from included trials, and iii) assessed the risk of bias of the included trials. The certainty of the evidence was assessed using the GRADE approach.
Main results
We included 30 trials (7033 women), excluded 60 trials, identified six as ongoing/unpublished trials and two trials are awaiting assessments.
Supplementation with vitamin D alone versus placebo/no intervention
A total of 22 trials involving 3725 pregnant women were included in this comparison; 19 trials were assessed as having low‐to‐moderate risk of bias for most domains and three trials were assessed as having high risk of bias for most domains. Supplementation with vitamin D alone during pregnancy probably reduces the risk of pre‐eclampsia (risk ratio (RR) 0.48, 95% confidence interval (CI) 0.30 to 0.79; 4 trials, 499 women, moderate‐certainty evidence) and gestational diabetes (RR 0.51, 95% CI 0.27 to 0.97; 4 trials, 446 women, moderate‐certainty evidence); and probably reduces the risk of having a baby with low birthweight (less than 2500 g) (RR 0.55, 95% CI 0.35 to 0.87; 5 trials, 697 women, moderate‐certainty evidence) compared to women who received placebo or no intervention. Vitamin D supplementation may make little or no difference in the risk of having a preterm birth < 37 weeks compared to no intervention or placebo (RR 0.66, 95% CI 0.34 to 1.30; 7 trials, 1640 women, low‐certainty evidence). In terms of maternal adverse events, vitamin D supplementation may reduce the risk of severe postpartum haemorrhage (RR 0.68, 95% CI 0.51 to 0.91; 1 trial, 1134 women, low‐certainty evidence). There were no cases of hypercalcaemia (1 trial, 1134 women, low‐certainty evidence), and we are very uncertain as to whether vitamin D increases or decreases the risk of nephritic syndrome (RR 0.17, 95% CI 0.01 to 4.06; 1 trial, 135 women, very low‐certainty evidence). However, given the scarcity of data in general for maternal adverse events, no firm conclusions can be drawn.
Supplementation with vitamin D and calcium versus placebo/no intervention
Nine trials involving 1916 pregnant women were included in this comparison; three trials were assessed as having low risk of bias for allocation and blinding, four trials were assessed as having high risk of bias and two had some components having a low risk, high risk, or unclear risk. Supplementation with vitamin D and calcium during pregnancy probably reduces the risk of pre‐eclampsia (RR 0.50, 95% CI 0.32 to 0.78; 4 trials, 1174 women, moderate‐certainty evidence). The effect of the intervention is uncertain on gestational diabetes (RR 0.33,% CI 0.01 to 7.84; 1 trial, 54 women, very low‐certainty evidence); and low birthweight (less than 2500 g) (RR 0.68, 95% CI 0.10 to 4.55; 2 trials, 110 women, very low‐certainty evidence) compared to women who received placebo or no intervention. Supplementation with vitamin D and calcium during pregnancy may increase the risk of preterm birth < 37 weeks in comparison to women who received placebo or no intervention (RR 1.52, 95% CI 1.01 to 2.28; 5 trials, 942 women, low‐certainty evidence). No trial in this comparison reported on maternal adverse events.
Supplementation with vitamin D + calcium + other vitamins and minerals versus calcium + other vitamins and minerals (but no vitamin D)
One trial in 1300 participants was included in this comparison; it was assessed as having low risk of bias. Pre‐eclampsia was not assessed. Supplementation with vitamin D + other nutrients may make little or no difference in the risk of preterm birth < 37 weeks (RR 1.04, 95% CI 0.68 to 1.59; 1 trial, 1298 women, low‐certainty evidence); or low birthweight (less than 2500 g) (RR 1.12, 95% CI 0.82 to 1.51; 1 trial, 1298 women, low‐certainty evidence). It is unclear whether it makes any difference to the risk of gestational diabetes (RR 0.42, 95% CI 0.10 to 1.73) or maternal adverse events (hypercalcaemia no events; hypercalciuria RR 0.25, 95% CI 0.02 to 3.97; 1 trial, 1298 women,) because the certainty of the evidence for both outcomes was found to be very low.
Authors' conclusions
We included 30 trials (7033 women) across three separate comparisons. Our GRADE assessments ranged from moderate to very low, with downgrading decisions based on limitations in study design, imprecision and indirectness.
Supplementing pregnant women with vitamin D alone probably reduces the risk of pre‐eclampsia, gestational diabetes, low birthweight and may reduce the risk of severe postpartum haemorrhage. It may make little or no difference in the risk of having a preterm birth < 37 weeks' gestation. Supplementing pregnant women with vitamin D and calcium probably reduces the risk of pre‐eclampsia but may increase the risk of preterm births < 37 weeks (these findings warrant further research). Supplementing pregnant women with vitamin D and other nutrients may make little or no difference in the risk of preterm birth < 37 weeks' gestation or low birthweight (less than 2500 g). Additional rigorous high quality and larger randomised trials are required to evaluate the effects of vitamin D supplementation in pregnancy, particularly in relation to the risk of maternal adverse events.
PICOs
一般語訳
妊娠中の女性に対するビタミンD補充
論点
ビタミンD補充が、カルシウムやその他のビタミンおよびミネラルとの併用の有無を問わず、母子にとって有益または有害であるかどうかは不明である。
重要である理由
ビタミンDは、ヒトの健康、特に、骨、筋肉、神経および全般的な細胞機能にとって不可欠である。妊娠中の女性において、血中ビタミンD濃度が低くなると、妊娠合併症の原因となる。妊娠中のビタミンD追加補充は、妊娠合併症を予防する上で必要となる場合がある。
このレビューからわかったこと
これは、2012年に初めて発表され、その後2016年に更新されたレビューの最新版である。 本レビューでは、妊娠中の女性を対象としてビタミンD補充を単独またはその他の微量栄養素との併用で行った場合の効果について、プラセボまたは介入なしと比較し、用量、補充の期間または開始時期、補充の種類(経口または静脈内投与)を問わずに検証した。
どのようなエビデンスが得られたか?
科学的根拠(エビデンス)について検索し(2018年7月)、今回の更新の対象として試験30件(女性7033例)を検出した。
妊娠中の女性3725例を対象とした22試験のエビデンスから、妊娠中のビタミンD単独補充により、プラセボや介入なしと比較して、子癇前症、妊娠糖尿病、低出生体重児のリスクが減少する可能性、また早産のリスクについては、ほとんどあるいは全く差がない可能性が示唆される。ビタミンDによって、重度の分娩後出血など、母体の有害事象のリスクが減少する可能性があるが、この結果は予測外のことであり、1件の試験のみに基づいていることに留意する必要がある。
妊娠女性1916例を対象とした9試験のエビデンスから、ビタミンDとカルシウムの補充により、子癇前症のリスクが減少する可能性があるが、早産のリスクが増加する可能性が示唆される。このわずかな有害性については、出産前ケアとしてカルシウム補充を受けている女性で注意が必要である。
妊娠女性1300例を対象とした1試験のエビデンスから、ビタミンD+その他の栄養素を補充しても、大半の評価項目のリスクにほとんどあるいは全く差がない可能性が示唆される。
母体の有害事象に関するデータは、大半の試験で不足していた。
結果が意味すること
ビタミンDのみを妊娠女性に補充すると、子癇前症、妊娠糖尿病、低出生体重、重度の分娩後出血のリスクが減少する可能性がある。妊娠37週未満の早産のリスクについては、ほとんどあるいは全く差がないと考えられる。ビタミンDとカルシウムを妊娠女性に補充すると、子癇前症のリスクが減少する可能性があるが、37週未満の早産のリスクが増加する可能性がある(これらの結果はさらなる検証が必要である)。ビタミンDとその他の栄養素を妊娠女性に補充しても、早産や低出生体重児(2500 g未満)のリスクにほとんどあるいは全く差がない可能性があり、妊娠糖尿病および母体の有害事象に対する効果は不明である。妊娠中のビタミンD補充の効果、特に母体の有害事象のリスクに関して評価するには、綿密で質が高く、より大規模なランダム化試験がさらに必要である。
Authors' conclusions
Summary of findings
| Vitamin D supplementation compared to placebo/control for pregnancy and neonatal health outcomes | ||||||
| Patient or population: pregnant women and their infants. | ||||||
| Outcomes | Anticipated absolute effects* (95% CI) | Relative effect | № of participants | Certainty of the evidence | Comments | |
| Risk with placebo/control | Risk with vitamin D supplementation | |||||
| Pre‐eclampsia | Study population | RR 0.48 (0.30, 0.79) | 499 | ⊕⊕⊕⊝ | Included trials: Asemi 2013a; Naghshineh 2016; Sablok 2015; Sasan 2017 | |
| 168 per 1000 | 79 per 1000 | |||||
| Gestational diabetes | Study population | RR 0.51 | 446 | ⊕⊕⊕⊝ | Included trials: Asemi 2013a; Sablok 2015; Shahgheibi 2016; Tehrani 2014 | |
| 127 per 1000 | 65 per 1000 | |||||
| Maternal adverse events: severe postpartum haemorrhage | Study population | RR 0.68 | 1134 | ⊕⊕⊝⊝ | Included trial: Harvey 2012 | |
| 158 per 1000 | 106 per 1000 | |||||
| Maternal adverse event: nephritic syndrome | Study population | RR 0.17 (0.01 to 4.06) | 135 (1 RCT) | ⊕⊝⊝⊝ | Included trial: Yu 2008 | |
| 22 per 1000 | 4 per 1000 (0 to 90) | |||||
| Maternal adverse event: hypercalcaemia | Study population | Not estimable | 1134 | ⊕⊕⊝⊝ | Included trial: Harvey 2012 | |
| 0 per 1000 | 0 per 1000 | |||||
| Preterm birth (less than 37 weeks' gestation) | Study population | RR 0.66 (0.34 to 1.30) | 1640 | ⊕⊕⊝⊝ | Included trials: Asemi 2013a; Delvin 1986; Grant 2013; Harvey 2012; Mirghafourvand 2013; Roth 2010; Singh 2015 | |
| 87 per 1000 | 57 per 1000 | |||||
| Low birthweight (less than 2500 g) | Study population | RR 0.55 | 697 | ⊕⊕⊕⊝ | Included trials: Brooke 1980; Bhutta 2011; Marya 1988; Roth 2010; Sablok 2015 | |
| 136 per 1000 | 75 per 1000 | |||||
| *The risk in the intervention group (and its 95% confidence interval) is based on the assumed risk in the comparison group and the relative effect of the intervention (and its 95% CI). | ||||||
| GRADE Working Group grades of evidence | ||||||
| 1 We downgraded (1) level for serious limitations in study design due to one trial being assessed as high risk of bias for several domains and two trials having unclear allocation concealment. 2 We downgraded (1) level for serious limitations in study design due to one trial being assessed as high risk of bias for several domains. 3 We downgraded (2) levels for very serious limitations in study design due to one study being assessed as high risk of other bias because we do not know the impact of the participants who were allowed to continue taking their own multivitamin with 400 IU/d of vitamin D as this was not recorded. 4 We downgraded (1) level for serious limitations in study design due to one study being assessed as high risk of bias for performance and detection bias. 5 We downgraded (2) levels for very serious limitations in imprecision as only one small study, with a small number of events and wide 95% confidence intervals (CI) contributed data. 6 We downgraded (1) level for serious limitations in imprecision due to a single study with zero events contributing data. 7 We downgraded (1) level for serious limitations in study design due to two studies being at unclear risk of selection bias and one study being at high risk of other bias. 8 We downgraded (1) level for serious limitations in imprecision as the 95% confidence interval (CI) was wide and crossed the line of no effect. 9 We downgraded (1) level for serious limitations in study design due to two studies being at unclear risk of selection bias, one study being at high risk of bias for allocation concealment, and three studies being at high risk of attrition bias. | ||||||
| Vitamin D + calcium supplementation compared to placebo/control for pregnancy and neonatal health outcomes | |||||||
| Patient or population: pregnant women and their infants.. | |||||||
| Outcomes | Anticipated absolute effects* (95% CI) | Relative effect | № of participants | Certainty of the evidence | Comments | ||
| Risk with placebo/control | Risk with vitamin D + calcium supplementation | ||||||
| Pre‐eclampsia | Study population | RR 0.50 | 1174 | ⊕⊕⊕⊝ | Included trials: Asemi 2012; Marya 1987; Samimi 2016; Taherian 2002 | ||
| 94 per 1000 | 47 per 1000 | ||||||
| Gestational diabetes | Study population | RR 0.33 | 54 | ⊕⊝⊝⊝ | Included trial: Asemi 2012 | ||
| 37 per 1000 | 12 per 1000 | ||||||
| Maternal adverse events | ‐ | ‐ | ‐ | ‐ | ‐ | No trials reported on this outcome | |
| Preterm birth (less than 37 weeks' gestation) | Study population | RR 1.52 | 942 | ⊕⊕⊝⊝ | Included trials: Asemi 2012; Diogenes 2013, Mirghafourvand 2013, Samimi 2016; Taherian 2002; | ||
| 72 per 1000 | 110 per 1000 | ||||||
| Low birthweight (less than 2500 g) | Study population | RR 0.68 | 110 | ⊕⊝⊝⊝ | Included trials: Diogenes 2013; Samimi 2016 | ||
| 59 per 1000 | 40 per 1000 | ||||||
| *The risk in the intervention group (and its 95% confidence interval) is based on the assumed risk in the comparison group and the relative effect of the intervention (and its 95% CI). | |||||||
| GRADE Working Group grades of evidence | |||||||
| 1 We downgraded (1) level for serious limitations in study design due to one study being at high risk of attrition and selection bias and three studies being at high risk of performance and detection bias. 2 We downgraded (1) level for serious limitations in study design due to one study being at high risk of performance and detection bias. 3 We downgraded (2) levels for very serious limitations in imprecision due to one small study, with a single event and wide 95% confidence intervals (CI) crossing the line of no effect contributing data. 4 We downgraded (1) level for serious limitations in study design due to three studies being at unclear risk of allocation concealment and three studies being at high risk of performance and detection bias. 5 We downgraded (1) level for serious limitations in imprecision due to wide 95% confidence intervals (CI). 6 We downgraded (1) level for serious limitations in study design due to one study being at unclear risk of allocation concealment and one study being at high risk of attrition bias. 7 We downgraded (2) levels for very serious limitations in imprecision due two small studies, with very few events and wide 95% confidence intervals (CI) crossing the line of no effect contributing data. | |||||||
| Vitamin D + calcium + other vitamins and minerals compared to calcium + other vitamins and minerals (but no vitamin D) for pregnancy and neonatal health outcomes | ||||||
| Patient or population: pregnant women and their infants.. | ||||||
| Outcomes | Anticipated absolute effects* (95% CI) | Relative effect | № of participants | Certainty of the evidence | Comments | |
| Risk with calcium + other vitamins and minerals (but no vitamin D) | Risk with vitamin D + calcium + other vitamins and minerals | |||||
| Pre‐eclampsia | Study population | ‐ | (0 trials) | ‐ | No trials reported on this outcome | |
| see comment | see comment | |||||
| Gestational diabetes | Study population | RR 0.42 | 1298 | ⊕⊝⊝⊝ | Included trial: Roth 2013 | |
| 12 per 1000 | 5 per 1000 | |||||
| Maternal adverse event: hypercalcaemia | Study population | ‐ | 1298 | ⊕⊝⊝⊝ | Included trial: Roth 2013 | |
| 23 per 1000 | 64 per 1000 | |||||
| Maternal adverse event: hypercalciuria | Study population | 0.25 (0.02 to 3.97) | 1298 | ⊕⊝⊝⊝ | Included trial: Roth 2013 | |
| 4 per 1000 | 1 per 1000 (0 to 15) | |||||
| Preterm birth (less than 37 weeks' gestation) | Study population | RR 1.04 | 1298 | ⊕⊕⊝⊝ | Included trial: Roth 2013 | |
| 93 per 1000 | 96 per 1000 | |||||
| Low birthweight (less than 2500 g) | Study population | RR 1.12 | 1298 | ⊕⊕⊝⊝ | Included trial: Roth 2013 | |
| 162 per 1000 | 182 per 1000 | |||||
| *The risk in the intervention group (and its 95% confidence interval) is based on the assumed risk in the comparison group and the relative effect of the intervention (and its 95% CI). | ||||||
| GRADE Working Group grades of evidence | ||||||
| 1 We downgraded (2) levels for very serious limitations in imprecision with only one trial, with few events, and wide 95% confidence intervals (CI) crossing the line of no effect contributing data. 2 We downgraded (1) level for serious indirectness as there were multiple nutrient interventions in addition to vitamin D. 2 We downgraded (2) levels for very serious limitations in imprecision with only one trial, with zero events, and wide 95% confidence intervals (CI) crossing the line of no effect contributing data. 3 We downgraded (1) level for serious limitations in imprecision due to only one trial with wide 95% confidence intervals (CI) crossing the line of no effect contributing data. | ||||||
Background
Description of the condition
Vitamin D metabolism
Vitamin D is a fat‐soluble vitamin which comes primarily from exposure to sunlight, and is found naturally only in a few foods, such as fish‐liver oils, fatty fish, mushrooms, egg yolks, and liver (Holick 2007a; Holick 2008). There are two physiologically active forms of vitamin D collectively called calciferol: D2 and D3. Vitamin D2 (also called ergocalciferol) is synthesised by plants while vitamin D3 (also called cholecalciferol) is subcutaneously produced in humans from 7‐dehydrocholecalciferol upon exposure to ultraviolet light B (UVB) radiation (DeLuca 2004). Vitamin D in supplements is found as either vitamin D2 or D3. The latter may be three times more effective than vitamin D2 in raising serum concentrations of vitamin D and maintaining those levels for a longer time particularly during the winter months; also, its metabolites have superior affinity for vitamin D‐binding proteins in plasma (Armas 2004; Logan 2013; McCullough 2007). As vitamin D has a short half‐life, adequate vitamin D intake is necessary in order to ensure sustained circulating levels.
Both D2 and D3 forms share a similar metabolism. They are first hydroxylated in the liver to form 25 hydroxyvitamin D (25(OH)D or calcidiol), and then in the kidney to 1,25 di hydroxyl vitamin D (1,25 (OH)2 D or calcitriol) in response to parathyroid hormone (PTH) levels. Calcitriol is considered an important pre‐hormone with active metabolites that are involved in metabolic processes including bone integrity and calcium homeostasis (Wagner 2008).
The major sites of vitamin D action include the skin, intestine, bone, parathyroid gland, immune system, and pancreas as well as the small intestine and colon in the human fetus (Theodoropoulos 2003). Additionally, vitamin D helps maintain normal levels of glucose in the blood, by binding and activating the vitamin D receptor in the pancreatic beta cells, regulating the release of insulin in response to the level of circulating glucose (Clifton‐Bligh 2008; Maghbooli 2008; Palomer 2008; Xuan 2013). Vitamin D also indirectly affects glucose metabolism via the regulation of calcium homeostasis (Xuan 2013).
There is a unique relationship between vitamin D and calcium. PTH is responsible for raising the calcium concentration in the blood through bone resorption, while calcitriol inhibits PTH and allows an increase of serum calcium concentration from sources other than the bone. In the presence of calcitriol, renal and intestinal calcium and phosphorus absorption is augmented leading to an improved calcium status.
Vitamin D status
Serum calcidiol or 25‐hydroxyvitamin D can be used to assess vitamin D status, as it reflects the sum of the vitamin D produced cutaneously and that obtained from foods and supplements (Jones 2008). This metabolite is difficult to measure, with large variations between methods and among laboratories, even when the same methods are used, which may be explained by differences in sample pretreatment or the solvent extraction system used (Hollis 2004; Lankes 2015).
Recently, the Institute of Medicine (IOM) defined adequate vitamin D status as having serum 25‐hydroxyvitamin D concentrations greater than 50 nmol/L (or 20 ng/mL) in both the general population and pregnant women (IOM 2011). Some investigators propose that concentrations around 80 nmol/L (32 ng/mL) are optimal, since they suppress PTH levels and lead to the greatest calcium absorption and the highest bone mass, reducing the rates of bone loss, falls, and fractures (Dawson‐Hughes 2005; Dawson‐Hughes 2008). It is uncertain whether these higher levels proposed for non pregnant adults are also adequate for pregnant women.
Vitamin D status is affected by factors that regulate its production in the skin (i.e. skin pigmentation, latitude, dressing codes, season, aging, sunscreen use, and air pollution) and by factors affecting its absorption or metabolism (Holick 2007b; Maghbooli 2007). Melanin acts as a filter for ultraviolet (UV) rays hence reducing the production of vitamin D by the skin. Hispanic and black populations in the USA may have a higher melanin content, and thus have reduced vitamin D photosynthesis (endogenous synthesis from exposure to sunlight) (Clemens 1982), explaining the variations in vitamin D concentration among ethnic groups living in the same geographical areas (Brooke 1980; Egan 2008; Ganji 2012; Matsuoka 1991; Nesby‐O'Dell 2002; Rockell 2005). An individual's skin phototype reflects the extent of sun‐burning versus subsequent tanning after an initial moderate sun exposure after a long period of little or no exposure (Gilchrest 2008). Phototypes I and II have rapid vitamin D photosynthesis after a minimal erythematic dose (MED). In contrast, prototype VI has little vitamin photosynthesis following the same MED dose (Clemens 1982). Differences in latitude have also been shown to influence the concentration of vitamin D, and individuals from countries in high and low latitudes have lower vitamin D levels. The importance of UV rays is further shown by the seasonal variation in the concentration of vitamin D between summer and winter, with higher levels during the summer compared with the winter months (Holick 2007b; Levis 2005). Vitamin D metabolism is also affected in obese individuals, as vitamin D is deposited in body fat stores, making it less bioavailable (Arunabh 2003). More recently, this low vitamin D status in obese individuals has been explained by a simple volumetric dilution of vitamin D in the fat mass (Drincic 2012), resulting in a higher prevalence of low levels of 25‐hydroxyvitamin D and these are more prevalent among overweight and obese individuals compared with normal weight individuals (Vilarrasa 2007; Vimaleswaran 2013; Wortsman 2000). In the same context, sedentary activity is also associated with low vitamin D levels as it may be linked with diminished sunlight exposure (Ohta 2009).
Magnitude of vitamin D deficiency
Vitamin D deficiency may be a common health problem worldwide (Bandeira 2006; Palacios 2014; van Schoor 2011). There is a high prevalence of low vitamin D status in infants, children, adolescents, adults and elders worldwide, even in countries with sun exposure all year round (Palacios 2014). The highest reported prevalence has been found in the Middle East, particularly in girls and women, although there is a lack of data in most countries of South America and Africa.
In pregnancy, low concentrations of vitamin D in blood are also common. A review including 17 trials in pregnant and lactating women (two in America, six in Europe, one in Africa, seven in Asia, one in Oceania) (Palacios 2014) found a prevalence of low vitamin D status (defined as concentrations lower than 50 nmol/L) of 33% in the USA and 24% Canadian pregnant women. In Europe, the prevalence of low vitamin D status was 45% in Belgium, 35% in the UK, 44% in the Netherlands, 20% in Spain and 77% in Germany. In addition, prevalence of vitamin D deficiency (defined as concentrations lower than 30 nmol/L) was 12% in Belgium, 4% in England and 23% in the Netherlands. The only study reported in Africa reported a very low prevalence of low vitamin D status (1%) in a sample of 139 pregnant women from Tanzania. In Asia, the prevalence of low vitamin D status in pregnant women was very high: 90% in Turkey, 67% in Iran, 72% in Pakistan, 70% to 83% in Kuwait, 96% in India and 69% in China. Prevalence of vitamin D deficiency was also very high: 50% in Turkey, 45% in Pakistan, 38% to 41% in Kuwait and 60% in India. In Australia, low vitamin D status was found in 48% and vitamin D deficiency was found in 15% of pregnant women.
Most recently, a review including 13 trials from seven countries found prevalence of vitamin D deficiency and insufficiency ranging from 39.4% to 76.5% (van der Pligt 2018). They also reported only vitamin D deficiency and found the highest prevalence among Chinese (100%), Turkish (95.6%), Iranian (89.4%) and Pakistanian (89.0%) women.
Seasonal variation increases the risk of low concentrations of blood vitamin D in pregnancy, with a greater prevalence of lower concentrations of vitamin D in blood during the winter months compared with the summer months (Nicolaidou 2006; O'Riordan 2008). Differences in latitude have also been shown to influence the concentration of vitamin D in a majority of pregnant women (Sloka 2009).
Maternal vitamin D status and health outcomes
Vitamin D status during pregnancy is the most important stage of the lifecycle, as the fetus completely relies on this source during this period for its development. During pregnancy, 1,25‐dihydroxyvitamin D increases early during pregnancy and continues to increase until delivery (Moller 2013). This large increase in 1,25‐dihydroxyvitamin D appears to be dependent on available 25‐dihydroxyvitamin D levels, but independent on calcium metabolism, which is a unique feature of pregnancy that allows such high levels of 1,25‐dihydroxyvitamin D (Pludowski 2013a). Therefore, maintaining high enough levels of 25‐dihydroxyvitamin D are important to sustain the increased levels of 1,25‐dihydroxyvitamin D important during pregnancy. Such levels are still yet to be determined but several trials have shown that maternal vitamin D status is significantly associated with fetal and neonatal vitamin D status (El Koumi 2013; Sachan 2005), and that maternal vitamin D status is associated with health outcomes during pregnancy and neonatal and infant development. These associations will be described below.
Vitamin D status and hypertensive disorders during pregnancy
Maternal vitamin D deficiency in pregnancy has been associated with an increased risk of pre‐eclampsia (new‐onset gestational hypertension and proteinuria after 20 weeks of gestation), a condition associated with an increase in maternal and perinatal morbidity and mortality (Bodnar 2007; Holick 2008; Li 2000b; MacKay 2001; Xiong 1999). A meta‐analysis including eight trials found a significant association between vitamin D deficiency and risk of pre‐eclampsia, which was more evident in those that defined vitamin D deficiency as 25(OH)D 50 nmol/L (20 ng/mL), and in those from the USA (Tabesh 2013). Similarly, another meta‐analysis including 31 trials also found a 78% higher risk of pre‐eclampsia in pregnant women with low vitamin D status (odds ratio (OR) 1.79; 95% confidence interval (CI) 1.25 to 2.58) (Aghajafari 2013). A most recent systematic review including 13 trials from seven countries also found that vitamin D deficiency during pregnancy was associated with pre‐eclampsia in three out of four trials (van der Pligt 2018).
Women with pre‐eclampsia have lower concentrations of 25‐hydroxyvitamin D compared with women with normal blood pressure (Diaz 2002; Frenkel 1991; Halhali 1995; Halhali 2000; Tolaymat 1994). The low levels of urinary calcium (hypocalciuria) in women with pre‐eclampsia may be due to a reduction in the intestinal absorption of calcium impaired by low levels of vitamin D (August 1992; Halhali 1995). Additionally, pre‐eclampsia and low concentrations of blood vitamin D are directly and indirectly associated through biologic mechanisms including immune dysfunction, placental implantation, abnormal angiogenesis, excessive inflammation, and hypertension (Bodnar 2007; Cardus 2006; Evans 2004; Hewison 1992; Li 2002). Vitamin D may influence early placental development and thus, the development of pre‐eclampsia through its role in gene regulation and expression; yet more studies are needed to confirm this.
Vitamin D status and other maternal conditions
Low concentrations of blood vitamin D in early pregnancy has been associated with elevated risk for gestational diabetes mellitus (Farrant 2009; Zhang 2008). A meta‐analysis of 31 observational trials found that low vitamin D levels increased the risk of gestational diabetes in 49% (odds ratio (OR) 1.49; 95% confidence interval (CI) 1.18 to 1.89) (Aghajafari 2013). Similar results were found in another meta‐analysis of 24 observational studies (Wei 2013). Poor control of maternal diabetes in early pregnancy is inversely correlated with low bone mineral content in infants, as is low maternal vitamin D status (Namgunga 2003). Vitamin D deficiency (VDD) may lead to a high bone turnover, bone loss, osteomalacia (softening of the bones) and myopathy (muscle weakness) in the mother in addition to neonatal and infant VDD (El Koumi 2013; Glerup 2000; Lips 2001).
An adequate vitamin D status may also protect against other adverse pregnancy outcomes. For example, maternal vitamin D deficiency has been linked to caesarean section (Merewood 2009; Scholl 2012), but the mechanisms involved are unclear. It has been suggested that vitamin D deficiency during pregnancy may reduce pelvic muscle strength and control (Scholl 2012), but this needs to be confirmed.
Low prenatal and perinatal maternal vitamin D concentrations can affect the function of other tissues, leading to a greater risk of multiple sclerosis, cancer, insulin‐dependent diabetes mellitus, and schizophrenia later in life (McGrath 2001).
Vitamin D status and preterm birth and low birthweight
A potential inverse association between maternal vitamin D status and preterm birth (less than 37 weeks' gestation) has been reported (Dawodu 2011; Morley 2006). Conversely, not all the studies show significant associations between maternal calcidiol levels and any measure of the child's size at birth or during the first months of life (Bodnar 2010; Farrant 2009; Gale 2008; Morley 2006).
A meta‐analysis of 24 observational studies confirmed the association between low vitamin D levels (< 50 nmol/L) and increased risk of preterm birth (OR 1.58; 95% CI 1.08 to 2.31) (Wei 2013). Furthermore, two meta‐analyses also found significant associations between low vitamin D status and small‐for‐gestational age (Theodoratou 2014; Wei 2013). With respect to birthweight, a meta‐analysis including three observational studies found a weak positive association between maternal vitamin D status and birthweight after adjustment for potential confounders (Harvey 2014), but another meta‐analysis including four observational studies did find a significant association between these variables (Theodoratou 2014). A most recent systematic review including 13 studies from seven countries found that vitamin D deficiency during pregnancy was associated with low birthweight in four out of seven studies (van der Pligt 2018).
There is not much information on maternal vitamin D status and low birthweight or preterm birth in children born from HIV‐infected pregnant women (Mehta 2009). Studies have reported a high prevalence of vitamin D deficiency among HIV‐infected pregnant women (Eckard 2013; Mave 2012).
Vitamin D status and postnatal growth
Some observational studies suggest that vitamin D levels during pregnancy influence fetal bone development and children's growth (Bodnar 2010; Brooke 1980; Ioannou 2012; Mahon 2010; Morley 2006). However, there is inconsistent associations between maternal vitamin D status and head circumference, as found in a systematic review of nine observational studies (Harvey 2014). However, a study found that head circumference in children nine years of age was significantly associated with maternal calcidiol levels (Gale 2008). With respect to maternal vitamin D status and infants' bone mass, there are also inconsistent results (Akcakus 2006; Harvey 2014; Javaid 2006; Viljakainen 2010).
It is not clear if maternal vitamin D deficiency leads to neonatal rickets, since rickets is usually identified later in childhood. Early studies indicate a possible risk for neonatal rickets in the offspring of women with osteomalacia, abnormal softening of the bone by deficiency of phosphorus, calcium or vitamin D (Ford 1973). More recent studies have found that vitamin D deficiency (serum levels lower than 25 nmol/L) was identified in 92% of rachitic (having rickets) Arab children and 97% of their mothers compared with 22% of nonrachitic children and 52% of their mothers (Dawodu 2005). A positive correlation was found between maternal and child vitamin D levels.
In addition, analyses using data from pregnant women participating in the Southampton Women's Survey, a prospective longitudinal study, found in fetuses of mothers with low vitamin D status a greater femoral metaphyseal cross‐sectional area and a higher femoral splaying index at 19 and 34 weeks' gestation (Mahon 2010), and a significant association between fetal femur volume and vitamin D status (Ioannou 2012), which has been suggested to be possibly related to early rickets development (Harvey 2014).
Vitamin D status and immune response
Vitamin D has direct effects on both adaptive and innate immune systems (Miller 2010; Walker 2009). In children, vitamin D insufficiency is linked to autoimmune diseases such as type 1 diabetes mellitus, multiple sclerosis, allergies and atopic diseases (Bener 2009; Miller 2010; Pierrot‐Deseilligny 2010). Various studies have also shown that vitamin D deficiency is strongly associated with tuberculosis, pneumonia, and cystic fibrosis (Chocano‐Bedoya 2009; Hall 2010; Nnoaham 2008; Williams 2008), and both prenatal and perinatal vitamin D deprivation might influence early‐life respiratory morbidity as this vitamin is important for lung growth and development (Devereux 2007; Litonjua 2009).
Vitamin D may have positive effects on the immune system by up‐regulating the production of the antimicrobial peptides by macrophages and endothelial cells (Wang 2004), which may inactivate viruses and suppress inflammation (Cantorna 2008), and subsequently reduce the severity of infections.
Vitamin D toxicity
Vitamin D excess leads to hypercalcaemia (calcium levels are 10.5 mg/dL or higher) and hypercalciuria (urinary excretion of calcium exceeds 250 mg/day in women), which is associated with renal and kidney stones (Heaney 2008). Toxicity in adults usually appear at doses of vitamin D higher than 10,000 international units (IU)/day (250 mcg/day), although most of the evidence is based on short‐term exposures (less than six months) (Hathcock 2007; Heaney 2008; IOM 2011; Vieth 1999). Single‐dose supplements providing 7.5 mg (300,000 IU) or more may also be harmful (Roth 2011a).
The potential for vitamin D‐induced teratogeneses (birth defects) and adverse events in the offspring (e.g. growth restriction, delayed ossification, craniofacial hypoplasia) has been suggested by a few studies in rats and rabbits (Ariyuki 1987; Chan 1979; Friedman 1969; Ornoy 1968; Ornoy 1969). However, there are considerable limitations in extrapolating such findings to humans, in whom adverse fetal effects have not reportedly occurred following maternal ingestion of maintenance doses as high as 5 mg (200,000 IU) of vitamin D per day. Overall, animal and human studies show that fetal excess of vitamin D metabolites are unlikely to occur when maternal concentrations are within a normal range (Roth 2011a).
Description of the intervention
The World Health Organization (WHO) currently does not recommend provision of vitamin D supplements during pregnancy as part of routine antenatal care (WHO 2016), mainly due to lack of evidence and only in cases of VDD, which is in alignment with the American Congress of Obstetricians and Gynecologists guidelines (ACOG 2015).
There is ongoing controversy regarding the 25‐hydroxyvitamin D levels that are considered adequate or optimal for overall health. The US Institute of Medicine has determined that concentrations greater than 50 nmol/L or 20 ng/mL are adequate based on the current studies available (IOM 2011), although many investigators consider that optimal levels should be higher (greater than 75 nmol/L or 30 ng/mL) (Dawson‐Hughes 2005; Hollick 2009). Vitamin D recommendations to maintain adequate levels of 25‐hydroxyvitamin D also differ among different organisations. The Recommended Nutrient Intakes (RNI) established by the WHO/Food and Agriculture Organization of the United Nations is 200 IU/day (5 mcg/day) of vitamin D for pregnant women (WHO 2004). The European Food Safety Authority (EFSA) and the Institute of Medicine in the USA recommend 600 IU/day (15 mcg/day) of vitamin D for pregnant women (EFSA 2016; IOM 2011). The Royal College of Obstetricians and Gynaecologists recommend 400 IU/day (10 mcg/day) for all pregnant women (RCOG 2014). For high‐risk women (dark skin, reduced exposure to sunlight, or those who are socially excluded or obese), they recommend at least 1000 IU/day (25 mcg/day). In addition, for women at high risk of pre‐eclampsia, they recommend at least 800 IU/day (20 mcg/day), combined with calcium. An expert panel in Central Europe recommended 1500 to 2000 IU/day (37.5 to 50.0 mcg/day) (Pludowski 2013b).
Recommendations on use of vitamin D supplements during pregnancy also vary, ranging from 200 to 400 IU/day (5 to 10 mcg/day) (Canadian Paediatric Society 2007; UK Department of Health 2009). The American Academy of Pediatrics (Wagner 2008) suggests that healthcare professionals who provide obstetric care should consider monitoring maternal vitamin D status by measuring its concentrations in pregnant women. Different investigators have suggested that a supplemental dose of vitamin D of 1000 to 1600 IU (25 to 40 mcg/day) might be necessary to achieve the optimal level of this vitamin in the body (Dawson‐Hughes 2005). This dose is expected to raise serum 25‐hydroxyvitamin D by 1.2 nmol/L for every mcg (40 IU) of vitamin D3 given orally to individuals with low 25‐hydroxyvitamin D levels; those with higher baseline concentrations would have smaller increments with the same dose (Dawson‐Hughes 2005). Others have suggested that doses around 1000 IU/day may be needed in order for pregnant women to maintain a blood concentration of vitamin D of more than 50 nmol/L (20 ng/mL) (Heaney 2003; Hollis 2004; Hollis 2007; Vieth 2001). Higher doses have also been suggested, such as weekly doses of 5000 IU (125 mcg/week) (Utiger 1998) or a single dose of 200,000 IU (5 mg) or greater (Mallet 1986; Sahu 2009; Yu 2009).
Since vitamin D can also be synthesised by the skin upon exposure to sunlight, increasing casual sun exposure for reaching the optimal serum levels has been recommended (Holick 2002). However, as excessive UV radiation is a carcinogen, it might be worth obtaining additional vitamin D from foods or supplements.
How the intervention might work
Vitamin D supplementation has shown to improve maternal vitamin D status during pregnancy in some studies (Delvin 1986; Yu 2009), which in turn may have a direct influence on the fetal and neonatal supply of vitamin D (Brooke 1980). The potential effect of gestational vitamin D supplementation in preventing preterm birth (less than 37 weeks' gestation) and low birthweight (less than 2500 g) has been suggested (Maxwell 1981), although there is limited information on the additional benefit of vitamin D supplementation over other nutritional interventions during pregnancy such as iron and folic acid supplementation on the risk of low birthweight (Christian 2003). There is also a potential effect of maternal vitamin D supplementation on neonatal growth (Marya 1988). Vitamin D supplementation during pregnancy may be necessary to ensure adequate concentrations of vitamin D in breast milk during lactation (Butte 2002). However, it is important to note that the benefits may be seen if supplementation starts early in pregnancy, as there is evidence to suggests that vitamin D status early pregnancy is an important determinant of maternal and neonatal health outcomes (Karras 2018).
Why it is important to do this review
Currently, most countries do not include vitamin D supplementation as part of their routine antenatal care. As stated by the Working Group convened by the Sackler Institute for Nutrition Science at the New York Academy of Sciences and the Bill & Melinda Gates Foundation (in co‐ordination with a scientific organising committee to assess the global prevalence and disease burden of vitamin D deficiency), vitamin D affects pregnancy and birth outcomes but evidence is conflicting (Roth 2018).
This review updates the previous Cochrane Review on vitamin D supplementation in pregnancy (De‐Regil 2016). The 2016 review included 15 trials (2833 women) and concluded that supplementing pregnant women with vitamin D may reduce the risk of pre‐eclampsia, low birthweight and preterm birth. However, when vitamin D and calcium were combined, it may increase the risk of preterm birth. The present review incorporates new evidence from trials testing the effects and safety of vitamin D supplementation in pregnancy for the well‐being of the mother and her newborn. Results from this review could contribute to establish practice guidelines at the population level.
Information on the most effective and safe dosage, the optimal dosing regimen (daily, intermittent or single doses), the timing of initiation of vitamin D supplementation, and the effect of vitamin D when combined with other vitamins and minerals are also needed to inform policy‐making. In fact, we are conducting another systematic review comparing between doses of vitamin D and its effects on pregnancy and infant outcomes (Palacios 2018).
Objectives
To examine whether vitamin D supplementation alone or in combination with calcium or other vitamins and minerals given to women during pregnancy can safely improve maternal and neonatal outcomes.
Methods
Criteria for considering studies for this review
Types of studies
We intended to include randomised and quasi‐randomised trials with randomisation at either individual or cluster level, but we only found randomised controlled trials with individual randomisation. We did not include cross‐over trials or any other observational designs (e.g. cohort or case‐control studies) in this meta‐analysis, but we considered such evidence in the discussion, where relevant. Abstracts were included if they had enough information to extract the data.
Types of participants
Pregnant women of any gestational or chronological age, parity (number of births) and number of fetuses, living in any country. Pregnant women with pre‐existing conditions were excluded.
Types of interventions
Vitamin D supplementation during pregnancy irrespective of dose, duration or time of commencement of supplementation or type of supplementation (oral or by injection). We included trials testing vitamin D alone or in combination with other micronutrients as long as the intervention and the control group were treated similarly. Specifically, we assessed the following comparisons.
-
Supplementation with vitamin D alone versus placebo or no intervention (no vitamins or minerals)
-
Supplementation with vitamin D + calcium versus placebo or no intervention (no vitamin or minerals)
-
Supplementation with vitamin D + calcium + other vitamins and minerals versus calcium + other vitamins and minerals supplementation (but no vitamin D)
-
Supplementation with vitamin D + calcium versus calcium supplementation (but no vitamin D)
-
Supplementation with vitamin D + calcium + other vitamins and minerals versus other vitamins and minerals supplementation (but no vitamin D + calcium)
Types of outcome measures
Maternal antenatal clinical and laboratory outcomes and infant clinical and laboratory outcomes as described below.
Primary outcomes
Maternal
-
Pre‐eclampsia (as defined by trialists).
-
Gestational diabetes (as defined by trialists).
-
Adverse events (e.g. hypercalcaemia, kidney stones).
Infant
-
Preterm birth (less than 37 weeks' gestation).
-
Low birthweight (less than 2500 g).
Secondary outcomes
Maternal
-
Impaired glucose tolerance (as defined by trialists).
-
Caesarean section.
-
Gestational hypertension (as defined by trialists).
-
Maternal death (death while pregnant or within 42 days of termination of pregnancy).
-
Vitamin D concentration at term (25‐hydroxyvitamin D in nmol/L).
Infant
-
Birth length (cm).
-
Head circumference at birth (cm).
-
Birthweight (g).
-
Admission to special care (including intensive care) during the neonatal period (within 28 days after delivery).
-
Stillbirth (as defined by trialists).
-
Neonatal death (within 28 days after delivery).
-
Apgar score less than seven at five minutes.
-
Neonatal infection (e.g. respiratory infections within 28 days after delivery).
-
Very preterm birth (less than 32 weeks' gestation).
Search methods for identification of studies
The following search methods section of this review is based on a standard template used by Cochrane Pregnancy and Childbirth.
Electronic searches
For this update, we searched Cochrane Pregnancy and Childbirth’s Trials Register by contacting their Information Specialist (12 July 2018).
The Register is a database containing over 25,000 reports of controlled trials in the field of pregnancy and childbirth. It represents over 30 years of searching. For full current search methods used to populate Pregnancy and Childbirth’s Trials Register including the detailed search strategies for CENTRAL, MEDLINE, Embase and CINAHL; the list of handsearched journals and conference proceedings, and the list of journals reviewed via the current awareness service, please follow this link.
Briefly, Cochrane Pregnancy and Childbirth’s Trials Register is maintained by their Information Specialist and contains trials identified from:
-
monthly searches of the Cochrane Central Register of Controlled Trials (CENTRAL);
-
weekly searches of MEDLINE (Ovid);
-
weekly searches of Embase (Ovid);
-
monthly searches of CINAHL (EBSCO);
-
handsearches of 30 journals and the proceedings of major conferences;
-
weekly current awareness alerts for a further 44 journals plus monthly BioMed Central email alerts.
Search results are screened by two people and the full text of all relevant trial reports identified through the searching activities described above is reviewed. Based on the intervention described, each trial report is assigned a number that corresponds to a specific Pregnancy and Childbirth review topic (or topics), and is then added to the Register. The Information Specialist searches the Register for each review using this topic number rather than keywords. This results in a more specific search set that has been fully accounted for in the relevant review sections (Included studies; Excluded studies; Studies awaiting classification; Ongoing studies).
We also searched the registries at ClinicalTrials.gov and WHO‐hosted International Clinical Trials Registry Platform (ICTRP) for any ongoing or planned trials (12 July 2018) (see:Appendix 1).
Searching other resources
For the identification of ongoing and unpublished studies, we contacted on different institutions including the WHO Departments of Reproductive Health and Research and Nutrition for Health and Development, the WHO regional offices, the United Nations Children's Fund (UNICEF), Nutrition International (NI), the Global Alliance for Improved Nutrition (GAIN) and the US Centers for Disease Control and Prevention (CDC) (15 May 2018)
We did not apply any date or language restrictions.
Data collection and analysis
For methods used in the previous version of this review, seeDe‐Regil 2016.
For this update, the following methods were used for assessing the reports that were identified as a result of the updated search.
The following methods section of this review is based on a standard template used by Cochrane Pregnancy and Childbirth.
Selection of studies
Two review authors (LK, CP) independently assessed for inclusion all the references identified through the search. All the papers were assessed in duplicate and we resolved any disagreements through discussion or, if required, we consulted the third review author (JP).
If studies were published only as abstracts, or study reports contained little information on methods, we attempted to contact the authors to obtain further details of study design and results. We were able to screen all the potentially eligible studies.
Data extraction and management
We designed a form to extract data. For included studies, all review authors extracted the data using the agreed form. CP entered data into Review Manager software (RevMan 2014), and JP and LK checked for accuracy.
We analysed dichotomous data in terms of average risk ratio and we analysed continuous data in terms of mean difference. There was no need to use the standard mean difference as trials did not report outcomes in different scales.
Assessment of risk of bias in included studies
Two review authors (CP, LK) independently assessed risk of bias for each study using the criteria outlined in the Cochrane Handbook for Systematic Reviews of Interventions (Higgins 2011). We resolved any disagreement by discussion and consulted the third author (JP).
(1) Random sequence generation (checking for possible selection bias)
We described for each included study the method used to generate the allocation sequence in sufficient detail to allow an assessment of whether it should produce comparable groups.
We assessed the method as:
-
low risk of bias (any truly random process, e.g. random number table; computer random number generator);
-
high risk of bias (any non‐random process, e.g. odd or even date of birth; hospital or clinic record number);
-
unclear risk of bias.
(2) Allocation concealment (checking for possible selection bias)
We described for each included study the method used to conceal the allocation sequence and assessed whether intervention allocation could have been foreseen in advance of, or during recruitment, or changed after assignment.
We assessed the methods as:
-
low risk of bias (e.g. telephone or central randomisation; consecutively numbered sealed opaque envelopes);
-
high risk of bias (open random allocation; unsealed or non‐opaque envelopes);
-
unclear.
(3.1) Blinding of participants and personnel (checking for possible performance bias)
We described for each included study the methods used, if any, to blind study participants and personnel from knowledge of which intervention a participant received. We considered that studies were at low risk of bias if they were blinded, or if we judged that the lack of blinding unlikely to affect results. We assessed blinding separately for different outcomes or classes of outcomes.
We assessed the methods as:
-
low, high or unclear risk of bias for participants;
-
low, high or unclear risk of bias for personnel.
We classified blinding as 'high risk of bias' if the blinding status of a trial was unclear or the trial was open.
(3.2) Blinding of outcome assessment (checking for possible detection bias)
We described for each included study the methods used, if any, to blind outcome assessors from knowledge of which intervention a participant received. We assessed blinding separately for different outcomes or classes of outcomes.
We assessed methods used to blind outcome assessment as:
-
low risk of bias;
-
high risk of bias;
-
unclear.
(4) Incomplete outcome data (checking for possible attrition bias through withdrawals, dropouts, protocol deviations)
We assessed losses to follow‐up and post‐randomisation exclusions systematically for each trial.
We described for each included study, and for each outcome or class of outcomes, the completeness of data including attrition and exclusions from the analysis. We noted whether attrition and exclusions were reported, the numbers included in the analysis at each stage (compared with the total randomised participants), reasons for attrition or exclusion where reported, and whether missing data were balanced across groups or were related to outcomes. We assessed methods as:
-
low risk of bias;
-
high risk of bias;
-
unclear.
We considered follow‐up to be 'low risk of bias' if more than 80% of participants initially randomised in a trial were included in the analysis and any loss was balanced across groups, unclear if the percentage of initially randomised participants included in the analysis was unclear, and 'high risk of bias' if less than 80% of those initially randomised were included in the analysis or if loss was imbalanced in different treatment groups.
(5) Selective reporting (checking for reporting bias)
We described for each included study how we investigated the possibility of selective outcome reporting bias and what we found.
We assessed the methods as:
-
low risk of bias (where it is clear that all of the study’s pre‐specified outcomes and all expected outcomes of interest to the review have been reported);
-
high risk of bias (where not all the study’s pre‐specified outcomes have been reported; one or more reported primary outcomes were not pre‐specified; outcomes of interest are reported incompletely and so cannot be used; study fails to include results of a key outcome that would have been expected to have been reported);
-
unclear risk of bias.
(6) Other sources of bias
We assessed whether each study was free of other problems that could put it at risk of bias: We noted for each included study any important concerns we had about other possible sources of bias:
-
low risk of further bias;
-
high risk of further bias;
-
unclear whether there is a risk of further bias.
(7) Overall risk of bias
We summarised the risk of bias at two levels: within studies (across domains) and across studies.
For the first, we made explicit judgements about whether studies were at high risk of bias, according to the criteria given in the Cochrane Handbook for Systematic Reviews of Interventions (Higgins 2011) and for primary outcomes, we explored the impact of the level of bias through undertaking a Sensitivity analysis.
Assessment of the certainty of the evidence using the GRADE approach
For the assessment across studies, the main findings of the review are set out in the summary of findings Table for the main comparison; summary of findings Table 2 and summary of findings Table 3, prepared using GRADE profiler (GRADEpro) Guideline Development Tool (GRADEpro 2015). The primary outcomes for each comparison are listed with estimates of relative effects along with the number of participants and studies contributing data for those outcomes, where available. For each outcome, two review authors independently assessed the certainty of the evidence using the Grading of Recommendations Assessment, Development and Evaluation (GRADE) Handbook (GRADE Handbook), which involves consideration of within‐study risk of bias (methodological quality), directness of evidence, heterogeneity, precision of effect estimates and risk of publication bias; this results in one out of four levels of certainty (high, moderate, low or very low). This assessment was limited only to the trials included in this review.
Measures of treatment effect
Dichotomous data
For dichotomous data, we present results as average risk ratio with 95% confidence intervals.
Continuous data
For continuous data, we used the mean difference as the outcomes were measured in the same way between trials; there was no need to use the standardised mean difference to combine trials.
Unit of analysis issues
Cluster‐randomised trials
We planned to include cluster‐randomised trials in the analyses along with individually‐randomised trials, but we did not find eligible studies with this design. We planned to adjust the standard errors of the results from cluster‐randomised studies using the methods described in the Cochrane Handbook for Systematic Reviews of Interventions (Higgins 2011), if sufficient information was available to allow for this. We planned to use an estimate of the intra cluster correlation co‐efficient (ICC) derived from the trial (if possible), or from another source. If ICCs from other sources were used, we planned to report this and to conduct sensitivity analyses to investigate the effect of variation in the ICC.
If we had identified both cluster‐randomised trials and individually‐randomised trials, we would have combined the results from both if there was little heterogeneity between the study designs and the interaction between the effect of intervention and the choice of randomisation unit would be considered as unlikely.
Studies with more than two treatment groups
For studies with more than two intervention groups (multi‐arm studies), we combined groups to create a single pair‐wise comparison (Higgins 2011) and included the disaggregated data in the corresponding subgroup category. When the control group was shared by two or more study arms, we divided the control group (events and total population) over the number of relevant subgroup categories to avoid double counting the participants. The details are described in the Characteristics of included studies tables.
Cross‐over trials
We did not consider cross‐over trials eligible for inclusion.
Dealing with missing data
For included studies, we noted levels of attrition. We explored the impact of including studies with high levels of missing data in the overall assessment of treatment effect by using sensitivity analysis.
For all outcomes, we carried out analyses, as far as possible, on an intention‐to‐treat basis, i.e. we attempted to include all participants randomised to each group in the analyses, and analysed all participants in the group to which they were allocated, regardless of whether or not they received the allocated intervention. The denominator for each outcome in each trial was the number randomised minus any participants whose outcomes are known to be missing.
Assessment of heterogeneity
We assessed statistical heterogeneity in each meta‐analysis using the Tau², I² and Chi² statistics. We regarded heterogeneity as substantial if an I² was greater than 30% and either the Tau² was greater than zero, or there was a low P value (less than 0.10) in the Chi² test for heterogeneity.
Assessment of reporting biases
We investigated reporting biases (such as publication bias) by using funnel plots for the primary outcomes with 10 or more studies. We assessed funnel plot asymmetry visually.
Data synthesis
We carried out statistical analysis using the Review Manager software (RevMan 2014). We intended to use fixed‐effect meta‐analysis for combining data where it would be reasonable to assume that studies were estimating the same underlying treatment effect: i.e. where trials were examining the same intervention, and the trials’ populations and methods were judged sufficiently similar.
Since we detected substantial heterogeneity, we used random‐effects meta‐analysis to produce an overall summary of an average treatment effect across trials. We treated the random‐effects summary as the average range of possible treatment effects and we discussed the clinical implications of treatment effects differing between trials. If the average treatment effect was not clinically meaningful, we did not combine trials.
As we used random‐effects analyses, we present the results as the average treatment effect with its 95% confidence interval, and the estimates of Tau² and I².
Subgroup analysis and investigation of heterogeneity
We planned to investigate any substantial heterogeneity on the primary outcomes by using subgroup analyses as follows:
-
by start of supplementation: less than 20 weeks versus 20 weeks of pregnancy or more versus unknown/mixed;
-
by pre‐gestational body mass index (BMI) (kg/m2): underweight (lower than 18.5) versus normal weight (18.5 to 24.9) versus overweight (25 or higher) versus unknown/mixed;
-
by supplementation scheme/regimen: single versus daily versus weekly versus unknown/mixed;
-
by skin pigmentation based on Fitzpatrick skin tone chart (Fitzpatrick 1988): three or less versus four or more versus mixed/unknown;
-
by latitude: between the Tropics of Cancer and Capricorn versus north of the Tropic of Cancer or south of the Tropic of Capricorn versus unknown/mixed;
-
by season at the start of pregnancy: summer versus winter versus mixed/unknown/unreported.
Pragmatically, we decided not to conduct subgroup analyses in those outcomes with three or less trials.
We assessed subgroup differences by interaction tests available within RevMan (RevMan 2014). We reported the results of subgroup analyses quoting the Chi² statistic and P value, and the interaction test I² value.
Sensitivity analysis
We intended to conducted a sensitivity analysis based on the quality of the studies, however, as only one study was considered of high quality we did not perform this analysis. We considered a study to be of high quality if it was assessed as having low risk of bias in both the randomisation and allocation concealment and additionally a low risk of bias in either blinding or losses to follow‐up. In future updates, we will carry out sensitivity analysis to investigate the effect of the randomisation unit (if appropriate).
Results
Description of studies
Results of the search
We received a total of 111 new reports (after removing duplicates) from the search of Cochrane Pregnancy and Childbirth’s Trials Register, 13 reports from our additional search and we also reassessed the 23 ongoing trials (26 reports) and 27 excluded trials (46 reports) from the previous version of the review (De‐Regil 2016). See: Figure 1.

Study flow diagram for this update
A total of 30 trials were included in this update. Fifteen were already included in the previous update (Asemi 2012; Asemi 2013a; Brooke 1980; Delvin 1986; Diogenes 2013; Grant 2013; Li 2000a; Mallet 1986; Marya 1987; Marya 1988; Mazurkevich 2013; Roth 2010; Sablok 2015; Taherian 2002; Yu 2008). We identified nine new trials through our updated search (Kaur 1991, Naghshineh 2016; Sabet 2012; Samimi 2016; Samimi 2017; Sasan 2017; Shahgheibi 2016; Singh 2015; Vaziri 2016) and included six additional trials that were categorised as ongoing in the previous update (Benson 2009; Bhutta 2011; Harvey 2012; Mirghafourvand 2013; Roth 2013; Tehrani 2014).
We identified another study (Qian 2015) that raised concerns with the veracity of the information as there were several outcomes with the same results to another published study (Karamali 2015). We followed the guidelines from the Committee on Publication Ethics (COPE) to investigate the issue with the editors of both journals (Cope 2016) and the publication (Qian 2015) was retracted by the editors on 20 August 2018. Therefore, this trial was moved to excluded.
We excluded a total of 60 trials (125 reports). We identified six ongoing or unpublished trials (Baird 2016; Jelsma 2013; Judkins 2010; Lindqvist 2010; Mosalanejad 2016; Rasmussen 2009). There are two trials awaiting classification as they were available only in the abstract form with not enough information for data extraction (Bimson 2017; Das 2009).
Details of these trials are provided in: Characteristics of included studies; Characteristics of excluded studies; Studies awaiting classification tables.
Included studies
We included 30 trials (involving 7033 women and their infants) in this updated review (Asemi 2012; Asemi 2013a; Benson 2009; Bhutta 2011; Brooke 1980; Delvin 1986; Diogenes 2013; Grant 2013; Harvey 2012; Kaur 1991; Li 2000a; Mallet 1986; Marya 1987; Marya 1988; Mazurkevich 2013; Mirghafourvand 2013; Naghshineh 2016; Roth 2010; Roth 2013; Sabet 2012; Sablok 2015; Samimi 2016; Samimi 2017; Sasan 2017; Shahgheibi 2016; Singh 2015; Taherian 2002; Tehrani 2014; Vaziri 2016; Yu 2008). Details of these trials are provided in: Characteristics of included studies table.
Settings
The trials included in this review were carried from 1980s to 2015.
Trials were conducted in Australia (Benson 2009), Bangladesh (Roth 2010; Roth 2013), Brazil (Diogenes 2013), China (Li 2000a), France (Delvin 1986; Mallet 1986), India (Kaur 1991;Marya 1987; Marya 1988; Sablok 2015; Singh 2015), Iran (Asemi 2012; Asemi 2013a; Mirghafourvand 2013; Naghshineh 2016; Sabet 2012; Samimi 2016; Samimi 2017; Sasan 2017; Shahgheibi 2016; Taherian 2002; Tehrani 2014; Vaziri 2016), New Zealand (Grant 2013), Pakistan (Bhutta 2011), Russia (Mazurkevich 2013) and the UK (Brooke 1980; Harvey 2012; Yu 2008).
Latitude
Most trials were conducted either above or below the Tropics of Cancer and Capricorn (Asemi 2012; Asemi 2013a; Brooke 1980; Delvin 1986; Kaur 1991; Li 2000a; Mallet 1986; Marya 1987; Marya 1988; Mazurkevich 2013; Mirghafourvand 2013, Naghshineh 2016; Roth 2010; Roth 2013; Sablok 2015; Taherian 2002; Yu 2008; Sabet 2012; Samimi 2016; Samimi 2017; Sasan 2017; Shahgheibi 2016; Vaziri 2016; Benson 2009; Bhutta 2011; Tehrani 2014; Harvey 2012). Only two trials were conducted between the Tropics of Cancer and Capricorn (Grant 2013; Singh 2015), and one study was conducted just were the tropic of Capricorn lies (Diogenes 2013).
Seasonality
The seasons varied among trials with some trials occurring during the winter‐spring period (Delvin 1986); winter (Mallet 1986; Naghshineh 2016; Tehrani 2014); summer (Roth 2010; Yu 2008); spring‐summer period (Asemi 2013a), fall (Samimi 2016; Vaziri 2016), unknown/unreported in 13 trials (Asemi 2012; Benson 2009; Bhutta 2011; Kaur 1991; Li 2000a; Marya 1987; Marya 1988; Mazurkevich 2013; Sabet 2012; Sasan 2017; Shahgheibi 2016; Singh 2015; Taherian 2002) or mixed (Brooke 1980; Diogenes 2013; Grant 2013; Harvey 2012; Mirghafourvand 2013; Roth 2013; Sablok 2015; Samimi 2017).
Participants
The sample size from all the trials ranged between 40 women (Delvin 1986) and 1560 women (Roth 2013).
Pre‐gestational body‐mass index (kg/m2)
Pre‐gestational body mass index (BMI) of the participants was reported only in five trials (Asemi 2012; Asemi 2013a; Diogenes 2013; Sablok 2015; Taherian 2002). The rest of the trials did not report this. One study stratified for pre intervention BMI (in kg/m2; less than 30 and 30 or more) before randomisation (Asemi 2013a).
Skin pigmentation based on Fitzpatrick skin tone chart
None of the trials used the Fitzpatrick skin tone chart (Fitzpatrick 1988); however, several trials reported the ethnicity/race of participants. Most trials were among women from the Middle East (Asemi 2012; Asemi 2013a; Brooke 1980; Bhutta 2011; Tehrani 2014; Mirghafourvand 2013; Naghshineh 2016; Sabet 2012; Samimi 2016; Samimi 2017; Sasan 2017; Shahgheibi 2016; Taherian 2002; Vaziri 2016) or Asia (Kaur 1991; Li 2000a; Marya 1987; Marya 1988; Roth 2010; Roth 2013; Sablok 2015; Singh 2015). Two trials reported that participants were from mixed ethnicity (Benson 2009; Yu 2008), two trials were on whites (Harvey 2012; Mallet 1986), one among white women or black women (Diogenes 2013), and another among Pacific, European and Maori women (Grant 2013). Two trials did not report the characteristics of the participants in terms of ethnicity or origin (Delvin 1986; Mazurkevich 2013).
Interventions
A total of 22 trials compared provision of vitamin D supplement in comparison with placebo or no intervention (Comparison 1: Asemi 2013a; Benson 2009; Bhutta 2011; Brooke 1980; Delvin 1986; Grant 2013; Harvey 2012; Kaur 1991; Mallet 1986; Marya 1988; Mirghafourvand 2013; Naghshineh 2016; Roth 2010; Sabet 2012; Sablok 2015; Samimi 2017; Sasan 2017; Shahgheibi 2016; Singh 2015; Tehrani 2014; Vaziri 2016; Yu 2008).
A total of nine trials compared provision of oral vitamin D plus calcium supplements versus no intervention or placebo (Comparison 2: Asemi 2012; Asemi 2013a; Diogenes 2013; Li 2000a; Marya 1987; Mazurkevich 2013; Mirghafourvand 2013; Samimi 2016; Taherian 2002). The study by Mirghafourvand 2013 was included in both comparisons as they compared both vitamin D alone and vitamin D plus calcium with placebo.
Only one trial compared oral vitamin D plus calcium, iron and folic acid versus calcium, iron and folic acid but no vitamin D (Comparison 4: Roth 2013).
No trials evaluated the effects of either oral vitamin D plus calcium supplements versus calcium (Comparison 3), nor oral vitamin D + calcium + other vitamins and minerals supplements versus other oral vitamins and minerals supplements (but no vitamin D + calcium) (Comparison 5).
Start of supplementation
A total of seven trials started supplementation before week 20 (Benson 2009; Bhutta 2011; Harvey 2012; Naghshineh 2016; Samimi 2017; Singh 2015; Tehrani 2014). The rest of the trials started supplementation at 20 or more weeks' gestation (Asemi 2012; Asemi 2013a; Brooke 1980; Delvin 1986; Diogenes 2013; Grant 2013; Kaur 1991; Li 2000a; Mallet 1986; Marya 1987; Marya 1988; Mazurkevich 2013; Mirghafourvand 2013; Roth 2010; Roth 2013; Sabet 2012; Sablok 2015; Samimi 2016; Sasan 2017; Shahgheibi 2016; Taherian 2002; Vaziri 2016; Yu 2008).
Dose of vitamin D used
The dose of vitamin D provided varied in the included trials as well as the regimen.
Trials differed in the frequency of supplementation, with some trials using daily doses, weekly doses, monthly doses or single doses. Some trials had more than one group of vitamin D intervention.
For daily, weekly and monthly dosage, we calculated the total amount in international units (IU) per day. The daily doses used were 200 IU vitamin D in five trials (Asemi 2012; Diogenes 2013; Li 2000a; Mazurkevich 2013; Taherian 2002); 400 IU vitamin D in three trials (Asemi 2013a; Li 2000a; Samimi 2017); 600 IU vitamin D in two trials (Naghshineh 2016; Roth 2013); 800 IU vitamin D in another trial (Yu 2008); 1000 IU vitamin D in six trials (Brooke 1980; Delvin 1986; Grant 2013; Harvey 2012; Mirghafourvand 2013; Mallet 1986); 1200 IU vitamin D in two trials (Kaur 1991; Marya 1987); 2000 IU vitamin D in three trials (Grant 2013; Singh 2015; Vaziri 2016); 2400 IU vitamin D in one trial (Roth 2013); 3333 to 3500 IU vitamin D in five trials (Sabet 2012; Samimi 2016; Sasan 2017; Tehrani 2014); 4000 IU vitamin D in two trials (Bhutta 2011; Roth 2013), and 5000 IU vitamin D in one trial (Shahgheibi 2016). One study started supplementation at 2000 IU per day and if 25(ODH)‐D levels were below 75 nmol/L by week 28 of pregnancy, the dose was doubled to 4000 IU per day (Benson 2009). One study also provided to both groups a gel with 400 mg/day of vaginal progesterone (Samimi 2017). The study by Roth 2013 gave three different doses during pregnancy as mentioned above: 4200 IU per week or 600 IU/day; 16,800 IU per week or 2400 IU/day; 28,000 IU per week or 4000 IU/day. We combined the data from these groups, and on average, this group received 16,333 IU per week or 2333 IU/day.
For single‐dose supplementation of vitamin D, the dose varied from 200,000 IU vitamin D in a group in one study (Yu 2008); 600,000 IU vitamin D in one trial (Marya 1988); and 60,000 IU vitamin D two times (Kaur 1991). There was also one trial that used a monthly dose of 100,000 vitamin D (Sabet 2012); three trials that used a 50,000 dose every two weeks (Tehrani 2014; Samimi 2016; Sasan 2017); and one trial that used a dose of 35,000 IU vitamin D every week (Roth 2010). For the study by Sablok 2015, the dose depended upon the level of serum 25(OH)‐D levels at baseline; it varied from one dose of 60,000 IU (if serum 25(OH)‐D levels were > 50 nmol/L), two doses of 120,000 IU (if serum 25(OH)‐D levels were 25 to 50 nmol/L), or four doses of 120,000 IU (if serum 25(OH)‐D levels < 25 nmol/L).
Overall, the total provision of supplemental vitamin D provided throughout pregnancy varied. Sixteen trials provided 56,000 IU vitamin D or less (Asemi 2012; Asemi 2013a; Benson 2009; Delvin 1986; Diogenes 2013; Grant 2013; Harvey 2012Li 2000a; Mazurkevich 2013; Naghshineh 2016; Roth 2013; Sabet 2012; Samimi 2017; Singh 2015; Taherian 2002; Vaziri 2016); nine trials provided more than 56,000 to 200,000 IU vitamin D (Bhutta 2011;Brooke 1980; Kaur 1991; Mallet 1986; Marya 1987; Mirghafourvand 2013; Roth 2013; Sablok 2015; Yu 2008); and seven trials provided more than 200,000 IU of vitamin D (Marya 1988; Roth 2010; Roth 2013; Sablok 2015; Samimi 2016; Sasan 2017; Tehrani 2014) throughout pregnancy. One study did not specify when the supplementation started, therefore, we were not able to estimate this (Shahgheibi 2016).
Vitamin D form used
The vitamin D was provided in the form of cholecalciferol‐D3 in 20 trials (Asemi 2012; Asemi 2013a; Benson 2009; Delvin 1986; Diogenes 2013; Grant 2013; Harvey 2012; Kaur 1991; Li 2000a; Mazurkevich 2013; Roth 2010; Roth 2013; Sabet 2012; Sablok 2015; Samimi 2016; Samimi 2017; Sasan 2017; Singh 2015; Taherian 2002; Vaziri 2016) and as ergocalciferol‐D2 in three trials (Brooke 1980; Mallet 1986; Yu 2008). Seven trials did not report the vitamin D form used (Bhutta 2011; Marya 1987; Marya 1988; Mirghafourvand 2013; Naghshineh 2016; Shahgheibi 2016; Tehrani 2014).
Doses of calcium in the trials providing vitamin D and calcium supplementation
The doses of calcium provided along with the vitamin D ranged from 300 mg (Mirghafourvand 2013), 375 mg (Marya 1987); 500 mg (Asemi 2012; Asemi 2013a; Roth 2013; Taherian 2002); 600 mg calcium (Diogenes 2013; Li 2000a), 1000 mg (Samimi 2016) and 1250 mg (Mazurkevich 2013). All used calcium carbonate.
Health worker cadre
The trials were mostly carried out in the context of antenatal care and the administration of the supplements and the antenatal care was provided by the researchers themselves or through health allied personnel. The outcomes measurements were carried out by different groups according to the nature of the outcome, whether it was clinical, biochemical, anthropometric, or dietary assessments. A more detailed description of the health worker cadre is presented in Characteristics of included studies.
Laboratory methodology for the assessment of vitamin D status
Different laboratory methods were used to measure vitamin D status as serum 25‐hydroxyvitamin D concentrations. Five trials (Asemi 2012; Asemi 2013a; Sabet 2012; Sablok 2015; Samimi 2016) used immunoassay ELISA kit for their determinations; six trials used a chemiluminescent enzyme‐labelled immunometric assay (Benson 2009; Bhutta 2011; Diogenes 2013; Harvey 2012; Singh 2015; Vaziri 2016); another trial used isotope‐dilution liquid chromatography–tandem mass spectrometry (Grant 2013). Two trials used a competitive protein binding assay (Brooke 1980; Mallet 1986); one trial used a radioligand assay (Delvin 1986); and two trials used the Liebermann‐Burchard method (Sasan 2017; Shahgheibi 2016). Only two trials used high‐performance liquid chromatography tandem mass spectroscopy (LCMS/MS) (Roth 2010; Roth 2013). In two trials, the laboratory method was not reported (Samimi 2017; Yu 2008). The other trials did not report on this outcome (Kaur 1991; Li 2000a; Marya 1987; Marya 1988; Mazurkevich 2013; Mirghafourvand 2013; Naghshineh 2016; Samimi 2016; Tehrani 2014).
Funding sources
Trials were funded mainly by research grants from universities, health institutions and non‐government organisations; sometimes in combination. The Vice‐chancellor for research supported Asemi 2012 and Asemi 2013a. The Luke Proposch Perinatal Research Scholarship from the Australian and New Zealand College of Obstetrics and Gynaecology Research Foundation supported Benson 2009. The Pakistan Initiative for Mothers and Newborns (PAIMAN) supported Bhutta 2011. The pathological research fund, St George's Hospital Medical School, and the South‐west Thames Regional Health Authority funded Brooke 1980. Shriners of North America, the France‐Quebec Exchange Program, and INSERM funded Delvin 1986. The Conselho Nacional de Desenvolvimento Cientıfico e Tecnologico and the Fundacao Carlos Chagas Filho de Amparo a` Pesquisa do Estado do Rio de Janeiro supported Diogenes 2013. The Health Research Council of New Zealand and Cure Kids supported Grant 2013. The Arthritis Research UK, Medical Research Council, Bupa Foundation, and National Institute for Health Research supported Harvey 2012. Tabriz University of Medical Sciences funded Mirghafourvand 2013. Isfahan University of Medical Sciences supported Naghshineh 2016. The Thrasher Research Fund supported Roth 2010 and Bill & Melinda Gates Foundation supported Roth 2013. The Research Institute of Endocrine Sciences and the Shahid Beheshti University of Medical Sciences supported Sabet 2012. Kashan University of Medical Sciences funded both Samimi 2016 and Samimi 2017. Research Deputy of Isfahan University of Medical Sciences supported Taherian 2002. Tehrani 2014 did not report funding. The Research Vice‐chancellor of Shiraz University of Medical Sciences supported Vaziri 2016. The Institute of Obstetrics and Gynaecology Trust and the Wolfson and Weston Research Centre for Family Health supported Yu 2008. Sablok 2015 was self‐funded. For Kaur 1991, Li 2000a, Mallet 1986, Marya 1987, Marya 1988, Mazurkevich 2013, , Sasan 2017, and Singh 2015, funding was unknown/unreported. No trials had funding sources of concern, e.g. vitamin D manufacturers or similar. Shahgheibi 2016 reported that they received no funding.
Declarations of interest
The following trials reported that none of the authors had conflict of interests: Asemi 2013a; Benson 2009; Diogenes 2013; Grant 2013; Mirghafourvand 2013; Roth 2010; Roth 2013; Sabet 2012; Sablok 2015; Samimi 2016; Samimi 2017; Sasan 2017; Shahgheibi 2016; Tehrani 2014; Vaziri 2016.
The following trials did not include the conflict of interest statement in their publication: Asemi 2012; Bhutta 2011; Brooke 1980; Delvin 1986; Kaur 1991; Li 2000a; Mallet 1986; Marya 1987; Marya 1988; Mazurkevich 2013; Naghshineh 2016; Singh 2015; Taherian 2002; Yu 2008.
Only one trial reported conflict of interests: Harvey 2012.
SeeCharacteristics of included studies for a detailed description of the trials, including vitamin D doses used and regimens compared.
Excluded studies
We excluded 60 trials. The main reason for exclusion was that the comparisons were among different doses of vitamin D in 26 trials (Baqui 2009; Bhatia 2012; Bhatia 2010; Bisgaard 2009; Dawodu 2013; de Menibus 1984; Gerais 2015; Hashemipour 2014; Kachhawa 2014; Kiely 2015; Lalooha 2012; March 2010; Marya 1981; McLean 2012; Mojibian 2015; Mutlu 2013; Nausheen 2014; Rostami 2018; Shakiba 2013; Stephensen 2011; Thiele 2014; Wagner 2006a; Wagner 2006b; Wagner 2013; Weiss 2009; Yap 2014), without placebo or no treatment control. Also, three trials were excluded because the treatment groups differed in other nutrients given in the supplements, other than vitamin D (Asemi 2015; Azami 2017; Pandey 2015), and one trial had no group with vitamin D (Atkinson 2010). In addition, four trials were not randomised trials (Ala‐Houhala 1986; Cockburn 1980; Bhatia 2010; Ito 1994). Four trials (Czech‐Kowalska 2013; Niramitmahapanya 2017; Taheri 2014; von Hurst 2009) were conducted on non pregnant women; 12 trials were carried out in pregnant women with glucose intolerance or with gestational diabetes (Asemi 2013b; Asemi 2014; Jamilian 2016; Jamilian 2017; Karamali 2014; Li 2016; Mozzafari 2010; Razavi 2017; Simsek 2011; Valizadeh 2016; Yazdchi 2016; Zhang 2016) or other chronic conditions (Etemadifar 2015; Shi 2017; Sudfeld 2017), one trial was conducted only among postpartum women (Chandy 2016), and one trial was conducted among couples for fertility purposes (Kermack 2017). One reference referred to a trial registered in 1986 on the Oxford Database of Perinatal Trials and reports the recruitment and follow‐up completed in 1979, but there were no reports available and we were unable to locate the author who registered the trial (MacDonald 1986). One trial was excluded because treatment groups differed more than vitamin D supplementation (Hossain 2012). For more detailed descriptions of excluded trials along with the reasons for exclusion, seeCharacteristics of excluded studies.
Risk of bias in included studies
Allocation
Sequence generation
We assessed 21 trials as having adequate methods for generating the randomisation sequence. Ten trials used computer‐generated random number sequences (Asemi 2013a; Diogenes 2013; Grant 2013; Harvey 2012; Naghshineh 2016; Roth 2010; Roth 2013; Sablok 2015; Samimi 2016; Yu 2008), four used permuted block randomisation (Bhutta 2011; Mirghafourvand 2013; Samimi 2017; Vaziri 2016), and seven trials used a random numbers table (Asemi 2012; Benson 2009; Mallet 1986; Sasan 2017; Shahgheibi 2016; Taherian 2002; Tehrani 2014) to randomise the intervention groups. The other trials reported the trials as randomised but the methods used to generate the sequence were not described (Brooke 1980; Delvin 1986; Kaur 1991; Marya 1987; Marya 1988; Mazurkevich 2013; Sabet 2012; Singh 2015). One trial did not mention that participants were randomly allocated to the treatment groups (Li 2000a).
Allocation concealment
We judged that 13 trials had adequate methods of allocation concealment (Asemi 2013a; Asemi 2012; Benson 2009; Bhutta 2011; Grant 2013; Harvey 2012; Roth 2010; Roth 2013; Samimi 2016; Samimi 2017; Shahgheibi 2016; Tehrani 2014; Yu 2008). It is assumed that allocation concealment did not occur in the following trials as one of the groups did not receive any supplementation: Kaur 1991; Li 2000a; Mallet 1986; Marya 1987; Marya 1988; Mazurkevich 2013; Sablok 2015; Singh 2015; Taherian 2002. In Sablok 2015, the intervention dosage depended on the vitamin D status, therefore, there was a selection bias based on status of vitamin D at baseline. In the case of Harvey 2012, participants at 28 weeks had their serum 25‐hydroxyvitamin D measured and if below 75 nmol/L, the dose was doubled to 4000 IU. The others did not report the methods of concealment (Brooke 1980; Delvin 1986; Diogenes 2013; Mirghafourvand 2013; Naghshineh 2016; Sabet 2012; Sasan 2017; Vaziri 2016).
Blinding
Blinding of participants, staff and outcome assessors
Investigators in 15 trials reported that they used a double‐blinded design (Asemi 2013a; Bhutta 2011; Brooke 1980; Grant 2013; Harvey 2012; Mirghafourvand 2013; Naghshineh 2016; Roth 2010; Roth 2013; Sabet 2012; Samimi 2016; Samimi 2017; Sasan 2017; Shahgheibi 2016; Tehrani 2014). However, only 10 trials specified that both participants and those conducting the assessments were blinded (Asemi 2013a; Bhutta 2011; Grant 2013; Harvey 2012; Naghshineh 2016; Roth 2010; Roth 2013; Sasan 2017; Shahgheibi 2016; Tehrani 2014). Two trials were reported as single‐blinded, being blinded for participants only (Asemi 2012; Diogenes 2013). The trial by Vaziri 2016 reported that it was a single‐blinded study; however, depression was assessed by blinded nurse although the rest of the assessments were not clear if they were performed by a blinded staff. The rest of the trials reported being single‐blinded but since one of the groups received no supplementation, it was assumed that it was not blinded to participants but to the assessment team: Benson 2009, Delvin 1986; Kaur 1991; Li 2000a; Mallet 1986; Marya 1987; Marya 1988; Mazurkevich 2013; Sablok 2015; Singh 2015; Taherian 2002; Yu 2008.
Incomplete outcome data
Sixteen trials did not have incomplete data: Asemi 2012; Asemi 2013a; Grant 2013; Harvey 2012; Mirghafourvand 2013; Naghshineh 2016; Roth 2010; Roth 2013; Sabet 2012; Samimi 2016; Samimi 2017; Sasan 2017; Shahgheibi 2016; Taherian 2002; Tehrani 2014; Yu 2008). The others did not report on attrition, missing data and lack of intention‐to‐treat analyses.
Selective reporting
We did not have access to study protocols and therefore, formally assessing reporting bias was not possible. Insufficient trials contributed data to allow us to carry out exploration of possible publication bias by using funnel plots.
Other potential sources of bias
This varied in the different trials. For example, Harvey 2012 reported that participants were allowed to continue taking their own multivitamin but they did not specify who took those supplements and who did not take them during the study. The report from Li 2000a is very short, with most details of the methods not available. The trial by Mallet 1986 had groups with notoriously different sample sizes; it is unclear whether the numbers reflect the participants who finished the trial, a non randomised process, or a selection bias in which randomised participants did not receive the intervention. The trial by Shahgheibi 2016 reported different interventions in the abstract to what was described in methods.
We have also included figures that summarise our ’Risk of bias’ assessments (Figure 2; Figure 3).
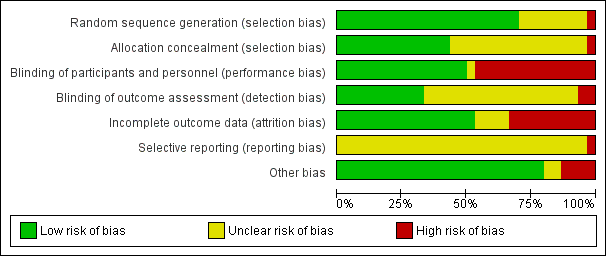
'Risk of bias' graph: review authors' judgements about each risk of bias item presented as percentages across all included studies.
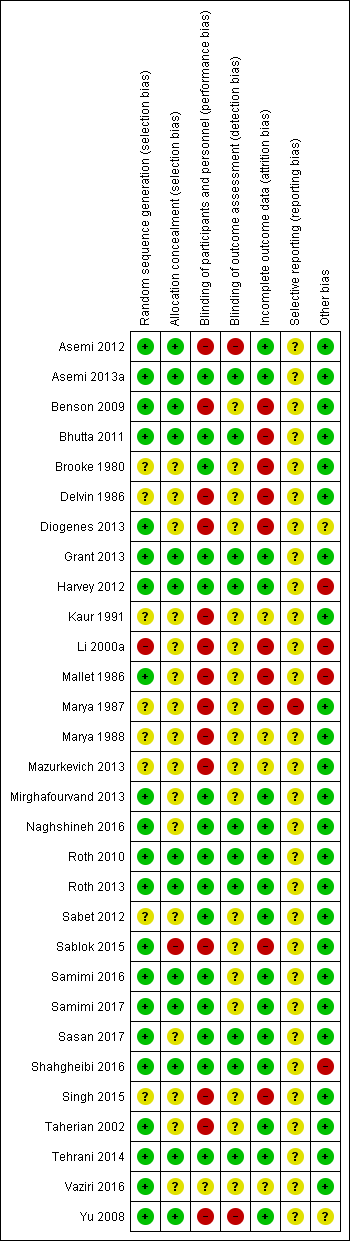
'Risk of bias' summary: review authors' judgements about each risk of bias item for each included study.
Effects of interventions
See: Summary of findings for the main comparison Vitamin D supplementation compared to placebo or no intervention for pregnancy and neonatal health outcomes; Summary of findings 2 Vitamin D + calcium supplementation compared to placebo or no intervention for pregnancy and neonatal health outcomes; Summary of findings 3 Vitamin D + calcium + other vitamins and minerals compared to calcium + other vitamins and minerals (but no vitamin D) for pregnancy and neonatal health outcomes
In this updated review we included 30 trials assessing a total of 7033 women. We organised the summary results by comparison and by primary and secondary outcomes.
In the Data and analyses tables, we set up all four prespecified comparisons but outcome data were only available for two of these. We have not added outcomes to those comparisons without data (Comparisons three and four). For the comparisons with data, we set up tables for all primary outcomes (even where no data were available) not only to highlight gaps in the current research evidence, but also to be able to add any data that may become available in future updates.
SeeData and analyses for detailed results on primary and secondary outcomes.
For each of the comparisons, we have indicated the number of trials contributing data and the total number of women recruited in these trials. However, for some outcomes only one or two trials provided data and due to loss to follow‐up, denominators for particular outcomes may have been considerably less than the randomised sample. Therefore, we have indicated the number of trials contributing data and the number of women included in that analysis.
(1) Supplementation with vitamin D alone versus placebo or no intervention (no vitamins or minerals) (22 trials, 3725 women)
Twenty‐two trials involving 3725 pregnant women were included in this comparison (Asemi 2013a; Benson 2009; Bhutta 2011; Brooke 1980; Delvin 1986; Grant 2013; Harvey 2012; Kaur 1991; Mallet 1986; Marya 1988; Mirghafourvand 2013; Naghshineh 2016; Roth 2010; Sabet 2012; Sablok 2015; Samimi 2017; Sasan 2017; Shahgheibi 2016; Singh 2015; Tehrani 2014; Vaziri 2016; Yu 2008). Two trials contributed to both Comparisons 1 and 2 (Asemi 2013a; Mirghafourvand 2013).
The following trials were assessed as having low risk of bias for allocation and blinding: Asemi 2013a; Bhutta 2011; Grant 2013; Harvey 2012; Mirghafourvand 2013; Naghshineh 2016; Roth 2010; Samimi 2017; Shahgheibi 2016; Tehrani 2014. The following trials were assessed as having high risk of bias for allocation and blinding: Delvin 1986; Kaur 1991; Mallet 1986; Marya 1988; Sablok 2015; Singh 2015. Benson 2009 and Yu 2008 had high risk for blinding. Sabet 2012 did not report on random sequence generation or on blinding of outcome assessments. Brooke 1980 and Vaziri 2016 did not report on most of these issues, therefore, we could not judge on their risk of bias. In Sasan 2017 allocation concealment was not well described and so was assessed as being at unclear risk of bias.
Primary outcomes
Maternal
Pre‐eclampsia (as defined by trialists)
Data from four trials (Asemi 2013a; Naghshineh 2016; Sablok 2015; Sasan 2017) involving 499 women found that supplementation with vitamin D probably reduces the risk of pre‐eclampsia compared to no intervention or placebo (risk ratio (RR 0.48, 95% CI 0.30 to 0.79); moderate‐certainty evidence; Analysis 1.1). The data from Sablok 2015 were wrongly entered in the previous update (De‐Regil 2016), as it included data for both pre‐eclampsia and gestational hypertension together. We contacted the author and now the data only for pre‐eclampsia are reported here and the data for gestational hypertension are reported in that outcome. It is also important to note that all women in the Sasan 2017 trial had a history of pre‐eclampsia.
Gestational diabetes (as defined by trialists)
Data from four trials (Asemi 2013a;Tehrani 2014; Naghshineh 2016; Sablok 2015) involving 446 women found that supplementation with vitamin D probably reduces the risk of gestational diabetes compared to women receiving no intervention, or in the placebo group (RR 0.51, 95% CI 0.27 to 0.97; moderate‐certainty evidence; Analysis 1.2).
Maternal adverse events Analysis 1.3
One trial reported on severe postpartum haemorrhage in 1134 women (Harvey 2012); vitamin D supplementation appears to reduce the risk of severe postpartum haemorrhage (RR 0.68, 95% CI 0.51 to 0.91; 1 trial, 1134 women, low‐certainty evidence), although it should be noted that this result is based on a single trial and was an unexpected finding that has not been documented before by any other study. Another trial reported on nephritic syndrome in 135 women (Yu 2008); no clear differences were found between groups (just one event in the control group: RR 0.17, 95% CI 0.01 to 4.06; very low‐certainty evidence). In terms of hypercalcaemia, only one trial reported this outcome (Harvey 2012) and there were no cases of hypercalcaemia in any group. Given the scarcity of data in general for maternal adverse events, no firm conclusions can be drawn.
Infant
Preterm birth (less than 37 weeks' gestation)
Data from seven trials (Asemi 2013a; Delvin 1986; Harvey 2012; Grant 2013; Mirghafourvand 2013; Roth 2010; Singh 2015) involving 1640 women suggest that supplementation with vitamin D probably may make little or no difference in the risk of having a preterm birth compared to no intervention or placebo (RR 0.66, 95% CI 0.34 to 1.30; low‐certainty evidence; Analysis 1.4). It is important to note that in Singh 2015, participants in the intervention group had significantly lower 25‐hydroxyvitamin D levels at baseline compared to the control group, therefore, there was an imbalance in study groups. However, the result in lowering preterm birth risk in this trial was consistent with the other trials.
Low birthweight (less than 2500 g)
The data from five trials (Brooke 1980; Bhutta 2011; Marya 1988; Roth 2010; Sablok 2015) involving 697 women suggest that supplementation with vitamin D probably reduces the risk of low birthweight (< 2500 g) compared to no intervention or placebo (RR 0.55, 95% CI 0.35 to 0.87; moderate‐certainty evidence;Analysis 1.5).
Subgroup analysis
For preterm birth, results did not differ greatly whether supplementation started before week 20 of pregnancy (three trials, 1149 women) (RR 0.73, 95% CI 0.26 to 2.04), or after 20 weeks of pregnancy (four trials, 491 women) (RR 0.49, 95% CI 0.13 to 1.87; Analysis 1.18).
With respect to the other subgroup analyses, most only had one or two trials (Analysis 1.6, Analysis 1.7; Analysis 1.8; Analysis 1.9; Analysis 1.10; Analysis 1.11; Analysis 1.12; Analysis 1.13; Analysis 1.14; Analysis 1.15; Analysis 1.16; Analysis 1.17; Analysis 1.19; Analysis 1.20; Analysis 1.21; Analysis 1.22; Analysis 1.23; Analysis 1.24; Analysis 1.25; Analysis 1.26; Analysis 1.27; Analysis 1.28; Analysis 1.29).
Secondary outcomes
Maternal
Caesarean section
Ten trials including 1104 women reported on this outcome (Asemi 2013a; Delvin 1986; Mirghafourvand 2013; Naghshineh 2016; Roth 2010; Sablok 2015; Sasan 2017; Shahgheibi 2016; Singh 2015; Yu 2008). The data from this trial suggest that vitamin D supplementation probably makes little or no difference in the risk of caesarean section compared to no supplementation or placebo (RR 0.98, 95% CI 0.80 to 1.21; Analysis 1.30). The trial by Singh 2015 was the only trial detecting a lower risk of caesarean section with the intervention, however, participants in the intervention group had significantly lower 25‐hydroxyvitamin D levels at baseline compared to the control group, therefore, there was an imbalance in study groups. If this trial is removed from the analysis, the results did not change (RR 1.06, 95% CI 0.93 to 1.21).
Gestational hypertension
Two trials reported on this outcome in 1130 women (Harvey 2012; Sablok 2015). Vitamin D supplementation probably makes little or no difference in the risk of gestational hypertension compared to no intervention or placebo (RR 0.78, 95% CI 0.41 to 1.49; Analysis 1.31).
Maternal death
One trial reported on this outcome in 180 women (Sablok 2015). No maternal deaths were reported in any of the groups (Analysis 1.32).
Impaired glucose tolerance
No trial reported this outcome.
Maternal vitamin D concentration at term (25‐hydroxyvitamin D in nmol/L)
The data from 14 trials (Asemi 2013a; Benson 2009; Bhutta 2011; Brooke 1980; Delvin 1986; Grant 2013; Harvey 2012; Mallet 1986; Roth 2010; Sabet 2012; Sablok 2015; Samimi 2017; Singh 2015; Vaziri 2016) involving 2470 women show that supplementation with vitamin D probably results in a higher 25‐hydroxyvitamin D concentrations than those women who received no intervention or a placebo. The average mean difference (MD) between groups was 35.66 nmol 25‐hydroxyvitamin D per litre (95% CI 24.19 to 47.13; Analysis 1.33). This result should be interpreted cautiously as the response to supplementation was highly heterogeneous (Tau² = 437.5, I² = 99% and Chi² test for heterogeneity P < 0.00001) and ranged from 16.3 nmol 25‐hydroxyvitamin D per litre (95% CI 13.6 to 19.0) (Mallet 1986) to 152 nmol 25‐hydroxyvitamin D per litre (95% CI 127 to 177) (Brooke 1980). If the trial by Brooke 1980 is removed, heterogeneity remains similar. The trial by Singh 2015 found consistent results with the other trials, even though there was an imbalance in study groups in this outcome at baseline. However, the results are consistent between trials. We also detected funnel plot asymmetry in this outcome (Figure 4); the presence of funnel plot asymmetry suggested that publication bias was a likely source of this heterogeneity.
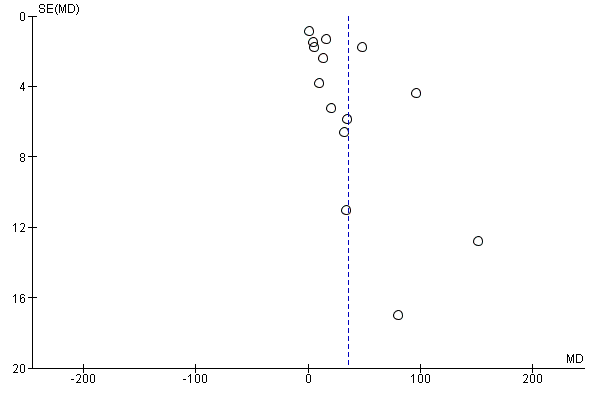
Funnel plot of comparison: 1 Vitamin D alone versus no treatment/placebo (no vitamins or minerals), outcome: 1.15 Maternal vitamin D concentration at term (25‐hydroxyvitamin D) (nmol/L) (ALL).
Infant
Length at birth (cm)
The data from eight trials (Asemi 2013a; Brooke 1980; Marya 1988; Mirghafourvand 2013; Roth 2010; Sabet 2012; Sablok 2015; Vaziri 2016) involving 931 women probably suggest a longer birth length among infants from women taking vitamin D supplementation during pregnancy compared to women in the no treatment or placebo group (MD 0.57, 95% CI 0.19 to 0.95; Analysis 1.34). There was heterogeneity in the response to the supplementation (Tau² = 0.16; I² = 63% and Chi² test for heterogeneity P = 0.008) and most of these studies did not report if outcome assessments were performed by blinded personnel (Brooke 1980; Marya 1988; Mirghafourvand 2013; Sabet 2012; Sablok 2015; Vaziri 2016). Taking this into consideration and the very small effect, these results should be interpreted with caution.
Head circumference at birth (cm)
Eight trials involving 1841 women (Asemi 2013a; Brooke 1980; Harvey 2012; Marya 1988; Mirghafourvand 2013; Roth 2010; Sablok 2015; Vaziri 2016) reported on this anthropometric measurement. Results suggest that supplementation with vitamin D probably makes little or no difference in head circumference at birth compared to no treatment or placebo (MD 0.11, 95% CI ‐0.21 to 0.44; Analysis 1.35). There was heterogeneity in the response to the supplementation (Tau² = 0.16; I² = 80% and Chi² test for heterogeneity P < 0.00001); therefore, results should be interpreted with caution.
Birthweight (g)
Seventeen trials involving 2828 women (Asemi 2013a; Bhutta 2011; Brooke 1980; Grant 2013; Harvey 2012; Kaur 1991; Mallet 1986; Marya 1988; Mirghafourvand 2013; Naghshineh 2016; Roth 2010; Sabet 2012; Sablok 2015; Shahgheibi 2016; Singh 2015; Vaziri 2016; Yu 2008) reported on this outcome. Results suggest that supplementation with vitamin D probably makes little or no difference in birthweight compared to no treatment or placebo (MD 80.30, 95% CI ‐14.40 to 175.00; Analysis 1.36). There was some substantial heterogeneity among trials in terms of the size of the treatment (Tau² = 32319; I² = 92% and Chi² test for heterogeneity P < 0.00001). However, when the trial by Mallet 1986 is excluded from the analysis, heterogeneity is reduced from 92% to 84% and results show that supplementation with vitamin D probably results in a higher birthweight (MD 99.27, 95% CI 16.22 to 182.32). The standard deviations for this study are very small and so we have concerns that these may not be reported correctly. Also, the trial by Singh 2015 found a very different result compared to the other trials and could be explained by the fact that women in the intervention group had significantly lower 25‐hydroxyvitamin D levels at baseline compared to the control group. When this trial is also removed from the analysis, heterogeneity is further reduced to 67%, with no significant differences between groups (MD 59.24, 95% CI ‐1.93 to 120.42).
Stillbirth (as defined by trialists)
Three trials (Grant 2013; Roth 2010; Yu 2008) including 584 women reported this outcome. Vitamin D supplementation probably makes little or no difference in the risk of stillbirth compared to no intervention or placebo (RR 0.35, 95% CI 0.06 to 1.98; Analysis 1.37). In particular, for this outcome, only one case of stillbirth out of 364 was reported in the vitamin D group and three cases out of 220 in the no intervention or placebo group.
Neonatal death (within 28 days after delivery)
Two trials (Roth 2010; Yu 2008) including 326 women reported this outcome. Vitamin D supplementation probably makes little or no difference in the risk of neonatal death compared to no intervention or placebo (RR 0.27, 95% CI 0.04 to 1.67; Analysis 1.38). Only one neonatal death out of 193 was reported in the vitamin D group and four neonatal deaths were reported out of 133 in the no intervention or placebo group. Given the scarcity of data for this outcome, no firm conclusions can be drawn.
Apgar score less than seven at five minutes
One study including 165 women did not find clear differences in Apgar scores between groups (RR 0.53, 95% CI 0.11 to 2.53; Analysis 1.39).
Other infant secondary outcomes
No trials reported on the other pre‐specified infant secondary outcomes: admission to special care (including intensive care) during the neonatal period (within 28 days after delivery); neonatal infection (e.g. respiratory infections) or very preterm birth (less than 34 weeks' gestation).
(2) Supplementation with vitamin D + calcium versus placebo/no intervention (no vitamin or minerals) (nine trials, 1916 women)
Nine trials involving 1916 women made this comparison (Asemi 2012; Asemi 2013a; Diogenes 2013; Li 2000a; Marya 1987; Mazurkevich 2013; Mirghafourvand 2013; Samimi 2016; Taherian 2002).
The following trials were assessed as having low risk of bias for allocation and blinding: Asemi 2013a; Mirghafourvand 2013; Samimi 2016, while four trials were assessed as having high risk of bias: Diogenes 2013; Li 2000a; Marya 1987; Mazurkevich 2013. The remaining two trials had mixed results, with some components having a low risk, high risk, or unclear risk: Asemi 2012; Taherian 2002.
Primary outcomes
Maternal
Pre‐eclampsia (as defined by trialists)
Four trials (Asemi 2012; Marya 1987; Samimi 2016; Taherian 2002) including 1174 women reported on this outcome. Supplementation with vitamin D probably reduces the risk of pre‐eclampsia compared to no intervention or placebo (RR 0.50, 95% CI 0.32 to 0.78;moderate‐certainty evidence; Analysis 2.1).
Gestational diabetes (as defined by trialists)
A single study including 54 women reported on this outcome (Asemi 2012). It is uncertain whether vitamin D supplementation makes any difference to the risk of gestational diabetes compared to no intervention or placebo (RR 0.33, 95% CI 0.01 to 7.84; very low‐certainty evidence; Analysis 2.2). The scarcity of data for this outcome and the wide CIs means no firm conclusions can be drawn.
Maternal adverse events
No trial reported this outcome.
Infant
Preterm birth (less than 37 weeks' gestation)
Five trials with 942 women reported on this outcome (Asemi 2012; Diogenes 2013; Mirghafourvand 2013; Samimi 2016; Taherian 2002). Supplementation with vitamin D may increase the risk of preterm birth compared to no intervention or placebo (RR 1.52, 95% CI 1.01 to 2.28; low‐certainty evidence; Analysis 2.3). These results are mostly driven by one trial, which recruited most of the patients and had most of the events (Taherian 2002).
Low birthweight (less than 2500 g)
Two trials with 110 women reported on this outcome (Diogenes 2013; Samimi 2016). We are uncertain whether supplementation with vitamin D makes any difference to the risk of low birthweight compared to no intervention or placebo (RR 0.68, 95% CI 0.10 to 4.55; very low‐certainty evidence; Analysis 2.4). The data were scarce for this outcome and the CIs wide and so, no firm conclusions can be drawn.
Secondary outcomes
Maternal
Impaired glucose tolerance
No trial reported this outcome.
Caesarean section
Two trials including 146 women reported on this outcome (Mirghafourvand 2013; Samimi 2016). Vitamin D supplementation probably makes little or no difference in the risk of caesarean section compared to no intervention or placebo (RR 1.16, 95% CI 0.87 to 1.54; Analysis 2.5).
Gestational hypertension
One trial reported on this outcome in 59 women (Li 2000a). Vitamin D supplementation probably makes little or no difference in the risk of gestational hypertension compared to no intervention or placebo (RR 0.26, 95% CI 0.06 to 1.12; Analysis 2.6).
Maternal death
No trial reported this outcome.
Maternal vitamin D levels at term (25‐hydroxyvitamin D in nmol/L)
A single study including 60 women reported on this outcome (Samimi 2016). The average MD between groups was 12.50 nmol 25‐hydroxyvitamin D per litre (95% CI 3.80 to 21.20; Analysis 2.7), but given the scarcity of data for this outcome and the wide CIs, no firm conclusions can be drawn.
Infant
Length at birth (cm)
The data from three trials (Diogenes 2013; Mirghafourvand 2013; Samimi 2016) involving 194 women show that vitamin D supplementation probably makes little or no difference in birth length compared to no intervention or placebo (MD ‐0.07, 95% CI ‐0.67 to 0.52; Analysis 2.8).
Head circumference at birth (cm)
Three trials involving 198 women (Diogenes 2013; Mirghafourvand 2013; Samimi 2016) reported on this anthropometric measurement. Vitamin D supplementation probably makes little or no difference in head circumference at birth compared to no intervention or placebo (MD ‐0.03, 95% CI ‐0.39 to 0.33; Analysis 2.9).
Birthweight (g)
Three trials involving 194 women (Diogenes 2013; Mirghafourvand 2013; Samimi 2016) reported on this outcome. Vitamin D supplementation probably makes little or no difference in birthweight compared to no intervention or placebo (MD 42.39, 95% CI ‐86.96 to 171.74; Analysis 2.10).
Neonatal death (within 28 days after delivery)
One trial (Taherian 2002) reported on this outcomes with one death during the study period in the no intervention or placebo group (RR 0.20, 95% 0.01 to 4.15; one study, 660 women; Analysis 2.11).
Other infant secondary outcomes
No trials reported on the other pre‐specified infant secondary outcomes: length at birth (cm); head circumference at birth (cm); weight at birth (g); admission to special care (including intensive care) during the neonatal period (within 28 days after delivery); stillbirths (as defined by trialists); Apgar score less than seven at five minutes; neonatal infection (e.g. respiratory infections) or very preterm birth (less than 34 weeks' gestation).
(3) Supplementation with vitamin D + calcium + other vitamins and minerals versus calcium + other vitamins and minerals (but no vitamin D) (one study, 1300 women)
One trial was included in this comparison (Roth 2013). It was assessed as having low risk of bias.
Primary outcomes
Maternal
Pre‐eclampsia (as defined by trialists)
The included study under this comparison did not report on this outcome.
Gestational diabetes (as defined by trialists)
It is unclear whether vitamin D supplementation with calcium and other vitamins and minerals makes any difference in the risk of gestational diabetes compared to no intervention or placebo (RR 0.42, 95% CI 0.10 to 1.73; 1 trial, 1298 women; very low‐certainty evidence;Analysis 3.1) because the certainty of the evidence was found to be very‐low.
Maternal adverse events
It is unclear whether vitamin D supplementation with calcium and other vitamins and minerals makes any difference in the risk of maternal hypercalciuria (confirmed cases) compared to no intervention or placebo (RR 0.25, 95% CI 0.02 to 3.97; 1 trial, 1298 women; very low‐certainty evidence;Analysis 3.2) because the certainty of the evidence was found to be very‐low. No confirmed cases were reported for maternal hypercalcaemia.
Infant
Preterm birth (less than 37 weeks' gestation)
Vitamin D supplementation may make little or no difference in the risk of preterm birth compared to no intervention or placebo (RR 1.04, 95% CI 0.68 to 1.59; 1 trial, 1298 women; low‐certainty evidence;Analysis 3.3).
Low birthweight (less than 2500 g)
Vitamin D supplementation probably may make little or no difference in the risk of low birthweight compared to no intervention or placebo (RR 1.12, 95% CI 0.82 to 1.51; 1 trial, 1298 women; low‐certainty evidence;Analysis 3.4).
Secondary outcomes
Maternal
Caesarean section
Vitamin D supplementation probably makes little or no difference in the risk of C‐section compared to no intervention or placebo (RR 1.10, 95% CI 0.95 to 1.27; 1 trial, 1298 women; Analysis 3.5).
Gestational hypertension
Vitamin D supplementation probably makes little or no difference in the risk of gestational hypertension compared to no intervention or placebo (RR 0.93, 95% CI 0.31 to 2.79; 1 trial, 1298 women; Analysis 3.6).
Maternal death
Vitamin D supplementation probably makes little or no difference in the risk of maternal death compared to no intervention or placebo (RR 0.25, 95% CI 0.02 to 3.98; 1 trial, 1300 women; Analysis 3.7). Only one maternal death out of 1040 was reported in the vitamin D group and one maternal death was reported out of 260 in the no intervention or placebo group. Given the scarcity of data for this outcome, no firm conclusions can be drawn.
Maternal vitamin D concentration at term (25‐hydroxyvitamin D in nmol/L)
The average MD between groups was 75.17 nmol 25‐hydroxyvitamin D per litre (95% CI 71.97 to 78.37; 1 trial, 635 women; Analysis 3.8) but given the scarcity of data for this outcome and the wide CIs, no firm conclusions can be drawn.
Infant
Stillbirth (as defined by trialists)
Vitamin D supplementation probably makes little or no difference in the risk of stillbirth compared to no intervention or placebo (RR 0.66, 95% CI 0.29 to 1.46; 1 trial, 1300 women; Analysis 3.12). A total of 21 stillbirths out of 1040 were reported in the vitamin D group and eight stillbirths were reported out of 260 in the no intervention or placebo group. Given the scarcity of data for this outcome, no firm conclusions can be drawn.
Neonatal death (within 28 days after delivery)
Vitamin D supplementation probably makes little or no difference in the risk of neonatal death compared to no intervention or placebo (RR 0.69, 95% CI 0.22 to 2.14; 1 trial, 1298 women; Analysis 3.13). A total of 11 neonatal deaths out of 1039 were reported in the vitamin D group and four neonatal death were reported out of 259 in the no intervention or placebo group. Given the scarcity of data for this outcome, no firm conclusions can be drawn.
(4) Supplementation with vitamin D + calcium versus calcium (but no vitamin D) (no trials)
No trials were included in this comparison.
(5) Supplementation with vitamin D + calcium + other vitamins and minerals versus other vitamins and minerals (but no vitamin D + calcium) (no trials)
No trials were included in this comparison.
Discussion
Summary of main results
This review evaluates the effects of vitamin D supplementation alone or in combination with calcium and other vitamins and minerals during pregnancy. It includes 30 trials involving 7033 women, 22 of which compared vitamin D alone versus no treatment or placebo, nine compared vitamin D plus calcium in comparison with no intervention, and one compared vitamin D plus calcium, iron and folic acid compared to no vitamin D. No trials evaluated the effects of vitamin D + calcium + other vitamins and minerals versus other vitamins and minerals (but no vitamin D + calcium).
Supplementation with vitamin D compared to no intervention or a placebo.
-
Probably reduces the risk of pre‐eclampsia (four trials), the risk of gestational diabetes (four trials), and the risk of having a baby with low birthweight (less than 2500 g) (five trials).
-
May make little or no difference in the risk of preterm birth (seven trials).
-
In terms of maternal adverse events, vitamin D supplementation may reduce the risk of severe postpartum haemorrhage, although it should be noted that this result is based on findings from a single trial and was an unexpected finding that has not been documented before by any other study. We are uncertain about the effects in the risk of nephritic syndrome. No trial reported any case of hypercalcaemia. However, given the scarcity of data in general for maternal adverse events, no firm conclusions can be drawn.
For secondary outcomes, supplementation with vitamin D compared to no intervention or a placebo probably results in a higher 25‐hydroxyvitamin D concentrations (14 trials). This result should be interpreted cautiously as the response to supplementation was highly heterogeneous. This could be due to the different doses used in the trials (ranging from 200 IU/day to 4000 IU/day), the different frequencies for the supplementation (i.e. daily, weekly or bolus), the different start of supplementation (i.e. before or after week 20), and also in the difference in methods to assess serum 25‐hydroxyvitamin D. This biomarker is difficult and complex, with high variability in results between methods used (Holick 2008). High performance liquid chromatography mass spectrometry is the best available method (Holick 2005), but only two trials used this method. Therefore, results should be interpreted with caution.
Supplementation with vitamin D + calcium compared to no intervention or a placebo.
-
Probably reduces the risk of pre‐eclampsia (four trials);
-
May increase the risk of preterm birth < 37 weeks (five trials). However, the results are driven mainly by only one trial; therefore, results should be interpreted with caution;
-
We are uncertain about the effects in the risk of gestational diabetes (1 trial) and in the risk of having a baby with low birthweight (two trials);
-
No trial reported on maternal adverse events.
Only one trial evaluated the supplementation with vitamin D, calcium, iron and folic acid compared to calcium, iron and folic acid but no vitamin D with little or no difference in the risk of preterm birth or low birthweight and the results for other outcomes were unclear due to very‐low certainty evidence.
In general, more data are needed to conclude about the risk of maternal adverse events.
Overall completeness and applicability of evidence
The aim of the present review was to compare trials providing any dose of vitamin D supplementation during pregnancy compared to placebo or no intervention for improving gestational and neonatal outcomes. In this update, the number of trials included doubled in comparison to the previous version (De‐Regil 2016), and some of the results appear to be more consistent. However, there is still a limited number of trials reporting on certain maternal outcomes (adverse events, impaired glucose tolerance, gestational hypertension, or death) as well as infant outcomes (neonatal death, admission to special care in the neonatal period, Apgar score less than seven at five minutes, neonatal infection or very preterm birth).
In general, this review showed that vitamin D supplementation probably reduces the risk of pre‐eclampsia and gestational diabetes, and may reduce the risk of low birthweight, but it may make little or no difference in the risk of having a preterm birth. More information is needed to determine the safety of the intervention.
What is missing from the overview?
More trials are needed for each of the main outcomes, as most outcomes were only reported by a few trials (two to five trials), and with larger sample sizes. Most trials were small to medium size, with 14 trials including less than 100 participants (Asemi 2012; Asemi 2013a; Benson 2009; Bhutta 2011; Delvin 1986; Diogenes 2013; Kaur 1991; Li 2000a; Mallet 1986; Mazurkevich 2013; Sabet 2012; Samimi 2016; Samimi 2017; Shahgheibi 2016), 13 trials including 100 to 500 participants (Brooke 1980; Grant 2013; Marya 1987; Marya 1988; Mirghafourvand 2013; Naghshineh 2016; Roth 2010; Sablok 2015; Sasan 2017; Singh 2015; Tehrani 2014; Vaziri 2016; Yu 2008), and only three trials including more than 500 participants (Harvey 2012; Roth 2013; Taherian 2002). Another missing factor was the lack of specifying pre‐gestational body mass index (BMI) and skin pigmentation, two important determinants of vitamin D status. Also, most trials did not take into account vitamin D status at the beginning of the trial; this is important as the effects of vitamin D supplementation may be more profound among women with vitamin D deficiency. Most trials provided vitamin D alone or with calcium. Only one trial (Roth 2013) compared vitamin D with other nutrients, which is what in practice most women would be taking. This is important to evaluate as there could be interactions between nutrients in dietary supplements that should be tested. Furthermore, more trials are needed starting earlier in pregnancy, as only seven trials started supplementation before week 20 (Benson 2009; Bhutta 2011; Harvey 2012; Naghshineh 2016; Samimi 2017; Singh 2015; Tehrani 2014). The effects of vitamin D may be more important if it starts early in pregnancy as the enzyme 1‐alpha‐hydroxylase, which catalyses the synthesis of 1,25 dihydroxy vitamin D3, has the highest level of expression in the first trimester and it is reduced towards the third trimester, highlighting its possible role early in pregnancy (Zehnder 2002).
Therefore, there is a need for larger trials, starting early in pregnancy and testing the effects of vitamin D in combination with other nutrients on maternal and infant outcomes. Also, these trials need to take into consideration the pre‐pregnancy BMI, skin pigmentation and vitamin D status at baseline, as those who are vitamin D deficient may benefit more. Although the trial by Roth 2013 is the largest so far (> 1500 participants) and tested different vitamin D doses in combination with other nutrients among women with 64% vitamin D deficiency, it started in mid pregnancy. This could explain the lack of significant effects on these health outcomes. As mentioned earlier, the enzyme 1‐alpha‐hydroxylase has the highest level of expression in the first trimester, highlighting its possible role early in pregnancy (Zehnder 2002).
We identified 60 trials that were excluded, mainly because the comparisons were among different doses of vitamin D without a placebo or no supplementation group or undertaken in pregnant women with glucose intolerance, gestational diabetes or other chronic conditions. We did not include trials with different doses and no placebo as most countries do not have the policy to include vitamin D in their prenatal supplementation guidelines. Therefore, it is important to first determine if vitamin D supplementation is beneficial against a placebo or no intervention group.
To the best of our knowledge, there are currently six ongoing trials that, once published, will further increase the body of evidence identified for this updated review. In addition, updates could include the dose‐response of vitamin D supplementation on important pregnancy outcomes. In fact, there is another review that will take into account trials with different doses of vitamin D to determine the best regimen to provide in pregnancy for improvements in prenatal and neonatal health outcomes (Palacios 2018).
Quality of the evidence
The risk of bias was high for allocation and/or blinding in 14 trials and for attrition in 10 trials. In addition, the results varied considerably between trials and this could be related to the variability in vitamin D regimens used. For example, nine trials used doses of about 200 to 600 IU of vitamin D per day. Although these could be considered low doses, these are the recommended doses for pregnancy by several organisations (EFSA 2016; IOM 2011; RCOG 2014; WHO 2004). Twelve studies used medium doses of 800 to 2000 IU vitamin D per day; and eight trials used doses > 2000 IU of vitamin D per day. There was also a large variability in the frequency of the supplementation, with 20 trials providing vitamin D daily; six weekly or monthly; three gave a bolus dose once or twice and one combined daily and bolus. Finally, as mentioned before, only seven trials started supplementation before week 20. The effects of vitamin D may be more important if it starts early in pregnancy as the enzyme 1‐alpha‐hydroxylase, which catalyses the synthesis of 1,25 dihydroxy vitamin D3, has the highest level of expression in the first trimester and it is reduced towards the third trimester, highlighting its possible role early in pregnancy (Zehnder 2002). These differences may have influenced the results observed.
Based on risk of bias and results from the studies, we evaluated the certainty of the body of evidence for the primary outcomes with the GRADE methodology for Comparison 1 (vitamin D alone versus placebo/no intervention; summary of findings Table for the main comparison), Comparison 2 (vitamin D + calcium versus placebo/no intervention; summary of findings Table 2) and Comparison 3 (vitamin D + calcium + other vitamins and minerals versus calcium + other vitamins and minerals but no vitamin D; summary of findings Table 3). We considered that inconsistency or publication bias were unlikely, but the risk of bias of the trials, and the imprecision resulted in: evidence of moderate certainty for pre‐eclampsia, gestational diabetes, and low birthweight; evidence of low certainty for severe postpartum haemorrhage, hypercalcaemia and preterm birth; and evidence of very‐low certainty for nephritic syndrome in the comparison of supplementation with vitamin D alone versus no intervention or placebo. The certainty of the evidence in the trials assessing supplementation of vitamin D plus calcium was moderate for pre‐eclampsia, low for preterm birth and very low for gestational diabetes and low birthweight. The certainty of the evidence in the trials assessing supplementation of vitamin D + calcium + other vitamins and minerals was low for preterm birth and low birthweight and very‐low for gestational diabetes and maternal adverse events.
Potential biases in the review process
We identified several potential biases in the review process. They were minimised in two ways: (1) eligibility for inclusion and data extraction were assessed independently by two review authors and (2) assessments of risk of bias and data entry were also assessed independently by two review authors. However, when reviewing the assessments of eligibility and risk of bias, this requires that we make a number of subjective judgements. Others may have reached different decisions regarding these issues. We would encourage readers to examine the Characteristics of included studies tables to assist in the interpretation of results.
Agreements and disagreements with other studies or reviews
This review updates the previous Cochrane Review on vitamin D supplementation in pregnancy (De‐Regil 2012; De‐Regil 2016). The 2012 review included six trials with a total of 1023 women and excluded eight trials, and six trials were still ongoing while the 2016 review included 15 trials assessing a total of 2833 women, excluded 27 trials, and 23 trials were still ongoing or unpublished. In the 2016 review, authors concluded that supplementing pregnant women with vitamin D significantly increased serum 25‐hydroxyvitamin D at term and may reduce the risk of pre‐eclampsia, low birthweight and preterm birth. However, when vitamin D and calcium were combined, this may increase the risk of preterm birth. In this update, results are similar but strengthened by the greater number of trials reporting on each outcome. The only difference noted was that in the 2016 review, a higher head circumference in infants born to women who were supplemented with vitamin D during pregnancy was seen but in this update, this was not observed. There are still insufficient data to confirm the effects on other maternal and infant health outcomes, as these were either not reported or assessed in only one or two trials.
Our results are in part in agreement with other similar systematic reviews. For example, Harvey 2014 compared the effects of vitamin D supplementation with placebo or a lower level of vitamin D on maternal and neonatal health outcomes. Among seven trials assessing birthweight, three trials demonstrated significantly greater birthweight in infants from supplemented mothers while the other four did not find a significant effect. For birth length, two trials were identified; one found that supplementation with vitamin D led to greater birth length in infants of women who received supplementation, while the other trial found quote: "no significant association but a trend towards higher birth length in the supplemented group" compared to the control group. In addition, in the two trials assessing offspring head circumference, one found a significantly greater head circumference while the other found a non‐significant trend towards greater head circumference in supplemented mothers. Only one intervention was identified for pre‐eclampsia (no difference in risk between groups) and no interventions were identified for preterm birth, low birthweight, gestational diabetes and caesarean section. Another systematic review and meta‐analysis of 13 trials (n = 2299) compared vitamin D supplementation (with or without calcium) compared to a placebo group, which included the low level of vitamin D (400 IU/day) in pregnancy (Perez‐Lopez 2015). Serum 25‐hydroxyvitamin D at term was significantly higher in the higher vitamin D group compared with the control group (mean difference: 66.5 nmol/L, 95% confidence interval (CI) 66.2 to 66.7; 10 trials; 1468 participants), similar to the present review. However, contrary to the present review, Perez‐Lopez 2015 found that vitamin D supplementation had no effect on pre‐eclampsia (3 trials; 654 participants), gestational diabetes mellitus (3 trials; 384 participants), low birthweight (4 trials; 496 participants) and preterm birth (3 trials; 384 participants), while it significantly increased birthweight (10 trials; 1489 participants) and birth length (6 trials; 866 participants). Consistent with the present review, vitamin D supplementation had no effect on caesarean section (4 trials; 1028 participants). Another review assessed the effect of vitamin D supplementation versus the control group, which also included a low vitamin D dose (400 IU/day) or no intervention during pregnancy for reducing the risk of pre‐eclampsia (Hyppönen 2013). Of the four trials identified, including 5871 women, two studies compared 2000 IU/day versus 4000 IU/day, another compared 1200 IU/day versus no vitamin D, a very old trial compared 450 IU/day versus no vitamin D, and another trial compared several supplements to no supplementation. They found that the intervention significantly reduced the risk of pre‐eclampsia compared with the control group (odds ratio (OR) 0.66; 95% confidence interval (CI) 0.52 to 0.83); however, they used very different trials. The review by Thorne‐Lyman 2012 also included trials with low dose of vitamin D (400I IU/day) in the placebo or control group. No effect was observed in the reduction of preterm birth in the two trials included (529 participants) with vitamin D supplementation; although a 60% lower risk of low birthweight was observed with the supplementation (3 trials; 507 participants). A more recent systematic review by Roth 2017 including 43 trials with a total of 8406 participants compared vitamin D supplementation versus a placebo group (with less than 600 IU/day) or no intervention. Vitamin D supplementation significantly increased maternal 25‐hydroxyvitamin D at term, but the dose‐response effect was weak. Also, women assigned to vitamin D supplementation had infants with higher mean birthweight compared to controls, but no effect was found on the risk of pre‐eclampsia, gestational diabetes, preterm birth, and low birthweight, contrary to our review. However, similar to this review, Roth 2017 also found no effect of vitamin D supplementation on the risk of gestational hypertension, caesarean section, admission to hospital, neonatal death, stillbirth, or other adverse events. This meta‐analysis also found that most trials had high risk of bias. It is important to note that Roth 2017 included trials with low levels of vitamin D in the control group, while we only included those with no vitamin D or no intervention in the control group.
Overall, the available systematic reviews and meta‐analyses have consistently shown that serum 25‐hydroxyvitamin D levels significantly improved with vitamin D supplementation. However, there are important differences in the results. While this review and another (Hyppönen 2013) showed a significant reduction in pre‐eclampsia risk with vitamin D supplementation, two other reviews (Perez‐Lopez 2015; Roth 2017) did not find this. Also, differences were found in the reduction in the risk of preterm birth, gestational diabetes and low birthweight. The main differences found between results in the present review and the aforementioned reviews is the inclusion criteria of trials. We only included trials that compared any dose of vitamin D with a placebo group with 0 IU/day or no intervention. However, the trials described above included trials comparing vitamin D supplementation with a placebo group that could have a low level of vitamin D or no intervention.
With respect to safety, the trials reporting on maternal and infant safety‐related outcomes may suggest that vitamin D supplementation may be safe during pregnancy. However, this was assessed differently in the trials, such as by evaluating haemorrhages, nephritic syndrome, hypercalcaemia and hypercalciuria. Therefore, the safety of this intervention still needs further studies. Also, most secondary outcomes defined in this review (maternal death, neonatal admission to intensive care unit, Apgar score less than seven at five minutes, neonatal infection or very preterm birth) were not reported by any of the trials. The trial by Sablok 2015 reported the Apgar score less than three or seven, with no difference between supplemented or placebo groups. More trials are needed to report on these safety‐related outcomes to have a definite conclusion.
Study flow diagram for this update
'Risk of bias' graph: review authors' judgements about each risk of bias item presented as percentages across all included studies.
'Risk of bias' summary: review authors' judgements about each risk of bias item for each included study.
Funnel plot of comparison: 1 Vitamin D alone versus no treatment/placebo (no vitamins or minerals), outcome: 1.15 Maternal vitamin D concentration at term (25‐hydroxyvitamin D) (nmol/L) (ALL).

Comparison 1 Supplementation with vitamin D alone versus placebo or no intervention (no vitamins or minerals), Outcome 1 Pre‐eclampsia (ALL).

Comparison 1 Supplementation with vitamin D alone versus placebo or no intervention (no vitamins or minerals), Outcome 2 Gestational diabetes (ALL).

Comparison 1 Supplementation with vitamin D alone versus placebo or no intervention (no vitamins or minerals), Outcome 3 Maternal adverse events.

Comparison 1 Supplementation with vitamin D alone versus placebo or no intervention (no vitamins or minerals), Outcome 4 Preterm birth (less than 37 weeks' gestation) (ALL).

Comparison 1 Supplementation with vitamin D alone versus placebo or no intervention (no vitamins or minerals), Outcome 5 Low birthweight (less than 2500 g) (ALL).

Comparison 1 Supplementation with vitamin D alone versus placebo or no intervention (no vitamins or minerals), Outcome 6 Pre‐eclampsia (by start of supplementation).

Comparison 1 Supplementation with vitamin D alone versus placebo or no intervention (no vitamins or minerals), Outcome 7 Pre‐eclampsia (by pre‐gestational BMI).

Comparison 1 Supplementation with vitamin D alone versus placebo or no intervention (no vitamins or minerals), Outcome 8 Pre‐eclampsia (by supplementation scheme/regimen).

Comparison 1 Supplementation with vitamin D alone versus placebo or no intervention (no vitamins or minerals), Outcome 9 Pre‐eclampsia (by skin pigmentation based on Fitzpatrick skin tone chart).

Comparison 1 Supplementation with vitamin D alone versus placebo or no intervention (no vitamins or minerals), Outcome 10 Pre‐eclampsia (by latitude).

Comparison 1 Supplementation with vitamin D alone versus placebo or no intervention (no vitamins or minerals), Outcome 11 Pre‐eclampsia (by season at the start of pregnancy).

Comparison 1 Supplementation with vitamin D alone versus placebo or no intervention (no vitamins or minerals), Outcome 12 Gestational diabetes (by start of supplementation).

Comparison 1 Supplementation with vitamin D alone versus placebo or no intervention (no vitamins or minerals), Outcome 13 Gestational diabetes (by pre‐gestational BMI).

Comparison 1 Supplementation with vitamin D alone versus placebo or no intervention (no vitamins or minerals), Outcome 14 Gestational diabetes (by supplementation scheme/regimen).

Comparison 1 Supplementation with vitamin D alone versus placebo or no intervention (no vitamins or minerals), Outcome 15 Gestational diabetes (by skin pigmentation based on Fitzpatrick skin tone chart).

Comparison 1 Supplementation with vitamin D alone versus placebo or no intervention (no vitamins or minerals), Outcome 16 Gestational diabetes (by latitude).

Comparison 1 Supplementation with vitamin D alone versus placebo or no intervention (no vitamins or minerals), Outcome 17 Gestational diabetes (by season at the start of supplementation).

Comparison 1 Supplementation with vitamin D alone versus placebo or no intervention (no vitamins or minerals), Outcome 18 Preterm birth (less than 37 weeks' gestation) (by start of supplementation).

Comparison 1 Supplementation with vitamin D alone versus placebo or no intervention (no vitamins or minerals), Outcome 19 Preterm birth (less than 37 weeks' gestation) (by pre‐gestational BMI).

Comparison 1 Supplementation with vitamin D alone versus placebo or no intervention (no vitamins or minerals), Outcome 20 Preterm birth (less than 37 weeks' gestation) (by supplementation scheme/regimen).

Comparison 1 Supplementation with vitamin D alone versus placebo or no intervention (no vitamins or minerals), Outcome 21 Preterm birth (less than 37 weeks' gestation) (by skin pigmentation based on Fitzpatrick skin tone chart).

Comparison 1 Supplementation with vitamin D alone versus placebo or no intervention (no vitamins or minerals), Outcome 22 Preterm birth (less than 37 weeks' gestation) (by latitude).

Comparison 1 Supplementation with vitamin D alone versus placebo or no intervention (no vitamins or minerals), Outcome 23 Preterm birth (less than 37 weeks' gestation) (by season at the start of supplementation).

Comparison 1 Supplementation with vitamin D alone versus placebo or no intervention (no vitamins or minerals), Outcome 24 Low birthweight (less than 2500 g) (by start of supplementation).

Comparison 1 Supplementation with vitamin D alone versus placebo or no intervention (no vitamins or minerals), Outcome 25 Low birthweight (less than 2500 g) (by pre‐gestational BMI).

Comparison 1 Supplementation with vitamin D alone versus placebo or no intervention (no vitamins or minerals), Outcome 26 Low birthweight (less than 2500 g) (by supplementation scheme/regimen).

Comparison 1 Supplementation with vitamin D alone versus placebo or no intervention (no vitamins or minerals), Outcome 27 Low birthweight (less than 2500 g) (by skin pigmentation based on Fitzpatrick skin to.

Comparison 1 Supplementation with vitamin D alone versus placebo or no intervention (no vitamins or minerals), Outcome 28 Low birthweight (less than 2500 g) (by latitude).

Comparison 1 Supplementation with vitamin D alone versus placebo or no intervention (no vitamins or minerals), Outcome 29 Low birthweight (less than 2500 g) (by season at the start of pregnancy).

Comparison 1 Supplementation with vitamin D alone versus placebo or no intervention (no vitamins or minerals), Outcome 30 Caesarean section.

Comparison 1 Supplementation with vitamin D alone versus placebo or no intervention (no vitamins or minerals), Outcome 31 Gestational hypertension.

Comparison 1 Supplementation with vitamin D alone versus placebo or no intervention (no vitamins or minerals), Outcome 32 Maternal death (death while pregnant or within 42 days of termination of pregnancy) (ALL).

Comparison 1 Supplementation with vitamin D alone versus placebo or no intervention (no vitamins or minerals), Outcome 33 Maternal vitamin D concentration at term (25‐hydroxyvitamin D) (nmol/L) (ALL).

Comparison 1 Supplementation with vitamin D alone versus placebo or no intervention (no vitamins or minerals), Outcome 34 Birth length (cm).

Comparison 1 Supplementation with vitamin D alone versus placebo or no intervention (no vitamins or minerals), Outcome 35 Head circumference at birth (cm).

Comparison 1 Supplementation with vitamin D alone versus placebo or no intervention (no vitamins or minerals), Outcome 36 Birthweight (g).

Comparison 1 Supplementation with vitamin D alone versus placebo or no intervention (no vitamins or minerals), Outcome 37 Stillbirth.

Comparison 1 Supplementation with vitamin D alone versus placebo or no intervention (no vitamins or minerals), Outcome 38 Neonatal death.

Comparison 1 Supplementation with vitamin D alone versus placebo or no intervention (no vitamins or minerals), Outcome 39 Apgar score less than seven at five minutes.

Comparison 2 Supplementation with vitamin D + calcium versus placebo or no intervention (no vitamin or minerals), Outcome 1 Pre‐eclampsia (ALL).

Comparison 2 Supplementation with vitamin D + calcium versus placebo or no intervention (no vitamin or minerals), Outcome 2 Gestational diabetes (ALL).

Comparison 2 Supplementation with vitamin D + calcium versus placebo or no intervention (no vitamin or minerals), Outcome 3 Preterm birth (less than 37 weeks' gestation) (ALL).

Comparison 2 Supplementation with vitamin D + calcium versus placebo or no intervention (no vitamin or minerals), Outcome 4 Low birthweight (less than 2500 g) (ALL).

Comparison 2 Supplementation with vitamin D + calcium versus placebo or no intervention (no vitamin or minerals), Outcome 5 Caesarean section.

Comparison 2 Supplementation with vitamin D + calcium versus placebo or no intervention (no vitamin or minerals), Outcome 6 Gestational hypertension.

Comparison 2 Supplementation with vitamin D + calcium versus placebo or no intervention (no vitamin or minerals), Outcome 7 Maternal vitamin D concentration at term (25‐hydroxyvitamin D) (nmol/L) (ALL).

Comparison 2 Supplementation with vitamin D + calcium versus placebo or no intervention (no vitamin or minerals), Outcome 8 Birth length (cm).

Comparison 2 Supplementation with vitamin D + calcium versus placebo or no intervention (no vitamin or minerals), Outcome 9 Head circumference at birth (cm).

Comparison 2 Supplementation with vitamin D + calcium versus placebo or no intervention (no vitamin or minerals), Outcome 10 Birthweight (g).

Comparison 2 Supplementation with vitamin D + calcium versus placebo or no intervention (no vitamin or minerals), Outcome 11 Neonatal death.

Comparison 3 Supplementation with vitamin D + calcium + other vitamins and minerals versus calcium + other vitamins and minerals (but no vitamin D), Outcome 1 Gestational diabetes (ALL).

Comparison 3 Supplementation with vitamin D + calcium + other vitamins and minerals versus calcium + other vitamins and minerals (but no vitamin D), Outcome 2 Maternal adverse events.

Comparison 3 Supplementation with vitamin D + calcium + other vitamins and minerals versus calcium + other vitamins and minerals (but no vitamin D), Outcome 3 Preterm birth (less than 37 weeks' gestation) (ALL).

Comparison 3 Supplementation with vitamin D + calcium + other vitamins and minerals versus calcium + other vitamins and minerals (but no vitamin D), Outcome 4 Low birthweight (less than 2500 g) (ALL).

Comparison 3 Supplementation with vitamin D + calcium + other vitamins and minerals versus calcium + other vitamins and minerals (but no vitamin D), Outcome 5 Caesarean section.

Comparison 3 Supplementation with vitamin D + calcium + other vitamins and minerals versus calcium + other vitamins and minerals (but no vitamin D), Outcome 6 Gestational hypertension.

Comparison 3 Supplementation with vitamin D + calcium + other vitamins and minerals versus calcium + other vitamins and minerals (but no vitamin D), Outcome 7 Maternal death (death while pregnant or within 42 days of termination of pregnancy).

Comparison 3 Supplementation with vitamin D + calcium + other vitamins and minerals versus calcium + other vitamins and minerals (but no vitamin D), Outcome 8 Maternal vitamin D concentration at term (25‐hydroxyvitamin D) (nmol/L) (ALL).

Comparison 3 Supplementation with vitamin D + calcium + other vitamins and minerals versus calcium + other vitamins and minerals (but no vitamin D), Outcome 9 Birth length (cm).

Comparison 3 Supplementation with vitamin D + calcium + other vitamins and minerals versus calcium + other vitamins and minerals (but no vitamin D), Outcome 10 Head circumference at birth (cm).

Comparison 3 Supplementation with vitamin D + calcium + other vitamins and minerals versus calcium + other vitamins and minerals (but no vitamin D), Outcome 11 Birthweight (g).

Comparison 3 Supplementation with vitamin D + calcium + other vitamins and minerals versus calcium + other vitamins and minerals (but no vitamin D), Outcome 12 Stillbirth.

Comparison 3 Supplementation with vitamin D + calcium + other vitamins and minerals versus calcium + other vitamins and minerals (but no vitamin D), Outcome 13 Neonatal death.
| Vitamin D supplementation compared to placebo/control for pregnancy and neonatal health outcomes | ||||||
| Patient or population: pregnant women and their infants. | ||||||
| Outcomes | Anticipated absolute effects* (95% CI) | Relative effect | № of participants | Certainty of the evidence | Comments | |
| Risk with placebo/control | Risk with vitamin D supplementation | |||||
| Pre‐eclampsia | Study population | RR 0.48 (0.30, 0.79) | 499 | ⊕⊕⊕⊝ | Included trials: Asemi 2013a; Naghshineh 2016; Sablok 2015; Sasan 2017 | |
| 168 per 1000 | 79 per 1000 | |||||
| Gestational diabetes | Study population | RR 0.51 | 446 | ⊕⊕⊕⊝ | Included trials: Asemi 2013a; Sablok 2015; Shahgheibi 2016; Tehrani 2014 | |
| 127 per 1000 | 65 per 1000 | |||||
| Maternal adverse events: severe postpartum haemorrhage | Study population | RR 0.68 | 1134 | ⊕⊕⊝⊝ | Included trial: Harvey 2012 | |
| 158 per 1000 | 106 per 1000 | |||||
| Maternal adverse event: nephritic syndrome | Study population | RR 0.17 (0.01 to 4.06) | 135 (1 RCT) | ⊕⊝⊝⊝ | Included trial: Yu 2008 | |
| 22 per 1000 | 4 per 1000 (0 to 90) | |||||
| Maternal adverse event: hypercalcaemia | Study population | Not estimable | 1134 | ⊕⊕⊝⊝ | Included trial: Harvey 2012 | |
| 0 per 1000 | 0 per 1000 | |||||
| Preterm birth (less than 37 weeks' gestation) | Study population | RR 0.66 (0.34 to 1.30) | 1640 | ⊕⊕⊝⊝ | Included trials: Asemi 2013a; Delvin 1986; Grant 2013; Harvey 2012; Mirghafourvand 2013; Roth 2010; Singh 2015 | |
| 87 per 1000 | 57 per 1000 | |||||
| Low birthweight (less than 2500 g) | Study population | RR 0.55 | 697 | ⊕⊕⊕⊝ | Included trials: Brooke 1980; Bhutta 2011; Marya 1988; Roth 2010; Sablok 2015 | |
| 136 per 1000 | 75 per 1000 | |||||
| *The risk in the intervention group (and its 95% confidence interval) is based on the assumed risk in the comparison group and the relative effect of the intervention (and its 95% CI). | ||||||
| GRADE Working Group grades of evidence | ||||||
| 1 We downgraded (1) level for serious limitations in study design due to one trial being assessed as high risk of bias for several domains and two trials having unclear allocation concealment. 2 We downgraded (1) level for serious limitations in study design due to one trial being assessed as high risk of bias for several domains. 3 We downgraded (2) levels for very serious limitations in study design due to one study being assessed as high risk of other bias because we do not know the impact of the participants who were allowed to continue taking their own multivitamin with 400 IU/d of vitamin D as this was not recorded. 4 We downgraded (1) level for serious limitations in study design due to one study being assessed as high risk of bias for performance and detection bias. 5 We downgraded (2) levels for very serious limitations in imprecision as only one small study, with a small number of events and wide 95% confidence intervals (CI) contributed data. 6 We downgraded (1) level for serious limitations in imprecision due to a single study with zero events contributing data. 7 We downgraded (1) level for serious limitations in study design due to two studies being at unclear risk of selection bias and one study being at high risk of other bias. 8 We downgraded (1) level for serious limitations in imprecision as the 95% confidence interval (CI) was wide and crossed the line of no effect. 9 We downgraded (1) level for serious limitations in study design due to two studies being at unclear risk of selection bias, one study being at high risk of bias for allocation concealment, and three studies being at high risk of attrition bias. | ||||||
| Vitamin D + calcium supplementation compared to placebo/control for pregnancy and neonatal health outcomes | |||||||
| Patient or population: pregnant women and their infants.. | |||||||
| Outcomes | Anticipated absolute effects* (95% CI) | Relative effect | № of participants | Certainty of the evidence | Comments | ||
| Risk with placebo/control | Risk with vitamin D + calcium supplementation | ||||||
| Pre‐eclampsia | Study population | RR 0.50 | 1174 | ⊕⊕⊕⊝ | Included trials: Asemi 2012; Marya 1987; Samimi 2016; Taherian 2002 | ||
| 94 per 1000 | 47 per 1000 | ||||||
| Gestational diabetes | Study population | RR 0.33 | 54 | ⊕⊝⊝⊝ | Included trial: Asemi 2012 | ||
| 37 per 1000 | 12 per 1000 | ||||||
| Maternal adverse events | ‐ | ‐ | ‐ | ‐ | ‐ | No trials reported on this outcome | |
| Preterm birth (less than 37 weeks' gestation) | Study population | RR 1.52 | 942 | ⊕⊕⊝⊝ | Included trials: Asemi 2012; Diogenes 2013, Mirghafourvand 2013, Samimi 2016; Taherian 2002; | ||
| 72 per 1000 | 110 per 1000 | ||||||
| Low birthweight (less than 2500 g) | Study population | RR 0.68 | 110 | ⊕⊝⊝⊝ | Included trials: Diogenes 2013; Samimi 2016 | ||
| 59 per 1000 | 40 per 1000 | ||||||
| *The risk in the intervention group (and its 95% confidence interval) is based on the assumed risk in the comparison group and the relative effect of the intervention (and its 95% CI). | |||||||
| GRADE Working Group grades of evidence | |||||||
| 1 We downgraded (1) level for serious limitations in study design due to one study being at high risk of attrition and selection bias and three studies being at high risk of performance and detection bias. 2 We downgraded (1) level for serious limitations in study design due to one study being at high risk of performance and detection bias. 3 We downgraded (2) levels for very serious limitations in imprecision due to one small study, with a single event and wide 95% confidence intervals (CI) crossing the line of no effect contributing data. 4 We downgraded (1) level for serious limitations in study design due to three studies being at unclear risk of allocation concealment and three studies being at high risk of performance and detection bias. 5 We downgraded (1) level for serious limitations in imprecision due to wide 95% confidence intervals (CI). 6 We downgraded (1) level for serious limitations in study design due to one study being at unclear risk of allocation concealment and one study being at high risk of attrition bias. 7 We downgraded (2) levels for very serious limitations in imprecision due two small studies, with very few events and wide 95% confidence intervals (CI) crossing the line of no effect contributing data. | |||||||
| Vitamin D + calcium + other vitamins and minerals compared to calcium + other vitamins and minerals (but no vitamin D) for pregnancy and neonatal health outcomes | ||||||
| Patient or population: pregnant women and their infants.. | ||||||
| Outcomes | Anticipated absolute effects* (95% CI) | Relative effect | № of participants | Certainty of the evidence | Comments | |
| Risk with calcium + other vitamins and minerals (but no vitamin D) | Risk with vitamin D + calcium + other vitamins and minerals | |||||
| Pre‐eclampsia | Study population | ‐ | (0 trials) | ‐ | No trials reported on this outcome | |
| see comment | see comment | |||||
| Gestational diabetes | Study population | RR 0.42 | 1298 | ⊕⊝⊝⊝ | Included trial: Roth 2013 | |
| 12 per 1000 | 5 per 1000 | |||||
| Maternal adverse event: hypercalcaemia | Study population | ‐ | 1298 | ⊕⊝⊝⊝ | Included trial: Roth 2013 | |
| 23 per 1000 | 64 per 1000 | |||||
| Maternal adverse event: hypercalciuria | Study population | 0.25 (0.02 to 3.97) | 1298 | ⊕⊝⊝⊝ | Included trial: Roth 2013 | |
| 4 per 1000 | 1 per 1000 (0 to 15) | |||||
| Preterm birth (less than 37 weeks' gestation) | Study population | RR 1.04 | 1298 | ⊕⊕⊝⊝ | Included trial: Roth 2013 | |
| 93 per 1000 | 96 per 1000 | |||||
| Low birthweight (less than 2500 g) | Study population | RR 1.12 | 1298 | ⊕⊕⊝⊝ | Included trial: Roth 2013 | |
| 162 per 1000 | 182 per 1000 | |||||
| *The risk in the intervention group (and its 95% confidence interval) is based on the assumed risk in the comparison group and the relative effect of the intervention (and its 95% CI). | ||||||
| GRADE Working Group grades of evidence | ||||||
| 1 We downgraded (2) levels for very serious limitations in imprecision with only one trial, with few events, and wide 95% confidence intervals (CI) crossing the line of no effect contributing data. 2 We downgraded (1) level for serious indirectness as there were multiple nutrient interventions in addition to vitamin D. 2 We downgraded (2) levels for very serious limitations in imprecision with only one trial, with zero events, and wide 95% confidence intervals (CI) crossing the line of no effect contributing data. 3 We downgraded (1) level for serious limitations in imprecision due to only one trial with wide 95% confidence intervals (CI) crossing the line of no effect contributing data. | ||||||
| Outcome or subgroup title | No. of studies | No. of participants | Statistical method | Effect size |
| 1 Pre‐eclampsia (ALL) Show forest plot | 4 | 499 | Risk Ratio (M‐H, Random, 95% CI) | 0.48 [0.30, 0.79] |
| 2 Gestational diabetes (ALL) Show forest plot | 4 | 446 | Risk Ratio (M‐H, Random, 95% CI) | 0.51 [0.27, 0.97] |
| 3 Maternal adverse events Show forest plot | 2 | Risk Ratio (M‐H, Random, 95% CI) | Subtotals only | |
| 3.1 Severe postpartum haemorrhage | 1 | 1134 | Risk Ratio (M‐H, Random, 95% CI) | 0.68 [0.51, 0.91] |
| 3.2 Nephritic syndrome | 1 | 135 | Risk Ratio (M‐H, Random, 95% CI) | 0.17 [0.01, 4.06] |
| 3.3 Hypercalcaemia | 1 | 1134 | Risk Ratio (M‐H, Random, 95% CI) | 0.0 [0.0, 0.0] |
| 4 Preterm birth (less than 37 weeks' gestation) (ALL) Show forest plot | 7 | 1640 | Risk Ratio (M‐H, Random, 95% CI) | 0.66 [0.34, 1.30] |
| 5 Low birthweight (less than 2500 g) (ALL) Show forest plot | 5 | 697 | Risk Ratio (M‐H, Random, 95% CI) | 0.55 [0.35, 0.87] |
| 6 Pre‐eclampsia (by start of supplementation) Show forest plot | 4 | 499 | Risk Ratio (M‐H, Random, 95% CI) | 0.48 [0.30, 0.79] |
| 6.1 Less than 20 weeks of pregnancy | 1 | 138 | Risk Ratio (M‐H, Random, 95% CI) | 0.29 [0.06, 1.37] |
| 6.2 20 weeks of pregnancy or more | 2 | 219 | Risk Ratio (M‐H, Random, 95% CI) | 0.51 [0.21, 1.24] |
| 6.3 Unknown/unreported/mixed | 1 | 142 | Risk Ratio (M‐H, Random, 95% CI) | 0.51 [0.27, 0.98] |
| 7 Pre‐eclampsia (by pre‐gestational BMI) Show forest plot | 4 | 499 | Risk Ratio (M‐H, Random, 95% CI) | 0.48 [0.30, 0.79] |
| 7.1 Underweight (lower than 18.5) | 0 | 0 | Risk Ratio (M‐H, Random, 95% CI) | 0.0 [0.0, 0.0] |
| 7.2 Normal weight (18.5 to 24.9) | 1 | 165 | Risk Ratio (M‐H, Random, 95% CI) | 0.53 [0.21, 1.33] |
| 7.3 Overweight (25 or higher) | 1 | 54 | Risk Ratio (M‐H, Random, 95% CI) | 0.33 [0.01, 7.84] |
| 7.4 Unknown/unreported/mixed | 2 | 280 | Risk Ratio (M‐H, Random, 95% CI) | 0.47 [0.26, 0.86] |
| 8 Pre‐eclampsia (by supplementation scheme/regimen) Show forest plot | 4 | 499 | Risk Ratio (M‐H, Random, 95% CI) | 0.48 [0.30, 0.79] |
| 8.1 Single dose | 1 | 165 | Risk Ratio (M‐H, Random, 95% CI) | 0.53 [0.21, 1.33] |
| 8.2 Daily | 2 | 192 | Risk Ratio (M‐H, Random, 95% CI) | 0.30 [0.08, 1.20] |
| 8.3 Weekly/monthly | 1 | 142 | Risk Ratio (M‐H, Random, 95% CI) | 0.51 [0.27, 0.98] |
| 9 Pre‐eclampsia (by skin pigmentation based on Fitzpatrick skin tone chart) Show forest plot | 4 | 499 | Risk Ratio (M‐H, Random, 95% CI) | 0.48 [0.30, 0.79] |
| 9.1 Three or less | 0 | 0 | Risk Ratio (M‐H, Random, 95% CI) | 0.0 [0.0, 0.0] |
| 9.2 Four or more | 0 | 0 | Risk Ratio (M‐H, Random, 95% CI) | 0.0 [0.0, 0.0] |
| 9.3 Unknown/unreported/mixed | 4 | 499 | Risk Ratio (M‐H, Random, 95% CI) | 0.48 [0.30, 0.79] |
| 10 Pre‐eclampsia (by latitude) Show forest plot | 4 | 499 | Risk Ratio (M‐H, Random, 95% CI) | 0.48 [0.30, 0.79] |
| 10.1 Between Tropics of Cancer and Capricorn | 0 | 0 | Risk Ratio (M‐H, Random, 95% CI) | 0.0 [0.0, 0.0] |
| 10.2 North of the Tropic of Cancer or South of the Tropic of Capricorn | 4 | 499 | Risk Ratio (M‐H, Random, 95% CI) | 0.48 [0.30, 0.79] |
| 10.3 Unknown/unreported | 0 | 0 | Risk Ratio (M‐H, Random, 95% CI) | 0.0 [0.0, 0.0] |
| 11 Pre‐eclampsia (by season at the start of pregnancy) Show forest plot | 4 | 499 | Risk Ratio (M‐H, Random, 95% CI) | 0.48 [0.30, 0.79] |
| 11.1 Summer | 1 | 54 | Risk Ratio (M‐H, Random, 95% CI) | 0.33 [0.01, 7.84] |
| 11.2 Fall | 0 | 0 | Risk Ratio (M‐H, Random, 95% CI) | 0.0 [0.0, 0.0] |
| 11.3 Winter | 1 | 138 | Risk Ratio (M‐H, Random, 95% CI) | 0.29 [0.06, 1.37] |
| 11.4 Mixed/unknown | 2 | 307 | Risk Ratio (M‐H, Random, 95% CI) | 0.52 [0.31, 0.88] |
| 12 Gestational diabetes (by start of supplementation) Show forest plot | 4 | 446 | Risk Ratio (M‐H, Random, 95% CI) | 0.51 [0.27, 0.97] |
| 12.1 Less than 20 weeks of pregnancy | 1 | 140 | Risk Ratio (M‐H, Random, 95% CI) | 0.88 [0.34, 2.28] |
| 12.2 20 weeks of pregnancy or more | 2 | 219 | Risk Ratio (M‐H, Random, 95% CI) | 0.43 [0.05, 3.45] |
| 12.3 Unknown/unreported/mixed | 1 | 87 | Risk Ratio (M‐H, Random, 95% CI) | 0.33 [0.13, 0.82] |
| 13 Gestational diabetes (by pre‐gestational BMI) Show forest plot | 4 | 446 | Risk Ratio (M‐H, Random, 95% CI) | 0.51 [0.27, 0.97] |
| 13.1 Underweight (lower than 18.5) | 0 | 0 | Risk Ratio (M‐H, Random, 95% CI) | 0.0 [0.0, 0.0] |
| 13.2 Normal weight (18.5 to 24.9) | 2 | 305 | Risk Ratio (M‐H, Random, 95% CI) | 0.83 [0.33, 2.05] |
| 13.3 Overweight (25 or higher) | 2 | 141 | Risk Ratio (M‐H, Random, 95% CI) | 0.33 [0.13, 0.79] |
| 13.4 Unknown/unreported/mixed | 0 | 0 | Risk Ratio (M‐H, Random, 95% CI) | 0.0 [0.0, 0.0] |
| 14 Gestational diabetes (by supplementation scheme/regimen) Show forest plot | 4 | 446 | Risk Ratio (M‐H, Random, 95% CI) | 0.51 [0.27, 0.97] |
| 14.1 Single dose | 1 | 165 | Risk Ratio (M‐H, Random, 95% CI) | 0.53 [0.03, 8.28] |
| 14.2 Daily | 2 | 141 | Risk Ratio (M‐H, Random, 95% CI) | 0.33 [0.13, 0.79] |
| 14.3 Weekly/monthly | 1 | 140 | Risk Ratio (M‐H, Random, 95% CI) | 0.88 [0.34, 2.28] |
| 15 Gestational diabetes (by skin pigmentation based on Fitzpatrick skin tone chart) Show forest plot | 4 | 446 | Risk Ratio (M‐H, Random, 95% CI) | 0.51 [0.27, 0.97] |
| 15.1 Three or less | 0 | 0 | Risk Ratio (M‐H, Random, 95% CI) | 0.0 [0.0, 0.0] |
| 15.2 Four or more | 0 | 0 | Risk Ratio (M‐H, Random, 95% CI) | 0.0 [0.0, 0.0] |
| 15.3 Unknown/unreported/mixed | 4 | 446 | Risk Ratio (M‐H, Random, 95% CI) | 0.51 [0.27, 0.97] |
| 16 Gestational diabetes (by latitude) Show forest plot | 4 | 446 | Risk Ratio (M‐H, Random, 95% CI) | 0.51 [0.27, 0.97] |
| 16.1 Between Tropics of Cancer and Capricorn | 0 | 0 | Risk Ratio (M‐H, Random, 95% CI) | 0.0 [0.0, 0.0] |
| 16.2 North of the Tropic of Cancer or South of the Tropic of Capricorn | 4 | 446 | Risk Ratio (M‐H, Random, 95% CI) | 0.51 [0.27, 0.97] |
| 16.3 Unknown/unreported | 0 | 0 | Risk Ratio (M‐H, Random, 95% CI) | 0.0 [0.0, 0.0] |
| 17 Gestational diabetes (by season at the start of supplementation) Show forest plot | 4 | 446 | Risk Ratio (M‐H, Random, 95% CI) | 0.51 [0.27, 0.97] |
| 17.1 Summer | 1 | 54 | Risk Ratio (M‐H, Random, 95% CI) | 0.33 [0.01, 7.84] |
| 17.2 Fall | 0 | 0 | Risk Ratio (M‐H, Random, 95% CI) | 0.0 [0.0, 0.0] |
| 17.3 Winter | 1 | 140 | Risk Ratio (M‐H, Random, 95% CI) | 0.88 [0.34, 2.28] |
| 17.4 Mixed/unknown | 2 | 252 | Risk Ratio (M‐H, Random, 95% CI) | 0.34 [0.14, 0.82] |
| 18 Preterm birth (less than 37 weeks' gestation) (by start of supplementation) Show forest plot | 7 | 1640 | Risk Ratio (M‐H, Random, 95% CI) | 0.66 [0.34, 1.30] |
| 18.1 Less than 20 weeks of pregnancy | 3 | 1149 | Risk Ratio (M‐H, Random, 95% CI) | 0.73 [0.26, 2.04] |
| 18.2 20 weeks of pregnancy or more | 4 | 491 | Risk Ratio (M‐H, Random, 95% CI) | 0.49 [0.13, 1.87] |
| 18.3 Unknown/unreported/mixed | 0 | 0 | Risk Ratio (M‐H, Random, 95% CI) | 0.0 [0.0, 0.0] |
| 19 Preterm birth (less than 37 weeks' gestation) (by pre‐gestational BMI) Show forest plot | 7 | 1640 | Risk Ratio (M‐H, Random, 95% CI) | 0.66 [0.34, 1.30] |
| 19.1 Underweight (lower than 18.5) | 0 | 0 | Risk Ratio (M‐H, Random, 95% CI) | 0.0 [0.0, 0.0] |
| 19.2 Normal weight (18.5 to 24.9) | 0 | 0 | Risk Ratio (M‐H, Random, 95% CI) | 0.0 [0.0, 0.0] |
| 19.3 Overweight (25 or higher) | 2 | 138 | Risk Ratio (M‐H, Random, 95% CI) | 0.60 [0.15, 2.46] |
| 19.4 Unknown/unreported/mixed | 5 | 1502 | Risk Ratio (M‐H, Random, 95% CI) | 0.64 [0.27, 1.54] |
| 20 Preterm birth (less than 37 weeks' gestation) (by supplementation scheme/regimen) Show forest plot | 7 | 1640 | Risk Ratio (M‐H, Random, 95% CI) | 0.66 [0.34, 1.30] |
| 20.1 Single dose | 0 | 0 | Risk Ratio (M‐H, Random, 95% CI) | 0.0 [0.0, 0.0] |
| 20.2 Daily | 6 | 1495 | Risk Ratio (M‐H, Random, 95% CI) | 0.61 [0.23, 1.58] |
| 20.3 Weekly/monthly | 1 | 145 | Risk Ratio (M‐H, Random, 95% CI) | 0.70 [0.32, 1.54] |
| 21 Preterm birth (less than 37 weeks' gestation) (by skin pigmentation based on Fitzpatrick skin tone chart) Show forest plot | 9 | 1943 | Risk Ratio (M‐H, Random, 95% CI) | 0.52 [0.30, 0.91] |
| 21.1 Three or less | 0 | 0 | Risk Ratio (M‐H, Random, 95% CI) | 0.0 [0.0, 0.0] |
| 21.2 Four or more | 0 | 0 | Risk Ratio (M‐H, Random, 95% CI) | 0.0 [0.0, 0.0] |
| 21.3 Unknown/unreported/mixed | 9 | 1943 | Risk Ratio (M‐H, Random, 95% CI) | 0.52 [0.30, 0.91] |
| 22 Preterm birth (less than 37 weeks' gestation) (by latitude) Show forest plot | 7 | 1640 | Risk Ratio (M‐H, Random, 95% CI) | 0.66 [0.34, 1.30] |
| 22.1 Between Tropics of Cancer and Capricorn | 2 | 358 | Risk Ratio (M‐H, Random, 95% CI) | 0.25 [0.05, 1.34] |
| 22.2 North of the Tropic of Cancer or South of the Tropic of Capricorn | 5 | 1282 | Risk Ratio (M‐H, Random, 95% CI) | 0.99 [0.59, 1.66] |
| 22.3 Unknown/unreported | 0 | 0 | Risk Ratio (M‐H, Random, 95% CI) | 0.0 [0.0, 0.0] |
| 23 Preterm birth (less than 37 weeks' gestation) (by season at the start of supplementation) Show forest plot | 7 | 1640 | Risk Ratio (M‐H, Random, 95% CI) | 0.66 [0.34, 1.30] |
| 23.1 Summer | 2 | 199 | Risk Ratio (M‐H, Random, 95% CI) | 0.72 [0.34, 1.53] |
| 23.2 Winter | 1 | 34 | Risk Ratio (M‐H, Random, 95% CI) | 0.0 [0.0, 0.0] |
| 23.3 Mixed/unknown | 4 | 1407 | Risk Ratio (M‐H, Random, 95% CI) | 0.55 [0.19, 1.66] |
| 24 Low birthweight (less than 2500 g) (by start of supplementation) Show forest plot | 3 | 491 | Risk Ratio (M‐H, Random, 95% CI) | 0.39 [0.24, 0.65] |
| 24.1 Less than 20 weeks of pregnancy | 0 | 0 | Risk Ratio (M‐H, Random, 95% CI) | 0.0 [0.0, 0.0] |
| 24.2 20 weeks of pregnancy or more | 3 | 491 | Risk Ratio (M‐H, Random, 95% CI) | 0.39 [0.24, 0.65] |
| 24.3 Unknown/unreported/mixed | 0 | 0 | Risk Ratio (M‐H, Random, 95% CI) | 0.0 [0.0, 0.0] |
| 25 Low birthweight (less than 2500 g) (by pre‐gestational BMI) Show forest plot | 3 | 491 | Risk Ratio (M‐H, Random, 95% CI) | 0.39 [0.24, 0.65] |
| 25.1 Underweight (lower than 18.5) | 0 | 0 | Risk Ratio (M‐H, Random, 95% CI) | 0.0 [0.0, 0.0] |
| 25.2 Normal weight (18.5 to 24.9) | 1 | 165 | Risk Ratio (M‐H, Random, 95% CI) | 0.43 [0.19, 0.98] |
| 25.3 Overweight (25 or higher) | 0 | 0 | Risk Ratio (M‐H, Random, 95% CI) | 0.0 [0.0, 0.0] |
| 25.4 Unknown/unreported/mixed | 2 | 326 | Risk Ratio (M‐H, Random, 95% CI) | 0.35 [0.14, 0.88] |
| 26 Low birthweight (less than 2500 g) (by supplementation scheme/regimen) Show forest plot | 3 | 491 | Risk Ratio (M‐H, Random, 95% CI) | 0.39 [0.24, 0.65] |
| 26.1 Single dose | 2 | 365 | Risk Ratio (M‐H, Random, 95% CI) | 0.32 [0.16, 0.65] |
| 26.2 Daily | 1 | 126 | Risk Ratio (M‐H, Random, 95% CI) | 0.53 [0.23, 1.21] |
| 26.3 Weekly/monthly | 0 | 0 | Risk Ratio (M‐H, Random, 95% CI) | 0.0 [0.0, 0.0] |
| 27 Low birthweight (less than 2500 g) (by skin pigmentation based on Fitzpatrick skin to Show forest plot | 3 | 491 | Risk Ratio (M‐H, Random, 95% CI) | 0.39 [0.24, 0.65] |
| 27.1 Three or less | 0 | 0 | Risk Ratio (M‐H, Random, 95% CI) | 0.0 [0.0, 0.0] |
| 27.2 Four or more | 0 | 0 | Risk Ratio (M‐H, Random, 95% CI) | 0.0 [0.0, 0.0] |
| 27.3 Unknown/unreported/mixed | 3 | 491 | Risk Ratio (M‐H, Random, 95% CI) | 0.39 [0.24, 0.65] |
| 28 Low birthweight (less than 2500 g) (by latitude) Show forest plot | 3 | 491 | Risk Ratio (M‐H, Random, 95% CI) | 0.39 [0.24, 0.65] |
| 28.1 Between Tropics of Cancer and Capricorn | 0 | 0 | Risk Ratio (M‐H, Random, 95% CI) | 0.0 [0.0, 0.0] |
| 28.2 North of the Tropic of Cancer or South of the Tropic of Capricorn | 3 | 491 | Risk Ratio (M‐H, Random, 95% CI) | 0.39 [0.24, 0.65] |
| 28.3 Unknown/unreported | 0 | 0 | Risk Ratio (M‐H, Random, 95% CI) | 0.0 [0.0, 0.0] |
| 29 Low birthweight (less than 2500 g) (by season at the start of pregnancy) Show forest plot | 3 | 491 | Risk Ratio (M‐H, Random, 95% CI) | 0.39 [0.24, 0.65] |
| 29.1 Summer | 0 | 0 | Risk Ratio (M‐H, Random, 95% CI) | 0.0 [0.0, 0.0] |
| 29.2 Fall | 0 | 0 | Risk Ratio (M‐H, Random, 95% CI) | 0.0 [0.0, 0.0] |
| 29.3 Winter | 0 | 0 | Risk Ratio (M‐H, Random, 95% CI) | 0.0 [0.0, 0.0] |
| 29.4 Mixed/unknown | 3 | 491 | Risk Ratio (M‐H, Random, 95% CI) | 0.39 [0.24, 0.65] |
| 30 Caesarean section Show forest plot | 10 | 1104 | Risk Ratio (M‐H, Random, 95% CI) | 0.98 [0.80, 1.21] |
| 31 Gestational hypertension Show forest plot | 2 | 1130 | Risk Ratio (M‐H, Random, 95% CI) | 0.78 [0.41, 1.49] |
| 32 Maternal death (death while pregnant or within 42 days of termination of pregnancy) (ALL) Show forest plot | 1 | 180 | Risk Ratio (M‐H, Random, 95% CI) | 0.0 [0.0, 0.0] |
| 33 Maternal vitamin D concentration at term (25‐hydroxyvitamin D) (nmol/L) (ALL) Show forest plot | 14 | 2470 | Mean Difference (IV, Random, 95% CI) | 35.66 [24.19, 47.13] |
| 34 Birth length (cm) Show forest plot | 8 | 931 | Mean Difference (IV, Random, 95% CI) | 0.57 [0.19, 0.95] |
| 35 Head circumference at birth (cm) Show forest plot | 8 | 1841 | Mean Difference (IV, Random, 95% CI) | 0.11 [‐0.21, 0.44] |
| 36 Birthweight (g) Show forest plot | 17 | 2828 | Mean Difference (IV, Random, 95% CI) | 80.30 [‐14.40, 175.00] |
| 37 Stillbirth Show forest plot | 3 | 584 | Risk Ratio (M‐H, Random, 95% CI) | 0.35 [0.06, 1.98] |
| 38 Neonatal death Show forest plot | 2 | 326 | Risk Ratio (M‐H, Random, 95% CI) | 0.27 [0.04, 1.67] |
| 39 Apgar score less than seven at five minutes Show forest plot | 1 | 165 | Risk Ratio (M‐H, Random, 95% CI) | 0.53 [0.11, 2.53] |
| Outcome or subgroup title | No. of studies | No. of participants | Statistical method | Effect size |
| 1 Pre‐eclampsia (ALL) Show forest plot | 4 | 1174 | Risk Ratio (M‐H, Random, 95% CI) | 0.50 [0.32, 0.78] |
| 2 Gestational diabetes (ALL) Show forest plot | 1 | 54 | Risk Ratio (M‐H, Random, 95% CI) | 0.33 [0.01, 7.84] |
| 3 Preterm birth (less than 37 weeks' gestation) (ALL) Show forest plot | 5 | 942 | Risk Ratio (M‐H, Random, 95% CI) | 1.52 [1.01, 2.28] |
| 4 Low birthweight (less than 2500 g) (ALL) Show forest plot | 2 | 110 | Risk Ratio (M‐H, Random, 95% CI) | 0.68 [0.10, 4.55] |
| 5 Caesarean section Show forest plot | 2 | 146 | Risk Ratio (M‐H, Random, 95% CI) | 1.16 [0.87, 1.54] |
| 6 Gestational hypertension Show forest plot | 1 | 59 | Risk Ratio (M‐H, Random, 95% CI) | 0.26 [0.06, 1.12] |
| 7 Maternal vitamin D concentration at term (25‐hydroxyvitamin D) (nmol/L) (ALL) Show forest plot | 1 | 60 | Mean Difference (IV, Random, 95% CI) | 12.5 [3.80, 21.20] |
| 8 Birth length (cm) Show forest plot | 3 | 194 | Mean Difference (IV, Random, 95% CI) | ‐0.07 [‐0.67, 0.52] |
| 9 Head circumference at birth (cm) Show forest plot | 3 | 198 | Mean Difference (IV, Random, 95% CI) | ‐0.03 [‐0.39, 0.33] |
| 10 Birthweight (g) Show forest plot | 3 | 194 | Mean Difference (IV, Random, 95% CI) | 42.39 [‐86.96, 171.74] |
| 11 Neonatal death Show forest plot | 1 | 660 | Risk Ratio (M‐H, Random, 95% CI) | 0.2 [0.01, 4.15] |
| Outcome or subgroup title | No. of studies | No. of participants | Statistical method | Effect size |
| 1 Gestational diabetes (ALL) Show forest plot | 1 | 1298 | Risk Ratio (M‐H, Random, 95% CI) | 0.42 [0.10, 1.73] |
| 2 Maternal adverse events Show forest plot | 1 | Risk Ratio (M‐H, Random, 95% CI) | Subtotals only | |
| 2.1 Hypercalcaemia | 1 | 1298 | Risk Ratio (M‐H, Random, 95% CI) | 0.0 [0.0, 0.0] |
| 2.2 Hypercalciuria | 1 | 1298 | Risk Ratio (M‐H, Random, 95% CI) | 0.25 [0.02, 3.97] |
| 3 Preterm birth (less than 37 weeks' gestation) (ALL) Show forest plot | 1 | 1298 | Risk Ratio (M‐H, Random, 95% CI) | 1.04 [0.68, 1.59] |
| 4 Low birthweight (less than 2500 g) (ALL) Show forest plot | 1 | 1298 | Risk Ratio (M‐H, Random, 95% CI) | 1.12 [0.82, 1.51] |
| 5 Caesarean section Show forest plot | 1 | 1298 | Risk Ratio (M‐H, Random, 95% CI) | 1.10 [0.95, 1.27] |
| 6 Gestational hypertension Show forest plot | 1 | 1298 | Risk Ratio (M‐H, Random, 95% CI) | 0.93 [0.31, 2.79] |
| 7 Maternal death (death while pregnant or within 42 days of termination of pregnancy) Show forest plot | 1 | 1300 | Risk Ratio (M‐H, Random, 95% CI) | 0.25 [0.02, 3.98] |
| 8 Maternal vitamin D concentration at term (25‐hydroxyvitamin D) (nmol/L) (ALL) Show forest plot | 1 | 635 | Mean Difference (IV, Random, 95% CI) | 75.17 [71.97, 78.37] |
| 9 Birth length (cm) Show forest plot | 1 | 1297 | Mean Difference (IV, Fixed, 95% CI) | 0.0 [‐0.28, 0.28] |
| 10 Head circumference at birth (cm) Show forest plot | 1 | 1297 | Mean Difference (IV, Random, 95% CI) | 0.0 [‐0.17, 0.17] |
| 11 Birthweight (g) Show forest plot | 1 | 1297 | Mean Difference (IV, Random, 95% CI) | ‐7.0 [‐55.95, 41.95] |
| 12 Stillbirth Show forest plot | 1 | 1300 | Risk Ratio (M‐H, Random, 95% CI) | 0.66 [0.29, 1.46] |
| 13 Neonatal death Show forest plot | 1 | 1298 | Risk Ratio (M‐H, Random, 95% CI) | 0.69 [0.22, 2.14] |