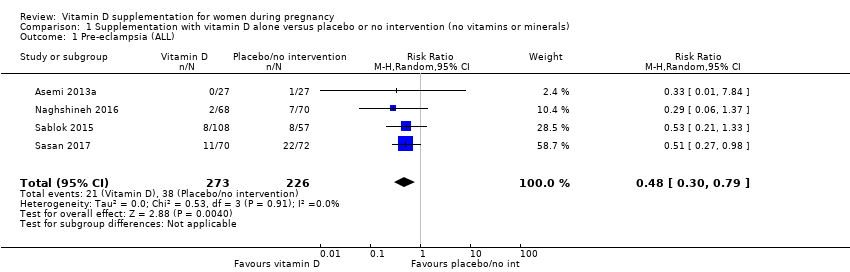
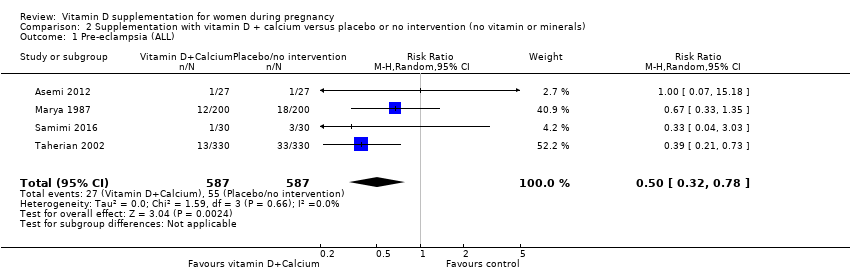
| 1 Pre‐eclampsia (ALL) Show forest plot | 4 | 499 | Risk Ratio (M‐H, Random, 95% CI) | 0.48 [0.30, 0.79] |
|
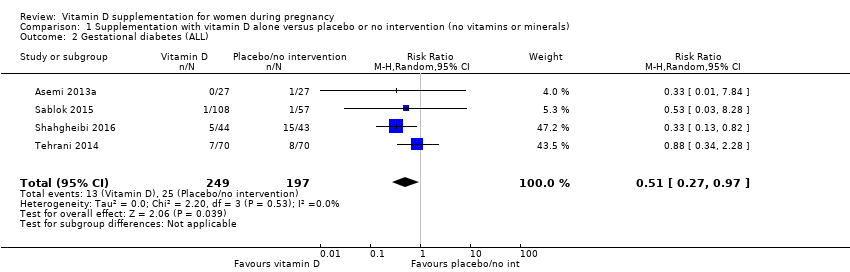
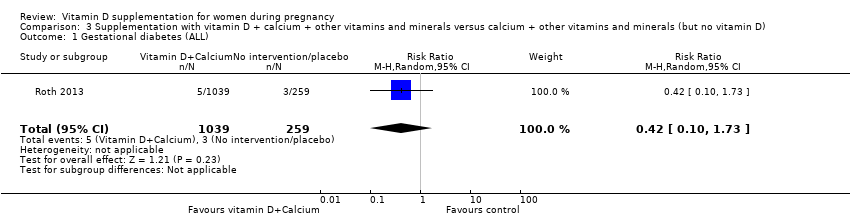
| 2 Gestational diabetes (ALL) Show forest plot | 4 | 446 | Risk Ratio (M‐H, Random, 95% CI) | 0.51 [0.27, 0.97] |
|
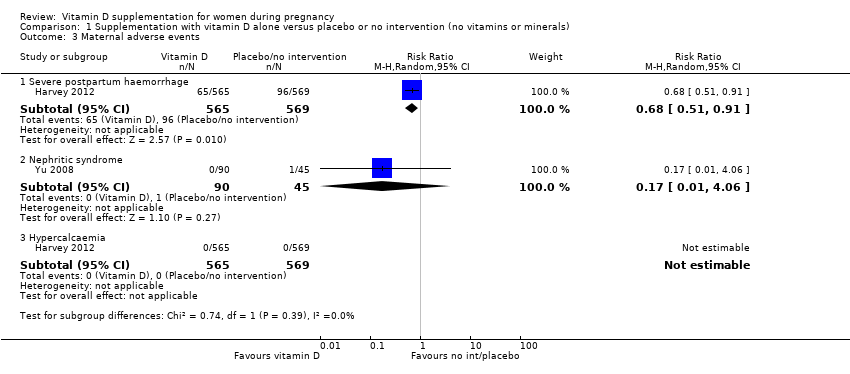
| 3 Maternal adverse events Show forest plot | 2 | | Risk Ratio (M‐H, Random, 95% CI) | Subtotals only |
|
| 3.1 Severe postpartum haemorrhage | 1 | 1134 | Risk Ratio (M‐H, Random, 95% CI) | 0.68 [0.51, 0.91] |
| 3.2 Nephritic syndrome | 1 | 135 | Risk Ratio (M‐H, Random, 95% CI) | 0.17 [0.01, 4.06] |
| 3.3 Hypercalcaemia | 1 | 1134 | Risk Ratio (M‐H, Random, 95% CI) | 0.0 [0.0, 0.0] |
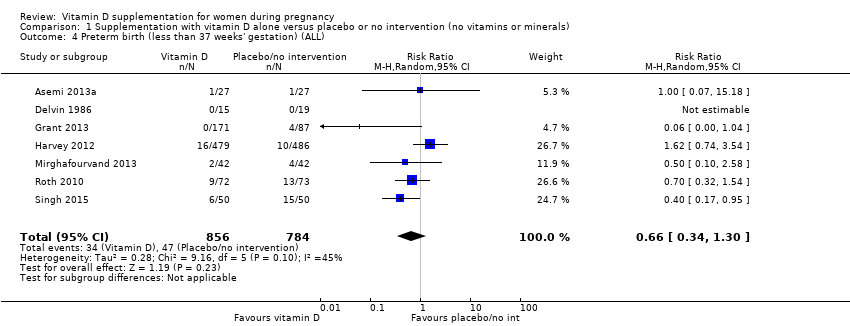
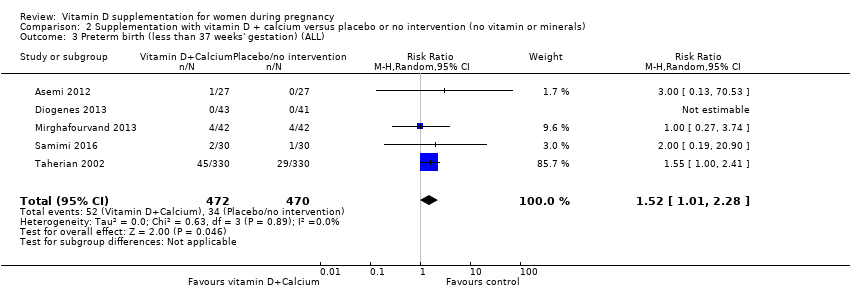
| 4 Preterm birth (less than 37 weeks' gestation) (ALL) Show forest plot | 7 | 1640 | Risk Ratio (M‐H, Random, 95% CI) | 0.66 [0.34, 1.30] |
|
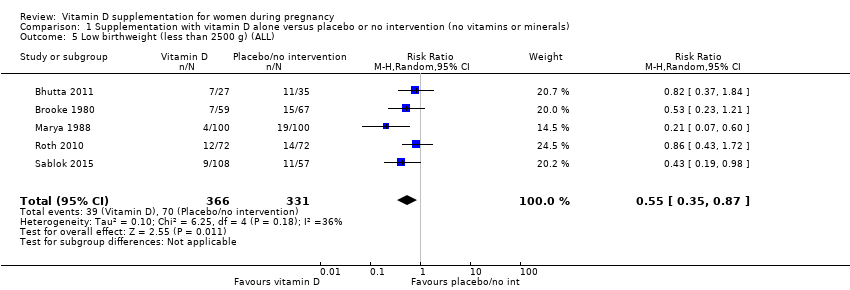
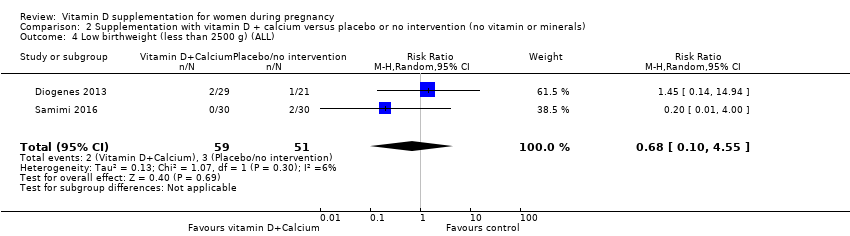
| 5 Low birthweight (less than 2500 g) (ALL) Show forest plot | 5 | 697 | Risk Ratio (M‐H, Random, 95% CI) | 0.55 [0.35, 0.87] |
|
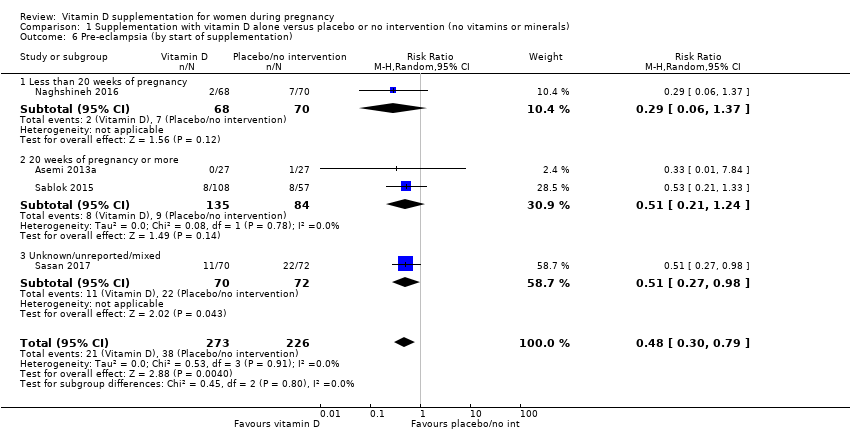
| 6 Pre‐eclampsia (by start of supplementation) Show forest plot | 4 | 499 | Risk Ratio (M‐H, Random, 95% CI) | 0.48 [0.30, 0.79] |
|
| 6.1 Less than 20 weeks of pregnancy | 1 | 138 | Risk Ratio (M‐H, Random, 95% CI) | 0.29 [0.06, 1.37] |
| 6.2 20 weeks of pregnancy or more | 2 | 219 | Risk Ratio (M‐H, Random, 95% CI) | 0.51 [0.21, 1.24] |
| 6.3 Unknown/unreported/mixed | 1 | 142 | Risk Ratio (M‐H, Random, 95% CI) | 0.51 [0.27, 0.98] |
| 7 Pre‐eclampsia (by pre‐gestational BMI) Show forest plot | 4 | 499 | Risk Ratio (M‐H, Random, 95% CI) | 0.48 [0.30, 0.79] |
|
| 7.1 Underweight (lower than 18.5) | 0 | 0 | Risk Ratio (M‐H, Random, 95% CI) | 0.0 [0.0, 0.0] |
| 7.2 Normal weight (18.5 to 24.9) | 1 | 165 | Risk Ratio (M‐H, Random, 95% CI) | 0.53 [0.21, 1.33] |
| 7.3 Overweight (25 or higher) | 1 | 54 | Risk Ratio (M‐H, Random, 95% CI) | 0.33 [0.01, 7.84] |
| 7.4 Unknown/unreported/mixed | 2 | 280 | Risk Ratio (M‐H, Random, 95% CI) | 0.47 [0.26, 0.86] |
| 8 Pre‐eclampsia (by supplementation scheme/regimen) Show forest plot | 4 | 499 | Risk Ratio (M‐H, Random, 95% CI) | 0.48 [0.30, 0.79] |
|
| 8.1 Single dose | 1 | 165 | Risk Ratio (M‐H, Random, 95% CI) | 0.53 [0.21, 1.33] |
| 8.2 Daily | 2 | 192 | Risk Ratio (M‐H, Random, 95% CI) | 0.30 [0.08, 1.20] |
| 8.3 Weekly/monthly | 1 | 142 | Risk Ratio (M‐H, Random, 95% CI) | 0.51 [0.27, 0.98] |
| 9 Pre‐eclampsia (by skin pigmentation based on Fitzpatrick skin tone chart) Show forest plot | 4 | 499 | Risk Ratio (M‐H, Random, 95% CI) | 0.48 [0.30, 0.79] |
|
| 9.1 Three or less | 0 | 0 | Risk Ratio (M‐H, Random, 95% CI) | 0.0 [0.0, 0.0] |
| 9.2 Four or more | 0 | 0 | Risk Ratio (M‐H, Random, 95% CI) | 0.0 [0.0, 0.0] |
| 9.3 Unknown/unreported/mixed | 4 | 499 | Risk Ratio (M‐H, Random, 95% CI) | 0.48 [0.30, 0.79] |
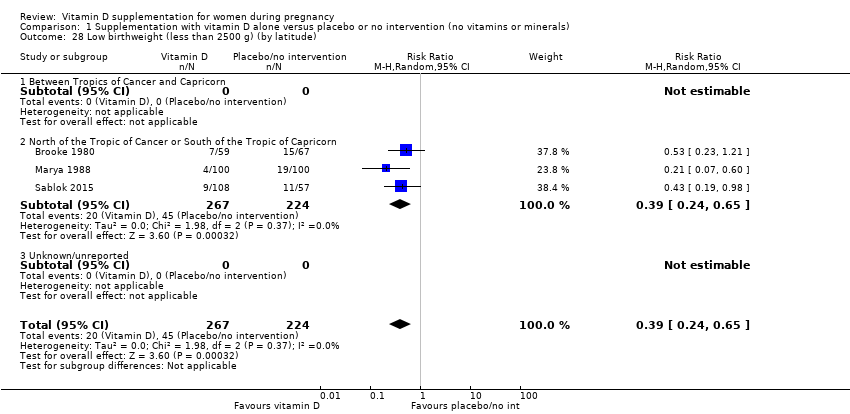
| 10 Pre‐eclampsia (by latitude) Show forest plot | 4 | 499 | Risk Ratio (M‐H, Random, 95% CI) | 0.48 [0.30, 0.79] |
|
| 10.1 Between Tropics of Cancer and Capricorn | 0 | 0 | Risk Ratio (M‐H, Random, 95% CI) | 0.0 [0.0, 0.0] |
| 10.2 North of the Tropic of Cancer or South of the Tropic of Capricorn | 4 | 499 | Risk Ratio (M‐H, Random, 95% CI) | 0.48 [0.30, 0.79] |
| 10.3 Unknown/unreported | 0 | 0 | Risk Ratio (M‐H, Random, 95% CI) | 0.0 [0.0, 0.0] |
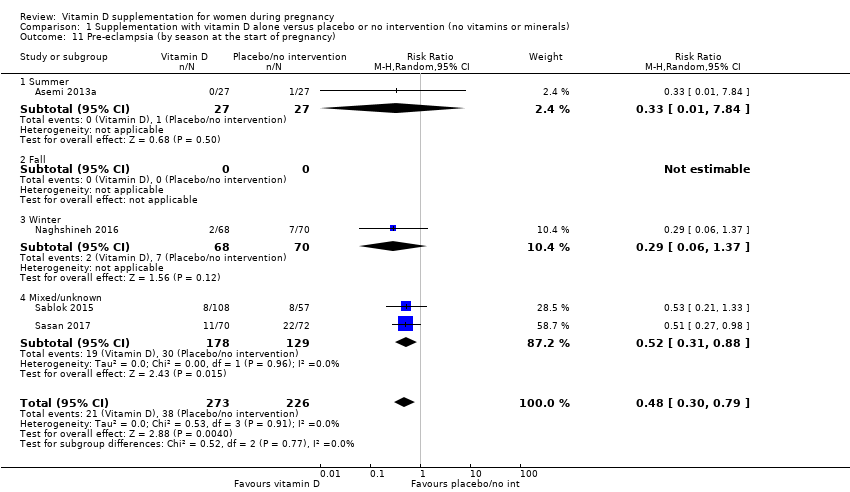
| 11 Pre‐eclampsia (by season at the start of pregnancy) Show forest plot | 4 | 499 | Risk Ratio (M‐H, Random, 95% CI) | 0.48 [0.30, 0.79] |
|
| 11.1 Summer | 1 | 54 | Risk Ratio (M‐H, Random, 95% CI) | 0.33 [0.01, 7.84] |
| 11.2 Fall | 0 | 0 | Risk Ratio (M‐H, Random, 95% CI) | 0.0 [0.0, 0.0] |
| 11.3 Winter | 1 | 138 | Risk Ratio (M‐H, Random, 95% CI) | 0.29 [0.06, 1.37] |
| 11.4 Mixed/unknown | 2 | 307 | Risk Ratio (M‐H, Random, 95% CI) | 0.52 [0.31, 0.88] |
| 12 Gestational diabetes (by start of supplementation) Show forest plot | 4 | 446 | Risk Ratio (M‐H, Random, 95% CI) | 0.51 [0.27, 0.97] |
|
| 12.1 Less than 20 weeks of pregnancy | 1 | 140 | Risk Ratio (M‐H, Random, 95% CI) | 0.88 [0.34, 2.28] |
| 12.2 20 weeks of pregnancy or more | 2 | 219 | Risk Ratio (M‐H, Random, 95% CI) | 0.43 [0.05, 3.45] |
| 12.3 Unknown/unreported/mixed | 1 | 87 | Risk Ratio (M‐H, Random, 95% CI) | 0.33 [0.13, 0.82] |
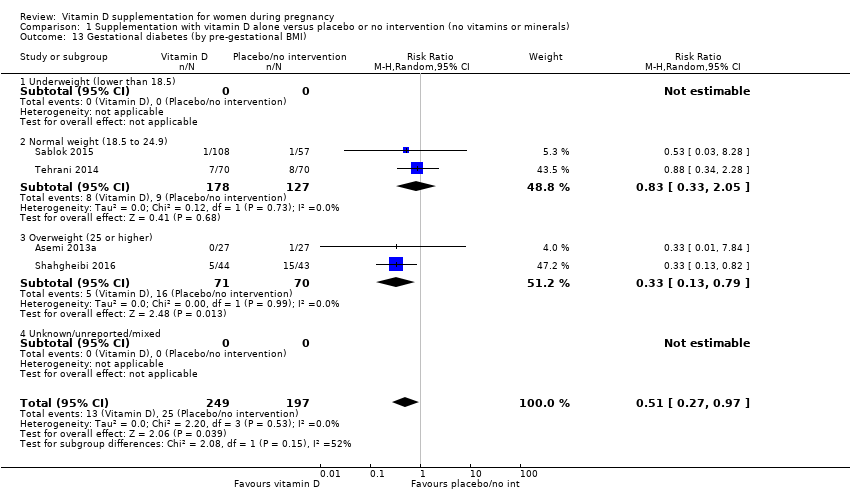
| 13 Gestational diabetes (by pre‐gestational BMI) Show forest plot | 4 | 446 | Risk Ratio (M‐H, Random, 95% CI) | 0.51 [0.27, 0.97] |
|
| 13.1 Underweight (lower than 18.5) | 0 | 0 | Risk Ratio (M‐H, Random, 95% CI) | 0.0 [0.0, 0.0] |
| 13.2 Normal weight (18.5 to 24.9) | 2 | 305 | Risk Ratio (M‐H, Random, 95% CI) | 0.83 [0.33, 2.05] |
| 13.3 Overweight (25 or higher) | 2 | 141 | Risk Ratio (M‐H, Random, 95% CI) | 0.33 [0.13, 0.79] |
| 13.4 Unknown/unreported/mixed | 0 | 0 | Risk Ratio (M‐H, Random, 95% CI) | 0.0 [0.0, 0.0] |
| 14 Gestational diabetes (by supplementation scheme/regimen) Show forest plot | 4 | 446 | Risk Ratio (M‐H, Random, 95% CI) | 0.51 [0.27, 0.97] |
|
| 14.1 Single dose | 1 | 165 | Risk Ratio (M‐H, Random, 95% CI) | 0.53 [0.03, 8.28] |
| 14.2 Daily | 2 | 141 | Risk Ratio (M‐H, Random, 95% CI) | 0.33 [0.13, 0.79] |
| 14.3 Weekly/monthly | 1 | 140 | Risk Ratio (M‐H, Random, 95% CI) | 0.88 [0.34, 2.28] |
| 15 Gestational diabetes (by skin pigmentation based on Fitzpatrick skin tone chart) Show forest plot | 4 | 446 | Risk Ratio (M‐H, Random, 95% CI) | 0.51 [0.27, 0.97] |
|
| 15.1 Three or less | 0 | 0 | Risk Ratio (M‐H, Random, 95% CI) | 0.0 [0.0, 0.0] |
| 15.2 Four or more | 0 | 0 | Risk Ratio (M‐H, Random, 95% CI) | 0.0 [0.0, 0.0] |
| 15.3 Unknown/unreported/mixed | 4 | 446 | Risk Ratio (M‐H, Random, 95% CI) | 0.51 [0.27, 0.97] |
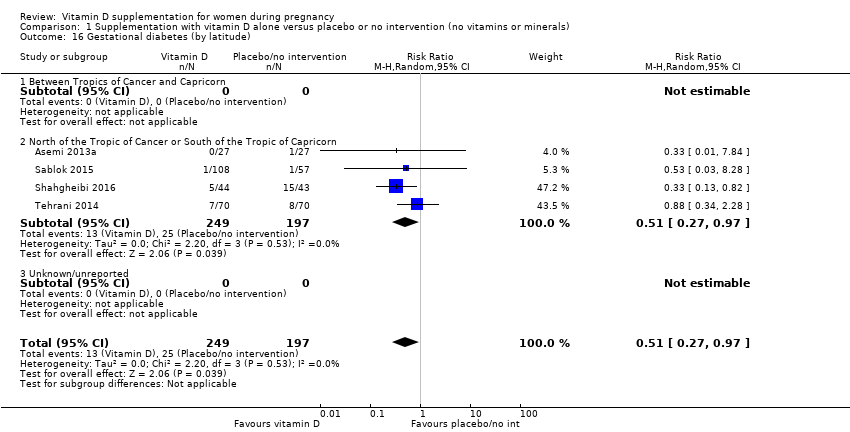
| 16 Gestational diabetes (by latitude) Show forest plot | 4 | 446 | Risk Ratio (M‐H, Random, 95% CI) | 0.51 [0.27, 0.97] |
|
| 16.1 Between Tropics of Cancer and Capricorn | 0 | 0 | Risk Ratio (M‐H, Random, 95% CI) | 0.0 [0.0, 0.0] |
| 16.2 North of the Tropic of Cancer or South of the Tropic of Capricorn | 4 | 446 | Risk Ratio (M‐H, Random, 95% CI) | 0.51 [0.27, 0.97] |
| 16.3 Unknown/unreported | 0 | 0 | Risk Ratio (M‐H, Random, 95% CI) | 0.0 [0.0, 0.0] |
| 17 Gestational diabetes (by season at the start of supplementation) Show forest plot | 4 | 446 | Risk Ratio (M‐H, Random, 95% CI) | 0.51 [0.27, 0.97] |
|
| 17.1 Summer | 1 | 54 | Risk Ratio (M‐H, Random, 95% CI) | 0.33 [0.01, 7.84] |
| 17.2 Fall | 0 | 0 | Risk Ratio (M‐H, Random, 95% CI) | 0.0 [0.0, 0.0] |
| 17.3 Winter | 1 | 140 | Risk Ratio (M‐H, Random, 95% CI) | 0.88 [0.34, 2.28] |
| 17.4 Mixed/unknown | 2 | 252 | Risk Ratio (M‐H, Random, 95% CI) | 0.34 [0.14, 0.82] |
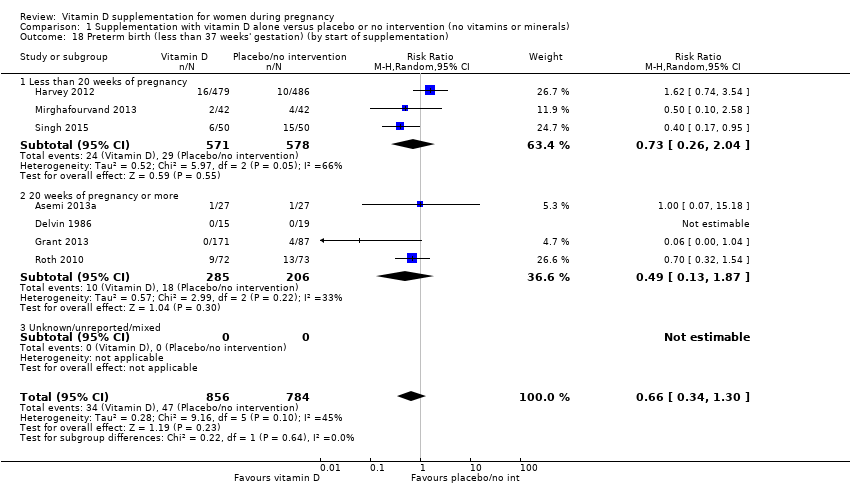
| 18 Preterm birth (less than 37 weeks' gestation) (by start of supplementation) Show forest plot | 7 | 1640 | Risk Ratio (M‐H, Random, 95% CI) | 0.66 [0.34, 1.30] |
|
| 18.1 Less than 20 weeks of pregnancy | 3 | 1149 | Risk Ratio (M‐H, Random, 95% CI) | 0.73 [0.26, 2.04] |
| 18.2 20 weeks of pregnancy or more | 4 | 491 | Risk Ratio (M‐H, Random, 95% CI) | 0.49 [0.13, 1.87] |
| 18.3 Unknown/unreported/mixed | 0 | 0 | Risk Ratio (M‐H, Random, 95% CI) | 0.0 [0.0, 0.0] |
| 19 Preterm birth (less than 37 weeks' gestation) (by pre‐gestational BMI) Show forest plot | 7 | 1640 | Risk Ratio (M‐H, Random, 95% CI) | 0.66 [0.34, 1.30] |
|
| 19.1 Underweight (lower than 18.5) | 0 | 0 | Risk Ratio (M‐H, Random, 95% CI) | 0.0 [0.0, 0.0] |
| 19.2 Normal weight (18.5 to 24.9) | 0 | 0 | Risk Ratio (M‐H, Random, 95% CI) | 0.0 [0.0, 0.0] |
| 19.3 Overweight (25 or higher) | 2 | 138 | Risk Ratio (M‐H, Random, 95% CI) | 0.60 [0.15, 2.46] |
| 19.4 Unknown/unreported/mixed | 5 | 1502 | Risk Ratio (M‐H, Random, 95% CI) | 0.64 [0.27, 1.54] |
| 20 Preterm birth (less than 37 weeks' gestation) (by supplementation scheme/regimen) Show forest plot | 7 | 1640 | Risk Ratio (M‐H, Random, 95% CI) | 0.66 [0.34, 1.30] |
|
| 20.1 Single dose | 0 | 0 | Risk Ratio (M‐H, Random, 95% CI) | 0.0 [0.0, 0.0] |
| 20.2 Daily | 6 | 1495 | Risk Ratio (M‐H, Random, 95% CI) | 0.61 [0.23, 1.58] |
| 20.3 Weekly/monthly | 1 | 145 | Risk Ratio (M‐H, Random, 95% CI) | 0.70 [0.32, 1.54] |
| 21 Preterm birth (less than 37 weeks' gestation) (by skin pigmentation based on Fitzpatrick skin tone chart) Show forest plot | 9 | 1943 | Risk Ratio (M‐H, Random, 95% CI) | 0.52 [0.30, 0.91] |
|
| 21.1 Three or less | 0 | 0 | Risk Ratio (M‐H, Random, 95% CI) | 0.0 [0.0, 0.0] |
| 21.2 Four or more | 0 | 0 | Risk Ratio (M‐H, Random, 95% CI) | 0.0 [0.0, 0.0] |
| 21.3 Unknown/unreported/mixed | 9 | 1943 | Risk Ratio (M‐H, Random, 95% CI) | 0.52 [0.30, 0.91] |
| 22 Preterm birth (less than 37 weeks' gestation) (by latitude) Show forest plot | 7 | 1640 | Risk Ratio (M‐H, Random, 95% CI) | 0.66 [0.34, 1.30] |
|
| 22.1 Between Tropics of Cancer and Capricorn | 2 | 358 | Risk Ratio (M‐H, Random, 95% CI) | 0.25 [0.05, 1.34] |
| 22.2 North of the Tropic of Cancer or South of the Tropic of Capricorn | 5 | 1282 | Risk Ratio (M‐H, Random, 95% CI) | 0.99 [0.59, 1.66] |
| 22.3 Unknown/unreported | 0 | 0 | Risk Ratio (M‐H, Random, 95% CI) | 0.0 [0.0, 0.0] |
| 23 Preterm birth (less than 37 weeks' gestation) (by season at the start of supplementation) Show forest plot | 7 | 1640 | Risk Ratio (M‐H, Random, 95% CI) | 0.66 [0.34, 1.30] |
|
| 23.1 Summer | 2 | 199 | Risk Ratio (M‐H, Random, 95% CI) | 0.72 [0.34, 1.53] |
| 23.2 Winter | 1 | 34 | Risk Ratio (M‐H, Random, 95% CI) | 0.0 [0.0, 0.0] |
| 23.3 Mixed/unknown | 4 | 1407 | Risk Ratio (M‐H, Random, 95% CI) | 0.55 [0.19, 1.66] |
| 24 Low birthweight (less than 2500 g) (by start of supplementation) Show forest plot | 3 | 491 | Risk Ratio (M‐H, Random, 95% CI) | 0.39 [0.24, 0.65] |
|
| 24.1 Less than 20 weeks of pregnancy | 0 | 0 | Risk Ratio (M‐H, Random, 95% CI) | 0.0 [0.0, 0.0] |
| 24.2 20 weeks of pregnancy or more | 3 | 491 | Risk Ratio (M‐H, Random, 95% CI) | 0.39 [0.24, 0.65] |
| 24.3 Unknown/unreported/mixed | 0 | 0 | Risk Ratio (M‐H, Random, 95% CI) | 0.0 [0.0, 0.0] |
| 25 Low birthweight (less than 2500 g) (by pre‐gestational BMI) Show forest plot | 3 | 491 | Risk Ratio (M‐H, Random, 95% CI) | 0.39 [0.24, 0.65] |
|
| 25.1 Underweight (lower than 18.5) | 0 | 0 | Risk Ratio (M‐H, Random, 95% CI) | 0.0 [0.0, 0.0] |
| 25.2 Normal weight (18.5 to 24.9) | 1 | 165 | Risk Ratio (M‐H, Random, 95% CI) | 0.43 [0.19, 0.98] |
| 25.3 Overweight (25 or higher) | 0 | 0 | Risk Ratio (M‐H, Random, 95% CI) | 0.0 [0.0, 0.0] |
| 25.4 Unknown/unreported/mixed | 2 | 326 | Risk Ratio (M‐H, Random, 95% CI) | 0.35 [0.14, 0.88] |
| 26 Low birthweight (less than 2500 g) (by supplementation scheme/regimen) Show forest plot | 3 | 491 | Risk Ratio (M‐H, Random, 95% CI) | 0.39 [0.24, 0.65] |
|
| 26.1 Single dose | 2 | 365 | Risk Ratio (M‐H, Random, 95% CI) | 0.32 [0.16, 0.65] |
| 26.2 Daily | 1 | 126 | Risk Ratio (M‐H, Random, 95% CI) | 0.53 [0.23, 1.21] |
| 26.3 Weekly/monthly | 0 | 0 | Risk Ratio (M‐H, Random, 95% CI) | 0.0 [0.0, 0.0] |
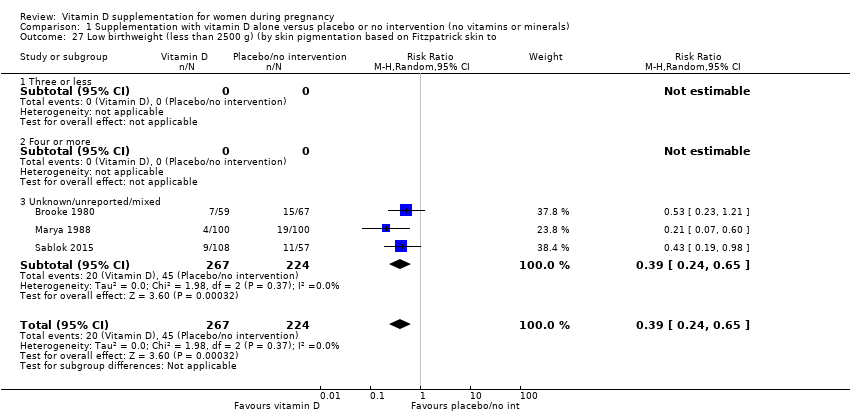
| 27 Low birthweight (less than 2500 g) (by skin pigmentation based on Fitzpatrick skin to Show forest plot | 3 | 491 | Risk Ratio (M‐H, Random, 95% CI) | 0.39 [0.24, 0.65] |
|
| 27.1 Three or less | 0 | 0 | Risk Ratio (M‐H, Random, 95% CI) | 0.0 [0.0, 0.0] |
| 27.2 Four or more | 0 | 0 | Risk Ratio (M‐H, Random, 95% CI) | 0.0 [0.0, 0.0] |
| 27.3 Unknown/unreported/mixed | 3 | 491 | Risk Ratio (M‐H, Random, 95% CI) | 0.39 [0.24, 0.65] |
| 28 Low birthweight (less than 2500 g) (by latitude) Show forest plot | 3 | 491 | Risk Ratio (M‐H, Random, 95% CI) | 0.39 [0.24, 0.65] |
|
| 28.1 Between Tropics of Cancer and Capricorn | 0 | 0 | Risk Ratio (M‐H, Random, 95% CI) | 0.0 [0.0, 0.0] |
| 28.2 North of the Tropic of Cancer or South of the Tropic of Capricorn | 3 | 491 | Risk Ratio (M‐H, Random, 95% CI) | 0.39 [0.24, 0.65] |
| 28.3 Unknown/unreported | 0 | 0 | Risk Ratio (M‐H, Random, 95% CI) | 0.0 [0.0, 0.0] |
| 29 Low birthweight (less than 2500 g) (by season at the start of pregnancy) Show forest plot | 3 | 491 | Risk Ratio (M‐H, Random, 95% CI) | 0.39 [0.24, 0.65] |
|
| 29.1 Summer | 0 | 0 | Risk Ratio (M‐H, Random, 95% CI) | 0.0 [0.0, 0.0] |
| 29.2 Fall | 0 | 0 | Risk Ratio (M‐H, Random, 95% CI) | 0.0 [0.0, 0.0] |
| 29.3 Winter | 0 | 0 | Risk Ratio (M‐H, Random, 95% CI) | 0.0 [0.0, 0.0] |
| 29.4 Mixed/unknown | 3 | 491 | Risk Ratio (M‐H, Random, 95% CI) | 0.39 [0.24, 0.65] |
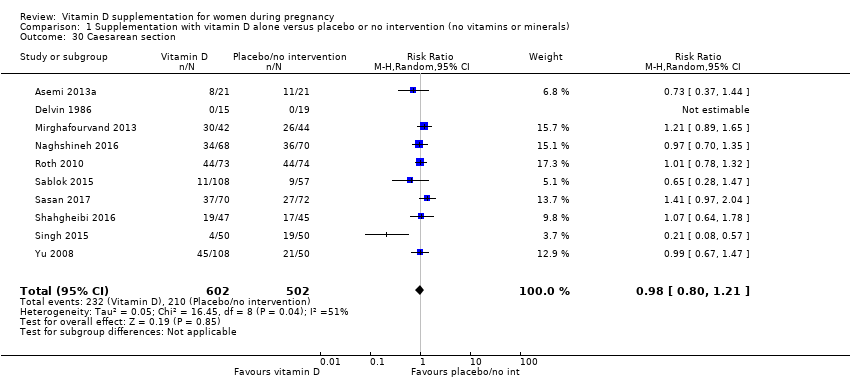
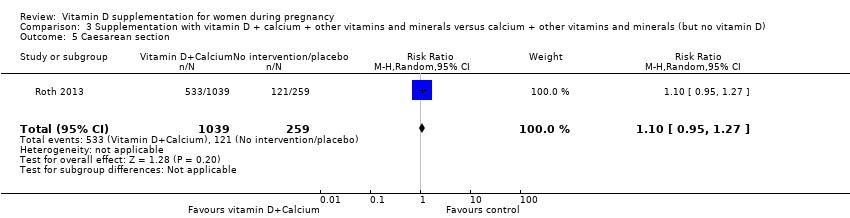
| 30 Caesarean section Show forest plot | 10 | 1104 | Risk Ratio (M‐H, Random, 95% CI) | 0.98 [0.80, 1.21] |
|
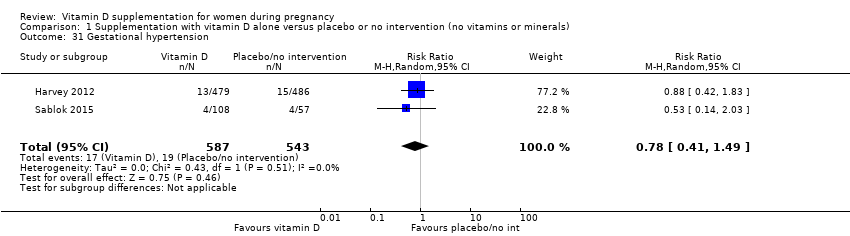
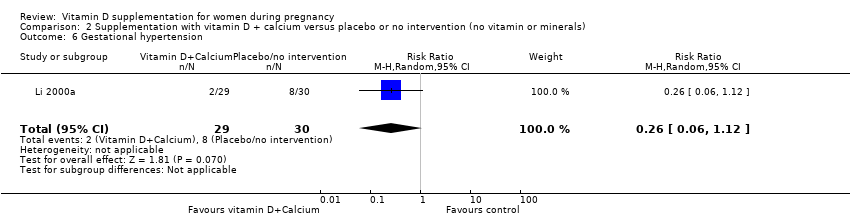
| 31 Gestational hypertension Show forest plot | 2 | 1130 | Risk Ratio (M‐H, Random, 95% CI) | 0.78 [0.41, 1.49] |
|
| 32 Maternal death (death while pregnant or within 42 days of termination of pregnancy) (ALL) Show forest plot | 1 | 180 | Risk Ratio (M‐H, Random, 95% CI) | 0.0 [0.0, 0.0] |
|
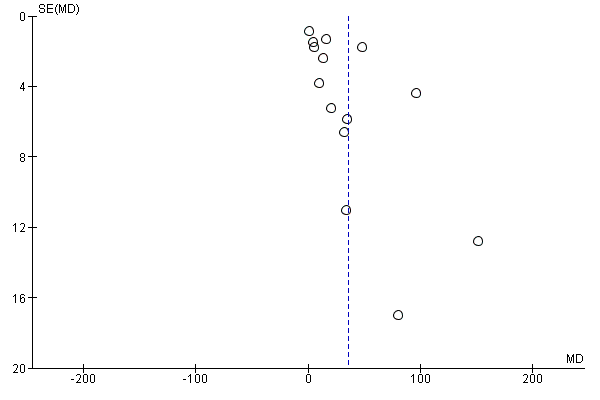
| 33 Maternal vitamin D concentration at term (25‐hydroxyvitamin D) (nmol/L) (ALL) Show forest plot | 14 | 2470 | Mean Difference (IV, Random, 95% CI) | 35.66 [24.19, 47.13] |
|
| 34 Birth length (cm) Show forest plot | 8 | 931 | Mean Difference (IV, Random, 95% CI) | 0.57 [0.19, 0.95] |
|
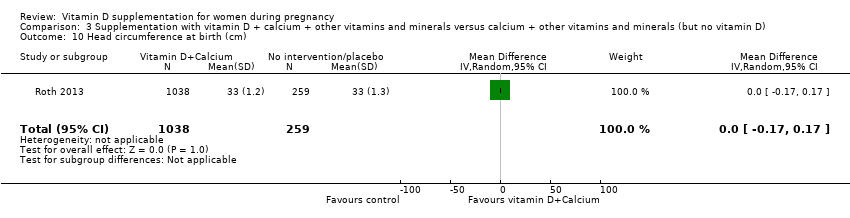
| 35 Head circumference at birth (cm) Show forest plot | 8 | 1841 | Mean Difference (IV, Random, 95% CI) | 0.11 [‐0.21, 0.44] |
|
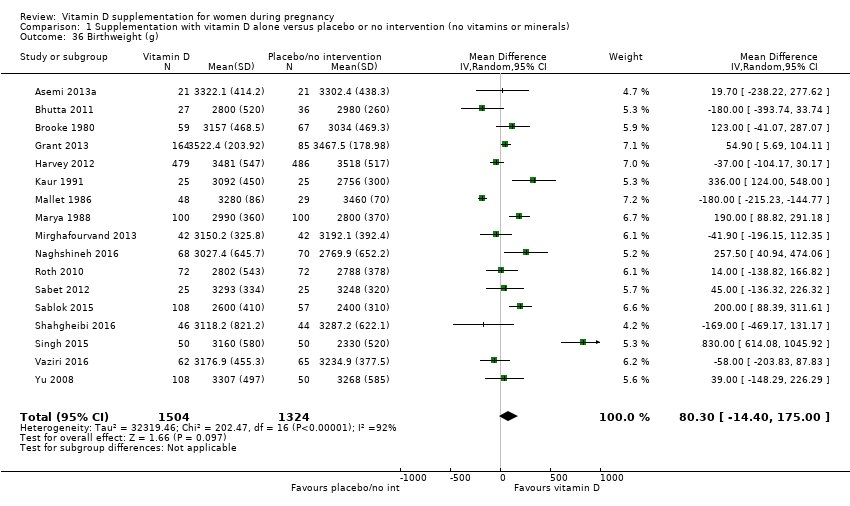
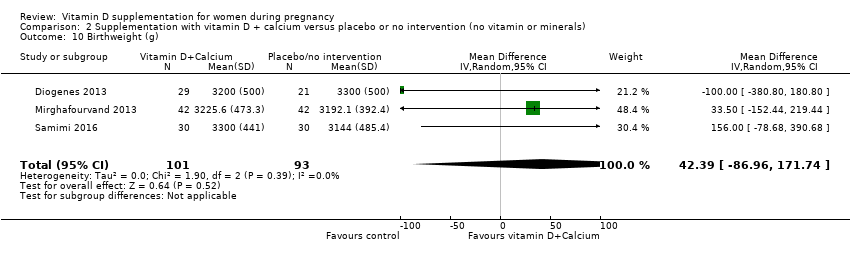
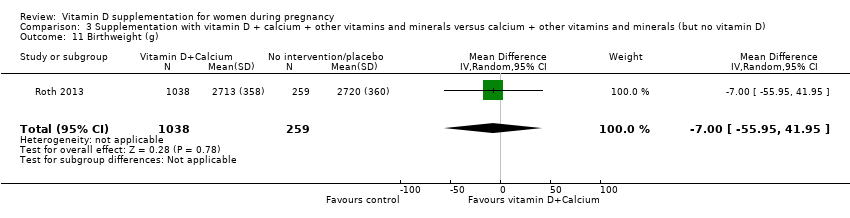
| 36 Birthweight (g) Show forest plot | 17 | 2828 | Mean Difference (IV, Random, 95% CI) | 80.30 [‐14.40, 175.00] |
|
| 37 Stillbirth Show forest plot | 3 | 584 | Risk Ratio (M‐H, Random, 95% CI) | 0.35 [0.06, 1.98] |
|
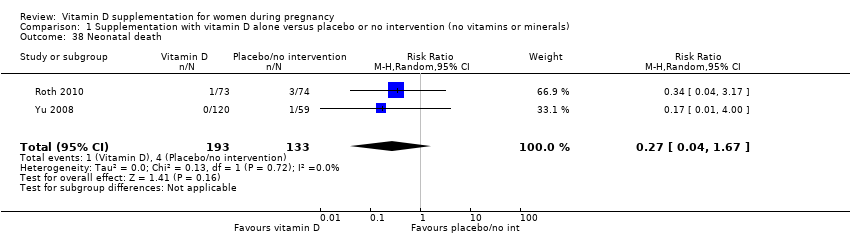
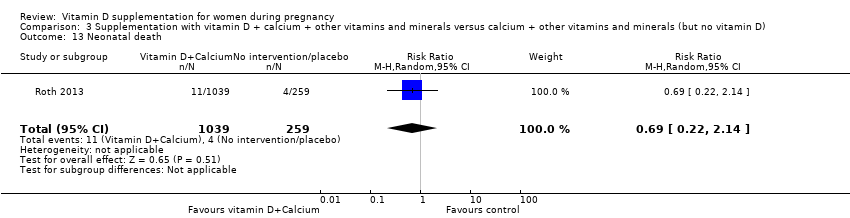
| 38 Neonatal death Show forest plot | 2 | 326 | Risk Ratio (M‐H, Random, 95% CI) | 0.27 [0.04, 1.67] |
|
| 39 Apgar score less than seven at five minutes Show forest plot | 1 | 165 | Risk Ratio (M‐H, Random, 95% CI) | 0.53 [0.11, 2.53] |
|