Administración de suplementos de vitamina D para embarazadas
Información
- DOI:
- https://doi.org/10.1002/14651858.CD008873.pub4Copiar DOI

- Base de datos:
-
- Cochrane Database of Systematic Reviews
- Versión publicada:
-
- 26 julio 2019see what's new
- Tipo:
-
- Intervention
- Etapa:
-
- Review
- Grupo Editorial Cochrane:
-
Grupo Cochrane de Embarazo y parto
- Copyright:
-
- Copyright © 2019 The Cochrane Collaboration. Published by John Wiley & Sons, Ltd.
Cifras del artículo
Altmetric:
Citado por:
Autores
Contributions of authors
For this update, Lia Kostiuk and Juan Pablo Peña‐Rosas assessed eligibility of the new trials and extracted the data in duplicate. Any differences were discussed and resolved with Cristina Palacios. All contributed to the preparation of the updated review.
Sources of support
Internal sources
-
Evidence and Programme Guidance, Department of Nutrition for Health and Development, World Health Organization, Switzerland.
Dr Juan Pablo Peña‐Rosas is full time staff of the World Health Organization.
External sources
-
The Bill & Melinda Gates Foundation, USA.
WHO thanks the Bill & Melinda Gates Foundation for their financial support to the Department of Nutrition for Health and Development for conducting systematic reviews on nutrition‐specific and nutrition‐sensitive interventions.
-
Evidence and Programme Guidance, Department of Nutrition for Health and Development, World Health Organization, Switzerland.
Dr Cristina Palacios and Dr Lia Kostiuk Lombardo received partial funding for this work.
Declarations of interest
The other authors have no affiliations with or involvement in any organisation or entity with a direct financial interest in the subject matter of the review (e.g. employment, consultancy, stock ownership, honoraria, expert testimony).
Cristina Palacios received funds from the World Health Organization (WHO) to pay for travel expenses to present and meet with co‐authors and to write the review.
Lia Kostiuk ‐ received partial financial support from the WHO for this commissioned work.
Juan Pablo Peña‐Rosas ‐ the WHO receives partial financial support from the Bill & Melinda Gates Foundation, US Agency for International Development and Nutrition International to support its work in the area of nutrition, including the commissioning of systematic reviews of interventions for health throughout the life course. Donors do not fund specific guidelines and do not participate in any decision related to the guideline development process, including the composition of research questions, membership of the guideline groups, conduct and interpretation of systematic reviews, or formulation of recommendations.
Acknowledgements
As part of the pre‐publication editorial process, this review has been commented on by two peers (an editor and referee who is external to the editorial team), a member of Cochrane Pregnancy and Childbirth's international panel of consumers and the Group's Statistical Adviser. The authors are grateful to the following peer reviewer for his time and comments: Zulfiqar A Bhutta, Robert Harding Chair in Global Child Health and Policy, Centre for Global Child Health, The Hospital for Sick Children, Toronto, Canada; and Founding Director, Center of Excellence in Women and Child Health, The Aga Khan University, Karachi, Pakistan.
This project was supported by the National Institute for Health Research, via Cochrane Infrastructure funding to Cochrane Pregnancy and Childbirth. The views and opinions expressed therein are those of the authors and do not necessarily reflect those of the Systematic Reviews Programme, NIHR, NHS or the Department of Health.
The World Health Organization (WHO), Cristina Palacios and Lia Kostiuk retain copyright and all other rights in the manuscript of this updated review as submitted for publication, including any revisions or updates to the manuscript which WHO may make from time to time. We acknowledge the support of Luz‐Maria De‐Regil, Ali Ansary and Regina Kulier in prior versions of this review.
Juan Pablo Peña‐Rosas is currently staff member of the WHO. The authors alone are responsible for the views expressed in this publication and they do not necessarily represent the decisions, policy or views of the WHO.
We thank Kassam Mahomed for their contribution as an author on previous versions of this review.
Version history
| Published | Title | Stage | Authors | Version |
| 2019 Jul 26 | Vitamin D supplementation for women during pregnancy | Review | Cristina Palacios, Lia K Kostiuk, Juan Pablo Peña‐Rosas | |
| 2016 Jan 14 | Vitamin D supplementation for women during pregnancy | Review | Luz Maria De‐Regil, Cristina Palacios, Lia K Lombardo, Juan Pablo Peña‐Rosas | |
| 2012 Feb 15 | Vitamin D supplementation for women during pregnancy | Review | Luz Maria De‐Regil, Cristina Palacios, Ali Ansary, Regina Kulier, Juan Pablo Peña‐Rosas | |
| 2010 Dec 08 | Vitamin D supplementation for women during pregnancy | Protocol | Ali Ansary, Cristina Palacios, Luz Maria De‐Regil, Juan Pablo Peña‐Rosas | |
Differences between protocol and review
In comparison with the previous version (De‐Regil 2016), this 2019 updated review has the following difference.
-
The contact person (and guarantor) for this review has changed from Luz Maria De‐Regil to Cristina Palacios. Two prior co‐authors left the review team at the full review stage.
Keywords
MeSH
Medical Subject Headings (MeSH) Keywords
- *Pregnancy Outcome;
- Calcium, Dietary [administration & dosage];
- Diabetes, Gestational [prevention & control];
- Dietary Supplements;
- Pre‐Eclampsia [prevention & control];
- Pregnancy Complications [prevention & control];
- Premature Birth [prevention & control];
- Randomized Controlled Trials as Topic;
- Vitamin D [*administration & dosage, analogs & derivatives];
- Vitamins [*administration & dosage];
Medical Subject Headings Check Words
Female; Humans; Pregnancy;
PICO

Study flow diagram for this update

'Risk of bias' graph: review authors' judgements about each risk of bias item presented as percentages across all included studies.

'Risk of bias' summary: review authors' judgements about each risk of bias item for each included study.
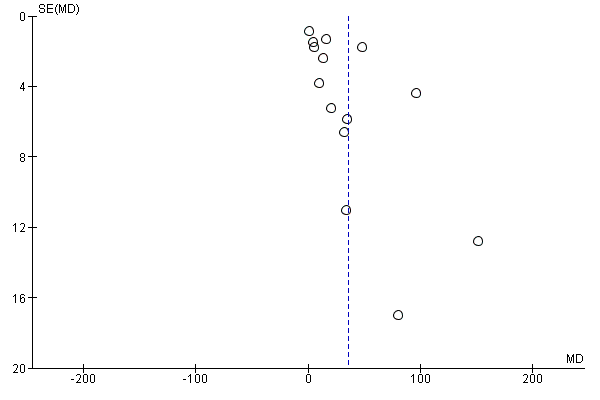
Funnel plot of comparison: 1 Vitamin D alone versus no treatment/placebo (no vitamins or minerals), outcome: 1.15 Maternal vitamin D concentration at term (25‐hydroxyvitamin D) (nmol/L) (ALL).
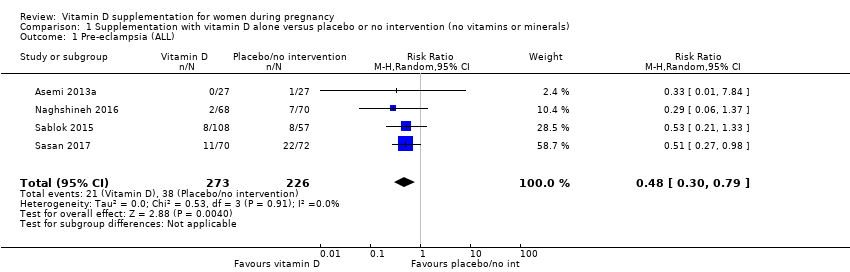
Comparison 1 Supplementation with vitamin D alone versus placebo or no intervention (no vitamins or minerals), Outcome 1 Pre‐eclampsia (ALL).
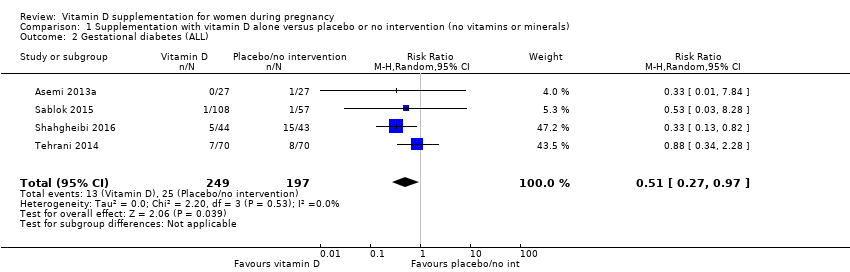
Comparison 1 Supplementation with vitamin D alone versus placebo or no intervention (no vitamins or minerals), Outcome 2 Gestational diabetes (ALL).
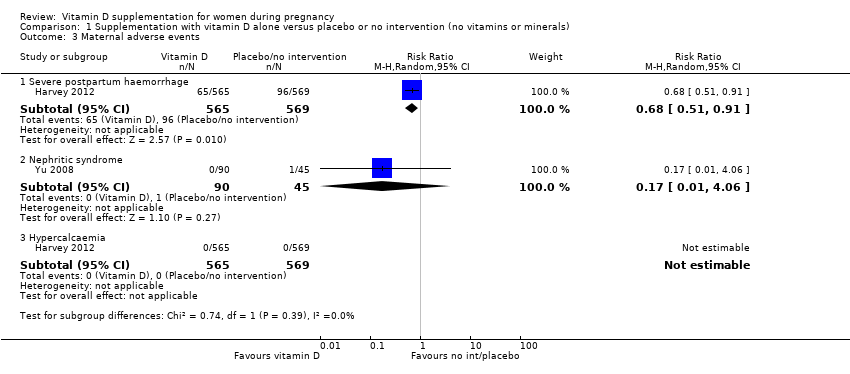
Comparison 1 Supplementation with vitamin D alone versus placebo or no intervention (no vitamins or minerals), Outcome 3 Maternal adverse events.
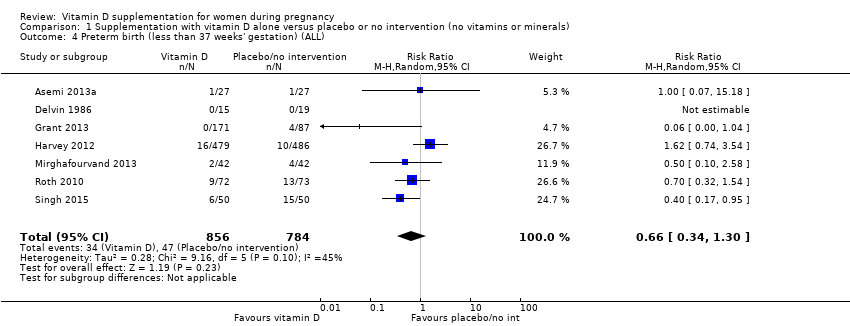
Comparison 1 Supplementation with vitamin D alone versus placebo or no intervention (no vitamins or minerals), Outcome 4 Preterm birth (less than 37 weeks' gestation) (ALL).
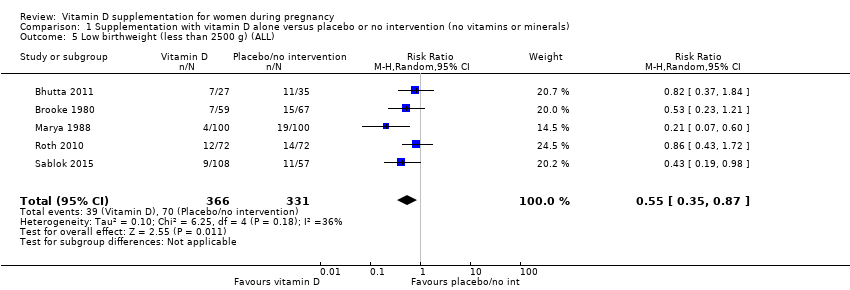
Comparison 1 Supplementation with vitamin D alone versus placebo or no intervention (no vitamins or minerals), Outcome 5 Low birthweight (less than 2500 g) (ALL).
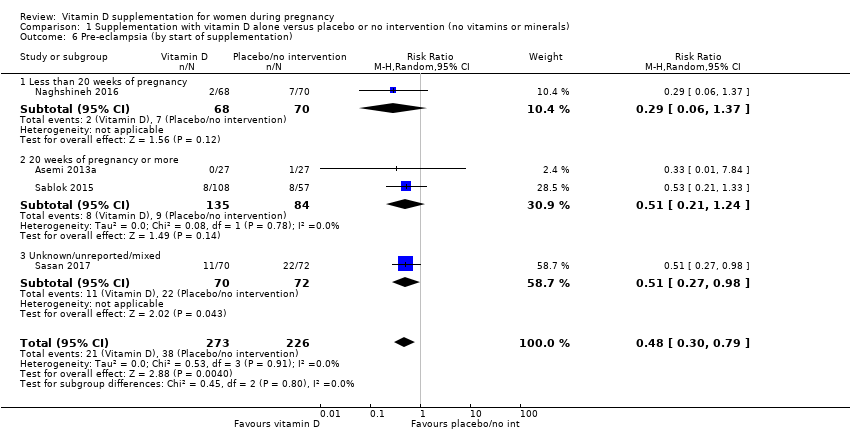
Comparison 1 Supplementation with vitamin D alone versus placebo or no intervention (no vitamins or minerals), Outcome 6 Pre‐eclampsia (by start of supplementation).

Comparison 1 Supplementation with vitamin D alone versus placebo or no intervention (no vitamins or minerals), Outcome 7 Pre‐eclampsia (by pre‐gestational BMI).

Comparison 1 Supplementation with vitamin D alone versus placebo or no intervention (no vitamins or minerals), Outcome 8 Pre‐eclampsia (by supplementation scheme/regimen).

Comparison 1 Supplementation with vitamin D alone versus placebo or no intervention (no vitamins or minerals), Outcome 9 Pre‐eclampsia (by skin pigmentation based on Fitzpatrick skin tone chart).

Comparison 1 Supplementation with vitamin D alone versus placebo or no intervention (no vitamins or minerals), Outcome 10 Pre‐eclampsia (by latitude).
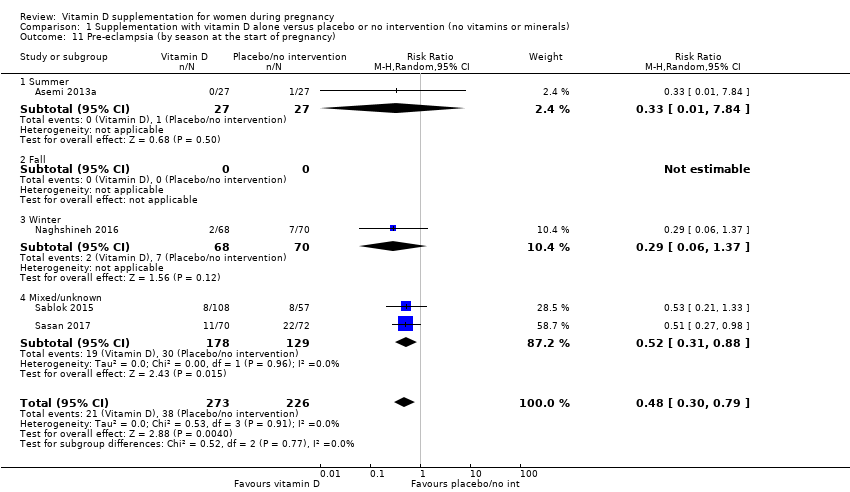
Comparison 1 Supplementation with vitamin D alone versus placebo or no intervention (no vitamins or minerals), Outcome 11 Pre‐eclampsia (by season at the start of pregnancy).

Comparison 1 Supplementation with vitamin D alone versus placebo or no intervention (no vitamins or minerals), Outcome 12 Gestational diabetes (by start of supplementation).
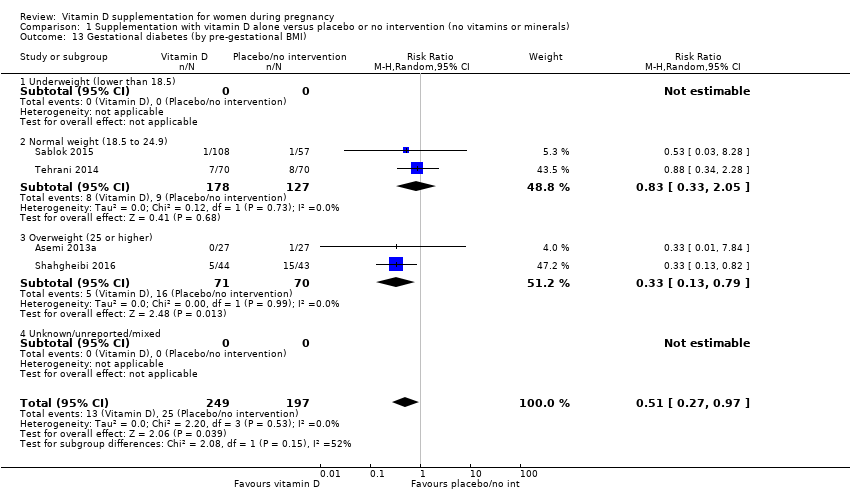
Comparison 1 Supplementation with vitamin D alone versus placebo or no intervention (no vitamins or minerals), Outcome 13 Gestational diabetes (by pre‐gestational BMI).

Comparison 1 Supplementation with vitamin D alone versus placebo or no intervention (no vitamins or minerals), Outcome 14 Gestational diabetes (by supplementation scheme/regimen).

Comparison 1 Supplementation with vitamin D alone versus placebo or no intervention (no vitamins or minerals), Outcome 15 Gestational diabetes (by skin pigmentation based on Fitzpatrick skin tone chart).
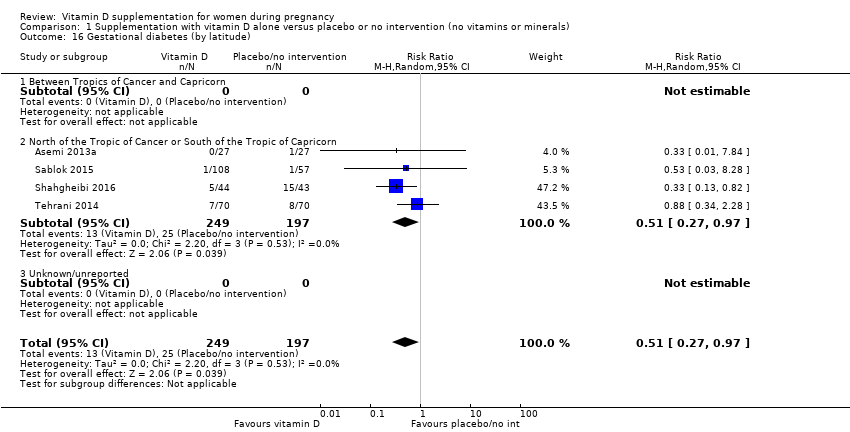
Comparison 1 Supplementation with vitamin D alone versus placebo or no intervention (no vitamins or minerals), Outcome 16 Gestational diabetes (by latitude).

Comparison 1 Supplementation with vitamin D alone versus placebo or no intervention (no vitamins or minerals), Outcome 17 Gestational diabetes (by season at the start of supplementation).
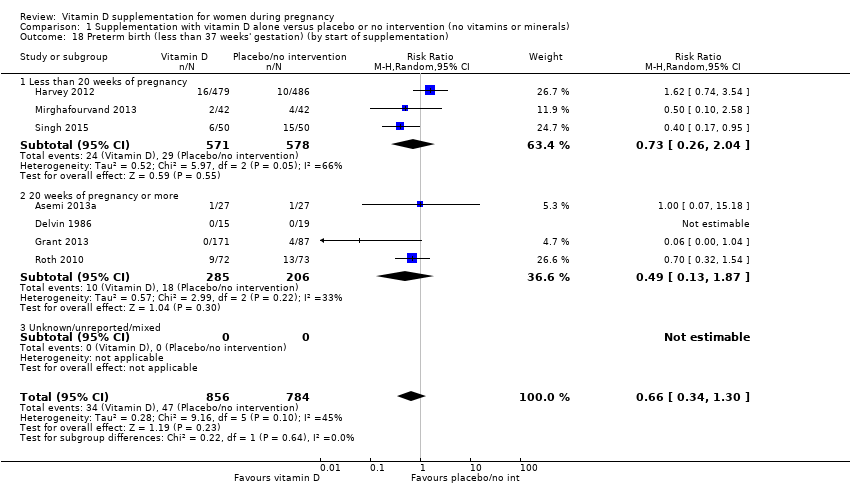
Comparison 1 Supplementation with vitamin D alone versus placebo or no intervention (no vitamins or minerals), Outcome 18 Preterm birth (less than 37 weeks' gestation) (by start of supplementation).

Comparison 1 Supplementation with vitamin D alone versus placebo or no intervention (no vitamins or minerals), Outcome 19 Preterm birth (less than 37 weeks' gestation) (by pre‐gestational BMI).

Comparison 1 Supplementation with vitamin D alone versus placebo or no intervention (no vitamins or minerals), Outcome 20 Preterm birth (less than 37 weeks' gestation) (by supplementation scheme/regimen).

Comparison 1 Supplementation with vitamin D alone versus placebo or no intervention (no vitamins or minerals), Outcome 21 Preterm birth (less than 37 weeks' gestation) (by skin pigmentation based on Fitzpatrick skin tone chart).

Comparison 1 Supplementation with vitamin D alone versus placebo or no intervention (no vitamins or minerals), Outcome 22 Preterm birth (less than 37 weeks' gestation) (by latitude).

Comparison 1 Supplementation with vitamin D alone versus placebo or no intervention (no vitamins or minerals), Outcome 23 Preterm birth (less than 37 weeks' gestation) (by season at the start of supplementation).

Comparison 1 Supplementation with vitamin D alone versus placebo or no intervention (no vitamins or minerals), Outcome 24 Low birthweight (less than 2500 g) (by start of supplementation).

Comparison 1 Supplementation with vitamin D alone versus placebo or no intervention (no vitamins or minerals), Outcome 25 Low birthweight (less than 2500 g) (by pre‐gestational BMI).

Comparison 1 Supplementation with vitamin D alone versus placebo or no intervention (no vitamins or minerals), Outcome 26 Low birthweight (less than 2500 g) (by supplementation scheme/regimen).
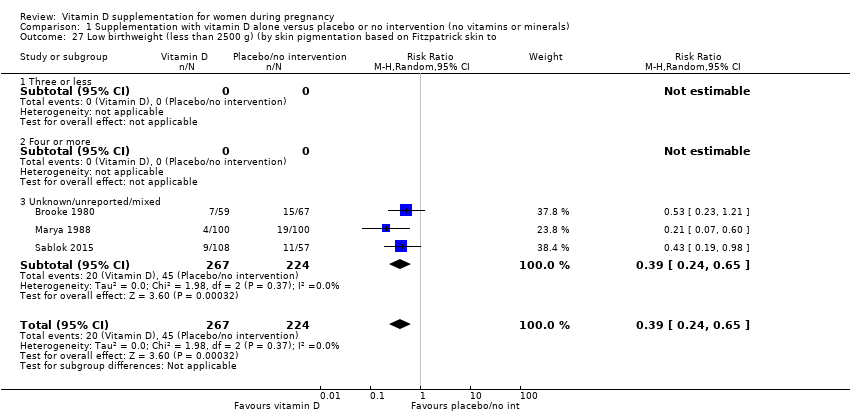
Comparison 1 Supplementation with vitamin D alone versus placebo or no intervention (no vitamins or minerals), Outcome 27 Low birthweight (less than 2500 g) (by skin pigmentation based on Fitzpatrick skin to.
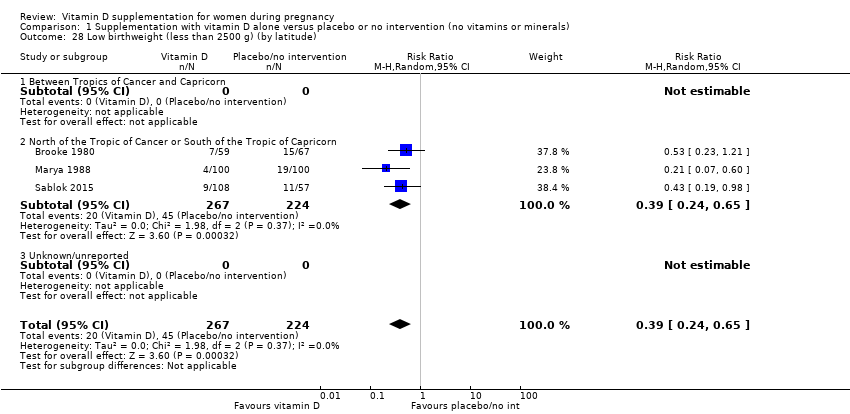
Comparison 1 Supplementation with vitamin D alone versus placebo or no intervention (no vitamins or minerals), Outcome 28 Low birthweight (less than 2500 g) (by latitude).

Comparison 1 Supplementation with vitamin D alone versus placebo or no intervention (no vitamins or minerals), Outcome 29 Low birthweight (less than 2500 g) (by season at the start of pregnancy).
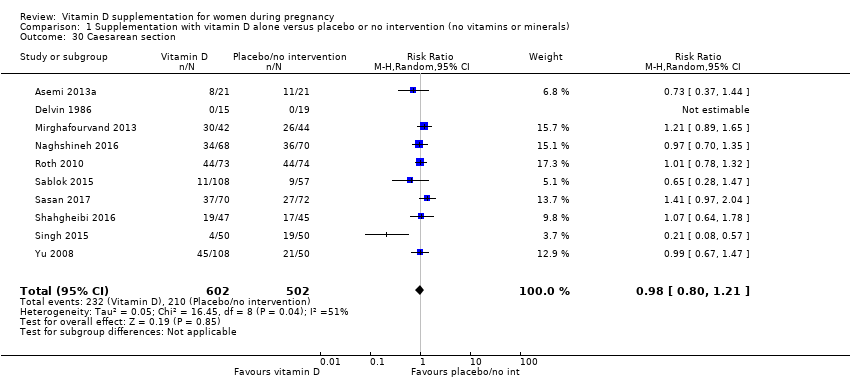
Comparison 1 Supplementation with vitamin D alone versus placebo or no intervention (no vitamins or minerals), Outcome 30 Caesarean section.
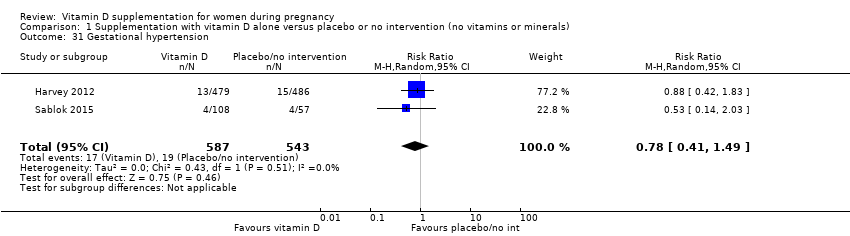
Comparison 1 Supplementation with vitamin D alone versus placebo or no intervention (no vitamins or minerals), Outcome 31 Gestational hypertension.

Comparison 1 Supplementation with vitamin D alone versus placebo or no intervention (no vitamins or minerals), Outcome 32 Maternal death (death while pregnant or within 42 days of termination of pregnancy) (ALL).

Comparison 1 Supplementation with vitamin D alone versus placebo or no intervention (no vitamins or minerals), Outcome 33 Maternal vitamin D concentration at term (25‐hydroxyvitamin D) (nmol/L) (ALL).

Comparison 1 Supplementation with vitamin D alone versus placebo or no intervention (no vitamins or minerals), Outcome 34 Birth length (cm).

Comparison 1 Supplementation with vitamin D alone versus placebo or no intervention (no vitamins or minerals), Outcome 35 Head circumference at birth (cm).
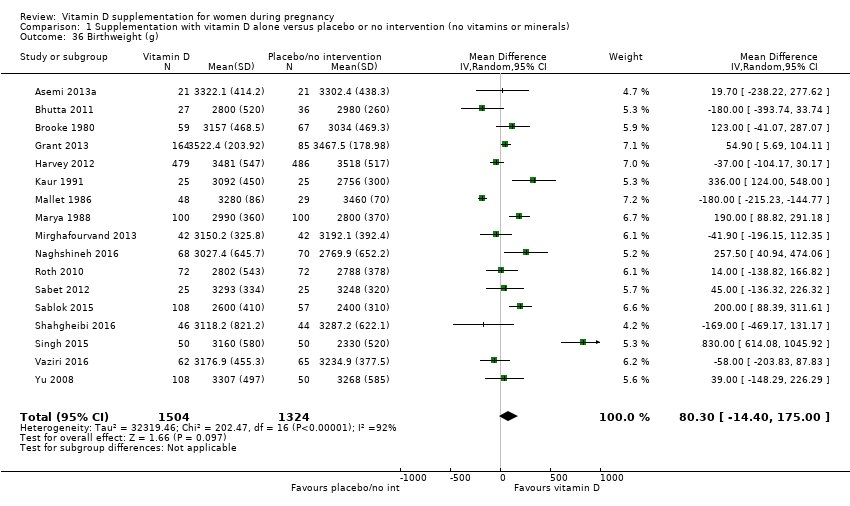
Comparison 1 Supplementation with vitamin D alone versus placebo or no intervention (no vitamins or minerals), Outcome 36 Birthweight (g).

Comparison 1 Supplementation with vitamin D alone versus placebo or no intervention (no vitamins or minerals), Outcome 37 Stillbirth.
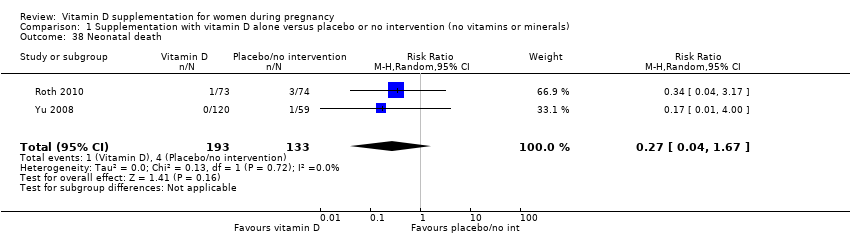
Comparison 1 Supplementation with vitamin D alone versus placebo or no intervention (no vitamins or minerals), Outcome 38 Neonatal death.

Comparison 1 Supplementation with vitamin D alone versus placebo or no intervention (no vitamins or minerals), Outcome 39 Apgar score less than seven at five minutes.
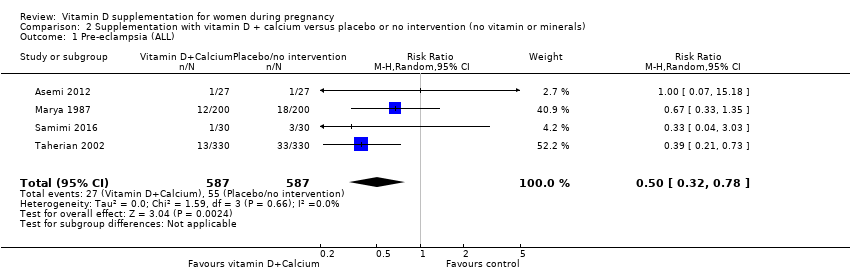
Comparison 2 Supplementation with vitamin D + calcium versus placebo or no intervention (no vitamin or minerals), Outcome 1 Pre‐eclampsia (ALL).

Comparison 2 Supplementation with vitamin D + calcium versus placebo or no intervention (no vitamin or minerals), Outcome 2 Gestational diabetes (ALL).
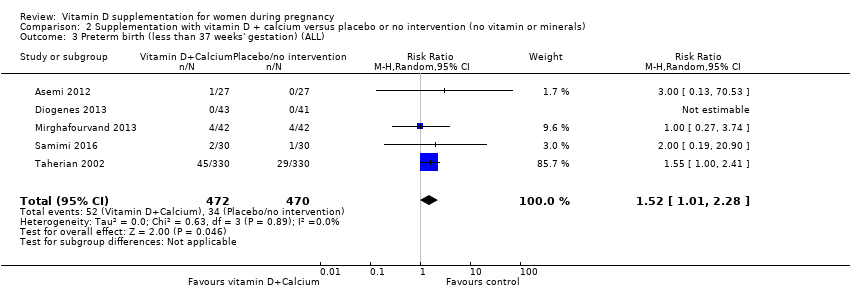
Comparison 2 Supplementation with vitamin D + calcium versus placebo or no intervention (no vitamin or minerals), Outcome 3 Preterm birth (less than 37 weeks' gestation) (ALL).
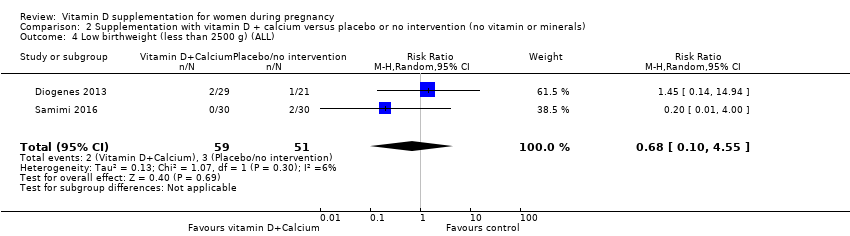
Comparison 2 Supplementation with vitamin D + calcium versus placebo or no intervention (no vitamin or minerals), Outcome 4 Low birthweight (less than 2500 g) (ALL).

Comparison 2 Supplementation with vitamin D + calcium versus placebo or no intervention (no vitamin or minerals), Outcome 5 Caesarean section.
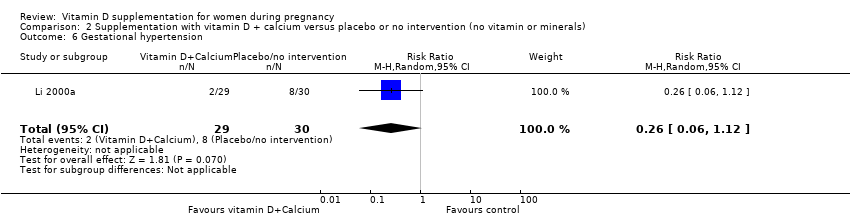
Comparison 2 Supplementation with vitamin D + calcium versus placebo or no intervention (no vitamin or minerals), Outcome 6 Gestational hypertension.

Comparison 2 Supplementation with vitamin D + calcium versus placebo or no intervention (no vitamin or minerals), Outcome 7 Maternal vitamin D concentration at term (25‐hydroxyvitamin D) (nmol/L) (ALL).

Comparison 2 Supplementation with vitamin D + calcium versus placebo or no intervention (no vitamin or minerals), Outcome 8 Birth length (cm).

Comparison 2 Supplementation with vitamin D + calcium versus placebo or no intervention (no vitamin or minerals), Outcome 9 Head circumference at birth (cm).
Comparison 2 Supplementation with vitamin D + calcium versus placebo or no intervention (no vitamin or minerals), Outcome 10 Birthweight (g).

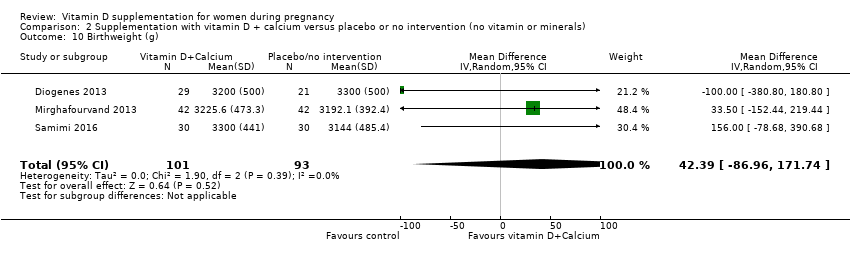
Comparison 2 Supplementation with vitamin D + calcium versus placebo or no intervention (no vitamin or minerals), Outcome 11 Neonatal death.
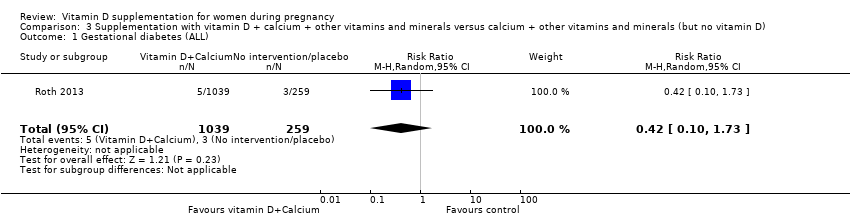
Comparison 3 Supplementation with vitamin D + calcium + other vitamins and minerals versus calcium + other vitamins and minerals (but no vitamin D), Outcome 1 Gestational diabetes (ALL).

Comparison 3 Supplementation with vitamin D + calcium + other vitamins and minerals versus calcium + other vitamins and minerals (but no vitamin D), Outcome 2 Maternal adverse events.

Comparison 3 Supplementation with vitamin D + calcium + other vitamins and minerals versus calcium + other vitamins and minerals (but no vitamin D), Outcome 3 Preterm birth (less than 37 weeks' gestation) (ALL).

Comparison 3 Supplementation with vitamin D + calcium + other vitamins and minerals versus calcium + other vitamins and minerals (but no vitamin D), Outcome 4 Low birthweight (less than 2500 g) (ALL).
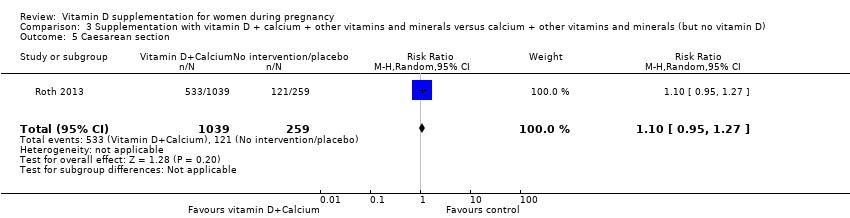
Comparison 3 Supplementation with vitamin D + calcium + other vitamins and minerals versus calcium + other vitamins and minerals (but no vitamin D), Outcome 5 Caesarean section.

Comparison 3 Supplementation with vitamin D + calcium + other vitamins and minerals versus calcium + other vitamins and minerals (but no vitamin D), Outcome 6 Gestational hypertension.

Comparison 3 Supplementation with vitamin D + calcium + other vitamins and minerals versus calcium + other vitamins and minerals (but no vitamin D), Outcome 7 Maternal death (death while pregnant or within 42 days of termination of pregnancy).

Comparison 3 Supplementation with vitamin D + calcium + other vitamins and minerals versus calcium + other vitamins and minerals (but no vitamin D), Outcome 8 Maternal vitamin D concentration at term (25‐hydroxyvitamin D) (nmol/L) (ALL).

Comparison 3 Supplementation with vitamin D + calcium + other vitamins and minerals versus calcium + other vitamins and minerals (but no vitamin D), Outcome 9 Birth length (cm).
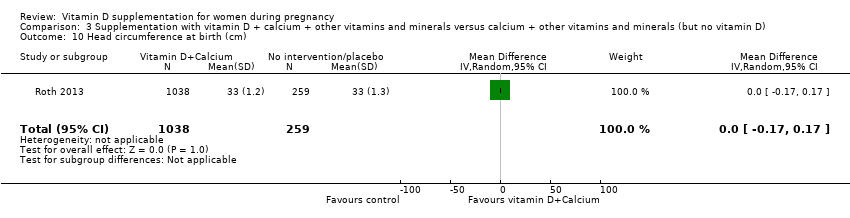
Comparison 3 Supplementation with vitamin D + calcium + other vitamins and minerals versus calcium + other vitamins and minerals (but no vitamin D), Outcome 10 Head circumference at birth (cm).
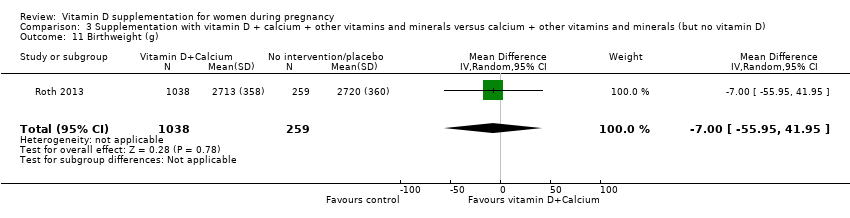
Comparison 3 Supplementation with vitamin D + calcium + other vitamins and minerals versus calcium + other vitamins and minerals (but no vitamin D), Outcome 11 Birthweight (g).

Comparison 3 Supplementation with vitamin D + calcium + other vitamins and minerals versus calcium + other vitamins and minerals (but no vitamin D), Outcome 12 Stillbirth.
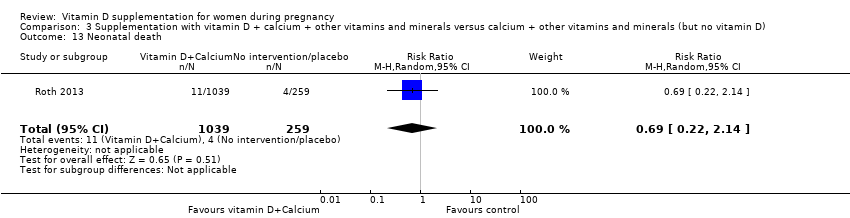
Comparison 3 Supplementation with vitamin D + calcium + other vitamins and minerals versus calcium + other vitamins and minerals (but no vitamin D), Outcome 13 Neonatal death.
| Vitamin D supplementation compared to placebo/control for pregnancy and neonatal health outcomes | ||||||
| Patient or population: pregnant women and their infants. | ||||||
| Outcomes | Anticipated absolute effects* (95% CI) | Relative effect | № of participants | Certainty of the evidence | Comments | |
| Risk with placebo/control | Risk with vitamin D supplementation | |||||
| Pre‐eclampsia | Study population | RR 0.48 (0.30, 0.79) | 499 | ⊕⊕⊕⊝ | Included trials: Asemi 2013a; Naghshineh 2016; Sablok 2015; Sasan 2017 | |
| 168 per 1000 | 79 per 1000 | |||||
| Gestational diabetes | Study population | RR 0.51 | 446 | ⊕⊕⊕⊝ | Included trials: Asemi 2013a; Sablok 2015; Shahgheibi 2016; Tehrani 2014 | |
| 127 per 1000 | 65 per 1000 | |||||
| Maternal adverse events: severe postpartum haemorrhage | Study population | RR 0.68 | 1134 | ⊕⊕⊝⊝ | Included trial: Harvey 2012 | |
| 158 per 1000 | 106 per 1000 | |||||
| Maternal adverse event: nephritic syndrome | Study population | RR 0.17 (0.01 to 4.06) | 135 (1 RCT) | ⊕⊝⊝⊝ | Included trial: Yu 2008 | |
| 22 per 1000 | 4 per 1000 (0 to 90) | |||||
| Maternal adverse event: hypercalcaemia | Study population | Not estimable | 1134 | ⊕⊕⊝⊝ | Included trial: Harvey 2012 | |
| 0 per 1000 | 0 per 1000 | |||||
| Preterm birth (less than 37 weeks' gestation) | Study population | RR 0.66 (0.34 to 1.30) | 1640 | ⊕⊕⊝⊝ | Included trials: Asemi 2013a; Delvin 1986; Grant 2013; Harvey 2012; Mirghafourvand 2013; Roth 2010; Singh 2015 | |
| 87 per 1000 | 57 per 1000 | |||||
| Low birthweight (less than 2500 g) | Study population | RR 0.55 | 697 | ⊕⊕⊕⊝ | Included trials: Brooke 1980; Bhutta 2011; Marya 1988; Roth 2010; Sablok 2015 | |
| 136 per 1000 | 75 per 1000 | |||||
| *The risk in the intervention group (and its 95% confidence interval) is based on the assumed risk in the comparison group and the relative effect of the intervention (and its 95% CI). | ||||||
| GRADE Working Group grades of evidence | ||||||
| 1 We downgraded (1) level for serious limitations in study design due to one trial being assessed as high risk of bias for several domains and two trials having unclear allocation concealment. 2 We downgraded (1) level for serious limitations in study design due to one trial being assessed as high risk of bias for several domains. 3 We downgraded (2) levels for very serious limitations in study design due to one study being assessed as high risk of other bias because we do not know the impact of the participants who were allowed to continue taking their own multivitamin with 400 IU/d of vitamin D as this was not recorded. 4 We downgraded (1) level for serious limitations in study design due to one study being assessed as high risk of bias for performance and detection bias. 5 We downgraded (2) levels for very serious limitations in imprecision as only one small study, with a small number of events and wide 95% confidence intervals (CI) contributed data. 6 We downgraded (1) level for serious limitations in imprecision due to a single study with zero events contributing data. 7 We downgraded (1) level for serious limitations in study design due to two studies being at unclear risk of selection bias and one study being at high risk of other bias. 8 We downgraded (1) level for serious limitations in imprecision as the 95% confidence interval (CI) was wide and crossed the line of no effect. 9 We downgraded (1) level for serious limitations in study design due to two studies being at unclear risk of selection bias, one study being at high risk of bias for allocation concealment, and three studies being at high risk of attrition bias. | ||||||
| Vitamin D + calcium supplementation compared to placebo/control for pregnancy and neonatal health outcomes | |||||||
| Patient or population: pregnant women and their infants.. | |||||||
| Outcomes | Anticipated absolute effects* (95% CI) | Relative effect | № of participants | Certainty of the evidence | Comments | ||
| Risk with placebo/control | Risk with vitamin D + calcium supplementation | ||||||
| Pre‐eclampsia | Study population | RR 0.50 | 1174 | ⊕⊕⊕⊝ | Included trials: Asemi 2012; Marya 1987; Samimi 2016; Taherian 2002 | ||
| 94 per 1000 | 47 per 1000 | ||||||
| Gestational diabetes | Study population | RR 0.33 | 54 | ⊕⊝⊝⊝ | Included trial: Asemi 2012 | ||
| 37 per 1000 | 12 per 1000 | ||||||
| Maternal adverse events | ‐ | ‐ | ‐ | ‐ | ‐ | No trials reported on this outcome | |
| Preterm birth (less than 37 weeks' gestation) | Study population | RR 1.52 | 942 | ⊕⊕⊝⊝ | Included trials: Asemi 2012; Diogenes 2013, Mirghafourvand 2013, Samimi 2016; Taherian 2002; | ||
| 72 per 1000 | 110 per 1000 | ||||||
| Low birthweight (less than 2500 g) | Study population | RR 0.68 | 110 | ⊕⊝⊝⊝ | Included trials: Diogenes 2013; Samimi 2016 | ||
| 59 per 1000 | 40 per 1000 | ||||||
| *The risk in the intervention group (and its 95% confidence interval) is based on the assumed risk in the comparison group and the relative effect of the intervention (and its 95% CI). | |||||||
| GRADE Working Group grades of evidence | |||||||
| 1 We downgraded (1) level for serious limitations in study design due to one study being at high risk of attrition and selection bias and three studies being at high risk of performance and detection bias. 2 We downgraded (1) level for serious limitations in study design due to one study being at high risk of performance and detection bias. 3 We downgraded (2) levels for very serious limitations in imprecision due to one small study, with a single event and wide 95% confidence intervals (CI) crossing the line of no effect contributing data. 4 We downgraded (1) level for serious limitations in study design due to three studies being at unclear risk of allocation concealment and three studies being at high risk of performance and detection bias. 5 We downgraded (1) level for serious limitations in imprecision due to wide 95% confidence intervals (CI). 6 We downgraded (1) level for serious limitations in study design due to one study being at unclear risk of allocation concealment and one study being at high risk of attrition bias. 7 We downgraded (2) levels for very serious limitations in imprecision due two small studies, with very few events and wide 95% confidence intervals (CI) crossing the line of no effect contributing data. | |||||||
| Vitamin D + calcium + other vitamins and minerals compared to calcium + other vitamins and minerals (but no vitamin D) for pregnancy and neonatal health outcomes | ||||||
| Patient or population: pregnant women and their infants.. | ||||||
| Outcomes | Anticipated absolute effects* (95% CI) | Relative effect | № of participants | Certainty of the evidence | Comments | |
| Risk with calcium + other vitamins and minerals (but no vitamin D) | Risk with vitamin D + calcium + other vitamins and minerals | |||||
| Pre‐eclampsia | Study population | ‐ | (0 trials) | ‐ | No trials reported on this outcome | |
| see comment | see comment | |||||
| Gestational diabetes | Study population | RR 0.42 | 1298 | ⊕⊝⊝⊝ | Included trial: Roth 2013 | |
| 12 per 1000 | 5 per 1000 | |||||
| Maternal adverse event: hypercalcaemia | Study population | ‐ | 1298 | ⊕⊝⊝⊝ | Included trial: Roth 2013 | |
| 23 per 1000 | 64 per 1000 | |||||
| Maternal adverse event: hypercalciuria | Study population | 0.25 (0.02 to 3.97) | 1298 | ⊕⊝⊝⊝ | Included trial: Roth 2013 | |
| 4 per 1000 | 1 per 1000 (0 to 15) | |||||
| Preterm birth (less than 37 weeks' gestation) | Study population | RR 1.04 | 1298 | ⊕⊕⊝⊝ | Included trial: Roth 2013 | |
| 93 per 1000 | 96 per 1000 | |||||
| Low birthweight (less than 2500 g) | Study population | RR 1.12 | 1298 | ⊕⊕⊝⊝ | Included trial: Roth 2013 | |
| 162 per 1000 | 182 per 1000 | |||||
| *The risk in the intervention group (and its 95% confidence interval) is based on the assumed risk in the comparison group and the relative effect of the intervention (and its 95% CI). | ||||||
| GRADE Working Group grades of evidence | ||||||
| 1 We downgraded (2) levels for very serious limitations in imprecision with only one trial, with few events, and wide 95% confidence intervals (CI) crossing the line of no effect contributing data. 2 We downgraded (1) level for serious indirectness as there were multiple nutrient interventions in addition to vitamin D. 2 We downgraded (2) levels for very serious limitations in imprecision with only one trial, with zero events, and wide 95% confidence intervals (CI) crossing the line of no effect contributing data. 3 We downgraded (1) level for serious limitations in imprecision due to only one trial with wide 95% confidence intervals (CI) crossing the line of no effect contributing data. | ||||||
| Outcome or subgroup title | No. of studies | No. of participants | Statistical method | Effect size |
| 1 Pre‐eclampsia (ALL) Show forest plot | 4 | 499 | Risk Ratio (M‐H, Random, 95% CI) | 0.48 [0.30, 0.79] |
| 2 Gestational diabetes (ALL) Show forest plot | 4 | 446 | Risk Ratio (M‐H, Random, 95% CI) | 0.51 [0.27, 0.97] |
| 3 Maternal adverse events Show forest plot | 2 | Risk Ratio (M‐H, Random, 95% CI) | Subtotals only | |
| 3.1 Severe postpartum haemorrhage | 1 | 1134 | Risk Ratio (M‐H, Random, 95% CI) | 0.68 [0.51, 0.91] |
| 3.2 Nephritic syndrome | 1 | 135 | Risk Ratio (M‐H, Random, 95% CI) | 0.17 [0.01, 4.06] |
| 3.3 Hypercalcaemia | 1 | 1134 | Risk Ratio (M‐H, Random, 95% CI) | 0.0 [0.0, 0.0] |
| 4 Preterm birth (less than 37 weeks' gestation) (ALL) Show forest plot | 7 | 1640 | Risk Ratio (M‐H, Random, 95% CI) | 0.66 [0.34, 1.30] |
| 5 Low birthweight (less than 2500 g) (ALL) Show forest plot | 5 | 697 | Risk Ratio (M‐H, Random, 95% CI) | 0.55 [0.35, 0.87] |
| 6 Pre‐eclampsia (by start of supplementation) Show forest plot | 4 | 499 | Risk Ratio (M‐H, Random, 95% CI) | 0.48 [0.30, 0.79] |
| 6.1 Less than 20 weeks of pregnancy | 1 | 138 | Risk Ratio (M‐H, Random, 95% CI) | 0.29 [0.06, 1.37] |
| 6.2 20 weeks of pregnancy or more | 2 | 219 | Risk Ratio (M‐H, Random, 95% CI) | 0.51 [0.21, 1.24] |
| 6.3 Unknown/unreported/mixed | 1 | 142 | Risk Ratio (M‐H, Random, 95% CI) | 0.51 [0.27, 0.98] |
| 7 Pre‐eclampsia (by pre‐gestational BMI) Show forest plot | 4 | 499 | Risk Ratio (M‐H, Random, 95% CI) | 0.48 [0.30, 0.79] |
| 7.1 Underweight (lower than 18.5) | 0 | 0 | Risk Ratio (M‐H, Random, 95% CI) | 0.0 [0.0, 0.0] |
| 7.2 Normal weight (18.5 to 24.9) | 1 | 165 | Risk Ratio (M‐H, Random, 95% CI) | 0.53 [0.21, 1.33] |
| 7.3 Overweight (25 or higher) | 1 | 54 | Risk Ratio (M‐H, Random, 95% CI) | 0.33 [0.01, 7.84] |
| 7.4 Unknown/unreported/mixed | 2 | 280 | Risk Ratio (M‐H, Random, 95% CI) | 0.47 [0.26, 0.86] |
| 8 Pre‐eclampsia (by supplementation scheme/regimen) Show forest plot | 4 | 499 | Risk Ratio (M‐H, Random, 95% CI) | 0.48 [0.30, 0.79] |
| 8.1 Single dose | 1 | 165 | Risk Ratio (M‐H, Random, 95% CI) | 0.53 [0.21, 1.33] |
| 8.2 Daily | 2 | 192 | Risk Ratio (M‐H, Random, 95% CI) | 0.30 [0.08, 1.20] |
| 8.3 Weekly/monthly | 1 | 142 | Risk Ratio (M‐H, Random, 95% CI) | 0.51 [0.27, 0.98] |
| 9 Pre‐eclampsia (by skin pigmentation based on Fitzpatrick skin tone chart) Show forest plot | 4 | 499 | Risk Ratio (M‐H, Random, 95% CI) | 0.48 [0.30, 0.79] |
| 9.1 Three or less | 0 | 0 | Risk Ratio (M‐H, Random, 95% CI) | 0.0 [0.0, 0.0] |
| 9.2 Four or more | 0 | 0 | Risk Ratio (M‐H, Random, 95% CI) | 0.0 [0.0, 0.0] |
| 9.3 Unknown/unreported/mixed | 4 | 499 | Risk Ratio (M‐H, Random, 95% CI) | 0.48 [0.30, 0.79] |
| 10 Pre‐eclampsia (by latitude) Show forest plot | 4 | 499 | Risk Ratio (M‐H, Random, 95% CI) | 0.48 [0.30, 0.79] |
| 10.1 Between Tropics of Cancer and Capricorn | 0 | 0 | Risk Ratio (M‐H, Random, 95% CI) | 0.0 [0.0, 0.0] |
| 10.2 North of the Tropic of Cancer or South of the Tropic of Capricorn | 4 | 499 | Risk Ratio (M‐H, Random, 95% CI) | 0.48 [0.30, 0.79] |
| 10.3 Unknown/unreported | 0 | 0 | Risk Ratio (M‐H, Random, 95% CI) | 0.0 [0.0, 0.0] |
| 11 Pre‐eclampsia (by season at the start of pregnancy) Show forest plot | 4 | 499 | Risk Ratio (M‐H, Random, 95% CI) | 0.48 [0.30, 0.79] |
| 11.1 Summer | 1 | 54 | Risk Ratio (M‐H, Random, 95% CI) | 0.33 [0.01, 7.84] |
| 11.2 Fall | 0 | 0 | Risk Ratio (M‐H, Random, 95% CI) | 0.0 [0.0, 0.0] |
| 11.3 Winter | 1 | 138 | Risk Ratio (M‐H, Random, 95% CI) | 0.29 [0.06, 1.37] |
| 11.4 Mixed/unknown | 2 | 307 | Risk Ratio (M‐H, Random, 95% CI) | 0.52 [0.31, 0.88] |
| 12 Gestational diabetes (by start of supplementation) Show forest plot | 4 | 446 | Risk Ratio (M‐H, Random, 95% CI) | 0.51 [0.27, 0.97] |
| 12.1 Less than 20 weeks of pregnancy | 1 | 140 | Risk Ratio (M‐H, Random, 95% CI) | 0.88 [0.34, 2.28] |
| 12.2 20 weeks of pregnancy or more | 2 | 219 | Risk Ratio (M‐H, Random, 95% CI) | 0.43 [0.05, 3.45] |
| 12.3 Unknown/unreported/mixed | 1 | 87 | Risk Ratio (M‐H, Random, 95% CI) | 0.33 [0.13, 0.82] |
| 13 Gestational diabetes (by pre‐gestational BMI) Show forest plot | 4 | 446 | Risk Ratio (M‐H, Random, 95% CI) | 0.51 [0.27, 0.97] |
| 13.1 Underweight (lower than 18.5) | 0 | 0 | Risk Ratio (M‐H, Random, 95% CI) | 0.0 [0.0, 0.0] |
| 13.2 Normal weight (18.5 to 24.9) | 2 | 305 | Risk Ratio (M‐H, Random, 95% CI) | 0.83 [0.33, 2.05] |
| 13.3 Overweight (25 or higher) | 2 | 141 | Risk Ratio (M‐H, Random, 95% CI) | 0.33 [0.13, 0.79] |
| 13.4 Unknown/unreported/mixed | 0 | 0 | Risk Ratio (M‐H, Random, 95% CI) | 0.0 [0.0, 0.0] |
| 14 Gestational diabetes (by supplementation scheme/regimen) Show forest plot | 4 | 446 | Risk Ratio (M‐H, Random, 95% CI) | 0.51 [0.27, 0.97] |
| 14.1 Single dose | 1 | 165 | Risk Ratio (M‐H, Random, 95% CI) | 0.53 [0.03, 8.28] |
| 14.2 Daily | 2 | 141 | Risk Ratio (M‐H, Random, 95% CI) | 0.33 [0.13, 0.79] |
| 14.3 Weekly/monthly | 1 | 140 | Risk Ratio (M‐H, Random, 95% CI) | 0.88 [0.34, 2.28] |
| 15 Gestational diabetes (by skin pigmentation based on Fitzpatrick skin tone chart) Show forest plot | 4 | 446 | Risk Ratio (M‐H, Random, 95% CI) | 0.51 [0.27, 0.97] |
| 15.1 Three or less | 0 | 0 | Risk Ratio (M‐H, Random, 95% CI) | 0.0 [0.0, 0.0] |
| 15.2 Four or more | 0 | 0 | Risk Ratio (M‐H, Random, 95% CI) | 0.0 [0.0, 0.0] |
| 15.3 Unknown/unreported/mixed | 4 | 446 | Risk Ratio (M‐H, Random, 95% CI) | 0.51 [0.27, 0.97] |
| 16 Gestational diabetes (by latitude) Show forest plot | 4 | 446 | Risk Ratio (M‐H, Random, 95% CI) | 0.51 [0.27, 0.97] |
| 16.1 Between Tropics of Cancer and Capricorn | 0 | 0 | Risk Ratio (M‐H, Random, 95% CI) | 0.0 [0.0, 0.0] |
| 16.2 North of the Tropic of Cancer or South of the Tropic of Capricorn | 4 | 446 | Risk Ratio (M‐H, Random, 95% CI) | 0.51 [0.27, 0.97] |
| 16.3 Unknown/unreported | 0 | 0 | Risk Ratio (M‐H, Random, 95% CI) | 0.0 [0.0, 0.0] |
| 17 Gestational diabetes (by season at the start of supplementation) Show forest plot | 4 | 446 | Risk Ratio (M‐H, Random, 95% CI) | 0.51 [0.27, 0.97] |
| 17.1 Summer | 1 | 54 | Risk Ratio (M‐H, Random, 95% CI) | 0.33 [0.01, 7.84] |
| 17.2 Fall | 0 | 0 | Risk Ratio (M‐H, Random, 95% CI) | 0.0 [0.0, 0.0] |
| 17.3 Winter | 1 | 140 | Risk Ratio (M‐H, Random, 95% CI) | 0.88 [0.34, 2.28] |
| 17.4 Mixed/unknown | 2 | 252 | Risk Ratio (M‐H, Random, 95% CI) | 0.34 [0.14, 0.82] |
| 18 Preterm birth (less than 37 weeks' gestation) (by start of supplementation) Show forest plot | 7 | 1640 | Risk Ratio (M‐H, Random, 95% CI) | 0.66 [0.34, 1.30] |
| 18.1 Less than 20 weeks of pregnancy | 3 | 1149 | Risk Ratio (M‐H, Random, 95% CI) | 0.73 [0.26, 2.04] |
| 18.2 20 weeks of pregnancy or more | 4 | 491 | Risk Ratio (M‐H, Random, 95% CI) | 0.49 [0.13, 1.87] |
| 18.3 Unknown/unreported/mixed | 0 | 0 | Risk Ratio (M‐H, Random, 95% CI) | 0.0 [0.0, 0.0] |
| 19 Preterm birth (less than 37 weeks' gestation) (by pre‐gestational BMI) Show forest plot | 7 | 1640 | Risk Ratio (M‐H, Random, 95% CI) | 0.66 [0.34, 1.30] |
| 19.1 Underweight (lower than 18.5) | 0 | 0 | Risk Ratio (M‐H, Random, 95% CI) | 0.0 [0.0, 0.0] |
| 19.2 Normal weight (18.5 to 24.9) | 0 | 0 | Risk Ratio (M‐H, Random, 95% CI) | 0.0 [0.0, 0.0] |
| 19.3 Overweight (25 or higher) | 2 | 138 | Risk Ratio (M‐H, Random, 95% CI) | 0.60 [0.15, 2.46] |
| 19.4 Unknown/unreported/mixed | 5 | 1502 | Risk Ratio (M‐H, Random, 95% CI) | 0.64 [0.27, 1.54] |
| 20 Preterm birth (less than 37 weeks' gestation) (by supplementation scheme/regimen) Show forest plot | 7 | 1640 | Risk Ratio (M‐H, Random, 95% CI) | 0.66 [0.34, 1.30] |
| 20.1 Single dose | 0 | 0 | Risk Ratio (M‐H, Random, 95% CI) | 0.0 [0.0, 0.0] |
| 20.2 Daily | 6 | 1495 | Risk Ratio (M‐H, Random, 95% CI) | 0.61 [0.23, 1.58] |
| 20.3 Weekly/monthly | 1 | 145 | Risk Ratio (M‐H, Random, 95% CI) | 0.70 [0.32, 1.54] |
| 21 Preterm birth (less than 37 weeks' gestation) (by skin pigmentation based on Fitzpatrick skin tone chart) Show forest plot | 9 | 1943 | Risk Ratio (M‐H, Random, 95% CI) | 0.52 [0.30, 0.91] |
| 21.1 Three or less | 0 | 0 | Risk Ratio (M‐H, Random, 95% CI) | 0.0 [0.0, 0.0] |
| 21.2 Four or more | 0 | 0 | Risk Ratio (M‐H, Random, 95% CI) | 0.0 [0.0, 0.0] |
| 21.3 Unknown/unreported/mixed | 9 | 1943 | Risk Ratio (M‐H, Random, 95% CI) | 0.52 [0.30, 0.91] |
| 22 Preterm birth (less than 37 weeks' gestation) (by latitude) Show forest plot | 7 | 1640 | Risk Ratio (M‐H, Random, 95% CI) | 0.66 [0.34, 1.30] |
| 22.1 Between Tropics of Cancer and Capricorn | 2 | 358 | Risk Ratio (M‐H, Random, 95% CI) | 0.25 [0.05, 1.34] |
| 22.2 North of the Tropic of Cancer or South of the Tropic of Capricorn | 5 | 1282 | Risk Ratio (M‐H, Random, 95% CI) | 0.99 [0.59, 1.66] |
| 22.3 Unknown/unreported | 0 | 0 | Risk Ratio (M‐H, Random, 95% CI) | 0.0 [0.0, 0.0] |
| 23 Preterm birth (less than 37 weeks' gestation) (by season at the start of supplementation) Show forest plot | 7 | 1640 | Risk Ratio (M‐H, Random, 95% CI) | 0.66 [0.34, 1.30] |
| 23.1 Summer | 2 | 199 | Risk Ratio (M‐H, Random, 95% CI) | 0.72 [0.34, 1.53] |
| 23.2 Winter | 1 | 34 | Risk Ratio (M‐H, Random, 95% CI) | 0.0 [0.0, 0.0] |
| 23.3 Mixed/unknown | 4 | 1407 | Risk Ratio (M‐H, Random, 95% CI) | 0.55 [0.19, 1.66] |
| 24 Low birthweight (less than 2500 g) (by start of supplementation) Show forest plot | 3 | 491 | Risk Ratio (M‐H, Random, 95% CI) | 0.39 [0.24, 0.65] |
| 24.1 Less than 20 weeks of pregnancy | 0 | 0 | Risk Ratio (M‐H, Random, 95% CI) | 0.0 [0.0, 0.0] |
| 24.2 20 weeks of pregnancy or more | 3 | 491 | Risk Ratio (M‐H, Random, 95% CI) | 0.39 [0.24, 0.65] |
| 24.3 Unknown/unreported/mixed | 0 | 0 | Risk Ratio (M‐H, Random, 95% CI) | 0.0 [0.0, 0.0] |
| 25 Low birthweight (less than 2500 g) (by pre‐gestational BMI) Show forest plot | 3 | 491 | Risk Ratio (M‐H, Random, 95% CI) | 0.39 [0.24, 0.65] |
| 25.1 Underweight (lower than 18.5) | 0 | 0 | Risk Ratio (M‐H, Random, 95% CI) | 0.0 [0.0, 0.0] |
| 25.2 Normal weight (18.5 to 24.9) | 1 | 165 | Risk Ratio (M‐H, Random, 95% CI) | 0.43 [0.19, 0.98] |
| 25.3 Overweight (25 or higher) | 0 | 0 | Risk Ratio (M‐H, Random, 95% CI) | 0.0 [0.0, 0.0] |
| 25.4 Unknown/unreported/mixed | 2 | 326 | Risk Ratio (M‐H, Random, 95% CI) | 0.35 [0.14, 0.88] |
| 26 Low birthweight (less than 2500 g) (by supplementation scheme/regimen) Show forest plot | 3 | 491 | Risk Ratio (M‐H, Random, 95% CI) | 0.39 [0.24, 0.65] |
| 26.1 Single dose | 2 | 365 | Risk Ratio (M‐H, Random, 95% CI) | 0.32 [0.16, 0.65] |
| 26.2 Daily | 1 | 126 | Risk Ratio (M‐H, Random, 95% CI) | 0.53 [0.23, 1.21] |
| 26.3 Weekly/monthly | 0 | 0 | Risk Ratio (M‐H, Random, 95% CI) | 0.0 [0.0, 0.0] |
| 27 Low birthweight (less than 2500 g) (by skin pigmentation based on Fitzpatrick skin to Show forest plot | 3 | 491 | Risk Ratio (M‐H, Random, 95% CI) | 0.39 [0.24, 0.65] |
| 27.1 Three or less | 0 | 0 | Risk Ratio (M‐H, Random, 95% CI) | 0.0 [0.0, 0.0] |
| 27.2 Four or more | 0 | 0 | Risk Ratio (M‐H, Random, 95% CI) | 0.0 [0.0, 0.0] |
| 27.3 Unknown/unreported/mixed | 3 | 491 | Risk Ratio (M‐H, Random, 95% CI) | 0.39 [0.24, 0.65] |
| 28 Low birthweight (less than 2500 g) (by latitude) Show forest plot | 3 | 491 | Risk Ratio (M‐H, Random, 95% CI) | 0.39 [0.24, 0.65] |
| 28.1 Between Tropics of Cancer and Capricorn | 0 | 0 | Risk Ratio (M‐H, Random, 95% CI) | 0.0 [0.0, 0.0] |
| 28.2 North of the Tropic of Cancer or South of the Tropic of Capricorn | 3 | 491 | Risk Ratio (M‐H, Random, 95% CI) | 0.39 [0.24, 0.65] |
| 28.3 Unknown/unreported | 0 | 0 | Risk Ratio (M‐H, Random, 95% CI) | 0.0 [0.0, 0.0] |
| 29 Low birthweight (less than 2500 g) (by season at the start of pregnancy) Show forest plot | 3 | 491 | Risk Ratio (M‐H, Random, 95% CI) | 0.39 [0.24, 0.65] |
| 29.1 Summer | 0 | 0 | Risk Ratio (M‐H, Random, 95% CI) | 0.0 [0.0, 0.0] |
| 29.2 Fall | 0 | 0 | Risk Ratio (M‐H, Random, 95% CI) | 0.0 [0.0, 0.0] |
| 29.3 Winter | 0 | 0 | Risk Ratio (M‐H, Random, 95% CI) | 0.0 [0.0, 0.0] |
| 29.4 Mixed/unknown | 3 | 491 | Risk Ratio (M‐H, Random, 95% CI) | 0.39 [0.24, 0.65] |
| 30 Caesarean section Show forest plot | 10 | 1104 | Risk Ratio (M‐H, Random, 95% CI) | 0.98 [0.80, 1.21] |
| 31 Gestational hypertension Show forest plot | 2 | 1130 | Risk Ratio (M‐H, Random, 95% CI) | 0.78 [0.41, 1.49] |
| 32 Maternal death (death while pregnant or within 42 days of termination of pregnancy) (ALL) Show forest plot | 1 | 180 | Risk Ratio (M‐H, Random, 95% CI) | 0.0 [0.0, 0.0] |
| 33 Maternal vitamin D concentration at term (25‐hydroxyvitamin D) (nmol/L) (ALL) Show forest plot | 14 | 2470 | Mean Difference (IV, Random, 95% CI) | 35.66 [24.19, 47.13] |
| 34 Birth length (cm) Show forest plot | 8 | 931 | Mean Difference (IV, Random, 95% CI) | 0.57 [0.19, 0.95] |
| 35 Head circumference at birth (cm) Show forest plot | 8 | 1841 | Mean Difference (IV, Random, 95% CI) | 0.11 [‐0.21, 0.44] |
| 36 Birthweight (g) Show forest plot | 17 | 2828 | Mean Difference (IV, Random, 95% CI) | 80.30 [‐14.40, 175.00] |
| 37 Stillbirth Show forest plot | 3 | 584 | Risk Ratio (M‐H, Random, 95% CI) | 0.35 [0.06, 1.98] |
| 38 Neonatal death Show forest plot | 2 | 326 | Risk Ratio (M‐H, Random, 95% CI) | 0.27 [0.04, 1.67] |
| 39 Apgar score less than seven at five minutes Show forest plot | 1 | 165 | Risk Ratio (M‐H, Random, 95% CI) | 0.53 [0.11, 2.53] |
| Outcome or subgroup title | No. of studies | No. of participants | Statistical method | Effect size |
| 1 Pre‐eclampsia (ALL) Show forest plot | 4 | 1174 | Risk Ratio (M‐H, Random, 95% CI) | 0.50 [0.32, 0.78] |
| 2 Gestational diabetes (ALL) Show forest plot | 1 | 54 | Risk Ratio (M‐H, Random, 95% CI) | 0.33 [0.01, 7.84] |
| 3 Preterm birth (less than 37 weeks' gestation) (ALL) Show forest plot | 5 | 942 | Risk Ratio (M‐H, Random, 95% CI) | 1.52 [1.01, 2.28] |
| 4 Low birthweight (less than 2500 g) (ALL) Show forest plot | 2 | 110 | Risk Ratio (M‐H, Random, 95% CI) | 0.68 [0.10, 4.55] |
| 5 Caesarean section Show forest plot | 2 | 146 | Risk Ratio (M‐H, Random, 95% CI) | 1.16 [0.87, 1.54] |
| 6 Gestational hypertension Show forest plot | 1 | 59 | Risk Ratio (M‐H, Random, 95% CI) | 0.26 [0.06, 1.12] |
| 7 Maternal vitamin D concentration at term (25‐hydroxyvitamin D) (nmol/L) (ALL) Show forest plot | 1 | 60 | Mean Difference (IV, Random, 95% CI) | 12.5 [3.80, 21.20] |
| 8 Birth length (cm) Show forest plot | 3 | 194 | Mean Difference (IV, Random, 95% CI) | ‐0.07 [‐0.67, 0.52] |
| 9 Head circumference at birth (cm) Show forest plot | 3 | 198 | Mean Difference (IV, Random, 95% CI) | ‐0.03 [‐0.39, 0.33] |
| 10 Birthweight (g) Show forest plot | 3 | 194 | Mean Difference (IV, Random, 95% CI) | 42.39 [‐86.96, 171.74] |
| 11 Neonatal death Show forest plot | 1 | 660 | Risk Ratio (M‐H, Random, 95% CI) | 0.2 [0.01, 4.15] |
| Outcome or subgroup title | No. of studies | No. of participants | Statistical method | Effect size |
| 1 Gestational diabetes (ALL) Show forest plot | 1 | 1298 | Risk Ratio (M‐H, Random, 95% CI) | 0.42 [0.10, 1.73] |
| 2 Maternal adverse events Show forest plot | 1 | Risk Ratio (M‐H, Random, 95% CI) | Subtotals only | |
| 2.1 Hypercalcaemia | 1 | 1298 | Risk Ratio (M‐H, Random, 95% CI) | 0.0 [0.0, 0.0] |
| 2.2 Hypercalciuria | 1 | 1298 | Risk Ratio (M‐H, Random, 95% CI) | 0.25 [0.02, 3.97] |
| 3 Preterm birth (less than 37 weeks' gestation) (ALL) Show forest plot | 1 | 1298 | Risk Ratio (M‐H, Random, 95% CI) | 1.04 [0.68, 1.59] |
| 4 Low birthweight (less than 2500 g) (ALL) Show forest plot | 1 | 1298 | Risk Ratio (M‐H, Random, 95% CI) | 1.12 [0.82, 1.51] |
| 5 Caesarean section Show forest plot | 1 | 1298 | Risk Ratio (M‐H, Random, 95% CI) | 1.10 [0.95, 1.27] |
| 6 Gestational hypertension Show forest plot | 1 | 1298 | Risk Ratio (M‐H, Random, 95% CI) | 0.93 [0.31, 2.79] |
| 7 Maternal death (death while pregnant or within 42 days of termination of pregnancy) Show forest plot | 1 | 1300 | Risk Ratio (M‐H, Random, 95% CI) | 0.25 [0.02, 3.98] |
| 8 Maternal vitamin D concentration at term (25‐hydroxyvitamin D) (nmol/L) (ALL) Show forest plot | 1 | 635 | Mean Difference (IV, Random, 95% CI) | 75.17 [71.97, 78.37] |
| 9 Birth length (cm) Show forest plot | 1 | 1297 | Mean Difference (IV, Fixed, 95% CI) | 0.0 [‐0.28, 0.28] |
| 10 Head circumference at birth (cm) Show forest plot | 1 | 1297 | Mean Difference (IV, Random, 95% CI) | 0.0 [‐0.17, 0.17] |
| 11 Birthweight (g) Show forest plot | 1 | 1297 | Mean Difference (IV, Random, 95% CI) | ‐7.0 [‐55.95, 41.95] |
| 12 Stillbirth Show forest plot | 1 | 1300 | Risk Ratio (M‐H, Random, 95% CI) | 0.66 [0.29, 1.46] |
| 13 Neonatal death Show forest plot | 1 | 1298 | Risk Ratio (M‐H, Random, 95% CI) | 0.69 [0.22, 2.14] |