| 1 25 µg gE/AS01B versus 50 µg gE/AS01B Show forest plot | 1 | | Risk Ratio (M‐H, Fixed, 95% CI) | Totals not selected |
|
| 1.1 Participants with any fatigue | 1 | | Risk Ratio (M‐H, Fixed, 95% CI) | 0.0 [0.0, 0.0] |
| 1.2 Participants with grade 3 fatigue | 1 | | Risk Ratio (M‐H, Fixed, 95% CI) | 0.0 [0.0, 0.0] |
| 1.3 Participants with any fever | 1 | | Risk Ratio (M‐H, Fixed, 95% CI) | 0.0 [0.0, 0.0] |
| 1.4 Participants with grade 3 fever | 1 | | Risk Ratio (M‐H, Fixed, 95% CI) | 0.0 [0.0, 0.0] |
| 1.5 Participants with any headache | 1 | | Risk Ratio (M‐H, Fixed, 95% CI) | 0.0 [0.0, 0.0] |
| 1.6 Participants with grade 3 headache | 1 | | Risk Ratio (M‐H, Fixed, 95% CI) | 0.0 [0.0, 0.0] |
| 1.7 Participants with any myalgia | 1 | | Risk Ratio (M‐H, Fixed, 95% CI) | 0.0 [0.0, 0.0] |
| 1.8 Participants with grade 3 myalgia | 1 | | Risk Ratio (M‐H, Fixed, 95% CI) | 0.0 [0.0, 0.0] |
| 1.9 Participants with local pain | 1 | | Risk Ratio (M‐H, Fixed, 95% CI) | 0.0 [0.0, 0.0] |
| 1.10 Participants with grade 3 local pain | 1 | | Risk Ratio (M‐H, Fixed, 95% CI) | 0.0 [0.0, 0.0] |
| 1.11 Participants with local redness | 1 | | Risk Ratio (M‐H, Fixed, 95% CI) | 0.0 [0.0, 0.0] |
| 1.12 Participants with grade 3 local redness | 1 | | Risk Ratio (M‐H, Fixed, 95% CI) | 0.0 [0.0, 0.0] |
| 1.13 Participants with local swelling | 1 | | Risk Ratio (M‐H, Fixed, 95% CI) | 0.0 [0.0, 0.0] |
| 1.14 Participants with grade 3 local swelling | 1 | | Risk Ratio (M‐H, Fixed, 95% CI) | 0.0 [0.0, 0.0] |
| 1.15 Participants with consent withdrawal | 1 | | Risk Ratio (M‐H, Fixed, 95% CI) | 0.0 [0.0, 0.0] |
| 1.16 Participants with lost to follow‐up | 1 | | Risk Ratio (M‐H, Fixed, 95% CI) | 0.0 [0.0, 0.0] |
| 1.17 Participants with death | 1 | | Risk Ratio (M‐H, Fixed, 95% CI) | 0.0 [0.0, 0.0] |
| 2 25 µg gE/AS01B versus 100 µg gE/AS01B Show forest plot | 1 | | Risk Ratio (M‐H, Fixed, 95% CI) | Totals not selected |
|
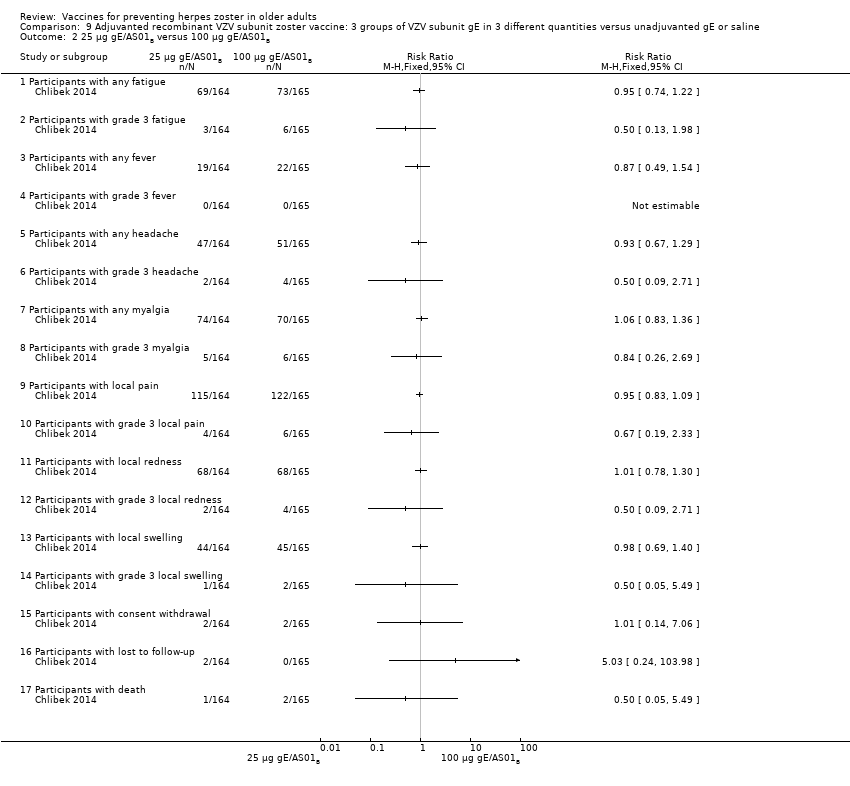
| 2.1 Participants with any fatigue | 1 | | Risk Ratio (M‐H, Fixed, 95% CI) | 0.0 [0.0, 0.0] |
| 2.2 Participants with grade 3 fatigue | 1 | | Risk Ratio (M‐H, Fixed, 95% CI) | 0.0 [0.0, 0.0] |
| 2.3 Participants with any fever | 1 | | Risk Ratio (M‐H, Fixed, 95% CI) | 0.0 [0.0, 0.0] |
| 2.4 Participants with grade 3 fever | 1 | | Risk Ratio (M‐H, Fixed, 95% CI) | 0.0 [0.0, 0.0] |
| 2.5 Participants with any headache | 1 | | Risk Ratio (M‐H, Fixed, 95% CI) | 0.0 [0.0, 0.0] |
| 2.6 Participants with grade 3 headache | 1 | | Risk Ratio (M‐H, Fixed, 95% CI) | 0.0 [0.0, 0.0] |
| 2.7 Participants with any myalgia | 1 | | Risk Ratio (M‐H, Fixed, 95% CI) | 0.0 [0.0, 0.0] |
| 2.8 Participants with grade 3 myalgia | 1 | | Risk Ratio (M‐H, Fixed, 95% CI) | 0.0 [0.0, 0.0] |
| 2.9 Participants with local pain | 1 | | Risk Ratio (M‐H, Fixed, 95% CI) | 0.0 [0.0, 0.0] |
| 2.10 Participants with grade 3 local pain | 1 | | Risk Ratio (M‐H, Fixed, 95% CI) | 0.0 [0.0, 0.0] |
| 2.11 Participants with local redness | 1 | | Risk Ratio (M‐H, Fixed, 95% CI) | 0.0 [0.0, 0.0] |
| 2.12 Participants with grade 3 local redness | 1 | | Risk Ratio (M‐H, Fixed, 95% CI) | 0.0 [0.0, 0.0] |
| 2.13 Participants with local swelling | 1 | | Risk Ratio (M‐H, Fixed, 95% CI) | 0.0 [0.0, 0.0] |
| 2.14 Participants with grade 3 local swelling | 1 | | Risk Ratio (M‐H, Fixed, 95% CI) | 0.0 [0.0, 0.0] |
| 2.15 Participants with consent withdrawal | 1 | | Risk Ratio (M‐H, Fixed, 95% CI) | 0.0 [0.0, 0.0] |
| 2.16 Participants with lost to follow‐up | 1 | | Risk Ratio (M‐H, Fixed, 95% CI) | 0.0 [0.0, 0.0] |
| 2.17 Participants with death | 1 | | Risk Ratio (M‐H, Fixed, 95% CI) | 0.0 [0.0, 0.0] |
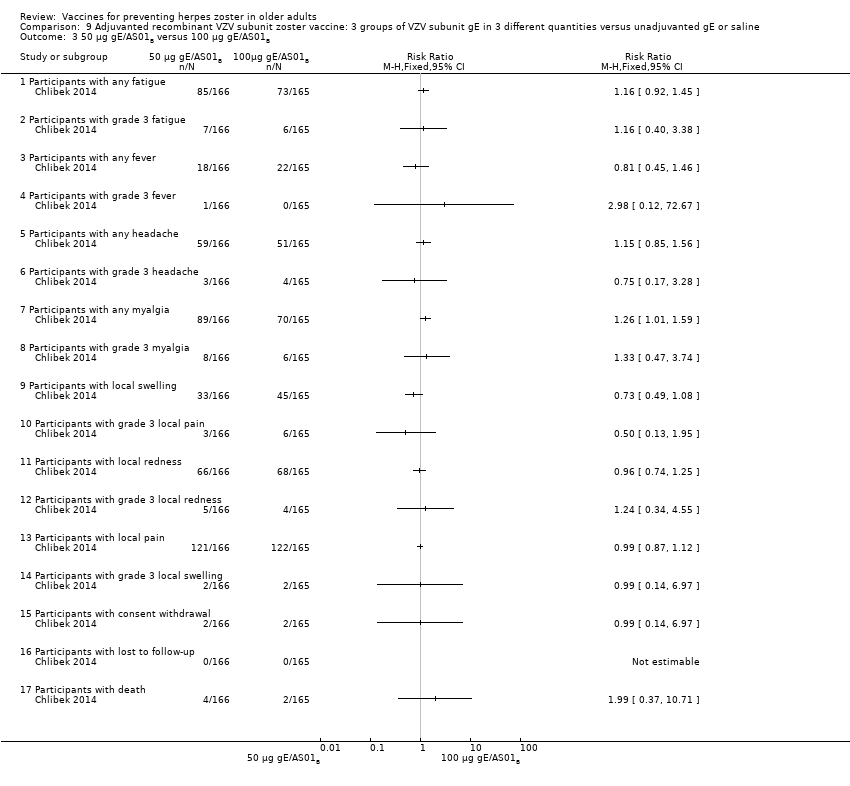
| 3 50 µg gE/AS01B versus 100 µg gE/AS01B Show forest plot | 1 | | Risk Ratio (M‐H, Fixed, 95% CI) | Totals not selected |
|
| 3.1 Participants with any fatigue | 1 | | Risk Ratio (M‐H, Fixed, 95% CI) | 0.0 [0.0, 0.0] |
| 3.2 Participants with grade 3 fatigue | 1 | | Risk Ratio (M‐H, Fixed, 95% CI) | 0.0 [0.0, 0.0] |
| 3.3 Participants with any fever | 1 | | Risk Ratio (M‐H, Fixed, 95% CI) | 0.0 [0.0, 0.0] |
| 3.4 Participants with grade 3 fever | 1 | | Risk Ratio (M‐H, Fixed, 95% CI) | 0.0 [0.0, 0.0] |
| 3.5 Participants with any headache | 1 | | Risk Ratio (M‐H, Fixed, 95% CI) | 0.0 [0.0, 0.0] |
| 3.6 Participants with grade 3 headache | 1 | | Risk Ratio (M‐H, Fixed, 95% CI) | 0.0 [0.0, 0.0] |
| 3.7 Participants with any myalgia | 1 | | Risk Ratio (M‐H, Fixed, 95% CI) | 0.0 [0.0, 0.0] |
| 3.8 Participants with grade 3 myalgia | 1 | | Risk Ratio (M‐H, Fixed, 95% CI) | 0.0 [0.0, 0.0] |
| 3.9 Participants with local swelling | 1 | | Risk Ratio (M‐H, Fixed, 95% CI) | 0.0 [0.0, 0.0] |
| 3.10 Participants with grade 3 local pain | 1 | | Risk Ratio (M‐H, Fixed, 95% CI) | 0.0 [0.0, 0.0] |
| 3.11 Participants with local redness | 1 | | Risk Ratio (M‐H, Fixed, 95% CI) | 0.0 [0.0, 0.0] |
| 3.12 Participants with grade 3 local redness | 1 | | Risk Ratio (M‐H, Fixed, 95% CI) | 0.0 [0.0, 0.0] |
| 3.13 Participants with local pain | 1 | | Risk Ratio (M‐H, Fixed, 95% CI) | 0.0 [0.0, 0.0] |
| 3.14 Participants with grade 3 local swelling | 1 | | Risk Ratio (M‐H, Fixed, 95% CI) | 0.0 [0.0, 0.0] |
| 3.15 Participants with consent withdrawal | 1 | | Risk Ratio (M‐H, Fixed, 95% CI) | 0.0 [0.0, 0.0] |
| 3.16 Participants with lost to follow‐up | 1 | | Risk Ratio (M‐H, Fixed, 95% CI) | 0.0 [0.0, 0.0] |
| 3.17 Participants with death | 1 | | Risk Ratio (M‐H, Fixed, 95% CI) | 0.0 [0.0, 0.0] |
| 4 25 µg gE/AS01B versus 100 µg gE/saline (unadjuvanted gE) Show forest plot | 1 | | Risk Ratio (M‐H, Fixed, 95% CI) | Totals not selected |
|
| 4.1 Participants with any fatigue | 1 | | Risk Ratio (M‐H, Fixed, 95% CI) | 0.0 [0.0, 0.0] |
| 4.2 Participants with grade 3 fatigue | 1 | | Risk Ratio (M‐H, Fixed, 95% CI) | 0.0 [0.0, 0.0] |
| 4.3 Participants with any fever | 1 | | Risk Ratio (M‐H, Fixed, 95% CI) | 0.0 [0.0, 0.0] |
| 4.4 Participants with grade 3 fever | 1 | | Risk Ratio (M‐H, Fixed, 95% CI) | 0.0 [0.0, 0.0] |
| 4.5 Participants with any headache | 1 | | Risk Ratio (M‐H, Fixed, 95% CI) | 0.0 [0.0, 0.0] |
| 4.6 Participants with grade 3 headache | 1 | | Risk Ratio (M‐H, Fixed, 95% CI) | 0.0 [0.0, 0.0] |
| 4.7 Participants with any myalgia | 1 | | Risk Ratio (M‐H, Fixed, 95% CI) | 0.0 [0.0, 0.0] |
| 4.8 Participants with grade 3 myalgia | 1 | | Risk Ratio (M‐H, Fixed, 95% CI) | 0.0 [0.0, 0.0] |
| 4.9 Participants with local pain | 1 | | Risk Ratio (M‐H, Fixed, 95% CI) | 0.0 [0.0, 0.0] |
| 4.10 Participants with grade 3 local pain | 1 | | Risk Ratio (M‐H, Fixed, 95% CI) | 0.0 [0.0, 0.0] |
| 4.11 Participants with local redness | 1 | | Risk Ratio (M‐H, Fixed, 95% CI) | 0.0 [0.0, 0.0] |
| 4.12 Participants with grade 3 local redness | 1 | | Risk Ratio (M‐H, Fixed, 95% CI) | 0.0 [0.0, 0.0] |
| 4.13 Participants with local swelling | 1 | | Risk Ratio (M‐H, Fixed, 95% CI) | 0.0 [0.0, 0.0] |
| 4.14 Participants with grade 3 local swelling | 1 | | Risk Ratio (M‐H, Fixed, 95% CI) | 0.0 [0.0, 0.0] |
| 4.15 Participants with consent withdrawal | 1 | | Risk Ratio (M‐H, Fixed, 95% CI) | 0.0 [0.0, 0.0] |
| 4.16 Participants with lost to follow‐up | 1 | | Risk Ratio (M‐H, Fixed, 95% CI) | 0.0 [0.0, 0.0] |
| 4.17 Participants with death | 1 | | Risk Ratio (M‐H, Fixed, 95% CI) | 0.0 [0.0, 0.0] |
| 5 50 µg gE/AS01B a versus 100 µg gE/saline (unadjuvanted gE) Show forest plot | 1 | | Risk Ratio (M‐H, Fixed, 95% CI) | Totals not selected |
|
| 5.1 Participants with any fatigue | 1 | | Risk Ratio (M‐H, Fixed, 95% CI) | 0.0 [0.0, 0.0] |
| 5.2 Participants with grade 3 fatigue | 1 | | Risk Ratio (M‐H, Fixed, 95% CI) | 0.0 [0.0, 0.0] |
| 5.3 Participants with any fever | 1 | | Risk Ratio (M‐H, Fixed, 95% CI) | 0.0 [0.0, 0.0] |
| 5.4 Participants with grade 3 fever | 1 | | Risk Ratio (M‐H, Fixed, 95% CI) | 0.0 [0.0, 0.0] |
| 5.5 Participants with any headache | 1 | | Risk Ratio (M‐H, Fixed, 95% CI) | 0.0 [0.0, 0.0] |
| 5.6 Participants with grade 3 headache | 1 | | Risk Ratio (M‐H, Fixed, 95% CI) | 0.0 [0.0, 0.0] |
| 5.7 Participants with any myalgia | 1 | | Risk Ratio (M‐H, Fixed, 95% CI) | 0.0 [0.0, 0.0] |
| 5.8 Participants with grade 3 myalgia | 1 | | Risk Ratio (M‐H, Fixed, 95% CI) | 0.0 [0.0, 0.0] |
| 5.9 Participants with local pain | 1 | | Risk Ratio (M‐H, Fixed, 95% CI) | 0.0 [0.0, 0.0] |
| 5.10 Participants with grade 3 local pain | 1 | | Risk Ratio (M‐H, Fixed, 95% CI) | 0.0 [0.0, 0.0] |
| 5.11 Participants with local redness | 1 | | Risk Ratio (M‐H, Fixed, 95% CI) | 0.0 [0.0, 0.0] |
| 5.12 Participants with grade 3 local redness | 1 | | Risk Ratio (M‐H, Fixed, 95% CI) | 0.0 [0.0, 0.0] |
| 5.13 Participants with local swelling | 1 | | Risk Ratio (M‐H, Fixed, 95% CI) | 0.0 [0.0, 0.0] |
| 5.14 Participants with grade 3 local swelling | 1 | | Risk Ratio (M‐H, Fixed, 95% CI) | 0.0 [0.0, 0.0] |
| 5.15 Participants with consent withdrawal | 1 | | Risk Ratio (M‐H, Fixed, 95% CI) | 0.0 [0.0, 0.0] |
| 5.16 Participants with lost to follow‐up | 1 | | Risk Ratio (M‐H, Fixed, 95% CI) | 0.0 [0.0, 0.0] |
| 5.17 Participants with death | 1 | | Risk Ratio (M‐H, Fixed, 95% CI) | 0.0 [0.0, 0.0] |
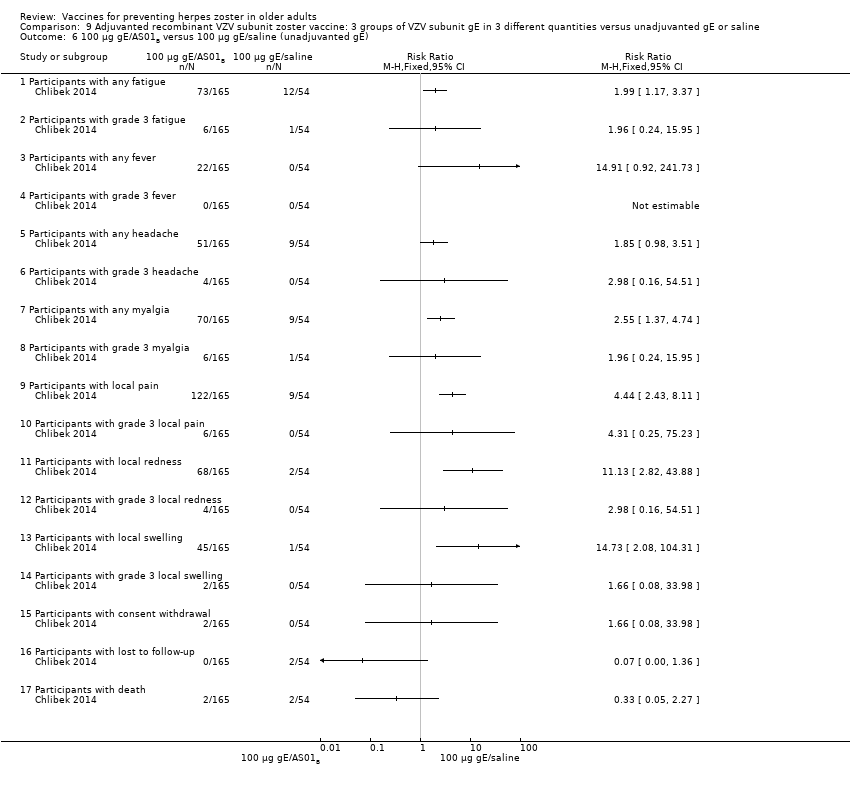
| 6 100 µg gE/AS01B versus 100 µg gE/saline (unadjuvanted gE) Show forest plot | 1 | | Risk Ratio (M‐H, Fixed, 95% CI) | Totals not selected |
|
| 6.1 Participants with any fatigue | 1 | | Risk Ratio (M‐H, Fixed, 95% CI) | 0.0 [0.0, 0.0] |
| 6.2 Participants with grade 3 fatigue | 1 | | Risk Ratio (M‐H, Fixed, 95% CI) | 0.0 [0.0, 0.0] |
| 6.3 Participants with any fever | 1 | | Risk Ratio (M‐H, Fixed, 95% CI) | 0.0 [0.0, 0.0] |
| 6.4 Participants with grade 3 fever | 1 | | Risk Ratio (M‐H, Fixed, 95% CI) | 0.0 [0.0, 0.0] |
| 6.5 Participants with any headache | 1 | | Risk Ratio (M‐H, Fixed, 95% CI) | 0.0 [0.0, 0.0] |
| 6.6 Participants with grade 3 headache | 1 | | Risk Ratio (M‐H, Fixed, 95% CI) | 0.0 [0.0, 0.0] |
| 6.7 Participants with any myalgia | 1 | | Risk Ratio (M‐H, Fixed, 95% CI) | 0.0 [0.0, 0.0] |
| 6.8 Participants with grade 3 myalgia | 1 | | Risk Ratio (M‐H, Fixed, 95% CI) | 0.0 [0.0, 0.0] |
| 6.9 Participants with local pain | 1 | | Risk Ratio (M‐H, Fixed, 95% CI) | 0.0 [0.0, 0.0] |
| 6.10 Participants with grade 3 local pain | 1 | | Risk Ratio (M‐H, Fixed, 95% CI) | 0.0 [0.0, 0.0] |
| 6.11 Participants with local redness | 1 | | Risk Ratio (M‐H, Fixed, 95% CI) | 0.0 [0.0, 0.0] |
| 6.12 Participants with grade 3 local redness | 1 | | Risk Ratio (M‐H, Fixed, 95% CI) | 0.0 [0.0, 0.0] |
| 6.13 Participants with local swelling | 1 | | Risk Ratio (M‐H, Fixed, 95% CI) | 0.0 [0.0, 0.0] |
| 6.14 Participants with grade 3 local swelling | 1 | | Risk Ratio (M‐H, Fixed, 95% CI) | 0.0 [0.0, 0.0] |
| 6.15 Participants with consent withdrawal | 1 | | Risk Ratio (M‐H, Fixed, 95% CI) | 0.0 [0.0, 0.0] |
| 6.16 Participants with lost to follow‐up | 1 | | Risk Ratio (M‐H, Fixed, 95% CI) | 0.0 [0.0, 0.0] |
| 6.17 Participants with death | 1 | | Risk Ratio (M‐H, Fixed, 95% CI) | 0.0 [0.0, 0.0] |
| 7 25 µg gE/AS01B versus saline + 100 µg gE/AS01B Show forest plot | 1 | | Risk Ratio (M‐H, Fixed, 95% CI) | Totals not selected |
|
| 7.1 Participants with any fatigue | 1 | | Risk Ratio (M‐H, Fixed, 95% CI) | 0.0 [0.0, 0.0] |
| 7.2 Participants with grade 3 fatigue | 1 | | Risk Ratio (M‐H, Fixed, 95% CI) | 0.0 [0.0, 0.0] |
| 7.3 Participants with any fever | 1 | | Risk Ratio (M‐H, Fixed, 95% CI) | 0.0 [0.0, 0.0] |
| 7.4 Participants with grade 3 fever | 1 | | Risk Ratio (M‐H, Fixed, 95% CI) | 0.0 [0.0, 0.0] |
| 7.5 Participants with any headache | 1 | | Risk Ratio (M‐H, Fixed, 95% CI) | 0.0 [0.0, 0.0] |
| 7.6 Participants with grade 3 headache | 1 | | Risk Ratio (M‐H, Fixed, 95% CI) | 0.0 [0.0, 0.0] |
| 7.7 Participants with any myalgia | 1 | | Risk Ratio (M‐H, Fixed, 95% CI) | 0.0 [0.0, 0.0] |
| 7.8 Participants with grade 3 myalgia | 1 | | Risk Ratio (M‐H, Fixed, 95% CI) | 0.0 [0.0, 0.0] |
| 7.9 Participants with local pain | 1 | | Risk Ratio (M‐H, Fixed, 95% CI) | 0.0 [0.0, 0.0] |
| 7.10 Participants with grade 3 local pain | 1 | | Risk Ratio (M‐H, Fixed, 95% CI) | 0.0 [0.0, 0.0] |
| 7.11 Participants with local redness | 1 | | Risk Ratio (M‐H, Fixed, 95% CI) | 0.0 [0.0, 0.0] |
| 7.12 Participants with grade 3 local redness | 1 | | Risk Ratio (M‐H, Fixed, 95% CI) | 0.0 [0.0, 0.0] |
| 7.13 Participants with local swelling | 1 | | Risk Ratio (M‐H, Fixed, 95% CI) | 0.0 [0.0, 0.0] |
| 7.14 Participants with grade 3 local swelling | 1 | | Risk Ratio (M‐H, Fixed, 95% CI) | 0.0 [0.0, 0.0] |
| 7.15 Participants with consent withdrawal | 1 | | Risk Ratio (M‐H, Fixed, 95% CI) | 0.0 [0.0, 0.0] |
| 7.16 Participants with lost to follow‐up | 1 | | Risk Ratio (M‐H, Fixed, 95% CI) | 0.0 [0.0, 0.0] |
| 7.17 Participants with death | 1 | | Risk Ratio (M‐H, Fixed, 95% CI) | 0.0 [0.0, 0.0] |
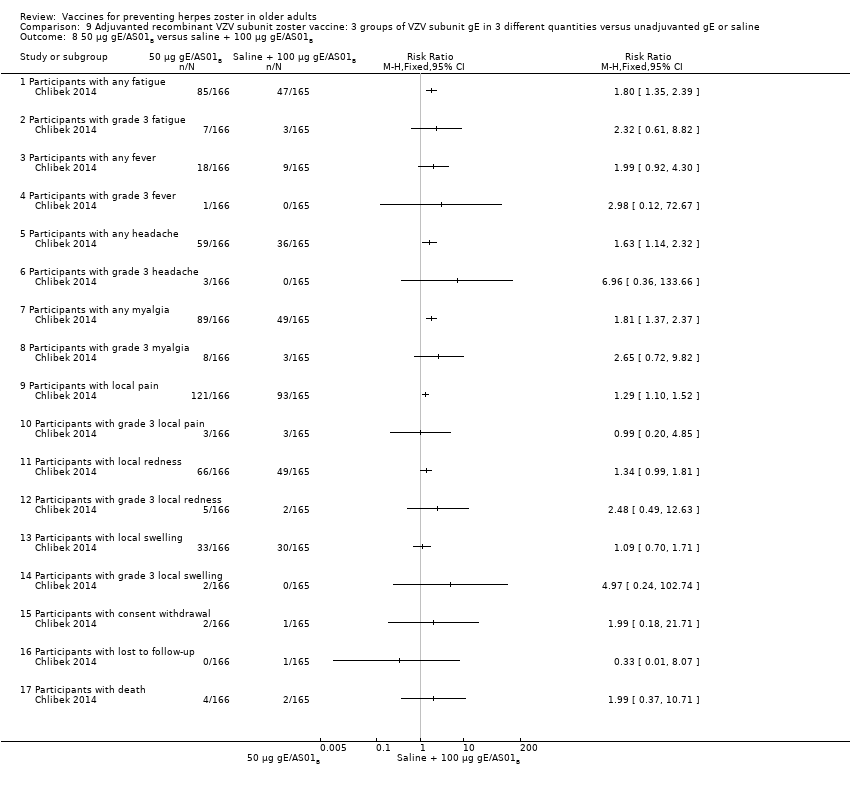
| 8 50 µg gE/AS01B versus saline + 100 µg gE/AS01B Show forest plot | 1 | | Risk Ratio (M‐H, Fixed, 95% CI) | Totals not selected |
|
| 8.1 Participants with any fatigue | 1 | | Risk Ratio (M‐H, Fixed, 95% CI) | 0.0 [0.0, 0.0] |
| 8.2 Participants with grade 3 fatigue | 1 | | Risk Ratio (M‐H, Fixed, 95% CI) | 0.0 [0.0, 0.0] |
| 8.3 Participants with any fever | 1 | | Risk Ratio (M‐H, Fixed, 95% CI) | 0.0 [0.0, 0.0] |
| 8.4 Participants with grade 3 fever | 1 | | Risk Ratio (M‐H, Fixed, 95% CI) | 0.0 [0.0, 0.0] |
| 8.5 Participants with any headache | 1 | | Risk Ratio (M‐H, Fixed, 95% CI) | 0.0 [0.0, 0.0] |
| 8.6 Participants with grade 3 headache | 1 | | Risk Ratio (M‐H, Fixed, 95% CI) | 0.0 [0.0, 0.0] |
| 8.7 Participants with any myalgia | 1 | | Risk Ratio (M‐H, Fixed, 95% CI) | 0.0 [0.0, 0.0] |
| 8.8 Participants with grade 3 myalgia | 1 | | Risk Ratio (M‐H, Fixed, 95% CI) | 0.0 [0.0, 0.0] |
| 8.9 Participants with local pain | 1 | | Risk Ratio (M‐H, Fixed, 95% CI) | 0.0 [0.0, 0.0] |
| 8.10 Participants with grade 3 local pain | 1 | | Risk Ratio (M‐H, Fixed, 95% CI) | 0.0 [0.0, 0.0] |
| 8.11 Participants with local redness | 1 | | Risk Ratio (M‐H, Fixed, 95% CI) | 0.0 [0.0, 0.0] |
| 8.12 Participants with grade 3 local redness | 1 | | Risk Ratio (M‐H, Fixed, 95% CI) | 0.0 [0.0, 0.0] |
| 8.13 Participants with local swelling | 1 | | Risk Ratio (M‐H, Fixed, 95% CI) | 0.0 [0.0, 0.0] |
| 8.14 Participants with grade 3 local swelling | 1 | | Risk Ratio (M‐H, Fixed, 95% CI) | 0.0 [0.0, 0.0] |
| 8.15 Participants with consent withdrawal | 1 | | Risk Ratio (M‐H, Fixed, 95% CI) | 0.0 [0.0, 0.0] |
| 8.16 Participants with lost to follow‐up | 1 | | Risk Ratio (M‐H, Fixed, 95% CI) | 0.0 [0.0, 0.0] |
| 8.17 Participants with death | 1 | | Risk Ratio (M‐H, Fixed, 95% CI) | 0.0 [0.0, 0.0] |
| 9 100 µg gE/AS01B versus saline + 100 µg gE/AS01B Show forest plot | 1 | | Odds Ratio (M‐H, Fixed, 95% CI) | Totals not selected |
|
| 9.1 Participants with any fatigue | 1 | | Odds Ratio (M‐H, Fixed, 95% CI) | 0.0 [0.0, 0.0] |
| 9.2 Participants with grade 3 fatigue | 1 | | Odds Ratio (M‐H, Fixed, 95% CI) | 0.0 [0.0, 0.0] |
| 9.3 Participants with any fever | 1 | | Odds Ratio (M‐H, Fixed, 95% CI) | 0.0 [0.0, 0.0] |
| 9.4 Participants with grade 3 fever | 1 | | Odds Ratio (M‐H, Fixed, 95% CI) | 0.0 [0.0, 0.0] |
| 9.5 Participants with any headache | 1 | | Odds Ratio (M‐H, Fixed, 95% CI) | 0.0 [0.0, 0.0] |
| 9.6 Participants with grade 3 headache | 1 | | Odds Ratio (M‐H, Fixed, 95% CI) | 0.0 [0.0, 0.0] |
| 9.7 Participants with any myalgia | 1 | | Odds Ratio (M‐H, Fixed, 95% CI) | 0.0 [0.0, 0.0] |
| 9.8 Participants with grade 3 myalgia | 1 | | Odds Ratio (M‐H, Fixed, 95% CI) | 0.0 [0.0, 0.0] |
| 9.9 Participants with local pain | 1 | | Odds Ratio (M‐H, Fixed, 95% CI) | 0.0 [0.0, 0.0] |
| 9.10 Participants with grade 3 local pain | 1 | | Odds Ratio (M‐H, Fixed, 95% CI) | 0.0 [0.0, 0.0] |
| 9.11 Participants with local redness | 1 | | Odds Ratio (M‐H, Fixed, 95% CI) | 0.0 [0.0, 0.0] |
| 9.12 Participants with grade 3 local redness | 1 | | Odds Ratio (M‐H, Fixed, 95% CI) | 0.0 [0.0, 0.0] |
| 9.13 Participants with local swelling | 1 | | Odds Ratio (M‐H, Fixed, 95% CI) | 0.0 [0.0, 0.0] |
| 9.14 Participants with grade 3 local swelling | 1 | | Odds Ratio (M‐H, Fixed, 95% CI) | 0.0 [0.0, 0.0] |
| 9.15 Participants with consent withdrawal | 1 | | Odds Ratio (M‐H, Fixed, 95% CI) | 0.0 [0.0, 0.0] |
| 9.16 Participants with lost to follow‐up | 1 | | Odds Ratio (M‐H, Fixed, 95% CI) | 0.0 [0.0, 0.0] |
| 9.17 Participants with death | 1 | | Odds Ratio (M‐H, Fixed, 95% CI) | 0.0 [0.0, 0.0] |
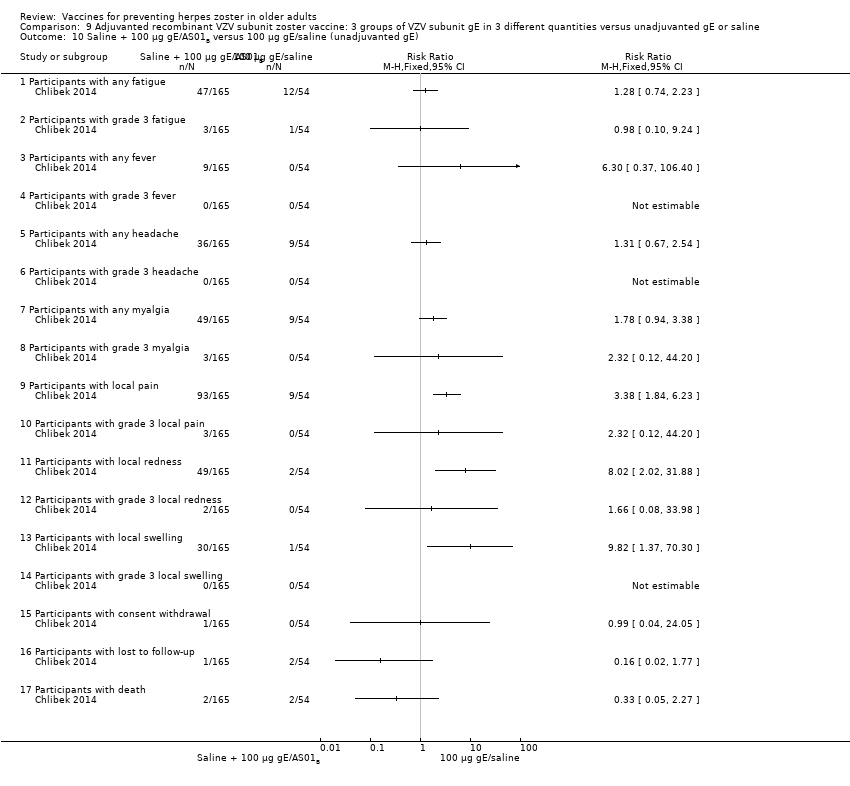
| 10 Saline + 100 µg gE/AS01B versus 100 µg gE/saline (unadjuvanted gE) Show forest plot | 1 | | Risk Ratio (M‐H, Fixed, 95% CI) | Totals not selected |
|
| 10.1 Participants with any fatigue | 1 | | Risk Ratio (M‐H, Fixed, 95% CI) | 0.0 [0.0, 0.0] |
| 10.2 Participants with grade 3 fatigue | 1 | | Risk Ratio (M‐H, Fixed, 95% CI) | 0.0 [0.0, 0.0] |
| 10.3 Participants with any fever | 1 | | Risk Ratio (M‐H, Fixed, 95% CI) | 0.0 [0.0, 0.0] |
| 10.4 Participants with grade 3 fever | 1 | | Risk Ratio (M‐H, Fixed, 95% CI) | 0.0 [0.0, 0.0] |
| 10.5 Participants with any headache | 1 | | Risk Ratio (M‐H, Fixed, 95% CI) | 0.0 [0.0, 0.0] |
| 10.6 Participants with grade 3 headache | 1 | | Risk Ratio (M‐H, Fixed, 95% CI) | 0.0 [0.0, 0.0] |
| 10.7 Participants with any myalgia | 1 | | Risk Ratio (M‐H, Fixed, 95% CI) | 0.0 [0.0, 0.0] |
| 10.8 Participants with grade 3 myalgia | 1 | | Risk Ratio (M‐H, Fixed, 95% CI) | 0.0 [0.0, 0.0] |
| 10.9 Participants with local pain | 1 | | Risk Ratio (M‐H, Fixed, 95% CI) | 0.0 [0.0, 0.0] |
| 10.10 Participants with grade 3 local pain | 1 | | Risk Ratio (M‐H, Fixed, 95% CI) | 0.0 [0.0, 0.0] |
| 10.11 Participants with local redness | 1 | | Risk Ratio (M‐H, Fixed, 95% CI) | 0.0 [0.0, 0.0] |
| 10.12 Participants with grade 3 local redness | 1 | | Risk Ratio (M‐H, Fixed, 95% CI) | 0.0 [0.0, 0.0] |
| 10.13 Participants with local swelling | 1 | | Risk Ratio (M‐H, Fixed, 95% CI) | 0.0 [0.0, 0.0] |
| 10.14 Participants with grade 3 local swelling | 1 | | Risk Ratio (M‐H, Fixed, 95% CI) | 0.0 [0.0, 0.0] |
| 10.15 Participants with consent withdrawal | 1 | | Risk Ratio (M‐H, Fixed, 95% CI) | 0.0 [0.0, 0.0] |
| 10.16 Participants with lost to follow‐up | 1 | | Risk Ratio (M‐H, Fixed, 95% CI) | 0.0 [0.0, 0.0] |
| 10.17 Participants with death | 1 | | Risk Ratio (M‐H, Fixed, 95% CI) | 0.0 [0.0, 0.0] |