Vaksin untuk mencegah herpes zoster (kayap) di kalangan orang dewasa yang lebih tua
Referencias
References to studies included in this review
References to studies excluded from this review
References to ongoing studies
Additional references
References to other published versions of this review
Characteristics of studies
Characteristics of included studies [ordered by study ID]
| Methods | RCT, double‐blind | |
| Participants | 200 older adult participants | |
| Interventions | 1. A live attenuated VZV/Oka vaccine 3200 pfu/dose SC (frozen); N = 49 2. A live attenuated VZV/Oka vaccine 8500 pfu/dose SC (frozen); N = 51 3. A live attenuated VZV/Oka vaccine 41,650 pfu/dose SC (frozen); N = 49 4. Pneumococcal polysaccharide vaccine (pneumo 23) SC (refrigerated); N = 49 | |
| Outcomes | Local adverse reaction during 42 days (6 weeks): none, ≥ 1 reaction, induration (diameter ≥ 2 cm), pain (all), pain (probably vaccine‐related), redness (diameter ≥ 2 cm), pruritus and vesicles | |
| Purpose of the Study | "To evaluate the cell‐mediated and humoral immunogenicity and the safety of 1 of 3 doses of a live attenuated varicella‐zoster virus vaccine/OKA compared with a control vaccine" | |
| Funding sources | Pasteur Mérrieux Connaught, Lyon, France | |
| Notes | No participants had fever during the 72 hours following vaccination 1 participant in the 8500 pfu VZV group presented with a mild vesicular rash after vaccination, which lasted 7 days Analysis of the vesicular fluid was negative for VZV (polymerase chain reaction (PCR) analysis) No intention‐to‐treat analysis | |
| Risk of bias | ||
| Bias | Authors' judgement | Support for judgement |
| Random sequence generation (selection bias) | Unclear risk | Not described |
| Allocation concealment (selection bias) | Unclear risk | Not described |
| Blinding (performance bias and detection bias) | Low risk | "Three groups of different concentrations of a live attenuated VZV/Oka vaccine under double‐blind conditions. 1 group of pneumococcal polysaccharide vaccine under single‐blind conditions and used as a control for a reactogenicity and immune response" |
| Blinding of participants and personnel (performance bias) | Unclear risk | Not described |
| Blinding of outcome assessment (detection bias) | Unclear risk | Not described |
| Incomplete outcome data (attrition bias) | Unclear risk | Not described |
| Selective reporting (reporting bias) | Low risk | The adverse events originally defined by the authors were presented for all groups |
| Other bias | Unclear risk | Not described |
| Methods | RCT phase II, parallel‐group, placebo‐controlled, double‐blind 12 centres (1 centre in the Czech Republic, 4 in Spain and 7 in the United States) | |
| Participants | N = 410 participants aged > 50 years Mean age ˜65 years | |
| Interventions | 1. 2 doses 2 months apart 50 μg purified gE/AS01B (1 mg dioleoyl phosphatidylcholine, 250 μg cholesterol, 50 μg MPL and 50 μg QS‐21) 0.5 mL IM N = 150 2. 2 doses 2 months apart 50 μg purified gE/AS01E (500 μg dioleoyl phosphatidylcholine, 125 μg cholesterol, 25 μg MPL and 25 μg QS‐21) 0.5 mL IM N = 149 3. 2 doses 2 months apart 50 μg purified gE/saline (unadjuvanted gE) 0.5 mL IM N = 73 4. 2 doses 2 months apart saline 0.5 mL IM N = 38 | |
| Outcomes | 1. Participants with solicited general solicited symptoms (fatigue, fever (recorded as temperature), headache, gastrointestinal symptoms, and myalgia) between days 0 and 6 2. Participants with solicited local reactions (pain, redness and swelling at the injection site) between days 0 and 6 3. Participants with unsolicited symptoms between days 0 and 29 after each dose 4. Participants with temperature was scored grade 3 (> 39.0°C) 5. Participants with other symptoms were scored grade 3 for prevents normal activity 6. Participants with redness and swelling at the injection site were scored grade 3 (> 100 mm) 7. Severe adverse events (SAEs) were collected for 1 year after the last vaccination and were defined as events that resulted in death, were life‐threatening, required hospitalisation or prolongation of existing hospitalisation, resulted in disability/incapacity, caused a congenital anomaly/birth defect in the child of a study participant, or could have jeopardised the participant or required medical or surgical intervention | |
| Purpose of the Study | Immunogenicity and reactogenicity of recombinant gE in a representative older adult population | |
| Funding sources | GlaxoSmithKline Biologicals SA, Belgium | |
| Notes | "Of the 410 subjects, 395 completed the study. Of the 15 participants who discontinued the study early, 2 withdrew due to treatment related AEs (1 participants each in the gE/AS01E and gE/AS01B groups) and 2 withdrew for SAEs not considered treatment related (digestive tract haemorrhage in the gE/AS01E group and myocardial infarction in the gE/AS01B group), 2 vaccine‐related adverse events led to withdrawal from the study: 1 subject treated with gE/AS01B withdrew due to malaise beginning on the day of vaccination, and 1 participants treated with gE/AS01E withdrew due to injection site redness that lasted > 2 weeks. 2 lost to follow‐up (gE/AS01B), 8 consent withdrawal (4 in the gE/AS01B, 2 in the gE/AS01E, 1 in the gE/saline and 1 after second dose of vaccine in the group gE/AS01B). 1 protocol violation (gE/AS01E)" The only unsolicited symptom reported by > 3% of participants in any group was chills, which was reported by 5% (8/150) of participants treated with gE/AS01B and 2% (3/149) of those treated with gE/AS01E; it was not reported in participants treated with gE/ saline or saline alone No vaccine‐related SAEs and no cases of HZ were reported through month 14 of the study We had asked to authors about the AEs by age or by vaccination but they have answered us only the published data | |
| Risk of bias | ||
| Bias | Authors' judgement | Support for judgement |
| Random sequence generation (selection bias) | Low risk | "The randomisation was made using an algorithm that stratified by country, minimized for age, and included a block size of 11" |
| Allocation concealment (selection bias) | Low risk | "Treatments were allocated at each site using a central randomisation system on the Internet" |
| Blinding (performance bias and detection bias) | Low risk | "The person in charge of the vaccination accessed the randomisation system on Internet using the subject number and age" |
| Blinding of participants and personnel (performance bias) | Low risk | "Both vaccine recipients and observers responsible for evaluations were blinded to which formulation was administered" |
| Blinding of outcome assessment (detection bias) | Low risk | "Both vaccine recipients and observers responsible for evaluations were blinded to which formulation was administered" |
| Incomplete outcome data (attrition bias) | Low risk | The patient flow is clear |
| Selective reporting (reporting bias) | Low risk | The adverse events originally defined by the authors were presented for all groups |
| Other bias | Unclear risk | We found no more details on this topic |
| Methods | RCT phase II, randomised, controlled, single‐blind (participants) 11 centres in the Czech Republic, Germany, The Netherlands and Sweden Duration: 36 months after first vaccination | |
| Participants | 714 healthy participants aged ≥ 60 years The mean age was ˜69.9 years | |
| Interventions | 1. 2 doses 2 months apart 25 µg gE/AS01B 0.5 mL IM N = 164 2. 2 doses 2 months apart 50 µg gE/AS01B 0.5 mL IM N = 166 3. 2 doses 2 months apart 100 µg gE/AS01B 0.5 mL IM N = 165 5. 2 doses 2 months apart 100 µg gE/saline (unadjuvanted gE) 0.5 mL IM N = 54 | |
| Outcomes | 1. Participants with solicited general reactions (fatigue, fever, headache and myalgia): recorded by participants on diary cards for 7 days after each vaccination 2. Participants with solicited local reactions (pain, redness and swelling at the injection site) 3. Participants with unsolicited adverse events (AEs): recorded for 30 days after each vaccination 4. Participants with serious adverse events (SAEs): recorded over the entire study period (36 months) Intensity of the solicited reactions was scored on a scale from 0 (absent) to 3 (severe). All solicited local reactions were considered vaccination‐related and causality of the solicited general reactions, unsolicited AEs and SAEs was assessed by the investigators | |
| Purpose of the Study | "The aim of the current study is to evaluate the safety and immunogenicity of different schedules and formulations of gE/AS01B in adults ≥ 60 years of age" | |
| Funding sources | GlaxoSmithKline Biologicals SA, Belgium | |
| Notes | 715 participants were enrolled but 714 vaccinated 701 completed the study through month 3 Most solicited reactions were transient (1.1 to 3.5 days on average) and were of mild to moderate intensity (grade 1 or 2), with ≤ 4.8% of participants in each group reporting grade 3 reactions A total of 349 SAEs were reported in 205 participants during the study. 14 participants died due to a SAE, most of which were due to cancer or heart failure. No SAEs were considered related to the study vaccines by the investigators 47 participants (6.6%) were excluded from the according‐to‐protocol immunogenicity cohort. The most common reasons for exclusion were non‐compliance with the blood sampling schedule (N = 27) and the absence of essential serological data (N = 9) Of the 714 vaccinated participants, 685 (95.9%) were followed through month 12, 665 (93.1%) through month 24, and 646 (90.5%) through month 36 8 were withdrawn from 25 µg gE/AS01B group (3 not eligible, 2 lost to follow‐up, 2 consent withdrawal and 1 death); 7 were withdrawn from the 50 µg gE/AS01B group (1 not eligible, 2 consent withdrawal and 4 deaths); 6 were withdrawn from the 100 µg gE/AS01B group (2 not eligible, 2 consent withdrawal and 2 deaths); 4 were withdrawn from the saline + 100 µg gE/AS01B group (1 lost to follow‐up, 1 consent withdrawal and 2 deaths) and 4 were withdrawn from the 100 µg gE/saline group (2 lost to follow‐up and 2 deaths) "The proportion of subjects with solicited reactions was higher for groups receiving two doses of gE/AS01B but the proportion did not increase between the first and the second vaccination (data not shown)" We had asked the authors for information about the AEs by age or vaccination but they have only provided the published data | |
| Risk of bias | ||
| Bias | Authors' judgement | Support for judgement |
| Random sequence generation (selection bias) | Unclear risk | "Subjects were stratified by age (60–69years and ≥70 years in a 1:4 ratio) and randomised"; the method of randomisation is not described |
| Allocation concealment (selection bias) | Unclear risk | No information was found about this domain |
| Blinding (performance bias and detection bias) | High risk | There was no mention of whether the prepared injections were indistinguishable in all aspects of their outward appearance |
| Blinding of participants and personnel (performance bias) | Low risk | Single‐blind (only for participants) but the participants themselves completed their diary cards as described "solicited local reactions (pain, redness and swelling) and general reactions (fatigue, fever, headache and myalgia) were recorded by subjects on diary cards for seven days after each vaccination" |
| Blinding of outcome assessment (detection bias) | High risk | Although the participants themselves completed their diary cards the other AEs were not blinded for the evaluator |
| Incomplete outcome data (attrition bias) | Low risk | The patient flow is clear |
| Selective reporting (reporting bias) | Low risk | The adverse events originally defined by the authors were presented |
| Other bias | Unclear risk | We found no more details on this topic |
| Methods | Phase 3, open‐label, randomised, comparative, 2‐arm, multicentre study | |
| Participants | 353 participants of either gender aged ≥ 50 years on day of vaccination, varicella history‐positive or residence for > 30 years in a country with endemic VZV infection Mean age of the 354 participants was 62.6 years | |
| Interventions | 1. Intramuscular (IM) route: zoster vaccine (refrigerated) 0.65 mL containing not less than 19,400 plaque‐forming units (pfu) of VZV per dose by IM route; N = 176 2. Subcutaneous (SC) route: zoster vaccine (refrigerated): 0.65 mL containing not less than 19,400 pfu of VZV per dose by SC route; N = 177 | |
| Outcomes | 1. Injection site adverse reactions (ISRs): injection site erythema, injection site swelling and injection site pain were collected from day 0 to day 4 post‐vaccination ISRs were mainly mild (< 5 cm in size or defined as awareness of sign or symptom but easily tolerated) or moderate (5 cm to < 10 cm in size or defined as discomfort enough to cause interference with usual activity) in intensity. Few participants reported severe ISRs (> 10 cm or defined as incapacitating with inability to work or do usual activity) 2. Fever ‐ temperature > 38.3°C (day 0 to day 28 post‐vaccination) 3. Unsolicited injection site adverse reactions and systemic adverse events and rashes of interest (i.e. varicella, varicella‐like rashes, herpes zoster or shingles and herpes zoster‐like rashes) were collected from day 0 to day 28 post‐vaccination 4. Serious adverse events were collected any time during the study (day 0 to day 35 post‐vaccination) | |
| Purpose of the Study | "To evaluate the immunogenicity as measured by VZV antibody titres (gpELISA) at 4 weeks following ZOSTAVAX® administered by IM or SC route" "To evaluate the immune response as measured by a second assay, the VZV Interferon‐gamma (IFN‐Ȗ)‐ELISPOT at 4 weeks following ZOSTAVAX® administered by IM or SC route" "To describe the safety profile of ZOSTAVAX® administered by IM or SC route" | |
| Funding sources | Sanofi Pasteur MSD | |
| Notes | This was basically an immunogenicity study and we only used the safety data More detailed unpublished data were kindly provided by Sanofi Pasteur MSD SNC Data by age were not available One participant reported in Group 1 (IM route) a zoster‐like rash (right thoracic dermatome) of mild intensity that occurred on day 12 after vaccine administration and lasted 6 days. No specimen was obtained for PCR testing. No participant was withdrawn due to an AE at any time after vaccine administration. No deaths were reported. 3 participants reported a SAE: 1 participant (hernia obstructive) in Group 1 (IM route) and 2 participants (humerus fracture and deep vein thrombosis) in Group 2 (SC route). None were assessed as vaccine‐related by the investigator No participant was withdrawn due to an AE at any time after vaccine administration | |
| Risk of bias | ||
| Bias | Authors' judgement | Support for judgement |
| Random sequence generation (selection bias) | Low risk | "The subjects were randomised using an electronic case repot form (e‐CRF)" |
| Allocation concealment (selection bias) | Low risk | "Allocation schedules were generated using a 1:1 ratio with permuted blocks of 4‐6" |
| Blinding (performance bias and detection bias) | High risk | Open‐label study |
| Blinding of participants and personnel (performance bias) | Low risk | "Between visit 1 and 2, the participants were given a diary card to record their temperature if they were febrile (oral temperature ≥38.3 ◦C), occurrence of any solicited injection site (erythema, swelling and pain) adverse reactions (Days 0–4) and any unsolicited injection site adverse reactions, varicella, varicella‐like rashes, HZ and zoster‐like rashes and other systemic adverse events (AEs) (Days 0–28). They were also asked to report any serious AEs (SAEs) that occurred at any time during the study" |
| Blinding of outcome assessment (detection bias) | High risk | The participants did not put any serious AEs (SAEs) in their diary cards themselves, therefore this was not blinded for the staff. "They were also asked to report any serious AEs (SAEs) that occurred at any time during the study" |
| Incomplete outcome data (attrition bias) | Low risk | Clear patient flow |
| Selective reporting (reporting bias) | Low risk | All data on adverse events that the authors proposed in their methodology were described in the results for both groups |
| Other bias | Unclear risk | We found no more details on this topic |
| Methods | RCT, double‐blind, multicentre, USA | |
| Participants | 368 participants (367 analysed) ˜55% female | |
| Interventions | 1. Zoster vaccine refrigerated SC; N = 182 2. Zoster vaccine frozen SC; N = 185 | |
| Outcomes | Participants with follow‐up, participants with 1 or more adverse events (AEs), participants with serious AEs, vaccine‐related serious AEs, death, participants who discontinued due to any AE, participants who discontinued due to a vaccine‐related AE | |
| Purpose of the Study | "To support the development of a refrigerator‐stable formulation of Zostavax with a confirmatory clinical trial with varicella‐zoster virus antibody‐seropositive adults ≥50 years of age" | |
| Funding sources | Merck & Co., Inc | |
| Notes | 1 patient withdrew consent prior to intervention No intention‐to‐treat analysis | |
| Risk of bias | ||
| Bias | Authors' judgement | Support for judgement |
| Random sequence generation (selection bias) | Unclear risk | Not described |
| Allocation concealment (selection bias) | Unclear risk | Not described |
| Blinding (performance bias and detection bias) | Low risk | Double‐blind, with in‐house blinding |
| Blinding of participants and personnel (performance bias) | Low risk | The formulations were visually indistinct, supplied in identical glass vials |
| Blinding of outcome assessment (detection bias) | Unclear risk | Not described |
| Incomplete outcome data (attrition bias) | Low risk | Clear patient flow |
| Selective reporting (reporting bias) | Low risk | The adverse events that the investigators selected were reported in the results section, for both refrigerated and frozen zoster vaccines |
| Other bias | Unclear risk | Not described |
| Methods | Randomised, placebo‐controlled study conducted in 18 countries in Europe, North America, Latin America, Asia and Australia | |
| Participants | 15,411 participants, 50 years of age or older, with no history of herpes zoster, not previously vaccinated against varicella or herpes zoster, and no immunosuppressive condition | |
| Interventions | 1. Recombinant zoster vaccine (2 doses: first dose month 0 and second dose month 2); N = 7698 2. Placebo (2 doses: first dose month 0 and second dose month 2); N = 7713 | |
| Outcomes | Cases of herpes zoster A reactogenicity subgroup ‐ 7 days after each vaccination: systemic reactions (fatigue, fever, gastrointestinal symptoms, headache, myalgia and shivering) and solicited injection site reactions (pain, redness and swelling) Serious adverse events were recorded in all participants for up to 12 months after the second dose Death Potentially immune‐mediated diseases | |
| Purpose of the Study | "The primary objective of the study was to evaluate overall vaccine efficacy in reducing the risk of herpes zoster, as compared with placebo. Secondary objectives included determining the vaccine efficacy in reducing the incidence of herpes zoster in each age group (50 to 59 years, 60 to 69 years, and ≥70 years) and HZ/su safety and reactogenicity profiles." | |
| Funding sources | Supported by GlaxoSmithKline Biologicals | |
| Notes | We used the available data for efficacy by age ≥ 60 y (a total of 8122 participants) and we contacted the authors asking for AEs by age but the data were not provided; therefore we used the AEs published for ≥ 50 y A total of 16,160 participants were enrolled. Of these participants, 749 were excluded from the efficacy analyses, mostly owing to deviations from Good Clinical Practice standards at 2 study centres (involving 726 patients) The remaining 15,411 participants constituted the total vaccinated cohort for analysis; of these participants, 14,759 (95.8%) were included in the modified vaccinated cohort but we did not consider this last cohort since we used ITT analysis Most participants received two doses of the study vaccines (95.6% of HZ/su recipients and 96.4% of placebo recipients) "A reactogenicity subgroup of participants. This subgroup included all participants who were 70 years of age or older and randomly selected participants in the two other age groups (50 to 59 years and 60 to 69 years). The participants rated the intensity of the solicited reactions on a scale from 0 (absent) to 3 (preventing normal everyday activities). Unsolicited adverse events were recorded for 30 days after each dose. Serious adverse events were recorded in all participants for up to 12 months after the second dose. Such events that were considered to be related to the study vaccine or study participation, any events resulting in death, and potentially immune‐mediated diseases were evaluated in all participants over the entire study period. (A full list of potentially immune‐mediated diseases is provided in the Supplementary Appendix.)" We contacted the authors of this study asking for details about the reason why the participants did not receive dose 2. They replied to our email but could not provide this information because "the ZOE‐50 study, which was the subject of the NEJM report, is still ongoing and consequently blinded at the subject level. Therefore, information on the specific reasons for non‐receipt of the second vaccine or placebo dose is not presently available." | |
| Risk of bias | ||
| Bias | Authors' judgement | Support for judgement |
| Random sequence generation (selection bias) | Low risk | "We randomly assigned participants in a 1:1 ratio to receive either vaccine or placebo using an online centralized randomization system" |
| Allocation concealment (selection bias) | Unclear risk | Despite the sequence and random number generation being appropriate, there were no details about allocation |
| Blinding (performance bias and detection bias) | Low risk | "Because the appearance of the reconstituted HZ/su vaccine differed from the placebo solution, injections were prepared and administered by study staff who did not participate in any study assessment" |
| Blinding of participants and personnel (performance bias) | Low risk | "Because the appearance of the reconstituted HZ/su vaccine differed from the placebo solution, injections were prepared and administered by study staff who did not participate in any study assessment" |
| Blinding of outcome assessment (detection bias) | Low risk | "The investigators, participants, and those who were responsible for the evaluation of any study end point were unaware of whether vaccine or placebo had been administered" |
| Incomplete outcome data (attrition bias) | High risk | No clear participant flow; the number of patients randomised to each group is not described for all outcomes |
| Selective reporting (reporting bias) | Low risk | All data that the authors proposed in their methodology were described in the results |
| Other bias | Unclear risk | Not described |
| Methods | RCT, non‐blinded | |
| Participants | 167 participants | |
| Interventions | 1. Live zoster vaccine SC (not specified if frozen); N = 85 2. Inactivated zoster vaccine (live vaccine heated at 56 ºC for 7 days) SC; N = 82 | |
| Outcomes | Confirmed HZ | |
| Purpose of the Study | "To compare a live attenuated varicella vaccine versus heat‐inactivated varicella vaccine in relation the confirmed cases of HZ and immunogenicity in individuals aged 55‐89 years" | |
| Funding sources | Merck Research Laboratories, West Point, PA, USA | |
| Notes | Author answered our e‐mail and provided data for 1 clinical outcome. Most outcomes evaluated were immunologic There is a misspelling of an author name on the paper, where Dr Levin was referenced as Dr. Levine | |
| Risk of bias | ||
| Bias | Authors' judgement | Support for judgement |
| Random sequence generation (selection bias) | Unclear risk | Not described |
| Allocation concealment (selection bias) | Unclear risk | Not described |
| Blinding (performance bias and detection bias) | High risk | Open study |
| Blinding of participants and personnel (performance bias) | Unclear risk | Not described |
| Blinding of outcome assessment (detection bias) | Unclear risk | Not described |
| Incomplete outcome data (attrition bias) | Unclear risk | Not described |
| Selective reporting (reporting bias) | Unclear risk | Not described |
| Other bias | Unclear risk | Not described |
| Methods | RCT, cross‐over, multicentre (9 centres in USA) | |
| Participants | N = 101 healthy participants with physician‐documented history of HZ | |
| Interventions | 1. Lyophilised (frozen) zoster vaccine SC; N = 51 2. Placebo SC; N = 50 | |
| Outcomes | In participants ≥ 60 yo 1. Adverse events (AEs): 1 or more AE, injection site AEs, systemic and vaccine‐related systemic AEs 2. Drop‐outs | |
| Purpose of the Study | "To determine the safety profile and immunogenicity of zoster vaccine in individuals who experienced a prior episode of herpes zoster" | |
| Funding sources | Merck & Co., Inc | |
| Notes | We only used the data for participants 60 years or older Data were analysed with pooled data from cross‐over arms Author contacted and answered our message. There was no separate analysis for the first arm, prior to cross‐over | |
| Risk of bias | ||
| Bias | Authors' judgement | Support for judgement |
| Random sequence generation (selection bias) | Unclear risk | Not described |
| Allocation concealment (selection bias) | Unclear risk | Not described |
| Blinding (performance bias and detection bias) | Unclear risk | Double‐blind but not explained how |
| Blinding of participants and personnel (performance bias) | Unclear risk | Not described |
| Blinding of outcome assessment (detection bias) | Unclear risk | Not described |
| Incomplete outcome data (attrition bias) | High risk | No data from the first arm of this cross‐over study were reported |
| Selective reporting (reporting bias) | Low risk | All of the adverse events listed in the methods section were described in the results |
| Other bias | Unclear risk | Not described |
| Methods | Randomised, double‐blind, placebo‐controlled, age‐stratified study | |
| Participants | 11,980 afebrile participants ≥ 60 years of age; no prior receipt of any varicella or zoster vaccine; no intercurrent illness that might interfere with the interpretation of the study or prevent the participant from completion of the study; no immune dysfunction caused by a medical condition; no use of immunosuppressive therapy; no concomitant use of systemic antiviral therapy with activity against herpes viruses | |
| Interventions | 1. Zoster vaccine (refrigerated) SC; N = 5983 2. Placebo SC; N = 5997 | |
| Outcomes | 1 or more serious side effect(s) occurring 26 weeks (182 days) after the vaccination; vaccine‐related serious side effects, death, injection site adverse events, systemic adverse events; rashes and temperature were only reported if they were considered serious | |
| Purpose of the Study | "To evaluate the general safety of zoster vaccine in adults ≥ 60 years old" | |
| Funding sources | Merck Sharp Dohme Corp. | |
| Notes | Non‐serious adverse events were not reported The study reported 1 or more serious side effect(s) occurring 6 weeks (42 days) and 26 weeks (182 days) after vaccination. In our analyses, we included only the data reported for the second monitoring period, i.e. serious adverse event(s) detected at 182 days after vaccination 36 participants discontinued because of adverse events, 27 participants withdrew consent, 75 participants were lost to follow‐up, 7 participants discontinued because of protocol deviation and 2 participants were discontinued following physician's decision (both were in the placebo group) ITT analysis "For all analyses, cross‐treated (i.e. randomised to ZV and received placebo, or randomised to placebo and received ZV) participants were considered according to the vaccine received and not the vaccine assigned" | |
| Risk of bias | ||
| Bias | Authors' judgement | Support for judgement |
| Random sequence generation (selection bias) | Unclear risk | Not described |
| Allocation concealment (selection bias) | Unclear risk | Not described |
| Blinding (performance bias and detection bias) | Unclear risk | Not described |
| Blinding of participants and personnel (performance bias) | Low risk | "The ZV and placebo were reconstituted with sterile diluent immediately prior to administration, and were indistinguishable from each other in appearance. Placebo was the vaccine stabiliser of ZV with no live virus." |
| Blinding of outcome assessment (detection bias) | Low risk | "An independent data monitoring committee was established for continuous safety oversight during the study" |
| Incomplete outcome data (attrition bias) | Low risk | Clear patient flow |
| Selective reporting (reporting bias) | Low risk | The serious adverse events that were defined in the methods section were presented in the results |
| Other bias | Unclear risk | Not described |
| Methods | Randomised, placebo‐controlled, double‐blind study at 22 sites in the US | |
| Participants | N = 38,546 participants | |
| Interventions | 1. Zoster vaccine (frozen) (18,700 to 60,000 plaque‐forming units per dose (pfu/dose) and more than 90% of vaccinated participants received 32,300 pfu or less) SC; N = 19,270 2. Placebo SC; N = 19,276 | |
| Outcomes | Confirmed cases of HZ, cases of HZ within 30 days of vaccination, confirmed HZ cases and all adverse events occurring within 42 days after vaccination and during the whole study Participants with follow‐up, participants with 1 or more AEs (systemic or injection site), participants with serious AEs, vaccine‐related AEs (systemic or injection site), death, varicella‐like rash at injection site and not at injection site, herpes zoster‐like rash, rash unrelated to HZ, participants hospitalised, hospitalisation related to HZ | |
| Purpose of the Study | "To determine whether vaccination with a live attenuated varicella‐zoster virus vaccine would decrease the incidence, severity, or both of HZ and postherpetic neuralgia in adults 60 years of age or older" | |
| Funding sources | "Supported by the Cooperative Studies Program, Department of Veterans Affairs, Office of Research and Development; by a grant from Merck (to the Cooperative Studies Program); and by a grant from the James R. and Jesse V. Scott Fund for Shingles Research (to Dr. Oxman). The vaccine and placebo used for the study were supplied by Merck; famciclovir was supplied by SmithKline Beecham and Novartis Pharmaceuticals" | |
| Notes | "Zoster vaccine and placebo were lyophilised, held frozen at ‐15°C until reconstituted with sterile water, and administered within 30 minutes" 132 participants withdrew from the study and 113 were lost to follow‐up 1588 participants died during the study, but it was not described whether these were related to the protocol or not Only a subgroup of patients had a safety assessment (zoster vaccine N = 3345; placebo N = 3271), being the adverse event sub‐study This study performed 2 ITT analyses, with all individuals developing HZ and only with those who developed after 30 days from the vaccine injection (modified ITT). For the meta‐analysis we considered the modified ITT There was a break in surveillance for cases of HZ of approximately 15 months between the completion of the Shingles Prevention Study surveillance in September 2003 and resumption of follow‐up in the Short‐Term Persistence Substudy in December 2004. Beginning in October 2005, open‐label zoster vaccine was offered without charge to Shingles Prevention Study placebo recipients. Placebo recipients enrolled in the Short‐Term Persistence Substudy completed the study upon receiving zoster vaccine, since they could then no longer serve as unvaccinated controls. The Short‐Term Persistence Substudy participants who were zoster vaccine recipients in the Shingles Prevention Study continued to be followed until the initiation of the Long‐Term Persistence Substudy in March 2006 The 2012 publication evaluated the effectiveness of the vaccine for up to 7 years after the participants had been vaccinated. However, the data available in this publication report different dates for the collection of outcomes in the intervention and in the placebo groups. The data from the zoster vaccine group are from December 2004 to March 2006 (16 months). In the placebo group, data are reported only from December 2004 to September 2005 (10 months), because in October 2005 the zoster vaccine was also offered to participants in the placebo group, as stated by the authors reported above We contacted the authors of this study asking for the data corresponding to the period from December 2004 to September 2005 (10 months) for both groups (vaccine and placebo). They replied to our email but did not provide this information and suggested instead that we should "assume a uniform rate of events and calculate the estimated number of cases from that" | |
| Risk of bias | ||
| Bias | Authors' judgement | Support for judgement |
| Random sequence generation (selection bias) | Unclear risk | Not described |
| Allocation concealment (selection bias) | Low risk | "Each study site received randomly ordered vials of zoster vaccine and placebo in separate boxes for each age stratum" |
| Blinding (performance bias and detection bias) | Low risk | "All other study personnel were blinded to study treatment assignments" |
| Blinding of participants and personnel (performance bias) | Low risk | "Since the reconstituted zoster vaccine had a different appearance from the placebo, reconstitution and administration were performed by technicians who did not otherwise interact with participants, evaluate outcomes or adverse events, answer the telephone or enter study data." |
| Blinding of outcome assessment (detection bias) | Unclear risk | Not described |
| Incomplete outcome data (attrition bias) | Low risk | Clear patient flow |
| Selective reporting (reporting bias) | Low risk | All data on effectiveness and adverse events that the authors proposed in their methodology were described in the results for both groups |
| Other bias | Unclear risk | Not described |
| Methods | Randomised clinical trial, blinded to participant, investigator and sponsor | |
| Participants | 698 healthy participants, varicella history‐positive (or resident for more 30 years in a country with endemic VZV infection), HZ history‐negative, men and women 50 or more years of age | |
| Interventions | 1. Higher‐potency zoster vaccine (frozen) SC (˜207,000 pfu/0.65 mL dose); N = 459 2. Lower‐potency zoster vaccine (frozen) SC (˜58,000 pfu/0.65 mL dose); N = 233 | |
| Outcomes | Herpes zoster or HZ‐like rash, varicella or varicella‐like rash, local and systemic clinical adverse events and tolerability of both | |
| Purpose of the Study | "To compare the safety and tolerability profile of a higher potency zoster vaccine (˜207,000 plaque forming units (PFU)/0.65‐mL dose) with that of a lower potency vaccine (˜58,000 PFU/0,65‐mL dose)" | |
| Funding sources | Merck Research Laboratories | |
| Notes | Lower‐potency zoster vaccine in this study was similar to vaccine potencies studied in Oxman 2005 Randomised 2:1 ratio to receive 1 injection of each 3 participants were discontinued from the study. 2 participants lost to follow‐up in the higher‐potency zoster vaccine group and 1 participant belonging to the lower‐potency zoster vaccine group withdrew consent prior to completion of the follow‐up period, but was included in the safety analyses | |
| Risk of bias | ||
| Bias | Authors' judgement | Support for judgement |
| Random sequence generation (selection bias) | Unclear risk | Not described |
| Allocation concealment (selection bias) | Unclear risk | Not described |
| Blinding (performance bias and detection bias) | Low risk | Blinded participants, investigator and sponsor |
| Blinding of participants and personnel (performance bias) | Low risk | The 2 potency formulations were indistinguishable in appearance. All participants received a single 0.65 mL subcutaneous injection of either the higher‐potency zoster vaccine or the lower‐potency zoster vaccine |
| Blinding of outcome assessment (detection bias) | Unclear risk | Not described |
| Incomplete outcome data (attrition bias) | Low risk | Clear patient flow |
| Selective reporting (reporting bias) | Low risk | The adverse events defined in the methods section were reported in the results for both higher‐potency and lower‐potency zoster vaccines |
| Other bias | Unclear risk | Not described |
| Methods | Randomised, double‐blind, placebo‐controlled, multicentre study: United States (5 sites) and the Netherlands (1 site) | |
| Participants | N = 209 healthy participants | |
| Interventions | 1. Lyophilised zoster vaccine (frozen) SC (∼23,000 pfu); N = 104 2. Placebo SC; N = 105 | |
| Outcomes | Adverse events (AEs), both injection site and/or systemic. Swelling, redness, pain or tenderness or rash at the injection site, or varicella(‐like) rash or HZ(‐like) rash, any serious AEs (SAEs) | |
| Purpose of the Study | "To examine the safety, tolerability and immunogenicity after 1 and 2 doses of zoster vaccine in adults 60 years of age and older" | |
| Funding sources | Merck Sharp Dohme Corp | |
| Notes | The first and second doses were administered 42 days apart (post‐vaccination 1 and post‐vaccination 2) 1 participant withdrew consent before vaccination in the vaccine group Discontinued after first vaccination vaccine group: clinical AE = 3, withdrew consent = 1, no participants lost follow‐up or due to protocol deviation, other = 2 Discontinued after first vaccination placebo group: 1 participant due to clinical AE, no participants lost to follow‐up, 1 withdrew consent, 1 participant due to protocol deviation and 1 for other reason Discontinued after second vaccination vaccine group: only 1 participant due to clinical AE Discontinued after second vaccination placebo group: 1 to lost follow‐up and 2 for other reasons No ITT analysis | |
| Risk of bias | ||
| Bias | Authors' judgement | Support for judgement |
| Random sequence generation (selection bias) | Low risk | "Subjects were randomised in a 1:1 ratio to receive 2 doses of either ZV or placebo, according to a computer‐generated, study‐centre specific allocation schedule" |
| Allocation concealment (selection bias) | Low risk | "Allocation numbers were assigned sequentially by the study site personnel to subjects who met the study eligibility criteria, beginning with the lowest number available at the study centre, after informed consent and medical history had been obtained. The allocation schedule was generated by a sponsor statistician not otherwise associated with the ZV program" |
| Blinding (performance bias and detection bias) | Low risk | "The subject, investigator, clinical study site personnel, and sponsor personnel directly involved in the study were blinded to whether the subject received zoster vaccine or placebo. They remained blinded until all subjects completed the study" |
| Blinding of participants and personnel (performance bias) | Low risk | "The clinical materials were prepared by an unblinded vaccine coordinator at each clinical site, because of differences in the turbidity of the study vaccine and placebo. Each vial of vaccine or placebo was labelled with a subject‐specific allocation number. The unblended vaccine coordinator reconstituted the study vaccine/placebo and wrapped the syringe in an opaque label containing subject allocation number and time of reconstitution. The unblinded vaccine coordinator did not have any contact with the subject and did not disclose the contents of the syringe to the person administering the study vaccine/placebo" |
| Blinding of outcome assessment (detection bias) | Unclear risk | Not described |
| Incomplete outcome data (attrition bias) | Low risk | Clear patient flow |
| Selective reporting (reporting bias) | Low risk | All adverse events listed by the authors were described in their results for both vaccinations |
| Other bias | Unclear risk | Not described |
| Methods | Phase 3, open‐label, randomised, 24 centres: Finland (6 centres), Germany (13 centres), Italy (2 centres), Spain (2 centres) and The Netherlands (1 centre) | |
| Participants | 759 individuals randomised aged ≥ 70 y with either a history of varicella or > 30 y residency in a country with endemic VZV infection were enrolled 509 (67.2%) were aged 70 to 79 years and 248 (32.8%) were aged > 80 years (total = 757) | |
| Interventions | 1. Refrigerated live attenuated HZ vaccine single dose SC; N = 749 2. Refrigerated live attenuated HZ vaccine 2 doses 1 month apart schedule: 1 month after first dose SC; N = 242 3. Refrigerated live attenuated HZ vaccine 2 doses 3 months apart schedule: 3 months after first dose SC; N = 246 | |
| Outcomes | AEs, immediate and not immediate, both at injection site and/or systemic: 1. Erythema, swelling and pain within 4 days of vaccination and other injection site reactions were recorded by participants in a diary card 2. Other injection site reaction and systemic AEs were recorded in the diary card for up to 28 days following each vaccination 3. Vaccine‐related serious AEs, deaths and occurrences of HZ, varicella, or zoster‐like and varicella‐like rashes were recorded by the investigators until the study was stopped (1 year) 4. Varicella(‐like) rash or HZ(‐like) rash, any SAEs, vaccine‐related AEs | |
| Purpose of the Study | "The primary objective of the study was to demonstrate that a second dose of HZ vaccine, administered 1 mo or 3 mo after the first dose, elicits superior VZV antibody titres 4 weeks after vaccination compared with the first dose" "Secondary objectives of the study were to compare VZV antibody titres 12 mo after completion of each two‐dose schedule with those 12 mo after a single dose, and to describe the safety profile of all three HZ vaccination schedules" | |
| Funding sources | Sanofi Pasteur MSD | |
| Notes | This was an immunogenicity study. For safety analyses, 1 patient randomised to the 1 mo between doses was analysed as receiving the 3 mo schedule More detailed unpublished data were kindly provided by Sanofi Pasteur MSD SNC For the period of first vaccination, the data for the 3 groups were pooled Randomised 1:1:1 ratio to receive: 1 injection only; 2 injections with 1 month between the doses (day 28 to 35) and 2 injections with 3 months between the doses (day 81 to 97) For safety analyses, 1 patient randomised to the 1 month between doses was analysed as receiving the 3 months schedule "Seventeen participants withdrew from study due to adverse events, of whom ten withdrew within 28 d after vaccination" The injection site reactions were generally mild to moderate in intensity and resolved in 3 to 7 d 19 participants reported serious AEs between screening and 12 mo after the last vaccine dose 2 serious AEs were reported by 1 participant None of the serious AEs was considered by the investigator to be vaccine‐related Serious AEs occurred within 28 d of the first vaccine dose in 1.2% of participants (n = 9), and within 28 d of the second dose in 0.9% of participants (n = 4) In 7 participants serious AEs occurred between 28 d and 12 mo after the last dose Until the study was stopped, 12 participants died, 7 within 12 mo of the last vaccination and 5 > 12 mo after the last vaccination No intention‐to‐treat analysis We asked the authors for the outcomes by age but they kindly answered that there was no analysis of safety by age group We used only the data for single doses since the authors state in their conclusion "The results of this study demonstrate that there is no apparent advantage to administering a second dose of Zostavax on a one month or three month schedule among individuals aged ≥ 70 years." | |
| Risk of bias | ||
| Bias | Authors' judgement | Support for judgement |
| Random sequence generation (selection bias) | Low risk | Used "blocks of randomisation" |
| Allocation concealment (selection bias) | Low risk | "The allocation schedule was generated using balanced permuted blocks of randomisation" |
| Blinding (performance bias and detection bias) | High risk | Open‐label study |
| Blinding of participants and personnel (performance bias) | Low risk | "Solicited injection‐site reactions (erythema, swelling, and pain) occurring within 4 d of vaccination were recorded by participants in a diary card. Other injection‐site reactions and systemic AEs were recorded in the diary card for up to 28 d following each vaccination" |
| Blinding of outcome assessment (detection bias) | High risk | Although participants completed their diary cards themselves the other AEs were not blinded for the evaluator |
| Incomplete outcome data (attrition bias) | Low risk | Clear patient flow |
| Selective reporting (reporting bias) | Low risk | All data that the authors proposed in their methodology were described in the results |
| Other bias | Unclear risk | We found no more details on this topic |
AE: adverse event
AS01: liposome‐based adjuvant system containing the immunoenhancers 3‐O‐desacyl‐4′‐monophosphoryl lipid A (MPL) and the saponin QS‐21 (Quillaja saponaria Molina, fraction 21)
Adjuvanted gE/AS01B: 50 μg purified gE with adjuvant B (1 mg dioleoyl phosphatidylcholine, 250 μg cholesterol 50 μg MPL and 50 μg QS‐21)
Adjuvanted gE/AS01E: 50 μg purified gE with adjuvant E (500 μg dioleoyl phosphatidylcholine, 125 μg cholesterol, 25 μg MPL and 25 μg QS‐21)
AS01B: adjuvant B composed of 1 mg dioleoyl phosphatidylcholine, 250 μg cholesterol 50 μg MPL and 50 μg QS‐21
AS01E: adjuvant E composed of 500 μg dioleoyl phosphatidylcholine, 125 μg cholesterol, 25 μg MPL and 25 μg QS‐21
d: days
Elderly or older adults: aged ≥ 60 years old
Frozen: ‐15 °C or colder
gE: recombinant subunit VZV composed of glycoprotein E
gE/saline: unadjuvanted gE
HZ: herpes zoster
ID: identification
IM: intramuscular
ITT: intention‐to‐treat
mo: month
MPL: immunoenhancer 3‐O‐desacyl‐4′‐monophosphoryl lipid A
µg: micrograms
N: number
NNTB: number needed to treat for an additional beneficial outcome
NNTH: number needed to treat for an additional harmful outcome
pfu: plaque‐forming units
QS‐21: immunoenhancer saponin quillaja saponaria Molina, fraction 21
Refrigerated: 2 °C to 8 °C
Recombinant vaccine: the HZ/su vaccine contains 50 µg of recombinant VZV glycoprotein E and the liposome‐based AS01B adjuvant system contains 50 µg of 3‐O‐desacyl‐4′‐monophosphoryl lipid A (MPL) and 50 µg of Quillaja saponaria Molina, fraction 21 (QS21, Antigenics, a wholly owned subsidiary of Agenus)
SAEs: serious adverse events
SC: subcutaneously
UK: United Kingdom
US: United States
VZV: varicella zoster virus
y: year
yo: years old
ZV: zoster vaccine
Zoster vaccine 1‐mo schedule: ZV 2 doses given 1 month apart
Zoster vaccine 3‐mo schedule: ZV 2 doses given 3 months apart
Characteristics of excluded studies [ordered by study ID]
| Study | Reason for exclusion |
| RCT, evaluating zoster vaccine, with no clinical outcome: focus on immunogenicity | |
| RCT, evaluating zoster vaccine, with no clinical outcome: focus on immunogenicity | |
| RCT: intervention tested was Tai Chi, not the zoster vaccine | |
| RCT, evaluating zoster vaccine when administered concomitantly with influenza vaccine | |
| RCT, evaluating zoster vaccine but the mean of age was outside our inclusion criteria (means ranged from 55 to 57 years) | |
| RCT, evaluating zoster vaccine but the age was outside the range of interest: adults ≥ 30 years of age (adults less than 60 years of age) | |
| RCT, evaluating zoster vaccine, with no clinical outcome: focus on immunogenicity |
RCT: randomised controlled trial
Characteristics of ongoing studies [ordered by study ID]
| Trial name or title | 'A double‐blind, randomised, placebo‐controlled, parallel group study to evaluate biomarkers of immunity to varicella zoster virus following immunisation with V212/heat‐treated varicella‐zoster virus (VZV) vaccine or with ZOSTAVAX in healthy volunteers' |
| Methods | Allocation: randomised |
| Participants | 120 healthy participants, 60 years and older, both genders |
| Interventions | 1. V212 (heat‐treated VZV vaccine) 2. Live zoster vaccine 3. Placebo |
| Outcomes | Immunogenicity (skin tests) and safety (adverse events) |
| Starting date | March 2009 |
| Contact information | Please refer to this study by its ClinicalTrials.gov identifier: NCT00886613 |
| Notes | This study has been completed. No publications provided |
| Trial name or title | 'Efficacy, safety, and immunogenicity study of GSK Biologicals' herpes zoster vaccine GSK1437173A in adults aged ≥ 50 years' |
| Methods | Allocation: randomised Endpoint classification: efficacy Study Intervention model: parallel assignment Masking: double‐blind (participant, investigator, outcomes assessor) Primary purpose: prevention |
| Participants | 16,256 healthy volunteers, 50 years and older, both genders |
| Interventions | 1. Participants will receive herpes zoster vaccine GSK1437173A according to a 0, 2‐month schedule, intramuscular injection 2. Participants will receive NaCl solution placebo according to a 0, 2‐month schedule, intramuscular injection |
| Outcomes | Confirmed HZ cases, incidence of PHN, duration of severe 'worst' HZ‐associated pain, incidence of overall and HZ‐related mortality, incidence of HZ complications in participants with confirmed HZ, incidence of overall and HZ‐related hospitalisations, duration of pain medication administered for HZ in participants with confirmed HZ, occurrence of solicited local and general symptoms in a subset of participants, occurrence of unsolicited adverse events (AEs), occurrence of serious adverse events (SAEs), occurrence of SAEs related to study participation or to a concurrent GSK medication/vaccine in all participants, occurrence of fatal SAEs, occurrence and relationship to vaccination of any potential immune‐mediated diseases (pIMDs) in all participants, occurrence and relationship to vaccination of any potential immune‐mediated diseases (pIMDs) in all participants |
| Starting date | August 2010 |
| Contact information | Please refer to this study by its ClinicalTrials.gov identifier: NCT01165177 |
| Notes | It has been published but remains ongoing |
| Trial name or title | 'Efficacy, safety and immunogenicity of GSK Biologicals' herpes zoster vaccine GSK1437173A in adults aged >= 70 years' |
| Methods | Allocation: randomised |
| Participants | 14,512 healthy participants, 70 years and older, both genders |
| Interventions | 1. Herpes zoster vaccine intramuscular injection 2. Placebo intramuscular injection |
| Outcomes | Confirmed HZ cases, occurrence of overall postherpetic neuralgia, safety: occurrence of adverse events (AEs) |
| Starting date | August 2010 |
| Contact information | Please refer to this study by its ClinicalTrials.gov identifier: NCT01165229 |
| Notes | This study is ongoing, but not recruiting participants. No publications provided Secondary ID: EudraCT number 2009‐015791‐94 |
| Trial name or title | 'A partially blinded randomised clinical trial to study the immunogenicity and safety of intradermal administration of ZOSTAVAX™ (V211)' |
| Methods | Allocation: randomised Endpoint classification: safety/efficacy study Intervention model: parallel assignment Masking: single‐Blind (participant) Primary purpose: prevention |
| Participants | 223 healthy volunteers, 50 years and older, both genders |
| Interventions | 1. Active comparator: full dose subcutaneous. Participants will receive a full dose of Zostavax™ administered subcutaneously on Day 1 of the study. 9 participants in this group will also receive saline placebo intradermally in the alternate limb on Day 1 2. Experimental: 1/3 dose subcutaneous. Participants will receive a 1/3 dose of Zostavax™ administered subcutaneously on Day 1 of the study. 6 participants in this group will also receive saline placebo intradermally in the alternate limb on Day 1. Participants will have the option to receive a full subcutaneous dose of Zostavax™ after completion of the study. 3. Experimental: full dose intradermal. Participants will receive a full dose of Zostavax™ administered intradermally on Day 1 of the study. 6 participants in this group will also receive saline placebo intradermally in the alternate limb on Day 1. Participants will have the option to receive a full subcutaneous dose of Zostavax™ after completion of the study. 4. Experimental: 1/3 dose intradermal. Participants will receive a 1/3 dose of Zostavax™ administered intradermally on Day 1 of the study. 6 participants in this group will also receive saline placebo intradermally in the alternate limb on Day 1. Participants will have the option to receive a full subcutaneous dose of Zostavax™ after completion of the study. 5. Experimental: 1/10 dose intradermal. Participants will receive a 1/10 dose of Zostavax™ administered intradermally on Day 1 of the study. 6 participants in this group will also receive saline placebo intradermally in the alternate limb on Day 1. Participants will have the option to receive a full subcutaneous dose of Zostavax™ after completion of the study. 6. Experimental: 1/27 dose intradermal. Participants will receive a 1/27 dose of Zostavax™ administered intradermally on Day 1 of the study. 6 participants in this group will also receive saline placebo intradermally in the alternate limb on Day 1. Participants will have the option to receive a full subcutaneous dose of Zostavax™ after completion of the study. |
| Outcomes | Geometric mean fold change from baseline in varicella zoster virus (VZV)‐specific antibodies, number of participants reporting an adverse experience (AE), number of participants reporting a serious adverse experience (SAE), number of participants reporting specific local injection site adverse experiences, number of participants reporting a non‐injection site rash |
| Starting date | September 2011 |
| Contact information | Please refer to this study by its ClinicalTrials.gov identifier: NCT01385566 |
| Notes | This study has been completed. No publications provided |
| Trial name or title | 'A phase III double‐blinded, randomised, multicenter, controlled study to evaluate the safety, tolerability, and immunogenicity of ZOSTAVAX™ made with an alternative manufacturing process (AMP)' |
| Methods | Allocation: randomised Endpoint classification: safety/efficacy study Intervention model: parallel assignment Masking: double‐blind (participant, investigator) Primary purpose: prevention |
| Participants | 498 healthy volunteers, 50 years and older, both genders |
| Interventions | 1. Experimental: Zostavax™ (AMP) Zostavax™ manufactured with an alternative process 2. Active comparator: Zostavax™ manufactured with the current process |
| Outcomes | Geometric mean titre (GMT) of varicella zoster virus (VZV) antibody, geometric mean fold rise (gmfr) in VZV antibody titres, number of participants with 1 or more adverse experiences (AEs), number of participants with 1 or more serious adverse experience (SAE) day 1 to 42 post‐vaccination, number of participants with 1 or more serious adverse experience day 1 to 182 post‐vaccination |
| Starting date | April 2012 |
| Contact information | Please refer to this study by its ClinicalTrials.gov identifier: NCT01505647 |
| Notes | This study has been completed. No publications provided |
| Trial name or title | 'Open‐label study to evaluate the safety and immunogenicity of GSK Biologicals' herpes zoster vaccine GSK1437173A in adults aged ≥ 50 years' |
| Methods | Allocation: randomised Endpoint classification: efficacy study Intervention model: parallel assignment Masking: open‐label Primary purpose: prevention |
| Participants | 354 healthy volunteers, 50 years and older, both genders |
| Interventions | 1. HZ/su‐0,2 Group. Participants will receive HZ/su vaccine on a 0.2 month schedule 2. HZ/su‐0,6 Group. Participants will receive HZ/su vaccine on a 0.6 month schedule 3. HZ/su‐0,12 Group. Participants will receive HZ/su vaccine on a 0.12 month schedule |
| Outcomes | Anti‐gE humoral immunogenicity in terms of antibody concentration, occurrence of solicited local and general symptoms, occurrence of unsolicited symptoms, occurrence of serious adverse events (SAEs), occurrence of AEs of specific interest |
| Starting date | March 2013 |
| Contact information | Please refer to this study by its ClinicalTrials.gov identifier: NCT01751165 |
| Notes | This study is ongoing, but not recruiting participants. No publications provided Secondary ID: EudraCT number 2012‐004456‐11 or Study ID: 116697 |
| Trial name or title | 'Safety and immunogenicity study of GSK Biologicals' herpes zoster subunit (HZ/su) vaccine GSK1437173A when administered subcutaneously vs. intramuscularly in adults aged ≥ 50 years' |
| Methods | Allocation: randomised Endpoint classification: safety/efficacy study Intervention model: parallel assignment Masking: open‐label Primary purpose: prevention |
| Participants | 60 healthy volunteers, 50 years and older, both genders |
| Interventions | 1. Experimental: subcutaneus HZ/su Group 0.2 month schedule 2. Active comparator: intramuscular HZ/su Group 0.2 month schedule |
| Outcomes | Evaluation of gE‐specific antibody concentrations, occurrence of solicited local and general symptoms, occurrence of unsolicited symptoms, occurrence of serious adverse events (SAEs), occurrence of adverse events (AEs) of specific interest |
| Starting date | June 2013 |
| Contact information | Please refer to this study by its ClinicalTrials.gov identifier: NCT01777321 |
| Notes | This study has been completed. No publications provided |
| Trial name or title | 'Consistency, immunogenicity and safety study of GSK Biologicals' herpes zoster vaccine GSK1437173A in adults ≥ 50 years of age' |
| Methods | Allocation: randomised Endpoint classification: efficacy study Intervention model: parallel assignment Masking: double‐blind (participant, caregiver, investigator) Primary purpose: prevention |
| Participants | 651 healthy volunteers, 50 years and older, both genders |
| Interventions | 1.HZ/su Lot A vaccine, 2 doses administered intramuscularly 2. HZ/su Lot B vaccine, 2 doses administered intramuscularly 3. HZ/su Lot C vaccine, 2 doses administered intramuscularly |
| Outcomes | Anti‐gE humoral immunogenicity, occurrence of solicited local and general symptoms, occurrence of unsolicited symptoms, occurrence of serious adverse events (SAEs), occurrence of AEs of specific interest |
| Starting date | August 2014 |
| Contact information | Please refer to this study by its ClinicalTrials.gov identifier: NCT02075515 |
| Notes | This study is ongoing, but not recruiting participants. No publications provided Secondary ID: EudraCT number: 2013‐000373‐76 or Study ID: 117177 |
| Trial name or title | 'A comparison of the immunogenicity and descriptive safety of a live attenuated herpes zoster vaccine and the GSK herpes zoster recombinant HZ/su candidate vaccine in 50 to 59 year old and 70 to 85 year old vaccine recipients' |
| Methods | Allocation: randomised Endpoint classification: pharmacodynamics study Intervention model: parallel assignment Masking: single‐blind (participant) Primary purpose: basic science |
| Participants | 160 healthy volunteers aged 50 years to 85 years, both genders |
| Interventions | 1. No previous zoster vaccine: live zoster vaccine subcutaneous and second dose placebo, normal saline subcutaneous 2. No previous zoster vaccine: recombinant vaccine HZ/su intramuscular and second dose recombinant vaccine intramuscular 3. 1 previous dose of zoster vaccine at least 5 years previously: live zoster vaccine subcutaneous and second dose placebo, normal saline subcutaneous 4. 1 previous dose of zoster vaccine at least 5 years previously: recombinant vaccine HZ/su intramuscular and second dose recombinant vaccine intramuscular |
| Outcomes | Unsolicited adverse events, interferon gamma/ Interleukin 2 (IFNg/IL2) dual colour fluorospot number, glycoprotein‐based enzyme‐linked immunosorbent assay (gpELISA) |
| Starting date | May 2014 |
| Contact information | Please refer to this study by its ClinicalTrials.gov identifier: NCT02114333 |
| Notes | This study is currently recruiting participants. No publications provided |
| Trial name or title | 'A phase III, double‐blind, lot‐to‐lot consistency clinical trial to evaluate the safety, tolerability and immunogenicity of V212 in healthy adults' |
| Methods | Allocation: randomised Endpoint classification: safety study Intervention model: parallel assignment Masking: double‐blind (participant, investigator, outcomes assessor) Primary purpose: prevention |
| Participants | 0 healthy volunteers, 50 years and older, both genders |
| Interventions | 1. Biological: V212 Lot 1. Approximately7.5 units/0.5 mL subcutaneous injection administered in a 4‐dose regimen given approximately 30 days apart 2. Biological: V212 Lot 2. Approximately 7.5 units/0.5 mL subcutaneous injection administered in a 4‐dose regimen given approximately 30 days apart 3. Biological: V212 Lot 3. Approximately 7.5 units/0.5 mL subcutaneous injection administered in a 4‐dose regimen given approximately 30 days apart |
| Outcomes | Geometric mean titre of VZV glycoprotein enzyme‐linked immunosorbent assay (gpELISA) antibody titres, number or percentage of participants with a serious adverse experience (time frame: up to 28 days post dose 4) |
| Starting date | July 2014 |
| Contact information | Please refer to this study by its ClinicalTrials.gov identifier: NCT02180295 |
| Notes | This study has been withdrawn prior to enrolment. No publications provided |
| Trial name or title | 'Safety and immunogenicity study of live attenuated vaccine against herpes zoster in Chinese adults aged 50 years and older' |
| Methods | Allocation: randomised Intervention model: parallel assignment Masking: double‐blind (participant, investigator) Primary purpose: prevention |
| Participants | 440 participants. Aged 50 to 80 years, both gender, accepts healthy volunteers |
| Interventions | 1. Vaccine with low dose of virus content, between 4.7 to 5.0 lg PFU 2.Vaccine with high dose of virus content, between 4.3 to 5.0 lg PFU 3. Vaccine with middle dose of virus content, between 4.3 to 5.0 lg PFU 4. Vaccine with very low dose of virus content, between 4.3 to 5.0 lg PFU 5. Placebo |
| Outcomes | Primary outcome measures:
Secondary outcome measures:
|
| Starting date | November 2015 |
| Contact information | Beijing Chaoyang District Centre for Disease Control and Prevention Please refer to this study by its ClinicalTrials.gov identifier: NCT02526745 |
| Notes | This study evaluates the safety and immunogenicity of live attenuated vaccine in adults aged 50 years and older. Half of participants will receive high doses of the vaccine,while the other half will receive low doses of the vaccine in phase I clinical trial. At the phase II clinical trial, participants will be distributed equally to four groups (low, middle, high doses of the vaccine and placebo) |
AE: adverse event
GSK: GlaxoSmithKline
HZ: herpes zoster
PFU: plaque‐forming units
PHN: postherpetic neuralgia
pIMDs: potential immune‐mediated diseases
SAE: serious adverse event
VZV: varicella zoster virus
Data and analyses
| Outcome or subgroup title | No. of studies | No. of participants | Statistical method | Effect size |
| 1 Incidence of herpes zoster Show forest plot | 2 | Risk Ratio (M‐H, Fixed, 95% CI) | Totals not selected | |
| Analysis 1.1 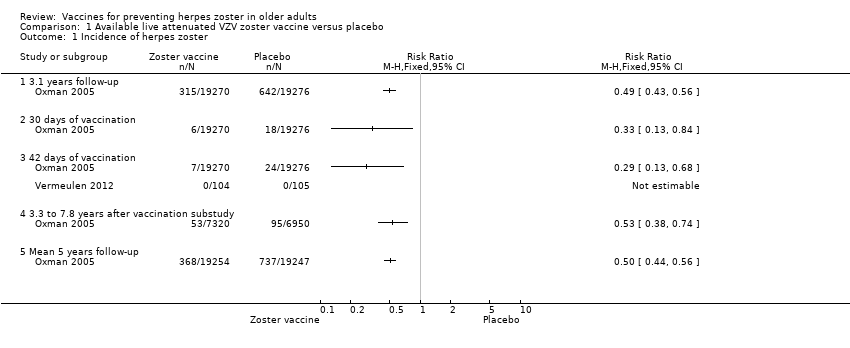 Comparison 1 Available live attenuated VZV zoster vaccine versus placebo, Outcome 1 Incidence of herpes zoster. | ||||
| 1.1 3.1 years follow‐up | 1 | Risk Ratio (M‐H, Fixed, 95% CI) | 0.0 [0.0, 0.0] | |
| 1.2 30 days of vaccination | 1 | Risk Ratio (M‐H, Fixed, 95% CI) | 0.0 [0.0, 0.0] | |
| 1.3 42 days of vaccination | 2 | Risk Ratio (M‐H, Fixed, 95% CI) | 0.0 [0.0, 0.0] | |
| 1.4 3.3 to 7.8 years after vaccination substudy | 1 | Risk Ratio (M‐H, Fixed, 95% CI) | 0.0 [0.0, 0.0] | |
| 1.5 Mean 5 years follow‐up | 1 | Risk Ratio (M‐H, Fixed, 95% CI) | 0.0 [0.0, 0.0] | |
| 2 Incidence of herpes zoster with ZBPI ADL. Severity of interference scores of 300 or greater (high score is worse) Show forest plot | 1 | Risk Ratio (M‐H, Fixed, 95% CI) | Totals not selected | |
| Analysis 1.2  Comparison 1 Available live attenuated VZV zoster vaccine versus placebo, Outcome 2 Incidence of herpes zoster with ZBPI ADL. Severity of interference scores of 300 or greater (high score is worse). | ||||
| 3 Participants with AEs Show forest plot | 4 | Risk Ratio (M‐H, Fixed, 95% CI) | Subtotals only | |
| Analysis 1.3  Comparison 1 Available live attenuated VZV zoster vaccine versus placebo, Outcome 3 Participants with AEs. | ||||
| 3.1 One or more AEs | 3 | 6986 | Risk Ratio (M‐H, Fixed, 95% CI) | 1.70 [1.61, 1.80] |
| 3.2 Vaccine‐related AEs | 1 | 209 | Risk Ratio (M‐H, Fixed, 95% CI) | 4.63 [2.64, 8.12] |
| 3.3 Systemic AEs | 3 | 6986 | Risk Ratio (M‐H, Fixed, 95% CI) | 1.07 [0.98, 1.16] |
| 3.4 Systemic pruritus | 1 | 209 | Risk Ratio (M‐H, Fixed, 95% CI) | 7.07 [0.37, 135.13] |
| 3.5 Vaccine‐related systemic AEs | 2 | 6777 | Risk Ratio (M‐H, Fixed, 95% CI) | 1.29 [1.06, 1.57] |
| 3.6 Varicella‐like rash not at injection site (day of vaccination to day 42) | 2 | 38755 | Risk Ratio (M‐H, Fixed, 95% CI) | 1.12 [0.58, 2.18] |
| 3.7 Herpes zoster‐like rash (day of vaccination to day 42) | 1 | 38546 | Risk Ratio (M‐H, Fixed, 95% CI) | 0.47 [0.27, 0.84] |
| 3.8 Rash unrelated to herpes zoster (day of vaccination to day 42) | 1 | 38546 | Risk Ratio (M‐H, Fixed, 95% CI) | 0.96 [0.86, 1.07] |
| 3.9 ≥ 1 serious AEs regardless of type of storage of the vaccine | 4 | 50896 | Risk Ratio (M‐H, Fixed, 95% CI) | 1.08 [0.96, 1.20] |
| 3.10 Vaccine‐related serious AEs | 3 | 50687 | Risk Ratio (M‐H, Fixed, 95% CI) | 1.00 [0.25, 4.00] |
| 3.11 Discontinued due to vaccine‐related AEs | 2 | 370 | Risk Ratio (M‐H, Fixed, 95% CI) | 5.05 [0.25, 103.88] |
| 3.12 Hospitalised | 1 | 6616 | Risk Ratio (M‐H, Fixed, 95% CI) | 1.00 [0.93, 1.07] |
| 3.13 Hospitalisation related to herpes zoster | 1 | 6616 | Risk Ratio (M‐H, Fixed, 95% CI) | 0.81 [0.25, 2.67] |
| 3.14 Injection site AEs | 3 | 6986 | Risk Ratio (M‐H, Fixed, 95% CI) | 2.99 [2.75, 3.26] |
| 3.15 Erythema inoculation site | 2 | 6825 | Risk Ratio (M‐H, Fixed, 95% CI) | 5.15 [4.51, 5.87] |
| 3.16 Pain inoculation site | 2 | 6825 | Risk Ratio (M‐H, Fixed, 95% CI) | 4.14 [3.67, 4.68] |
| 3.17 Pruritus inoculation site | 2 | 6825 | Risk Ratio (M‐H, Fixed, 95% CI) | 6.91 [4.87, 9.82] |
| 3.18 Swelling inoculation site | 2 | 6825 | Risk Ratio (M‐H, Fixed, 95% CI) | 5.85 [4.96, 6.91] |
| 3.19 Warmth inoculation site | 2 | 6825 | Risk Ratio (M‐H, Fixed, 95% CI) | 5.15 [2.75, 9.66] |
| 3.20 Rash inoculation site | 1 | 6616 | Risk Ratio (M‐H, Fixed, 95% CI) | 3.26 [1.31, 8.11] |
| 3.21 Haematoma inoculation site | 1 | 6616 | Risk Ratio (M‐H, Fixed, 95% CI) | 1.13 [0.76, 1.67] |
| 3.22 Mass inoculation site | 1 | 6616 | Risk Ratio (M‐H, Fixed, 95% CI) | 14.67 [3.51, 61.33] |
| 3.23 Varicella‐like rash at injection site (day of vaccination to day 42) | 1 | 38546 | Risk Ratio (M‐H, Fixed, 95% CI) | 2.86 [1.21, 6.76] |
| 4 Drop‐outs Show forest plot | 4 | Risk Ratio (M‐H, Fixed, 95% CI) | Subtotals only | |
| Analysis 1.4  Comparison 1 Available live attenuated VZV zoster vaccine versus placebo, Outcome 4 Drop‐outs. | ||||
| 4.1 For any reason | 3 | 38916 | Risk Ratio (M‐H, Fixed, 95% CI) | 0.99 [0.91, 1.08] |
| 4.2 Death | 3 | 50687 | Risk Ratio (M‐H, Fixed, 95% CI) | 1.01 [0.92, 1.11] |
| 4.3 Withdrew consent | 3 | 50735 | Risk Ratio (M‐H, Fixed, 95% CI) | 0.87 [0.64, 1.19] |
| 4.4 Lost to follow‐up | 3 | 50735 | Risk Ratio (M‐H, Fixed, 95% CI) | 1.29 [0.97, 1.73] |
| 4.5 Protocol deviation | 2 | 12189 | Risk Ratio (M‐H, Fixed, 95% CI) | 1.58 [0.41, 6.02] |
| 4.6 Clinical adverse event | 2 | 12189 | Risk Ratio (M‐H, Fixed, 95% CI) | 1.36 [0.73, 2.54] |
| 4.7 Physician decision | 1 | 11980 | Risk Ratio (M‐H, Fixed, 95% CI) | 0.20 [0.01, 4.17] |
| 5 Participants with no follow‐up Show forest plot | 3 | Risk Ratio (M‐H, Fixed, 95% CI) | Totals not selected | |
| Analysis 1.5  Comparison 1 Available live attenuated VZV zoster vaccine versus placebo, Outcome 5 Participants with no follow‐up. | ||||
| Outcome or subgroup title | No. of studies | No. of participants | Statistical method | Effect size |
| 1 Incidence of herpes zoster Show forest plot | 1 | Risk Ratio (M‐H, Fixed, 95% CI) | Totals not selected | |
| Analysis 2.1  Comparison 2 Live attenuated VZV zoster vaccine higher‐potency zoster vaccine versus lower‐potency zoster vaccine, Outcome 1 Incidence of herpes zoster. | ||||
| 2 Vaccine‐related adverse effects Show forest plot | 1 | Risk Ratio (M‐H, Fixed, 95% CI) | Totals not selected | |
| Analysis 2.2  Comparison 2 Live attenuated VZV zoster vaccine higher‐potency zoster vaccine versus lower‐potency zoster vaccine, Outcome 2 Vaccine‐related adverse effects. | ||||
| 3 Vaccine‐related systemic adverse effects Show forest plot | 1 | Risk Ratio (M‐H, Fixed, 95% CI) | Totals not selected | |
| Analysis 2.3  Comparison 2 Live attenuated VZV zoster vaccine higher‐potency zoster vaccine versus lower‐potency zoster vaccine, Outcome 3 Vaccine‐related systemic adverse effects. | ||||
| 4 Vaccine‐related serious adverse effects Show forest plot | 1 | Risk Ratio (M‐H, Fixed, 95% CI) | Totals not selected | |
| Analysis 2.4 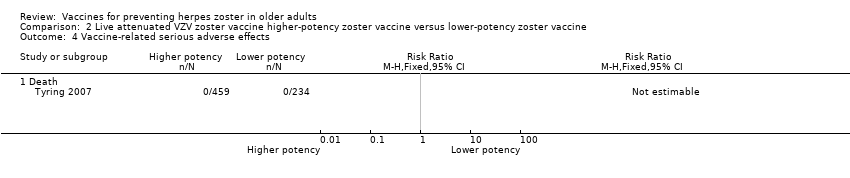 Comparison 2 Live attenuated VZV zoster vaccine higher‐potency zoster vaccine versus lower‐potency zoster vaccine, Outcome 4 Vaccine‐related serious adverse effects. | ||||
| 4.1 Death | 1 | Risk Ratio (M‐H, Fixed, 95% CI) | 0.0 [0.0, 0.0] | |
| 5 Injection site vaccine‐related adverse effects Show forest plot | 1 | Risk Ratio (M‐H, Fixed, 95% CI) | Totals not selected | |
| Analysis 2.5 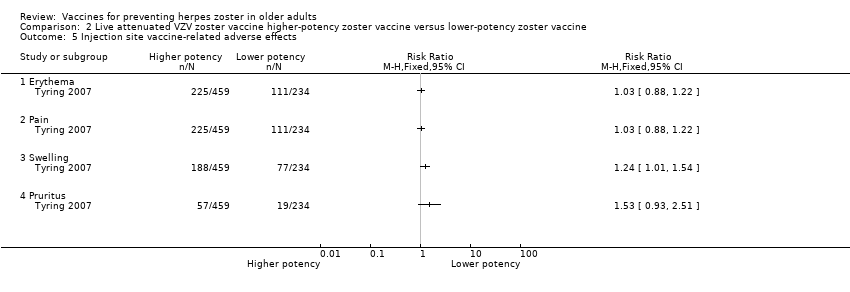 Comparison 2 Live attenuated VZV zoster vaccine higher‐potency zoster vaccine versus lower‐potency zoster vaccine, Outcome 5 Injection site vaccine‐related adverse effects. | ||||
| 5.1 Erythema | 1 | Risk Ratio (M‐H, Fixed, 95% CI) | 0.0 [0.0, 0.0] | |
| 5.2 Pain | 1 | Risk Ratio (M‐H, Fixed, 95% CI) | 0.0 [0.0, 0.0] | |
| 5.3 Swelling | 1 | Risk Ratio (M‐H, Fixed, 95% CI) | 0.0 [0.0, 0.0] | |
| 5.4 Pruritus | 1 | Risk Ratio (M‐H, Fixed, 95% CI) | 0.0 [0.0, 0.0] | |
| 6 Participants with no follow‐up Show forest plot | 1 | Risk Ratio (M‐H, Fixed, 95% CI) | Totals not selected | |
| Analysis 2.6  Comparison 2 Live attenuated VZV zoster vaccine higher‐potency zoster vaccine versus lower‐potency zoster vaccine, Outcome 6 Participants with no follow‐up. | ||||
| Outcome or subgroup title | No. of studies | No. of participants | Statistical method | Effect size |
| 1 Participants with adverse effects Show forest plot | 1 | Risk Ratio (M‐H, Fixed, 95% CI) | Totals not selected | |
| Analysis 3.1  Comparison 3 Live attenuated VZV zoster vaccine zoster vaccine refrigerated versus zoster vaccine frozen, Outcome 1 Participants with adverse effects. | ||||
| 1.1 One or more adverse effects | 1 | Risk Ratio (M‐H, Fixed, 95% CI) | 0.0 [0.0, 0.0] | |
| 1.2 Vaccine‐related adverse effects | 1 | Risk Ratio (M‐H, Fixed, 95% CI) | 0.0 [0.0, 0.0] | |
| 1.3 Systemic adverse effects | 1 | Risk Ratio (M‐H, Fixed, 95% CI) | 0.0 [0.0, 0.0] | |
| 1.4 Systemic vaccine‐related adverse effects | 1 | Risk Ratio (M‐H, Fixed, 95% CI) | 0.0 [0.0, 0.0] | |
| 1.5 Serious adverse effects | 1 | Risk Ratio (M‐H, Fixed, 95% CI) | 0.0 [0.0, 0.0] | |
| 1.6 Vaccine‐related serious adverse effects | 1 | Risk Ratio (M‐H, Fixed, 95% CI) | 0.0 [0.0, 0.0] | |
| 1.7 Death | 1 | Risk Ratio (M‐H, Fixed, 95% CI) | 0.0 [0.0, 0.0] | |
| 1.8 Injection site adverse effects | 1 | Risk Ratio (M‐H, Fixed, 95% CI) | 0.0 [0.0, 0.0] | |
| 1.9 Injection site vaccine‐related adverse effects | 1 | Risk Ratio (M‐H, Fixed, 95% CI) | 0.0 [0.0, 0.0] | |
| 1.10 Discontinued due to any adverse effects | 1 | Risk Ratio (M‐H, Fixed, 95% CI) | 0.0 [0.0, 0.0] | |
| 1.11 Discontinued due to a vaccine‐related adverse effect | 1 | Risk Ratio (M‐H, Fixed, 95% CI) | 0.0 [0.0, 0.0] | |
| 2 Participants with no follow‐up Show forest plot | 1 | Risk Ratio (M‐H, Fixed, 95% CI) | Totals not selected | |
| Analysis 3.2  Comparison 3 Live attenuated VZV zoster vaccine zoster vaccine refrigerated versus zoster vaccine frozen, Outcome 2 Participants with no follow‐up. | ||||
| Outcome or subgroup title | No. of studies | No. of participants | Statistical method | Effect size |
| 1 Incidence of herpes zoster Show forest plot | 1 | Risk Ratio (M‐H, Fixed, 95% CI) | Totals not selected | |
| Analysis 4.1 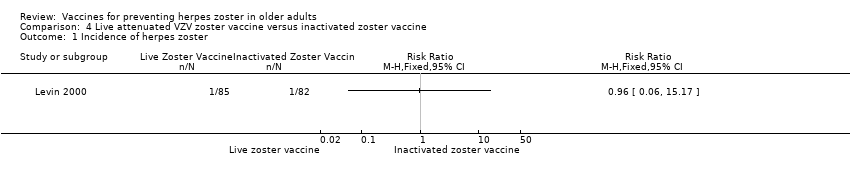 Comparison 4 Live attenuated VZV zoster vaccine versus inactivated zoster vaccine, Outcome 1 Incidence of herpes zoster. | ||||
| Outcome or subgroup title | No. of studies | No. of participants | Statistical method | Effect size |
| 1 3200 pfu VZV/dose Show forest plot | 1 | Risk Ratio (M‐H, Fixed, 95% CI) | Totals not selected | |
| Analysis 5.1 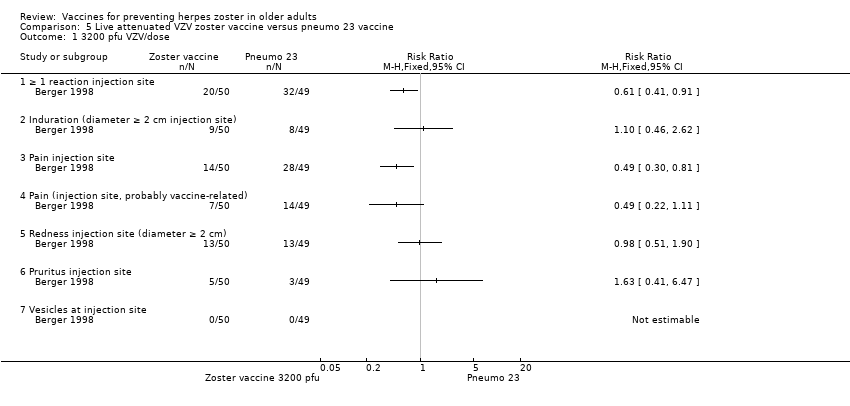 Comparison 5 Live attenuated VZV zoster vaccine versus pneumo 23 vaccine, Outcome 1 3200 pfu VZV/dose. | ||||
| 1.1 ≥ 1 reaction injection site | 1 | Risk Ratio (M‐H, Fixed, 95% CI) | 0.0 [0.0, 0.0] | |
| 1.2 Induration (diameter ≥ 2 cm injection site) | 1 | Risk Ratio (M‐H, Fixed, 95% CI) | 0.0 [0.0, 0.0] | |
| 1.3 Pain injection site | 1 | Risk Ratio (M‐H, Fixed, 95% CI) | 0.0 [0.0, 0.0] | |
| 1.4 Pain (injection site, probably vaccine‐related) | 1 | Risk Ratio (M‐H, Fixed, 95% CI) | 0.0 [0.0, 0.0] | |
| 1.5 Redness injection site (diameter ≥ 2 cm) | 1 | Risk Ratio (M‐H, Fixed, 95% CI) | 0.0 [0.0, 0.0] | |
| 1.6 Pruritus injection site | 1 | Risk Ratio (M‐H, Fixed, 95% CI) | 0.0 [0.0, 0.0] | |
| 1.7 Vesicles at injection site | 1 | Risk Ratio (M‐H, Fixed, 95% CI) | 0.0 [0.0, 0.0] | |
| 2 8500 pfu VZV/dose Show forest plot | 1 | Risk Ratio (M‐H, Fixed, 95% CI) | Totals not selected | |
| Analysis 5.2 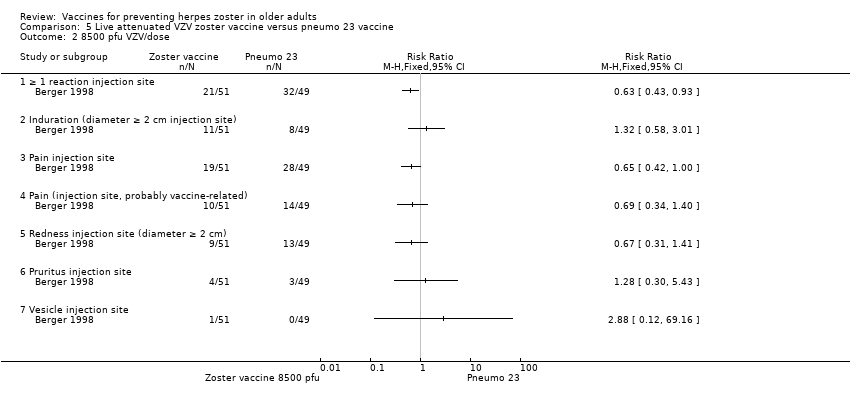 Comparison 5 Live attenuated VZV zoster vaccine versus pneumo 23 vaccine, Outcome 2 8500 pfu VZV/dose. | ||||
| 2.1 ≥ 1 reaction injection site | 1 | Risk Ratio (M‐H, Fixed, 95% CI) | 0.0 [0.0, 0.0] | |
| 2.2 Induration (diameter ≥ 2 cm injection site) | 1 | Risk Ratio (M‐H, Fixed, 95% CI) | 0.0 [0.0, 0.0] | |
| 2.3 Pain injection site | 1 | Risk Ratio (M‐H, Fixed, 95% CI) | 0.0 [0.0, 0.0] | |
| 2.4 Pain (injection site, probably vaccine‐related) | 1 | Risk Ratio (M‐H, Fixed, 95% CI) | 0.0 [0.0, 0.0] | |
| 2.5 Redness injection site (diameter ≥ 2 cm) | 1 | Risk Ratio (M‐H, Fixed, 95% CI) | 0.0 [0.0, 0.0] | |
| 2.6 Pruritus injection site | 1 | Risk Ratio (M‐H, Fixed, 95% CI) | 0.0 [0.0, 0.0] | |
| 2.7 Vesicle injection site | 1 | Risk Ratio (M‐H, Fixed, 95% CI) | 0.0 [0.0, 0.0] | |
| 3 41,650 pfu/dose Show forest plot | 1 | Risk Ratio (M‐H, Fixed, 95% CI) | Totals not selected | |
| Analysis 5.3  Comparison 5 Live attenuated VZV zoster vaccine versus pneumo 23 vaccine, Outcome 3 41,650 pfu/dose. | ||||
| 3.1 ≥ 1 reaction injection site | 1 | Risk Ratio (M‐H, Fixed, 95% CI) | 0.0 [0.0, 0.0] | |
| 3.2 Induration (diameter ≥ 2 cm injection site) | 1 | Risk Ratio (M‐H, Fixed, 95% CI) | 0.0 [0.0, 0.0] | |
| 3.3 Pain injection site | 1 | Risk Ratio (M‐H, Fixed, 95% CI) | 0.0 [0.0, 0.0] | |
| 3.4 Pain (injection site, probably vaccine‐related) | 1 | Risk Ratio (M‐H, Fixed, 95% CI) | 0.0 [0.0, 0.0] | |
| 3.5 Redness injection site (diameter ≥ 2 cm) | 1 | Risk Ratio (M‐H, Fixed, 95% CI) | 0.0 [0.0, 0.0] | |
| 3.6 Pruritus injection site | 1 | Risk Ratio (M‐H, Fixed, 95% CI) | 0.0 [0.0, 0.0] | |
| 3.7 Vesicle injection site | 1 | Risk Ratio (M‐H, Fixed, 95% CI) | 0.0 [0.0, 0.0] | |
| 4 Duration in days of adverse effects Show forest plot | 1 | Mean Difference (IV, Fixed, 95% CI) | Totals not selected | |
| Analysis 5.4  Comparison 5 Live attenuated VZV zoster vaccine versus pneumo 23 vaccine, Outcome 4 Duration in days of adverse effects. | ||||
| 4.1 Erythema | 1 | Mean Difference (IV, Fixed, 95% CI) | 0.0 [0.0, 0.0] | |
| 4.2 Swelling | 1 | Mean Difference (IV, Fixed, 95% CI) | 0.0 [0.0, 0.0] | |
| 4.3 Pain | 1 | Mean Difference (IV, Fixed, 95% CI) | 0.0 [0.0, 0.0] | |
| 4.4 Rash | 1 | Mean Difference (IV, Fixed, 95% CI) | 0.0 [0.0, 0.0] | |
| 4.5 Pruritus | 1 | Mean Difference (IV, Fixed, 95% CI) | 0.0 [0.0, 0.0] | |
| 4.6 Haematoma | 1 | Mean Difference (IV, Fixed, 95% CI) | 0.0 [0.0, 0.0] | |
| Outcome or subgroup title | No. of studies | No. of participants | Statistical method | Effect size |
| 1 Participants with adverse events Show forest plot | 1 | Risk Ratio (M‐H, Fixed, 95% CI) | Totals not selected | |
| Analysis 6.1 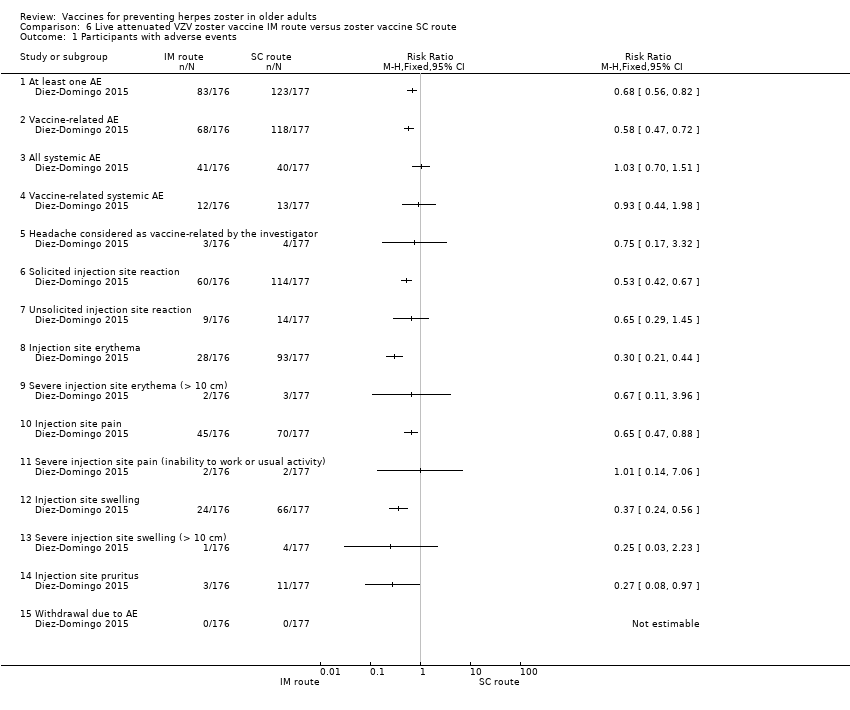 Comparison 6 Live attenuated VZV zoster vaccine IM route versus zoster vaccine SC route, Outcome 1 Participants with adverse events. | ||||
| 1.1 At least one AE | 1 | Risk Ratio (M‐H, Fixed, 95% CI) | 0.0 [0.0, 0.0] | |
| 1.2 Vaccine‐related AE | 1 | Risk Ratio (M‐H, Fixed, 95% CI) | 0.0 [0.0, 0.0] | |
| 1.3 All systemic AE | 1 | Risk Ratio (M‐H, Fixed, 95% CI) | 0.0 [0.0, 0.0] | |
| 1.4 Vaccine‐related systemic AE | 1 | Risk Ratio (M‐H, Fixed, 95% CI) | 0.0 [0.0, 0.0] | |
| 1.5 Headache considered as vaccine‐related by the investigator | 1 | Risk Ratio (M‐H, Fixed, 95% CI) | 0.0 [0.0, 0.0] | |
| 1.6 Solicited injection site reaction | 1 | Risk Ratio (M‐H, Fixed, 95% CI) | 0.0 [0.0, 0.0] | |
| 1.7 Unsolicited injection site reaction | 1 | Risk Ratio (M‐H, Fixed, 95% CI) | 0.0 [0.0, 0.0] | |
| 1.8 Injection site erythema | 1 | Risk Ratio (M‐H, Fixed, 95% CI) | 0.0 [0.0, 0.0] | |
| 1.9 Severe injection site erythema (> 10 cm) | 1 | Risk Ratio (M‐H, Fixed, 95% CI) | 0.0 [0.0, 0.0] | |
| 1.10 Injection site pain | 1 | Risk Ratio (M‐H, Fixed, 95% CI) | 0.0 [0.0, 0.0] | |
| 1.11 Severe injection site pain (inability to work or usual activity) | 1 | Risk Ratio (M‐H, Fixed, 95% CI) | 0.0 [0.0, 0.0] | |
| 1.12 Injection site swelling | 1 | Risk Ratio (M‐H, Fixed, 95% CI) | 0.0 [0.0, 0.0] | |
| 1.13 Severe injection site swelling (> 10 cm) | 1 | Risk Ratio (M‐H, Fixed, 95% CI) | 0.0 [0.0, 0.0] | |
| 1.14 Injection site pruritus | 1 | Risk Ratio (M‐H, Fixed, 95% CI) | 0.0 [0.0, 0.0] | |
| 1.15 Withdrawal due to AE | 1 | Risk Ratio (M‐H, Fixed, 95% CI) | 0.0 [0.0, 0.0] | |
| Outcome or subgroup title | No. of studies | No. of participants | Statistical method | Effect size |
| 1 Zoster vaccine 1 month schedule versus zoster vaccine 3 month schedule Show forest plot | 1 | Risk Ratio (M‐H, Fixed, 95% CI) | Totals not selected | |
| Analysis 7.1  Comparison 7 Live attenuated VZV zoster vaccine 2 doses versus single dose and also 2 doses given at different intervals, Outcome 1 Zoster vaccine 1 month schedule versus zoster vaccine 3 month schedule. | ||||
| 1.1 Participants with AE | 1 | Risk Ratio (M‐H, Fixed, 95% CI) | 0.0 [0.0, 0.0] | |
| 1.2 Participants with vaccine‐related AE | 1 | Risk Ratio (M‐H, Fixed, 95% CI) | 0.0 [0.0, 0.0] | |
| 1.3 Participants with serious AE | 1 | Risk Ratio (M‐H, Fixed, 95% CI) | 0.0 [0.0, 0.0] | |
| 1.4 Participants with vaccine‐related serious AE | 1 | Risk Ratio (M‐H, Fixed, 95% CI) | 0.0 [0.0, 0.0] | |
| 1.5 Participants with withdrawal due to AE | 1 | Risk Ratio (M‐H, Fixed, 95% CI) | 0.0 [0.0, 0.0] | |
| 1.6 Participants with vaccine‐related withdrawal due to AE | 1 | Risk Ratio (M‐H, Fixed, 95% CI) | 0.0 [0.0, 0.0] | |
| 1.7 Participants with non‐serious vaccine‐related withdrawal due to AE | 1 | Risk Ratio (M‐H, Fixed, 95% CI) | 0.0 [0.0, 0.0] | |
| 1.8 Participants with systemic AE | 1 | Risk Ratio (M‐H, Fixed, 95% CI) | 0.0 [0.0, 0.0] | |
| 1.9 Participants with vaccine‐related systemic AE | 1 | Risk Ratio (M‐H, Fixed, 95% CI) | 0.0 [0.0, 0.0] | |
| 1.10 Participants with rash of interest non‐injection site rashes | 1 | Risk Ratio (M‐H, Fixed, 95% CI) | 0.0 [0.0, 0.0] | |
| 1.11 Participants with varicella/varicella‐like rash | 1 | Risk Ratio (M‐H, Fixed, 95% CI) | 0.0 [0.0, 0.0] | |
| 1.12 Participants with herpes zoster/zoster‐like rash | 1 | Risk Ratio (M‐H, Fixed, 95% CI) | 0.0 [0.0, 0.0] | |
| 1.13 Participants with injection site reaction | 1 | Risk Ratio (M‐H, Fixed, 95% CI) | 0.0 [0.0, 0.0] | |
| 1.14 Participants with solicited injection site reaction | 1 | Risk Ratio (M‐H, Fixed, 95% CI) | 0.0 [0.0, 0.0] | |
| 1.15 Participants with unsolicited injection site reaction | 1 | Risk Ratio (M‐H, Fixed, 95% CI) | 0.0 [0.0, 0.0] | |
| 1.16 Participants with erythema injection site | 1 | Risk Ratio (M‐H, Fixed, 95% CI) | 0.0 [0.0, 0.0] | |
| 1.17 Participants with pain injection site | 1 | Risk Ratio (M‐H, Fixed, 95% CI) | 0.0 [0.0, 0.0] | |
| 1.18 Participants with swelling injection site | 1 | Risk Ratio (M‐H, Fixed, 95% CI) | 0.0 [0.0, 0.0] | |
| 2 Zoster vaccine 1 month schedule versus zoster vaccine single dose Show forest plot | 1 | Risk Ratio (M‐H, Fixed, 95% CI) | Totals not selected | |
| Analysis 7.2  Comparison 7 Live attenuated VZV zoster vaccine 2 doses versus single dose and also 2 doses given at different intervals, Outcome 2 Zoster vaccine 1 month schedule versus zoster vaccine single dose. | ||||
| 2.1 Participants with adverse events | 1 | Risk Ratio (M‐H, Fixed, 95% CI) | 0.0 [0.0, 0.0] | |
| 2.2 Participants with vaccine‐related AE | 1 | Risk Ratio (M‐H, Fixed, 95% CI) | 0.0 [0.0, 0.0] | |
| 2.3 Participants with serious AE | 1 | Risk Ratio (M‐H, Fixed, 95% CI) | 0.0 [0.0, 0.0] | |
| 2.4 Participants with vaccine‐related serious AE | 1 | Risk Ratio (M‐H, Fixed, 95% CI) | 0.0 [0.0, 0.0] | |
| 2.5 Participants with withdrawal due to AE | 1 | Risk Ratio (M‐H, Fixed, 95% CI) | 0.0 [0.0, 0.0] | |
| 2.6 Participants with vaccine‐related withdrawal due to AE | 1 | Risk Ratio (M‐H, Fixed, 95% CI) | 0.0 [0.0, 0.0] | |
| 2.7 Participants with non‐serious vaccine‐related withdrawal due to AE | 1 | Risk Ratio (M‐H, Fixed, 95% CI) | 0.0 [0.0, 0.0] | |
| 2.8 Participants with systemic AE | 1 | Risk Ratio (M‐H, Fixed, 95% CI) | 0.0 [0.0, 0.0] | |
| 2.9 Participants with vaccine‐related systemic AE | 1 | Risk Ratio (M‐H, Fixed, 95% CI) | 0.0 [0.0, 0.0] | |
| 2.10 Participants with rash of interest non‐injection site rashes | 1 | Risk Ratio (M‐H, Fixed, 95% CI) | 0.0 [0.0, 0.0] | |
| 2.11 Participants with varicella/varicella‐like rash | 1 | Risk Ratio (M‐H, Fixed, 95% CI) | 0.0 [0.0, 0.0] | |
| 2.12 Participants with herpes zoster/zoster‐like rash | 1 | Risk Ratio (M‐H, Fixed, 95% CI) | 0.0 [0.0, 0.0] | |
| 2.13 Participants with injection site reaction | 1 | Risk Ratio (M‐H, Fixed, 95% CI) | 0.0 [0.0, 0.0] | |
| 2.14 Participants with solicited injection site reaction | 1 | Risk Ratio (M‐H, Fixed, 95% CI) | 0.0 [0.0, 0.0] | |
| 2.15 Participants with unsolicited injection site reaction | 1 | Risk Ratio (M‐H, Fixed, 95% CI) | 0.0 [0.0, 0.0] | |
| 2.16 Participants with erythema injection site | 1 | Risk Ratio (M‐H, Fixed, 95% CI) | 0.0 [0.0, 0.0] | |
| 2.17 Participants with pain injection site | 1 | Risk Ratio (M‐H, Fixed, 95% CI) | 0.0 [0.0, 0.0] | |
| 2.18 Participants with swelling injection site | 1 | Risk Ratio (M‐H, Fixed, 95% CI) | 0.0 [0.0, 0.0] | |
| 3 Zoster vaccine 3 month schedule versus zoster vaccine single dose Show forest plot | 1 | Risk Ratio (M‐H, Fixed, 95% CI) | Totals not selected | |
| Analysis 7.3 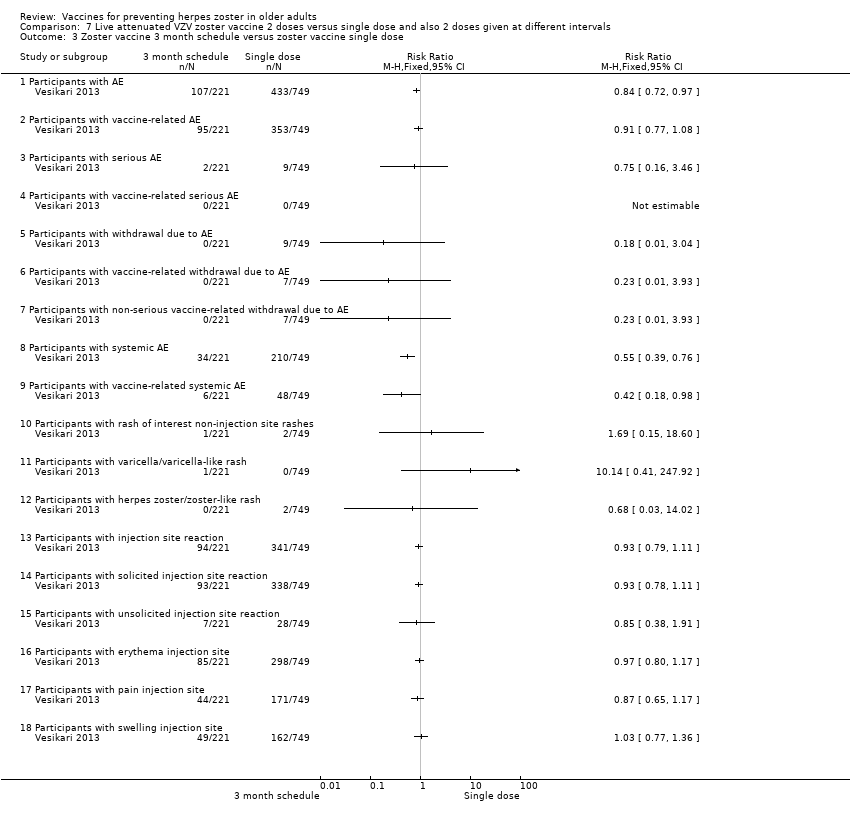 Comparison 7 Live attenuated VZV zoster vaccine 2 doses versus single dose and also 2 doses given at different intervals, Outcome 3 Zoster vaccine 3 month schedule versus zoster vaccine single dose. | ||||
| 3.1 Participants with AE | 1 | Risk Ratio (M‐H, Fixed, 95% CI) | 0.0 [0.0, 0.0] | |
| 3.2 Participants with vaccine‐related AE | 1 | Risk Ratio (M‐H, Fixed, 95% CI) | 0.0 [0.0, 0.0] | |
| 3.3 Participants with serious AE | 1 | Risk Ratio (M‐H, Fixed, 95% CI) | 0.0 [0.0, 0.0] | |
| 3.4 Participants with vaccine‐related serious AE | 1 | Risk Ratio (M‐H, Fixed, 95% CI) | 0.0 [0.0, 0.0] | |
| 3.5 Participants with withdrawal due to AE | 1 | Risk Ratio (M‐H, Fixed, 95% CI) | 0.0 [0.0, 0.0] | |
| 3.6 Participants with vaccine‐related withdrawal due to AE | 1 | Risk Ratio (M‐H, Fixed, 95% CI) | 0.0 [0.0, 0.0] | |
| 3.7 Participants with non‐serious vaccine‐related withdrawal due to AE | 1 | Risk Ratio (M‐H, Fixed, 95% CI) | 0.0 [0.0, 0.0] | |
| 3.8 Participants with systemic AE | 1 | Risk Ratio (M‐H, Fixed, 95% CI) | 0.0 [0.0, 0.0] | |
| 3.9 Participants with vaccine‐related systemic AE | 1 | Risk Ratio (M‐H, Fixed, 95% CI) | 0.0 [0.0, 0.0] | |
| 3.10 Participants with rash of interest non‐injection site rashes | 1 | Risk Ratio (M‐H, Fixed, 95% CI) | 0.0 [0.0, 0.0] | |
| 3.11 Participants with varicella/varicella‐like rash | 1 | Risk Ratio (M‐H, Fixed, 95% CI) | 0.0 [0.0, 0.0] | |
| 3.12 Participants with herpes zoster/zoster‐like rash | 1 | Risk Ratio (M‐H, Fixed, 95% CI) | 0.0 [0.0, 0.0] | |
| 3.13 Participants with injection site reaction | 1 | Risk Ratio (M‐H, Fixed, 95% CI) | 0.0 [0.0, 0.0] | |
| 3.14 Participants with solicited injection site reaction | 1 | Risk Ratio (M‐H, Fixed, 95% CI) | 0.0 [0.0, 0.0] | |
| 3.15 Participants with unsolicited injection site reaction | 1 | Risk Ratio (M‐H, Fixed, 95% CI) | 0.0 [0.0, 0.0] | |
| 3.16 Participants with erythema injection site | 1 | Risk Ratio (M‐H, Fixed, 95% CI) | 0.0 [0.0, 0.0] | |
| 3.17 Participants with pain injection site | 1 | Risk Ratio (M‐H, Fixed, 95% CI) | 0.0 [0.0, 0.0] | |
| 3.18 Participants with swelling injection site | 1 | Risk Ratio (M‐H, Fixed, 95% CI) | 0.0 [0.0, 0.0] | |
| Outcome or subgroup title | No. of studies | No. of participants | Statistical method | Effect size |
| 1 50 μg gE/AS01E versus 50 μg gE/AS01B Show forest plot | 1 | Risk Ratio (M‐H, Fixed, 95% CI) | Totals not selected | |
| Analysis 8.1  Comparison 8 Adjuvanted recombinant VZV subunit zoster vaccine: lower or higher quantities of adjuvants plus gE subunit VZV versus unadjuvanted gE or saline, Outcome 1 50 μg gE/AS01E versus 50 μg gE/AS01B. | ||||
| 1.1 Participants with any symptom | 1 | Risk Ratio (M‐H, Fixed, 95% CI) | 0.0 [0.0, 0.0] | |
| 1.2 Participants with any grade 3 symptom | 1 | Risk Ratio (M‐H, Fixed, 95% CI) | 0.0 [0.0, 0.0] | |
| 1.3 Participants with any general symptom | 1 | Risk Ratio (M‐H, Fixed, 95% CI) | 0.0 [0.0, 0.0] | |
| 1.4 Participants with any grade 3 general symptom | 1 | Risk Ratio (M‐H, Fixed, 95% CI) | 0.0 [0.0, 0.0] | |
| 1.5 Participants with fatigue | 1 | Risk Ratio (M‐H, Fixed, 95% CI) | 0.0 [0.0, 0.0] | |
| 1.6 Participants with grade 3 fatigue | 1 | Risk Ratio (M‐H, Fixed, 95% CI) | 0.0 [0.0, 0.0] | |
| 1.7 Participants with fever | 1 | Risk Ratio (M‐H, Fixed, 95% CI) | 0.0 [0.0, 0.0] | |
| 1.8 Participants with grade 3 fever | 1 | Risk Ratio (M‐H, Fixed, 95% CI) | 0.0 [0.0, 0.0] | |
| 1.9 Participants with gastrointestinal symptom | 1 | Risk Ratio (M‐H, Fixed, 95% CI) | 0.0 [0.0, 0.0] | |
| 1.10 Participants with grade 3 gastrointestinal symptom | 1 | Risk Ratio (M‐H, Fixed, 95% CI) | 0.0 [0.0, 0.0] | |
| 1.11 Participants with headache | 1 | Risk Ratio (M‐H, Fixed, 95% CI) | 0.0 [0.0, 0.0] | |
| 1.12 Participants with grade 3 headache | 1 | Risk Ratio (M‐H, Fixed, 95% CI) | 0.0 [0.0, 0.0] | |
| 1.13 Participants with myalgia | 1 | Risk Ratio (M‐H, Fixed, 95% CI) | 0.0 [0.0, 0.0] | |
| 1.14 Participants with grade 3 myalgia | 1 | Risk Ratio (M‐H, Fixed, 95% CI) | 0.0 [0.0, 0.0] | |
| 1.15 Participants with any local symptom | 1 | Risk Ratio (M‐H, Fixed, 95% CI) | 0.0 [0.0, 0.0] | |
| 1.16 Participants with any grade 3 local symptom | 1 | Risk Ratio (M‐H, Fixed, 95% CI) | 0.0 [0.0, 0.0] | |
| 1.17 Participants with local pain | 1 | Risk Ratio (M‐H, Fixed, 95% CI) | 0.0 [0.0, 0.0] | |
| 1.18 Participants with grade 3 local pain | 1 | Risk Ratio (M‐H, Fixed, 95% CI) | 0.0 [0.0, 0.0] | |
| 1.19 Participants with local redness | 1 | Risk Ratio (M‐H, Fixed, 95% CI) | 0.0 [0.0, 0.0] | |
| 1.20 Participants with grade 3 local redness | 1 | Risk Ratio (M‐H, Fixed, 95% CI) | 0.0 [0.0, 0.0] | |
| 1.21 Participants with local swelling | 1 | Risk Ratio (M‐H, Fixed, 95% CI) | 0.0 [0.0, 0.0] | |
| 1.22 Participants with grade 3 local swelling | 1 | Risk Ratio (M‐H, Fixed, 95% CI) | 0.0 [0.0, 0.0] | |
| 1.23 Participants with consent withdrawal | 1 | Risk Ratio (M‐H, Fixed, 95% CI) | 0.0 [0.0, 0.0] | |
| 1.24 Participants with lost follow‐up | 1 | Risk Ratio (M‐H, Fixed, 95% CI) | 0.0 [0.0, 0.0] | |
| 1.25 Participants with serious AE | 1 | Risk Ratio (M‐H, Fixed, 95% CI) | 0.0 [0.0, 0.0] | |
| 2 50 μg gE/AS01E versus 50 μg gE/saline (unadjuvanted gE) Show forest plot | 1 | Risk Ratio (M‐H, Fixed, 95% CI) | Totals not selected | |
| Analysis 8.2 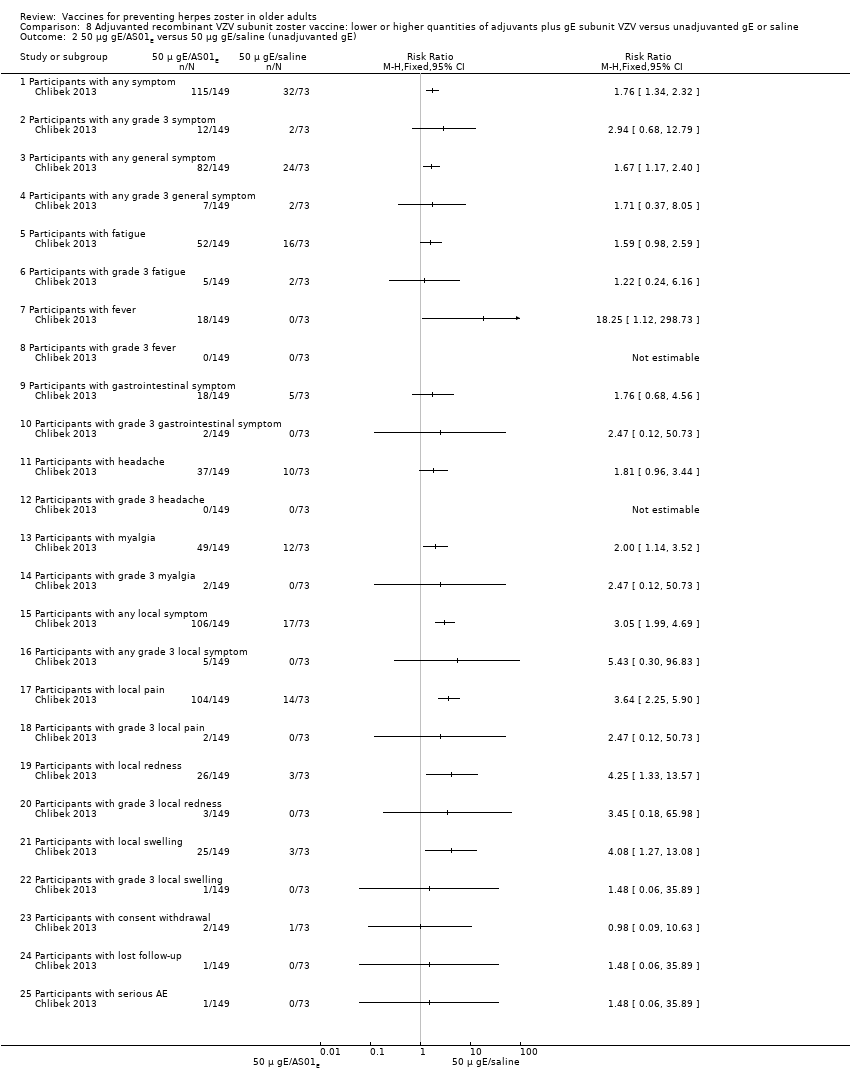 Comparison 8 Adjuvanted recombinant VZV subunit zoster vaccine: lower or higher quantities of adjuvants plus gE subunit VZV versus unadjuvanted gE or saline, Outcome 2 50 μg gE/AS01E versus 50 μg gE/saline (unadjuvanted gE). | ||||
| 2.1 Participants with any symptom | 1 | Risk Ratio (M‐H, Fixed, 95% CI) | 0.0 [0.0, 0.0] | |
| 2.2 Participants with any grade 3 symptom | 1 | Risk Ratio (M‐H, Fixed, 95% CI) | 0.0 [0.0, 0.0] | |
| 2.3 Participants with any general symptom | 1 | Risk Ratio (M‐H, Fixed, 95% CI) | 0.0 [0.0, 0.0] | |
| 2.4 Participants with any grade 3 general symptom | 1 | Risk Ratio (M‐H, Fixed, 95% CI) | 0.0 [0.0, 0.0] | |
| 2.5 Participants with fatigue | 1 | Risk Ratio (M‐H, Fixed, 95% CI) | 0.0 [0.0, 0.0] | |
| 2.6 Participants with grade 3 fatigue | 1 | Risk Ratio (M‐H, Fixed, 95% CI) | 0.0 [0.0, 0.0] | |
| 2.7 Participants with fever | 1 | Risk Ratio (M‐H, Fixed, 95% CI) | 0.0 [0.0, 0.0] | |
| 2.8 Participants with grade 3 fever | 1 | Risk Ratio (M‐H, Fixed, 95% CI) | 0.0 [0.0, 0.0] | |
| 2.9 Participants with gastrointestinal symptom | 1 | Risk Ratio (M‐H, Fixed, 95% CI) | 0.0 [0.0, 0.0] | |
| 2.10 Participants with grade 3 gastrointestinal symptom | 1 | Risk Ratio (M‐H, Fixed, 95% CI) | 0.0 [0.0, 0.0] | |
| 2.11 Participants with headache | 1 | Risk Ratio (M‐H, Fixed, 95% CI) | 0.0 [0.0, 0.0] | |
| 2.12 Participants with grade 3 headache | 1 | Risk Ratio (M‐H, Fixed, 95% CI) | 0.0 [0.0, 0.0] | |
| 2.13 Participants with myalgia | 1 | Risk Ratio (M‐H, Fixed, 95% CI) | 0.0 [0.0, 0.0] | |
| 2.14 Participants with grade 3 myalgia | 1 | Risk Ratio (M‐H, Fixed, 95% CI) | 0.0 [0.0, 0.0] | |
| 2.15 Participants with any local symptom | 1 | Risk Ratio (M‐H, Fixed, 95% CI) | 0.0 [0.0, 0.0] | |
| 2.16 Participants with any grade 3 local symptom | 1 | Risk Ratio (M‐H, Fixed, 95% CI) | 0.0 [0.0, 0.0] | |
| 2.17 Participants with local pain | 1 | Risk Ratio (M‐H, Fixed, 95% CI) | 0.0 [0.0, 0.0] | |
| 2.18 Participants with grade 3 local pain | 1 | Risk Ratio (M‐H, Fixed, 95% CI) | 0.0 [0.0, 0.0] | |
| 2.19 Participants with local redness | 1 | Risk Ratio (M‐H, Fixed, 95% CI) | 0.0 [0.0, 0.0] | |
| 2.20 Participants with grade 3 local redness | 1 | Risk Ratio (M‐H, Fixed, 95% CI) | 0.0 [0.0, 0.0] | |
| 2.21 Participants with local swelling | 1 | Risk Ratio (M‐H, Fixed, 95% CI) | 0.0 [0.0, 0.0] | |
| 2.22 Participants with grade 3 local swelling | 1 | Risk Ratio (M‐H, Fixed, 95% CI) | 0.0 [0.0, 0.0] | |
| 2.23 Participants with consent withdrawal | 1 | Risk Ratio (M‐H, Fixed, 95% CI) | 0.0 [0.0, 0.0] | |
| 2.24 Participants with lost follow‐up | 1 | Risk Ratio (M‐H, Fixed, 95% CI) | 0.0 [0.0, 0.0] | |
| 2.25 Participants with serious AE | 1 | Risk Ratio (M‐H, Fixed, 95% CI) | 0.0 [0.0, 0.0] | |
| 3 50 μg gE/AS01B versus 50 μg gE/saline (unadjuvanted gE) Show forest plot | 1 | Risk Ratio (M‐H, Fixed, 95% CI) | Totals not selected | |
| Analysis 8.3  Comparison 8 Adjuvanted recombinant VZV subunit zoster vaccine: lower or higher quantities of adjuvants plus gE subunit VZV versus unadjuvanted gE or saline, Outcome 3 50 μg gE/AS01B versus 50 μg gE/saline (unadjuvanted gE). | ||||
| 3.1 Participants with any symptom | 1 | Risk Ratio (M‐H, Fixed, 95% CI) | 0.0 [0.0, 0.0] | |
| 3.2 Participants with any grade 3 symptom | 1 | Risk Ratio (M‐H, Fixed, 95% CI) | 0.0 [0.0, 0.0] | |
| 3.3 Participants with any general symptom | 1 | Risk Ratio (M‐H, Fixed, 95% CI) | 0.0 [0.0, 0.0] | |
| 3.4 Participants with any grade 3 general symptom | 1 | Risk Ratio (M‐H, Fixed, 95% CI) | 0.0 [0.0, 0.0] | |
| 3.5 Participants with fatigue | 1 | Risk Ratio (M‐H, Fixed, 95% CI) | 0.0 [0.0, 0.0] | |
| 3.6 Participants with grade 3 fatigue | 1 | Risk Ratio (M‐H, Fixed, 95% CI) | 0.0 [0.0, 0.0] | |
| 3.7 Participants with fever | 1 | Risk Ratio (M‐H, Fixed, 95% CI) | 0.0 [0.0, 0.0] | |
| 3.8 Participants with grade 3 fever | 1 | Risk Ratio (M‐H, Fixed, 95% CI) | 0.0 [0.0, 0.0] | |
| 3.9 Participants with gastrointestinal symptom | 1 | Risk Ratio (M‐H, Fixed, 95% CI) | 0.0 [0.0, 0.0] | |
| 3.10 Participants with grade 3 gastrointestinal symptom | 1 | Risk Ratio (M‐H, Fixed, 95% CI) | 0.0 [0.0, 0.0] | |
| 3.11 Participants with headache | 1 | Risk Ratio (M‐H, Fixed, 95% CI) | 0.0 [0.0, 0.0] | |
| 3.12 Participants with grade 3 headache | 1 | Risk Ratio (M‐H, Fixed, 95% CI) | 0.0 [0.0, 0.0] | |
| 3.13 Participants with myalgia | 1 | Risk Ratio (M‐H, Fixed, 95% CI) | 0.0 [0.0, 0.0] | |
| 3.14 Participants with grade 3 myalgia | 1 | Risk Ratio (M‐H, Fixed, 95% CI) | 0.0 [0.0, 0.0] | |
| 3.15 Participants with any local symptom | 1 | Risk Ratio (M‐H, Fixed, 95% CI) | 0.0 [0.0, 0.0] | |
| 3.16 Participants with any grade 3 local symptom | 1 | Risk Ratio (M‐H, Fixed, 95% CI) | 0.0 [0.0, 0.0] | |
| 3.17 Participants with local pain | 1 | Risk Ratio (M‐H, Fixed, 95% CI) | 0.0 [0.0, 0.0] | |
| 3.18 Participants with grade 3 local pain | 1 | Risk Ratio (M‐H, Fixed, 95% CI) | 0.0 [0.0, 0.0] | |
| 3.19 Participants with local redness | 1 | Risk Ratio (M‐H, Fixed, 95% CI) | 0.0 [0.0, 0.0] | |
| 3.20 Participants with grade 3 local redness | 1 | Risk Ratio (M‐H, Fixed, 95% CI) | 0.0 [0.0, 0.0] | |
| 3.21 Participants with local swelling | 1 | Risk Ratio (M‐H, Fixed, 95% CI) | 0.0 [0.0, 0.0] | |
| 3.22 Participants with grade 3 local swelling | 1 | Risk Ratio (M‐H, Fixed, 95% CI) | 0.0 [0.0, 0.0] | |
| 3.23 Participants with consent withdrawal | 1 | Risk Ratio (M‐H, Fixed, 95% CI) | 0.0 [0.0, 0.0] | |
| 3.24 Participants with lost follow‐up | 1 | Risk Ratio (M‐H, Fixed, 95% CI) | 0.0 [0.0, 0.0] | |
| 3.25 Participants with serious AE | 1 | Risk Ratio (M‐H, Fixed, 95% CI) | 0.0 [0.0, 0.0] | |
| 4 50 μg gE/AS01E versus saline Show forest plot | 1 | Risk Ratio (M‐H, Fixed, 95% CI) | Totals not selected | |
| Analysis 8.4 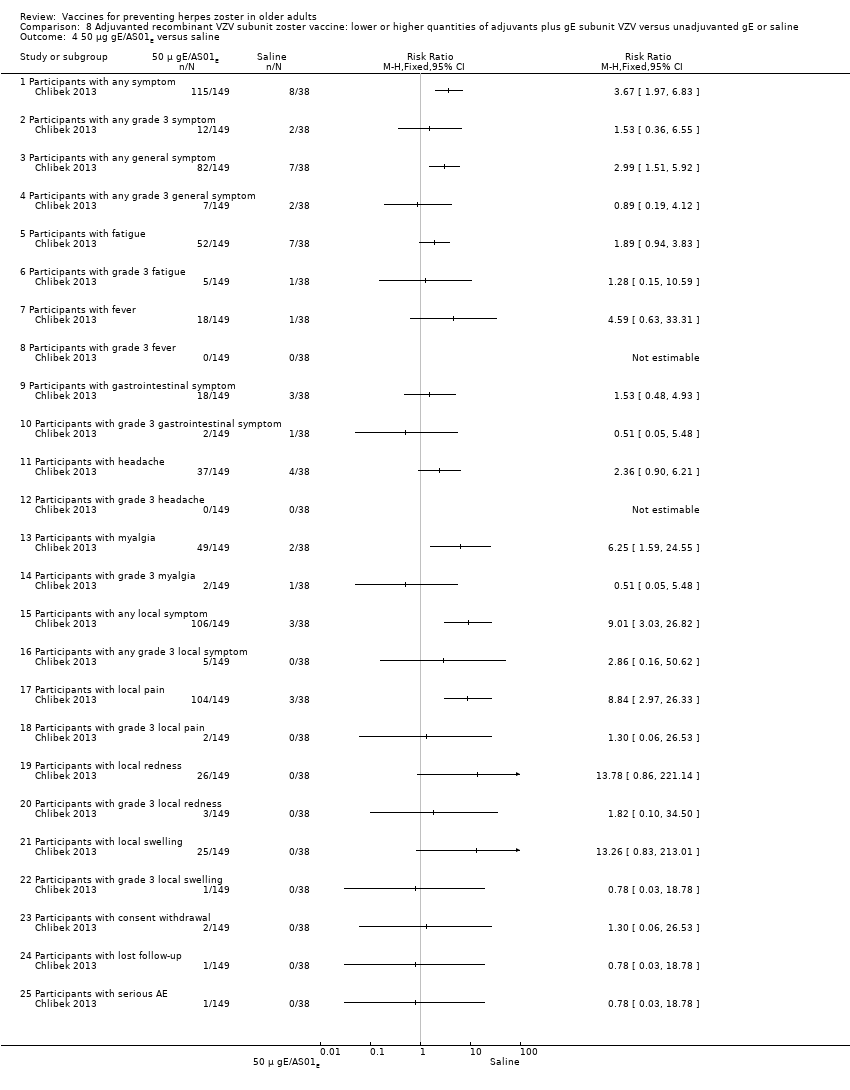 Comparison 8 Adjuvanted recombinant VZV subunit zoster vaccine: lower or higher quantities of adjuvants plus gE subunit VZV versus unadjuvanted gE or saline, Outcome 4 50 μg gE/AS01E versus saline. | ||||
| 4.1 Participants with any symptom | 1 | Risk Ratio (M‐H, Fixed, 95% CI) | 0.0 [0.0, 0.0] | |
| 4.2 Participants with any grade 3 symptom | 1 | Risk Ratio (M‐H, Fixed, 95% CI) | 0.0 [0.0, 0.0] | |
| 4.3 Participants with any general symptom | 1 | Risk Ratio (M‐H, Fixed, 95% CI) | 0.0 [0.0, 0.0] | |
| 4.4 Participants with any grade 3 general symptom | 1 | Risk Ratio (M‐H, Fixed, 95% CI) | 0.0 [0.0, 0.0] | |
| 4.5 Participants with fatigue | 1 | Risk Ratio (M‐H, Fixed, 95% CI) | 0.0 [0.0, 0.0] | |
| 4.6 Participants with grade 3 fatigue | 1 | Risk Ratio (M‐H, Fixed, 95% CI) | 0.0 [0.0, 0.0] | |
| 4.7 Participants with fever | 1 | Risk Ratio (M‐H, Fixed, 95% CI) | 0.0 [0.0, 0.0] | |
| 4.8 Participants with grade 3 fever | 1 | Risk Ratio (M‐H, Fixed, 95% CI) | 0.0 [0.0, 0.0] | |
| 4.9 Participants with gastrointestinal symptom | 1 | Risk Ratio (M‐H, Fixed, 95% CI) | 0.0 [0.0, 0.0] | |
| 4.10 Participants with grade 3 gastrointestinal symptom | 1 | Risk Ratio (M‐H, Fixed, 95% CI) | 0.0 [0.0, 0.0] | |
| 4.11 Participants with headache | 1 | Risk Ratio (M‐H, Fixed, 95% CI) | 0.0 [0.0, 0.0] | |
| 4.12 Participants with grade 3 headache | 1 | Risk Ratio (M‐H, Fixed, 95% CI) | 0.0 [0.0, 0.0] | |
| 4.13 Participants with myalgia | 1 | Risk Ratio (M‐H, Fixed, 95% CI) | 0.0 [0.0, 0.0] | |
| 4.14 Participants with grade 3 myalgia | 1 | Risk Ratio (M‐H, Fixed, 95% CI) | 0.0 [0.0, 0.0] | |
| 4.15 Participants with any local symptom | 1 | Risk Ratio (M‐H, Fixed, 95% CI) | 0.0 [0.0, 0.0] | |
| 4.16 Participants with any grade 3 local symptom | 1 | Risk Ratio (M‐H, Fixed, 95% CI) | 0.0 [0.0, 0.0] | |
| 4.17 Participants with local pain | 1 | Risk Ratio (M‐H, Fixed, 95% CI) | 0.0 [0.0, 0.0] | |
| 4.18 Participants with grade 3 local pain | 1 | Risk Ratio (M‐H, Fixed, 95% CI) | 0.0 [0.0, 0.0] | |
| 4.19 Participants with local redness | 1 | Risk Ratio (M‐H, Fixed, 95% CI) | 0.0 [0.0, 0.0] | |
| 4.20 Participants with grade 3 local redness | 1 | Risk Ratio (M‐H, Fixed, 95% CI) | 0.0 [0.0, 0.0] | |
| 4.21 Participants with local swelling | 1 | Risk Ratio (M‐H, Fixed, 95% CI) | 0.0 [0.0, 0.0] | |
| 4.22 Participants with grade 3 local swelling | 1 | Risk Ratio (M‐H, Fixed, 95% CI) | 0.0 [0.0, 0.0] | |
| 4.23 Participants with consent withdrawal | 1 | Risk Ratio (M‐H, Fixed, 95% CI) | 0.0 [0.0, 0.0] | |
| 4.24 Participants with lost follow‐up | 1 | Risk Ratio (M‐H, Fixed, 95% CI) | 0.0 [0.0, 0.0] | |
| 4.25 Participants with serious AE | 1 | Risk Ratio (M‐H, Fixed, 95% CI) | 0.0 [0.0, 0.0] | |
| 5 50 μg gE/AS01B versus saline Show forest plot | 1 | Risk Ratio (M‐H, Fixed, 95% CI) | Totals not selected | |
| Analysis 8.5  Comparison 8 Adjuvanted recombinant VZV subunit zoster vaccine: lower or higher quantities of adjuvants plus gE subunit VZV versus unadjuvanted gE or saline, Outcome 5 50 μg gE/AS01B versus saline. | ||||
| 5.1 Participants with any symptom | 1 | Risk Ratio (M‐H, Fixed, 95% CI) | 0.0 [0.0, 0.0] | |
| 5.2 Participants with any grade 3 symptom | 1 | Risk Ratio (M‐H, Fixed, 95% CI) | 0.0 [0.0, 0.0] | |
| 5.3 Participants with any general symptom | 1 | Risk Ratio (M‐H, Fixed, 95% CI) | 0.0 [0.0, 0.0] | |
| 5.4 Participants with any grade 3 general symptom | 1 | Risk Ratio (M‐H, Fixed, 95% CI) | 0.0 [0.0, 0.0] | |
| 5.5 Participants with fatigue | 1 | Risk Ratio (M‐H, Fixed, 95% CI) | 0.0 [0.0, 0.0] | |
| 5.6 Participants with grade 3 fatigue | 1 | Risk Ratio (M‐H, Fixed, 95% CI) | 0.0 [0.0, 0.0] | |
| 5.7 Participants with fever | 1 | Risk Ratio (M‐H, Fixed, 95% CI) | 0.0 [0.0, 0.0] | |
| 5.8 Participants with grade 3 fever | 1 | Risk Ratio (M‐H, Fixed, 95% CI) | 0.0 [0.0, 0.0] | |
| 5.9 Participants with gastrointestinal symptom | 1 | Risk Ratio (M‐H, Fixed, 95% CI) | 0.0 [0.0, 0.0] | |
| 5.10 Participants with grade 3 gastrointestinal symptom | 1 | Risk Ratio (M‐H, Fixed, 95% CI) | 0.0 [0.0, 0.0] | |
| 5.11 Participants with headache | 1 | Risk Ratio (M‐H, Fixed, 95% CI) | 0.0 [0.0, 0.0] | |
| 5.12 Participants with grade 3 headache | 1 | Risk Ratio (M‐H, Fixed, 95% CI) | 0.0 [0.0, 0.0] | |
| 5.13 Participants with myalgia | 1 | Risk Ratio (M‐H, Fixed, 95% CI) | 0.0 [0.0, 0.0] | |
| 5.14 Participants with grade 3 myalgia | 1 | Risk Ratio (M‐H, Fixed, 95% CI) | 0.0 [0.0, 0.0] | |
| 5.15 Participants with any local symptom | 1 | Risk Ratio (M‐H, Fixed, 95% CI) | 0.0 [0.0, 0.0] | |
| 5.16 Participants with any grade 3 local symptom | 1 | Risk Ratio (M‐H, Fixed, 95% CI) | 0.0 [0.0, 0.0] | |
| 5.17 Participants with local pain | 1 | Risk Ratio (M‐H, Fixed, 95% CI) | 0.0 [0.0, 0.0] | |
| 5.18 Participants with grade 3 local pain | 1 | Risk Ratio (M‐H, Fixed, 95% CI) | 0.0 [0.0, 0.0] | |
| 5.19 Participants with local redness | 1 | Risk Ratio (M‐H, Fixed, 95% CI) | 0.0 [0.0, 0.0] | |
| 5.20 Participants with grade 3 local redness | 1 | Risk Ratio (M‐H, Fixed, 95% CI) | 0.0 [0.0, 0.0] | |
| 5.21 Participants with local swelling | 1 | Risk Ratio (M‐H, Fixed, 95% CI) | 0.0 [0.0, 0.0] | |
| 5.22 Participants with grade 3 local swelling | 1 | Risk Ratio (M‐H, Fixed, 95% CI) | 0.0 [0.0, 0.0] | |
| 5.23 Participants with consent withdrawal | 1 | Risk Ratio (M‐H, Fixed, 95% CI) | 0.0 [0.0, 0.0] | |
| 5.24 Participants with lost follow‐up | 1 | Risk Ratio (M‐H, Fixed, 95% CI) | 0.0 [0.0, 0.0] | |
| 5.25 Participants with serious AE | 1 | Risk Ratio (M‐H, Fixed, 95% CI) | 0.0 [0.0, 0.0] | |
| 6 50 μg gE/Saline (unadjuvanted) versus saline Show forest plot | 1 | Risk Ratio (M‐H, Fixed, 95% CI) | Totals not selected | |
| Analysis 8.6  Comparison 8 Adjuvanted recombinant VZV subunit zoster vaccine: lower or higher quantities of adjuvants plus gE subunit VZV versus unadjuvanted gE or saline, Outcome 6 50 μg gE/Saline (unadjuvanted) versus saline. | ||||
| 6.1 Participants with any symptom | 1 | Risk Ratio (M‐H, Fixed, 95% CI) | 0.0 [0.0, 0.0] | |
| 6.2 Participants with any grade 3 symptom | 1 | Risk Ratio (M‐H, Fixed, 95% CI) | 0.0 [0.0, 0.0] | |
| 6.3 Participants with any general symptom | 1 | Risk Ratio (M‐H, Fixed, 95% CI) | 0.0 [0.0, 0.0] | |
| 6.4 Participants with any grade 3 general symptom | 1 | Risk Ratio (M‐H, Fixed, 95% CI) | 0.0 [0.0, 0.0] | |
| 6.5 Participants with fatigue | 1 | Risk Ratio (M‐H, Fixed, 95% CI) | 0.0 [0.0, 0.0] | |
| 6.6 Participants with grade 3 fatigue | 1 | Risk Ratio (M‐H, Fixed, 95% CI) | 0.0 [0.0, 0.0] | |
| 6.7 Participants with fever | 1 | Risk Ratio (M‐H, Fixed, 95% CI) | 0.0 [0.0, 0.0] | |
| 6.8 Participants with grade 3 fever | 1 | Risk Ratio (M‐H, Fixed, 95% CI) | 0.0 [0.0, 0.0] | |
| 6.9 Participants with gastrointestinal symptom | 1 | Risk Ratio (M‐H, Fixed, 95% CI) | 0.0 [0.0, 0.0] | |
| 6.10 Participants with grade 3 gastrointestinal symptom | 1 | Risk Ratio (M‐H, Fixed, 95% CI) | 0.0 [0.0, 0.0] | |
| 6.11 Participants with headache | 1 | Risk Ratio (M‐H, Fixed, 95% CI) | 0.0 [0.0, 0.0] | |
| 6.12 Participants with grade 3 headache | 1 | Risk Ratio (M‐H, Fixed, 95% CI) | 0.0 [0.0, 0.0] | |
| 6.13 Participants with myalgia | 1 | Risk Ratio (M‐H, Fixed, 95% CI) | 0.0 [0.0, 0.0] | |
| 6.14 Participants with grade 3 myalgia | 1 | Risk Ratio (M‐H, Fixed, 95% CI) | 0.0 [0.0, 0.0] | |
| 6.15 Participants with any local symptom | 1 | Risk Ratio (M‐H, Fixed, 95% CI) | 0.0 [0.0, 0.0] | |
| 6.16 Participants with any grade 3 local symptom | 1 | Risk Ratio (M‐H, Fixed, 95% CI) | 0.0 [0.0, 0.0] | |
| 6.17 Participants with local pain | 1 | Risk Ratio (M‐H, Fixed, 95% CI) | 0.0 [0.0, 0.0] | |
| 6.18 Participants with grade 3 local pain | 1 | Risk Ratio (M‐H, Fixed, 95% CI) | 0.0 [0.0, 0.0] | |
| 6.19 Participants with local redness | 1 | Risk Ratio (M‐H, Fixed, 95% CI) | 0.0 [0.0, 0.0] | |
| 6.20 Participants with grade 3 local redness | 1 | Risk Ratio (M‐H, Fixed, 95% CI) | 0.0 [0.0, 0.0] | |
| 6.21 Participants with local swelling | 1 | Risk Ratio (M‐H, Fixed, 95% CI) | 0.0 [0.0, 0.0] | |
| 6.22 Participants with grade 3 local swelling | 1 | Risk Ratio (M‐H, Fixed, 95% CI) | 0.0 [0.0, 0.0] | |
| 6.23 Participants with consent withdrawal | 1 | Risk Ratio (M‐H, Fixed, 95% CI) | 0.0 [0.0, 0.0] | |
| 6.24 Participants with lost follow‐up | 1 | Risk Ratio (M‐H, Fixed, 95% CI) | 0.0 [0.0, 0.0] | |
| 6.25 Participants with serious AE | 1 | Risk Ratio (M‐H, Fixed, 95% CI) | 0.0 [0.0, 0.0] | |
| Outcome or subgroup title | No. of studies | No. of participants | Statistical method | Effect size |
| 1 25 µg gE/AS01B versus 50 µg gE/AS01B Show forest plot | 1 | Risk Ratio (M‐H, Fixed, 95% CI) | Totals not selected | |
| Analysis 9.1 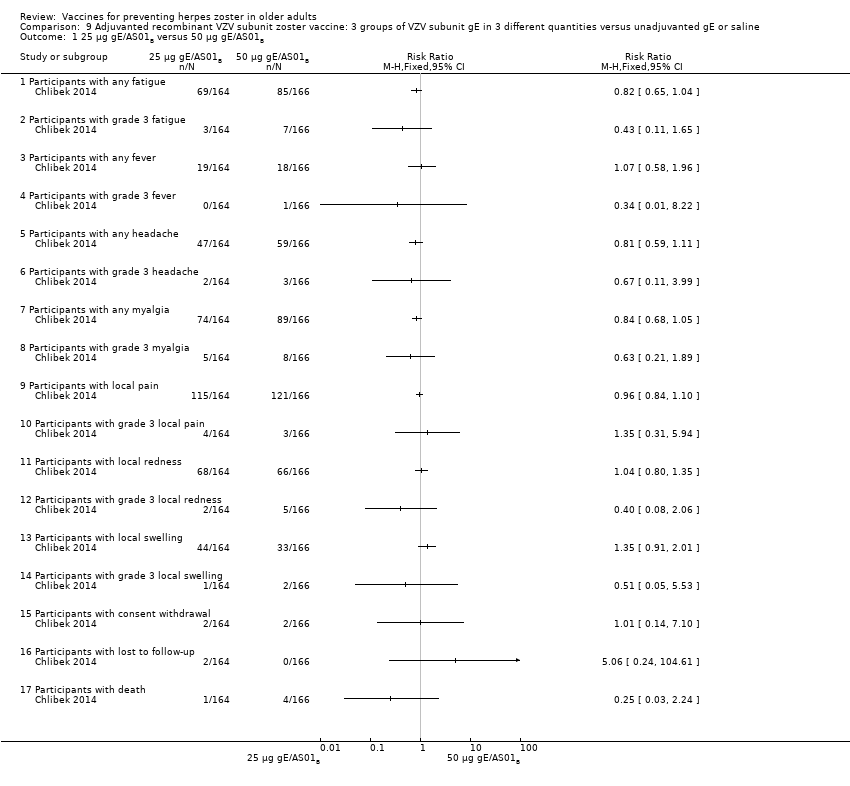 Comparison 9 Adjuvanted recombinant VZV subunit zoster vaccine: 3 groups of VZV subunit gE in 3 different quantities versus unadjuvanted gE or saline, Outcome 1 25 µg gE/AS01B versus 50 µg gE/AS01B. | ||||
| 1.1 Participants with any fatigue | 1 | Risk Ratio (M‐H, Fixed, 95% CI) | 0.0 [0.0, 0.0] | |
| 1.2 Participants with grade 3 fatigue | 1 | Risk Ratio (M‐H, Fixed, 95% CI) | 0.0 [0.0, 0.0] | |
| 1.3 Participants with any fever | 1 | Risk Ratio (M‐H, Fixed, 95% CI) | 0.0 [0.0, 0.0] | |
| 1.4 Participants with grade 3 fever | 1 | Risk Ratio (M‐H, Fixed, 95% CI) | 0.0 [0.0, 0.0] | |
| 1.5 Participants with any headache | 1 | Risk Ratio (M‐H, Fixed, 95% CI) | 0.0 [0.0, 0.0] | |
| 1.6 Participants with grade 3 headache | 1 | Risk Ratio (M‐H, Fixed, 95% CI) | 0.0 [0.0, 0.0] | |
| 1.7 Participants with any myalgia | 1 | Risk Ratio (M‐H, Fixed, 95% CI) | 0.0 [0.0, 0.0] | |
| 1.8 Participants with grade 3 myalgia | 1 | Risk Ratio (M‐H, Fixed, 95% CI) | 0.0 [0.0, 0.0] | |
| 1.9 Participants with local pain | 1 | Risk Ratio (M‐H, Fixed, 95% CI) | 0.0 [0.0, 0.0] | |
| 1.10 Participants with grade 3 local pain | 1 | Risk Ratio (M‐H, Fixed, 95% CI) | 0.0 [0.0, 0.0] | |
| 1.11 Participants with local redness | 1 | Risk Ratio (M‐H, Fixed, 95% CI) | 0.0 [0.0, 0.0] | |
| 1.12 Participants with grade 3 local redness | 1 | Risk Ratio (M‐H, Fixed, 95% CI) | 0.0 [0.0, 0.0] | |
| 1.13 Participants with local swelling | 1 | Risk Ratio (M‐H, Fixed, 95% CI) | 0.0 [0.0, 0.0] | |
| 1.14 Participants with grade 3 local swelling | 1 | Risk Ratio (M‐H, Fixed, 95% CI) | 0.0 [0.0, 0.0] | |
| 1.15 Participants with consent withdrawal | 1 | Risk Ratio (M‐H, Fixed, 95% CI) | 0.0 [0.0, 0.0] | |
| 1.16 Participants with lost to follow‐up | 1 | Risk Ratio (M‐H, Fixed, 95% CI) | 0.0 [0.0, 0.0] | |
| 1.17 Participants with death | 1 | Risk Ratio (M‐H, Fixed, 95% CI) | 0.0 [0.0, 0.0] | |
| 2 25 µg gE/AS01B versus 100 µg gE/AS01B Show forest plot | 1 | Risk Ratio (M‐H, Fixed, 95% CI) | Totals not selected | |
| Analysis 9.2  Comparison 9 Adjuvanted recombinant VZV subunit zoster vaccine: 3 groups of VZV subunit gE in 3 different quantities versus unadjuvanted gE or saline, Outcome 2 25 µg gE/AS01B versus 100 µg gE/AS01B. | ||||
| 2.1 Participants with any fatigue | 1 | Risk Ratio (M‐H, Fixed, 95% CI) | 0.0 [0.0, 0.0] | |
| 2.2 Participants with grade 3 fatigue | 1 | Risk Ratio (M‐H, Fixed, 95% CI) | 0.0 [0.0, 0.0] | |
| 2.3 Participants with any fever | 1 | Risk Ratio (M‐H, Fixed, 95% CI) | 0.0 [0.0, 0.0] | |
| 2.4 Participants with grade 3 fever | 1 | Risk Ratio (M‐H, Fixed, 95% CI) | 0.0 [0.0, 0.0] | |
| 2.5 Participants with any headache | 1 | Risk Ratio (M‐H, Fixed, 95% CI) | 0.0 [0.0, 0.0] | |
| 2.6 Participants with grade 3 headache | 1 | Risk Ratio (M‐H, Fixed, 95% CI) | 0.0 [0.0, 0.0] | |
| 2.7 Participants with any myalgia | 1 | Risk Ratio (M‐H, Fixed, 95% CI) | 0.0 [0.0, 0.0] | |
| 2.8 Participants with grade 3 myalgia | 1 | Risk Ratio (M‐H, Fixed, 95% CI) | 0.0 [0.0, 0.0] | |
| 2.9 Participants with local pain | 1 | Risk Ratio (M‐H, Fixed, 95% CI) | 0.0 [0.0, 0.0] | |
| 2.10 Participants with grade 3 local pain | 1 | Risk Ratio (M‐H, Fixed, 95% CI) | 0.0 [0.0, 0.0] | |
| 2.11 Participants with local redness | 1 | Risk Ratio (M‐H, Fixed, 95% CI) | 0.0 [0.0, 0.0] | |
| 2.12 Participants with grade 3 local redness | 1 | Risk Ratio (M‐H, Fixed, 95% CI) | 0.0 [0.0, 0.0] | |
| 2.13 Participants with local swelling | 1 | Risk Ratio (M‐H, Fixed, 95% CI) | 0.0 [0.0, 0.0] | |
| 2.14 Participants with grade 3 local swelling | 1 | Risk Ratio (M‐H, Fixed, 95% CI) | 0.0 [0.0, 0.0] | |
| 2.15 Participants with consent withdrawal | 1 | Risk Ratio (M‐H, Fixed, 95% CI) | 0.0 [0.0, 0.0] | |
| 2.16 Participants with lost to follow‐up | 1 | Risk Ratio (M‐H, Fixed, 95% CI) | 0.0 [0.0, 0.0] | |
| 2.17 Participants with death | 1 | Risk Ratio (M‐H, Fixed, 95% CI) | 0.0 [0.0, 0.0] | |
| 3 50 µg gE/AS01B versus 100 µg gE/AS01B Show forest plot | 1 | Risk Ratio (M‐H, Fixed, 95% CI) | Totals not selected | |
| Analysis 9.3  Comparison 9 Adjuvanted recombinant VZV subunit zoster vaccine: 3 groups of VZV subunit gE in 3 different quantities versus unadjuvanted gE or saline, Outcome 3 50 µg gE/AS01B versus 100 µg gE/AS01B. | ||||
| 3.1 Participants with any fatigue | 1 | Risk Ratio (M‐H, Fixed, 95% CI) | 0.0 [0.0, 0.0] | |
| 3.2 Participants with grade 3 fatigue | 1 | Risk Ratio (M‐H, Fixed, 95% CI) | 0.0 [0.0, 0.0] | |
| 3.3 Participants with any fever | 1 | Risk Ratio (M‐H, Fixed, 95% CI) | 0.0 [0.0, 0.0] | |
| 3.4 Participants with grade 3 fever | 1 | Risk Ratio (M‐H, Fixed, 95% CI) | 0.0 [0.0, 0.0] | |
| 3.5 Participants with any headache | 1 | Risk Ratio (M‐H, Fixed, 95% CI) | 0.0 [0.0, 0.0] | |
| 3.6 Participants with grade 3 headache | 1 | Risk Ratio (M‐H, Fixed, 95% CI) | 0.0 [0.0, 0.0] | |
| 3.7 Participants with any myalgia | 1 | Risk Ratio (M‐H, Fixed, 95% CI) | 0.0 [0.0, 0.0] | |
| 3.8 Participants with grade 3 myalgia | 1 | Risk Ratio (M‐H, Fixed, 95% CI) | 0.0 [0.0, 0.0] | |
| 3.9 Participants with local swelling | 1 | Risk Ratio (M‐H, Fixed, 95% CI) | 0.0 [0.0, 0.0] | |
| 3.10 Participants with grade 3 local pain | 1 | Risk Ratio (M‐H, Fixed, 95% CI) | 0.0 [0.0, 0.0] | |
| 3.11 Participants with local redness | 1 | Risk Ratio (M‐H, Fixed, 95% CI) | 0.0 [0.0, 0.0] | |
| 3.12 Participants with grade 3 local redness | 1 | Risk Ratio (M‐H, Fixed, 95% CI) | 0.0 [0.0, 0.0] | |
| 3.13 Participants with local pain | 1 | Risk Ratio (M‐H, Fixed, 95% CI) | 0.0 [0.0, 0.0] | |
| 3.14 Participants with grade 3 local swelling | 1 | Risk Ratio (M‐H, Fixed, 95% CI) | 0.0 [0.0, 0.0] | |
| 3.15 Participants with consent withdrawal | 1 | Risk Ratio (M‐H, Fixed, 95% CI) | 0.0 [0.0, 0.0] | |
| 3.16 Participants with lost to follow‐up | 1 | Risk Ratio (M‐H, Fixed, 95% CI) | 0.0 [0.0, 0.0] | |
| 3.17 Participants with death | 1 | Risk Ratio (M‐H, Fixed, 95% CI) | 0.0 [0.0, 0.0] | |
| 4 25 µg gE/AS01B versus 100 µg gE/saline (unadjuvanted gE) Show forest plot | 1 | Risk Ratio (M‐H, Fixed, 95% CI) | Totals not selected | |
| Analysis 9.4  Comparison 9 Adjuvanted recombinant VZV subunit zoster vaccine: 3 groups of VZV subunit gE in 3 different quantities versus unadjuvanted gE or saline, Outcome 4 25 µg gE/AS01B versus 100 µg gE/saline (unadjuvanted gE). | ||||
| 4.1 Participants with any fatigue | 1 | Risk Ratio (M‐H, Fixed, 95% CI) | 0.0 [0.0, 0.0] | |
| 4.2 Participants with grade 3 fatigue | 1 | Risk Ratio (M‐H, Fixed, 95% CI) | 0.0 [0.0, 0.0] | |
| 4.3 Participants with any fever | 1 | Risk Ratio (M‐H, Fixed, 95% CI) | 0.0 [0.0, 0.0] | |
| 4.4 Participants with grade 3 fever | 1 | Risk Ratio (M‐H, Fixed, 95% CI) | 0.0 [0.0, 0.0] | |
| 4.5 Participants with any headache | 1 | Risk Ratio (M‐H, Fixed, 95% CI) | 0.0 [0.0, 0.0] | |
| 4.6 Participants with grade 3 headache | 1 | Risk Ratio (M‐H, Fixed, 95% CI) | 0.0 [0.0, 0.0] | |
| 4.7 Participants with any myalgia | 1 | Risk Ratio (M‐H, Fixed, 95% CI) | 0.0 [0.0, 0.0] | |
| 4.8 Participants with grade 3 myalgia | 1 | Risk Ratio (M‐H, Fixed, 95% CI) | 0.0 [0.0, 0.0] | |
| 4.9 Participants with local pain | 1 | Risk Ratio (M‐H, Fixed, 95% CI) | 0.0 [0.0, 0.0] | |
| 4.10 Participants with grade 3 local pain | 1 | Risk Ratio (M‐H, Fixed, 95% CI) | 0.0 [0.0, 0.0] | |
| 4.11 Participants with local redness | 1 | Risk Ratio (M‐H, Fixed, 95% CI) | 0.0 [0.0, 0.0] | |
| 4.12 Participants with grade 3 local redness | 1 | Risk Ratio (M‐H, Fixed, 95% CI) | 0.0 [0.0, 0.0] | |
| 4.13 Participants with local swelling | 1 | Risk Ratio (M‐H, Fixed, 95% CI) | 0.0 [0.0, 0.0] | |
| 4.14 Participants with grade 3 local swelling | 1 | Risk Ratio (M‐H, Fixed, 95% CI) | 0.0 [0.0, 0.0] | |
| 4.15 Participants with consent withdrawal | 1 | Risk Ratio (M‐H, Fixed, 95% CI) | 0.0 [0.0, 0.0] | |
| 4.16 Participants with lost to follow‐up | 1 | Risk Ratio (M‐H, Fixed, 95% CI) | 0.0 [0.0, 0.0] | |
| 4.17 Participants with death | 1 | Risk Ratio (M‐H, Fixed, 95% CI) | 0.0 [0.0, 0.0] | |
| 5 50 µg gE/AS01B a versus 100 µg gE/saline (unadjuvanted gE) Show forest plot | 1 | Risk Ratio (M‐H, Fixed, 95% CI) | Totals not selected | |
| Analysis 9.5  Comparison 9 Adjuvanted recombinant VZV subunit zoster vaccine: 3 groups of VZV subunit gE in 3 different quantities versus unadjuvanted gE or saline, Outcome 5 50 µg gE/AS01B a versus 100 µg gE/saline (unadjuvanted gE). | ||||
| 5.1 Participants with any fatigue | 1 | Risk Ratio (M‐H, Fixed, 95% CI) | 0.0 [0.0, 0.0] | |
| 5.2 Participants with grade 3 fatigue | 1 | Risk Ratio (M‐H, Fixed, 95% CI) | 0.0 [0.0, 0.0] | |
| 5.3 Participants with any fever | 1 | Risk Ratio (M‐H, Fixed, 95% CI) | 0.0 [0.0, 0.0] | |
| 5.4 Participants with grade 3 fever | 1 | Risk Ratio (M‐H, Fixed, 95% CI) | 0.0 [0.0, 0.0] | |
| 5.5 Participants with any headache | 1 | Risk Ratio (M‐H, Fixed, 95% CI) | 0.0 [0.0, 0.0] | |
| 5.6 Participants with grade 3 headache | 1 | Risk Ratio (M‐H, Fixed, 95% CI) | 0.0 [0.0, 0.0] | |
| 5.7 Participants with any myalgia | 1 | Risk Ratio (M‐H, Fixed, 95% CI) | 0.0 [0.0, 0.0] | |
| 5.8 Participants with grade 3 myalgia | 1 | Risk Ratio (M‐H, Fixed, 95% CI) | 0.0 [0.0, 0.0] | |
| 5.9 Participants with local pain | 1 | Risk Ratio (M‐H, Fixed, 95% CI) | 0.0 [0.0, 0.0] | |
| 5.10 Participants with grade 3 local pain | 1 | Risk Ratio (M‐H, Fixed, 95% CI) | 0.0 [0.0, 0.0] | |
| 5.11 Participants with local redness | 1 | Risk Ratio (M‐H, Fixed, 95% CI) | 0.0 [0.0, 0.0] | |
| 5.12 Participants with grade 3 local redness | 1 | Risk Ratio (M‐H, Fixed, 95% CI) | 0.0 [0.0, 0.0] | |
| 5.13 Participants with local swelling | 1 | Risk Ratio (M‐H, Fixed, 95% CI) | 0.0 [0.0, 0.0] | |
| 5.14 Participants with grade 3 local swelling | 1 | Risk Ratio (M‐H, Fixed, 95% CI) | 0.0 [0.0, 0.0] | |
| 5.15 Participants with consent withdrawal | 1 | Risk Ratio (M‐H, Fixed, 95% CI) | 0.0 [0.0, 0.0] | |
| 5.16 Participants with lost to follow‐up | 1 | Risk Ratio (M‐H, Fixed, 95% CI) | 0.0 [0.0, 0.0] | |
| 5.17 Participants with death | 1 | Risk Ratio (M‐H, Fixed, 95% CI) | 0.0 [0.0, 0.0] | |
| 6 100 µg gE/AS01B versus 100 µg gE/saline (unadjuvanted gE) Show forest plot | 1 | Risk Ratio (M‐H, Fixed, 95% CI) | Totals not selected | |
| Analysis 9.6  Comparison 9 Adjuvanted recombinant VZV subunit zoster vaccine: 3 groups of VZV subunit gE in 3 different quantities versus unadjuvanted gE or saline, Outcome 6 100 µg gE/AS01B versus 100 µg gE/saline (unadjuvanted gE). | ||||
| 6.1 Participants with any fatigue | 1 | Risk Ratio (M‐H, Fixed, 95% CI) | 0.0 [0.0, 0.0] | |
| 6.2 Participants with grade 3 fatigue | 1 | Risk Ratio (M‐H, Fixed, 95% CI) | 0.0 [0.0, 0.0] | |
| 6.3 Participants with any fever | 1 | Risk Ratio (M‐H, Fixed, 95% CI) | 0.0 [0.0, 0.0] | |
| 6.4 Participants with grade 3 fever | 1 | Risk Ratio (M‐H, Fixed, 95% CI) | 0.0 [0.0, 0.0] | |
| 6.5 Participants with any headache | 1 | Risk Ratio (M‐H, Fixed, 95% CI) | 0.0 [0.0, 0.0] | |
| 6.6 Participants with grade 3 headache | 1 | Risk Ratio (M‐H, Fixed, 95% CI) | 0.0 [0.0, 0.0] | |
| 6.7 Participants with any myalgia | 1 | Risk Ratio (M‐H, Fixed, 95% CI) | 0.0 [0.0, 0.0] | |
| 6.8 Participants with grade 3 myalgia | 1 | Risk Ratio (M‐H, Fixed, 95% CI) | 0.0 [0.0, 0.0] | |
| 6.9 Participants with local pain | 1 | Risk Ratio (M‐H, Fixed, 95% CI) | 0.0 [0.0, 0.0] | |
| 6.10 Participants with grade 3 local pain | 1 | Risk Ratio (M‐H, Fixed, 95% CI) | 0.0 [0.0, 0.0] | |
| 6.11 Participants with local redness | 1 | Risk Ratio (M‐H, Fixed, 95% CI) | 0.0 [0.0, 0.0] | |
| 6.12 Participants with grade 3 local redness | 1 | Risk Ratio (M‐H, Fixed, 95% CI) | 0.0 [0.0, 0.0] | |
| 6.13 Participants with local swelling | 1 | Risk Ratio (M‐H, Fixed, 95% CI) | 0.0 [0.0, 0.0] | |
| 6.14 Participants with grade 3 local swelling | 1 | Risk Ratio (M‐H, Fixed, 95% CI) | 0.0 [0.0, 0.0] | |
| 6.15 Participants with consent withdrawal | 1 | Risk Ratio (M‐H, Fixed, 95% CI) | 0.0 [0.0, 0.0] | |
| 6.16 Participants with lost to follow‐up | 1 | Risk Ratio (M‐H, Fixed, 95% CI) | 0.0 [0.0, 0.0] | |
| 6.17 Participants with death | 1 | Risk Ratio (M‐H, Fixed, 95% CI) | 0.0 [0.0, 0.0] | |
| 7 25 µg gE/AS01B versus saline + 100 µg gE/AS01B Show forest plot | 1 | Risk Ratio (M‐H, Fixed, 95% CI) | Totals not selected | |
| Analysis 9.7 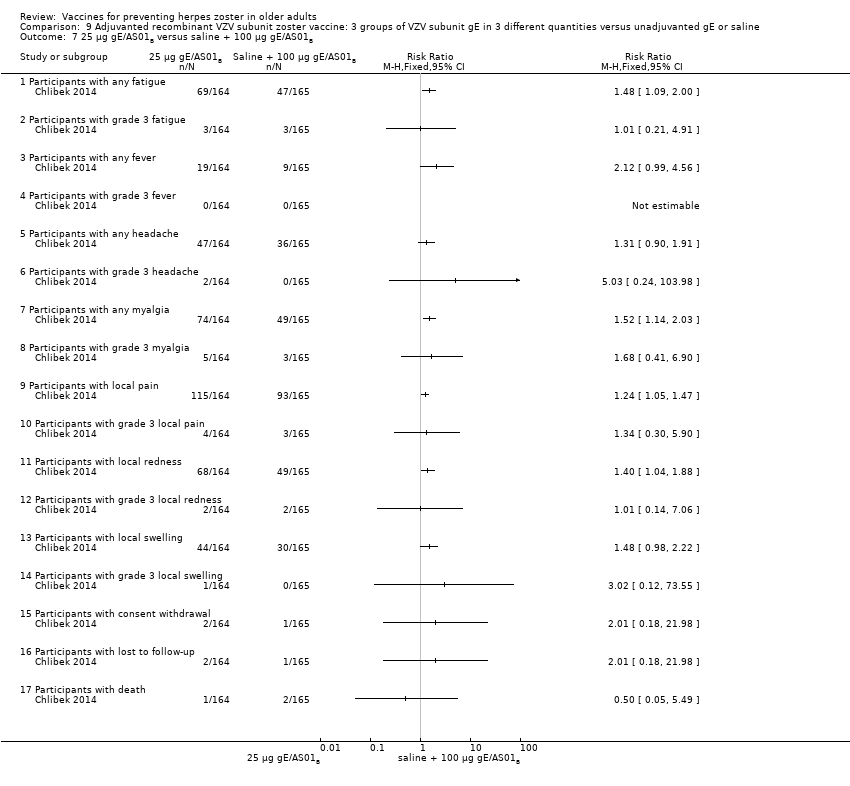 Comparison 9 Adjuvanted recombinant VZV subunit zoster vaccine: 3 groups of VZV subunit gE in 3 different quantities versus unadjuvanted gE or saline, Outcome 7 25 µg gE/AS01B versus saline + 100 µg gE/AS01B. | ||||
| 7.1 Participants with any fatigue | 1 | Risk Ratio (M‐H, Fixed, 95% CI) | 0.0 [0.0, 0.0] | |
| 7.2 Participants with grade 3 fatigue | 1 | Risk Ratio (M‐H, Fixed, 95% CI) | 0.0 [0.0, 0.0] | |
| 7.3 Participants with any fever | 1 | Risk Ratio (M‐H, Fixed, 95% CI) | 0.0 [0.0, 0.0] | |
| 7.4 Participants with grade 3 fever | 1 | Risk Ratio (M‐H, Fixed, 95% CI) | 0.0 [0.0, 0.0] | |
| 7.5 Participants with any headache | 1 | Risk Ratio (M‐H, Fixed, 95% CI) | 0.0 [0.0, 0.0] | |
| 7.6 Participants with grade 3 headache | 1 | Risk Ratio (M‐H, Fixed, 95% CI) | 0.0 [0.0, 0.0] | |
| 7.7 Participants with any myalgia | 1 | Risk Ratio (M‐H, Fixed, 95% CI) | 0.0 [0.0, 0.0] | |
| 7.8 Participants with grade 3 myalgia | 1 | Risk Ratio (M‐H, Fixed, 95% CI) | 0.0 [0.0, 0.0] | |
| 7.9 Participants with local pain | 1 | Risk Ratio (M‐H, Fixed, 95% CI) | 0.0 [0.0, 0.0] | |
| 7.10 Participants with grade 3 local pain | 1 | Risk Ratio (M‐H, Fixed, 95% CI) | 0.0 [0.0, 0.0] | |
| 7.11 Participants with local redness | 1 | Risk Ratio (M‐H, Fixed, 95% CI) | 0.0 [0.0, 0.0] | |
| 7.12 Participants with grade 3 local redness | 1 | Risk Ratio (M‐H, Fixed, 95% CI) | 0.0 [0.0, 0.0] | |
| 7.13 Participants with local swelling | 1 | Risk Ratio (M‐H, Fixed, 95% CI) | 0.0 [0.0, 0.0] | |
| 7.14 Participants with grade 3 local swelling | 1 | Risk Ratio (M‐H, Fixed, 95% CI) | 0.0 [0.0, 0.0] | |
| 7.15 Participants with consent withdrawal | 1 | Risk Ratio (M‐H, Fixed, 95% CI) | 0.0 [0.0, 0.0] | |
| 7.16 Participants with lost to follow‐up | 1 | Risk Ratio (M‐H, Fixed, 95% CI) | 0.0 [0.0, 0.0] | |
| 7.17 Participants with death | 1 | Risk Ratio (M‐H, Fixed, 95% CI) | 0.0 [0.0, 0.0] | |
| 8 50 µg gE/AS01B versus saline + 100 µg gE/AS01B Show forest plot | 1 | Risk Ratio (M‐H, Fixed, 95% CI) | Totals not selected | |
| Analysis 9.8  Comparison 9 Adjuvanted recombinant VZV subunit zoster vaccine: 3 groups of VZV subunit gE in 3 different quantities versus unadjuvanted gE or saline, Outcome 8 50 µg gE/AS01B versus saline + 100 µg gE/AS01B. | ||||
| 8.1 Participants with any fatigue | 1 | Risk Ratio (M‐H, Fixed, 95% CI) | 0.0 [0.0, 0.0] | |
| 8.2 Participants with grade 3 fatigue | 1 | Risk Ratio (M‐H, Fixed, 95% CI) | 0.0 [0.0, 0.0] | |
| 8.3 Participants with any fever | 1 | Risk Ratio (M‐H, Fixed, 95% CI) | 0.0 [0.0, 0.0] | |
| 8.4 Participants with grade 3 fever | 1 | Risk Ratio (M‐H, Fixed, 95% CI) | 0.0 [0.0, 0.0] | |
| 8.5 Participants with any headache | 1 | Risk Ratio (M‐H, Fixed, 95% CI) | 0.0 [0.0, 0.0] | |
| 8.6 Participants with grade 3 headache | 1 | Risk Ratio (M‐H, Fixed, 95% CI) | 0.0 [0.0, 0.0] | |
| 8.7 Participants with any myalgia | 1 | Risk Ratio (M‐H, Fixed, 95% CI) | 0.0 [0.0, 0.0] | |
| 8.8 Participants with grade 3 myalgia | 1 | Risk Ratio (M‐H, Fixed, 95% CI) | 0.0 [0.0, 0.0] | |
| 8.9 Participants with local pain | 1 | Risk Ratio (M‐H, Fixed, 95% CI) | 0.0 [0.0, 0.0] | |
| 8.10 Participants with grade 3 local pain | 1 | Risk Ratio (M‐H, Fixed, 95% CI) | 0.0 [0.0, 0.0] | |
| 8.11 Participants with local redness | 1 | Risk Ratio (M‐H, Fixed, 95% CI) | 0.0 [0.0, 0.0] | |
| 8.12 Participants with grade 3 local redness | 1 | Risk Ratio (M‐H, Fixed, 95% CI) | 0.0 [0.0, 0.0] | |
| 8.13 Participants with local swelling | 1 | Risk Ratio (M‐H, Fixed, 95% CI) | 0.0 [0.0, 0.0] | |
| 8.14 Participants with grade 3 local swelling | 1 | Risk Ratio (M‐H, Fixed, 95% CI) | 0.0 [0.0, 0.0] | |
| 8.15 Participants with consent withdrawal | 1 | Risk Ratio (M‐H, Fixed, 95% CI) | 0.0 [0.0, 0.0] | |
| 8.16 Participants with lost to follow‐up | 1 | Risk Ratio (M‐H, Fixed, 95% CI) | 0.0 [0.0, 0.0] | |
| 8.17 Participants with death | 1 | Risk Ratio (M‐H, Fixed, 95% CI) | 0.0 [0.0, 0.0] | |
| 9 100 µg gE/AS01B versus saline + 100 µg gE/AS01B Show forest plot | 1 | Odds Ratio (M‐H, Fixed, 95% CI) | Totals not selected | |
| Analysis 9.9 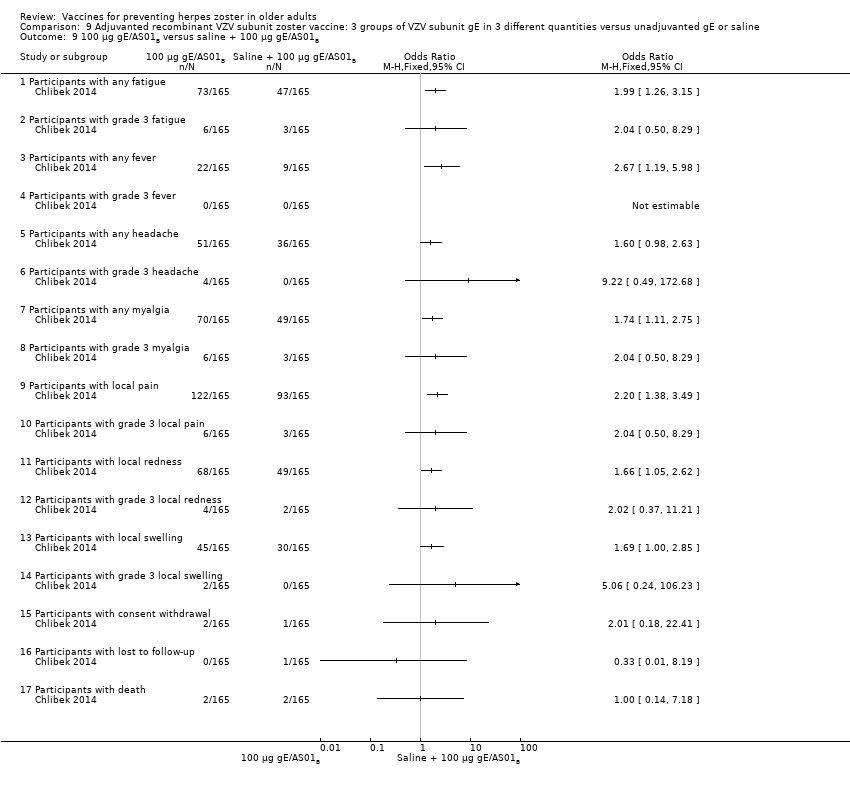 Comparison 9 Adjuvanted recombinant VZV subunit zoster vaccine: 3 groups of VZV subunit gE in 3 different quantities versus unadjuvanted gE or saline, Outcome 9 100 µg gE/AS01B versus saline + 100 µg gE/AS01B. | ||||
| 9.1 Participants with any fatigue | 1 | Odds Ratio (M‐H, Fixed, 95% CI) | 0.0 [0.0, 0.0] | |
| 9.2 Participants with grade 3 fatigue | 1 | Odds Ratio (M‐H, Fixed, 95% CI) | 0.0 [0.0, 0.0] | |
| 9.3 Participants with any fever | 1 | Odds Ratio (M‐H, Fixed, 95% CI) | 0.0 [0.0, 0.0] | |
| 9.4 Participants with grade 3 fever | 1 | Odds Ratio (M‐H, Fixed, 95% CI) | 0.0 [0.0, 0.0] | |
| 9.5 Participants with any headache | 1 | Odds Ratio (M‐H, Fixed, 95% CI) | 0.0 [0.0, 0.0] | |
| 9.6 Participants with grade 3 headache | 1 | Odds Ratio (M‐H, Fixed, 95% CI) | 0.0 [0.0, 0.0] | |
| 9.7 Participants with any myalgia | 1 | Odds Ratio (M‐H, Fixed, 95% CI) | 0.0 [0.0, 0.0] | |
| 9.8 Participants with grade 3 myalgia | 1 | Odds Ratio (M‐H, Fixed, 95% CI) | 0.0 [0.0, 0.0] | |
| 9.9 Participants with local pain | 1 | Odds Ratio (M‐H, Fixed, 95% CI) | 0.0 [0.0, 0.0] | |
| 9.10 Participants with grade 3 local pain | 1 | Odds Ratio (M‐H, Fixed, 95% CI) | 0.0 [0.0, 0.0] | |
| 9.11 Participants with local redness | 1 | Odds Ratio (M‐H, Fixed, 95% CI) | 0.0 [0.0, 0.0] | |
| 9.12 Participants with grade 3 local redness | 1 | Odds Ratio (M‐H, Fixed, 95% CI) | 0.0 [0.0, 0.0] | |
| 9.13 Participants with local swelling | 1 | Odds Ratio (M‐H, Fixed, 95% CI) | 0.0 [0.0, 0.0] | |
| 9.14 Participants with grade 3 local swelling | 1 | Odds Ratio (M‐H, Fixed, 95% CI) | 0.0 [0.0, 0.0] | |
| 9.15 Participants with consent withdrawal | 1 | Odds Ratio (M‐H, Fixed, 95% CI) | 0.0 [0.0, 0.0] | |
| 9.16 Participants with lost to follow‐up | 1 | Odds Ratio (M‐H, Fixed, 95% CI) | 0.0 [0.0, 0.0] | |
| 9.17 Participants with death | 1 | Odds Ratio (M‐H, Fixed, 95% CI) | 0.0 [0.0, 0.0] | |
| 10 Saline + 100 µg gE/AS01B versus 100 µg gE/saline (unadjuvanted gE) Show forest plot | 1 | Risk Ratio (M‐H, Fixed, 95% CI) | Totals not selected | |
| Analysis 9.10  Comparison 9 Adjuvanted recombinant VZV subunit zoster vaccine: 3 groups of VZV subunit gE in 3 different quantities versus unadjuvanted gE or saline, Outcome 10 Saline + 100 µg gE/AS01B versus 100 µg gE/saline (unadjuvanted gE). | ||||
| 10.1 Participants with any fatigue | 1 | Risk Ratio (M‐H, Fixed, 95% CI) | 0.0 [0.0, 0.0] | |
| 10.2 Participants with grade 3 fatigue | 1 | Risk Ratio (M‐H, Fixed, 95% CI) | 0.0 [0.0, 0.0] | |
| 10.3 Participants with any fever | 1 | Risk Ratio (M‐H, Fixed, 95% CI) | 0.0 [0.0, 0.0] | |
| 10.4 Participants with grade 3 fever | 1 | Risk Ratio (M‐H, Fixed, 95% CI) | 0.0 [0.0, 0.0] | |
| 10.5 Participants with any headache | 1 | Risk Ratio (M‐H, Fixed, 95% CI) | 0.0 [0.0, 0.0] | |
| 10.6 Participants with grade 3 headache | 1 | Risk Ratio (M‐H, Fixed, 95% CI) | 0.0 [0.0, 0.0] | |
| 10.7 Participants with any myalgia | 1 | Risk Ratio (M‐H, Fixed, 95% CI) | 0.0 [0.0, 0.0] | |
| 10.8 Participants with grade 3 myalgia | 1 | Risk Ratio (M‐H, Fixed, 95% CI) | 0.0 [0.0, 0.0] | |
| 10.9 Participants with local pain | 1 | Risk Ratio (M‐H, Fixed, 95% CI) | 0.0 [0.0, 0.0] | |
| 10.10 Participants with grade 3 local pain | 1 | Risk Ratio (M‐H, Fixed, 95% CI) | 0.0 [0.0, 0.0] | |
| 10.11 Participants with local redness | 1 | Risk Ratio (M‐H, Fixed, 95% CI) | 0.0 [0.0, 0.0] | |
| 10.12 Participants with grade 3 local redness | 1 | Risk Ratio (M‐H, Fixed, 95% CI) | 0.0 [0.0, 0.0] | |
| 10.13 Participants with local swelling | 1 | Risk Ratio (M‐H, Fixed, 95% CI) | 0.0 [0.0, 0.0] | |
| 10.14 Participants with grade 3 local swelling | 1 | Risk Ratio (M‐H, Fixed, 95% CI) | 0.0 [0.0, 0.0] | |
| 10.15 Participants with consent withdrawal | 1 | Risk Ratio (M‐H, Fixed, 95% CI) | 0.0 [0.0, 0.0] | |
| 10.16 Participants with lost to follow‐up | 1 | Risk Ratio (M‐H, Fixed, 95% CI) | 0.0 [0.0, 0.0] | |
| 10.17 Participants with death | 1 | Risk Ratio (M‐H, Fixed, 95% CI) | 0.0 [0.0, 0.0] | |
| Outcome or subgroup title | No. of studies | No. of participants | Statistical method | Effect size |
| 1 Incidence of herpes zoster 3.2 years follow‐up (≥ 60 yo) Show forest plot | 1 | Risk Ratio (M‐H, Fixed, 95% CI) | Totals not selected | |
| Analysis 10.1  Comparison 10 Adjuvanted recombinant VZV subunit zoster vaccine (not yet available) versus placebo, Outcome 1 Incidence of herpes zoster 3.2 years follow‐up (≥ 60 yo). | ||||
| 2 Participants with AEs Show forest plot | 1 | Risk Ratio (M‐H, Fixed, 95% CI) | Totals not selected | |
| Analysis 10.2 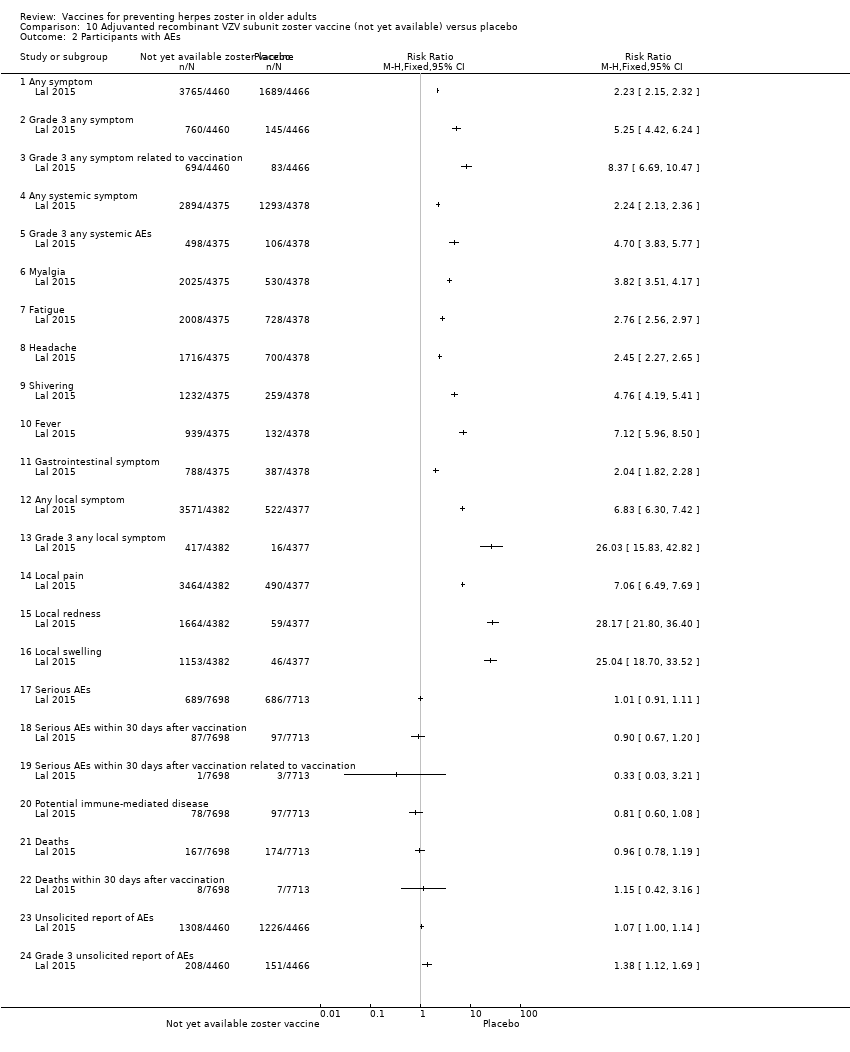 Comparison 10 Adjuvanted recombinant VZV subunit zoster vaccine (not yet available) versus placebo, Outcome 2 Participants with AEs. | ||||
| 2.1 Any symptom | 1 | Risk Ratio (M‐H, Fixed, 95% CI) | 0.0 [0.0, 0.0] | |
| 2.2 Grade 3 any symptom | 1 | Risk Ratio (M‐H, Fixed, 95% CI) | 0.0 [0.0, 0.0] | |
| 2.3 Grade 3 any symptom related to vaccination | 1 | Risk Ratio (M‐H, Fixed, 95% CI) | 0.0 [0.0, 0.0] | |
| 2.4 Any systemic symptom | 1 | Risk Ratio (M‐H, Fixed, 95% CI) | 0.0 [0.0, 0.0] | |
| 2.5 Grade 3 any systemic AEs | 1 | Risk Ratio (M‐H, Fixed, 95% CI) | 0.0 [0.0, 0.0] | |
| 2.6 Myalgia | 1 | Risk Ratio (M‐H, Fixed, 95% CI) | 0.0 [0.0, 0.0] | |
| 2.7 Fatigue | 1 | Risk Ratio (M‐H, Fixed, 95% CI) | 0.0 [0.0, 0.0] | |
| 2.8 Headache | 1 | Risk Ratio (M‐H, Fixed, 95% CI) | 0.0 [0.0, 0.0] | |
| 2.9 Shivering | 1 | Risk Ratio (M‐H, Fixed, 95% CI) | 0.0 [0.0, 0.0] | |
| 2.10 Fever | 1 | Risk Ratio (M‐H, Fixed, 95% CI) | 0.0 [0.0, 0.0] | |
| 2.11 Gastrointestinal symptom | 1 | Risk Ratio (M‐H, Fixed, 95% CI) | 0.0 [0.0, 0.0] | |
| 2.12 Any local symptom | 1 | Risk Ratio (M‐H, Fixed, 95% CI) | 0.0 [0.0, 0.0] | |
| 2.13 Grade 3 any local symptom | 1 | Risk Ratio (M‐H, Fixed, 95% CI) | 0.0 [0.0, 0.0] | |
| 2.14 Local pain | 1 | Risk Ratio (M‐H, Fixed, 95% CI) | 0.0 [0.0, 0.0] | |
| 2.15 Local redness | 1 | Risk Ratio (M‐H, Fixed, 95% CI) | 0.0 [0.0, 0.0] | |
| 2.16 Local swelling | 1 | Risk Ratio (M‐H, Fixed, 95% CI) | 0.0 [0.0, 0.0] | |
| 2.17 Serious AEs | 1 | Risk Ratio (M‐H, Fixed, 95% CI) | 0.0 [0.0, 0.0] | |
| 2.18 Serious AEs within 30 days after vaccination | 1 | Risk Ratio (M‐H, Fixed, 95% CI) | 0.0 [0.0, 0.0] | |
| 2.19 Serious AEs within 30 days after vaccination related to vaccination | 1 | Risk Ratio (M‐H, Fixed, 95% CI) | 0.0 [0.0, 0.0] | |
| 2.20 Potential immune‐mediated disease | 1 | Risk Ratio (M‐H, Fixed, 95% CI) | 0.0 [0.0, 0.0] | |
| 2.21 Deaths | 1 | Risk Ratio (M‐H, Fixed, 95% CI) | 0.0 [0.0, 0.0] | |
| 2.22 Deaths within 30 days after vaccination | 1 | Risk Ratio (M‐H, Fixed, 95% CI) | 0.0 [0.0, 0.0] | |
| 2.23 Unsolicited report of AEs | 1 | Risk Ratio (M‐H, Fixed, 95% CI) | 0.0 [0.0, 0.0] | |
| 2.24 Grade 3 unsolicited report of AEs | 1 | Risk Ratio (M‐H, Fixed, 95% CI) | 0.0 [0.0, 0.0] | |
| 3 Drop‐outs Show forest plot | 1 | Risk Ratio (M‐H, Fixed, 95% CI) | Totals not selected | |
| Analysis 10.3  Comparison 10 Adjuvanted recombinant VZV subunit zoster vaccine (not yet available) versus placebo, Outcome 3 Drop‐outs. | ||||
| 3.1 Did not receive vaccine according to protocol | 1 | Risk Ratio (M‐H, Fixed, 95% CI) | 0.0 [0.0, 0.0] | |
| 3.2 Received wrong vaccine | 1 | Risk Ratio (M‐H, Fixed, 95% CI) | 0.0 [0.0, 0.0] | |
| 3.3 Had diagnosis of HZ < 30 days after dose 2 | 1 | Risk Ratio (M‐H, Fixed, 95% CI) | 0.0 [0.0, 0.0] | |
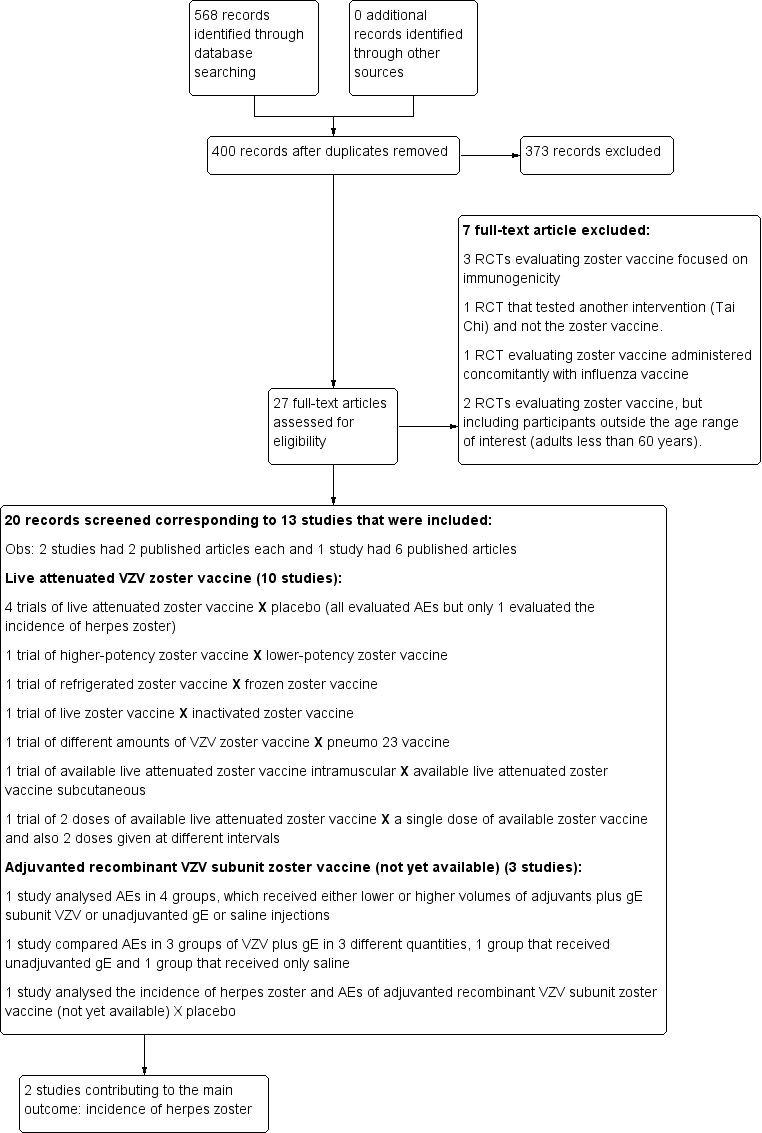
Study flow diagram 2015 update

'Risk of bias' graph: review authors' judgements about each risk of bias item presented as percentages across all included studies.

'Risk of bias' summary: review authors' judgements about each risk of bias item for each included study.

Comparison 1 Available live attenuated VZV zoster vaccine versus placebo, Outcome 1 Incidence of herpes zoster.

Comparison 1 Available live attenuated VZV zoster vaccine versus placebo, Outcome 2 Incidence of herpes zoster with ZBPI ADL. Severity of interference scores of 300 or greater (high score is worse).

Comparison 1 Available live attenuated VZV zoster vaccine versus placebo, Outcome 3 Participants with AEs.
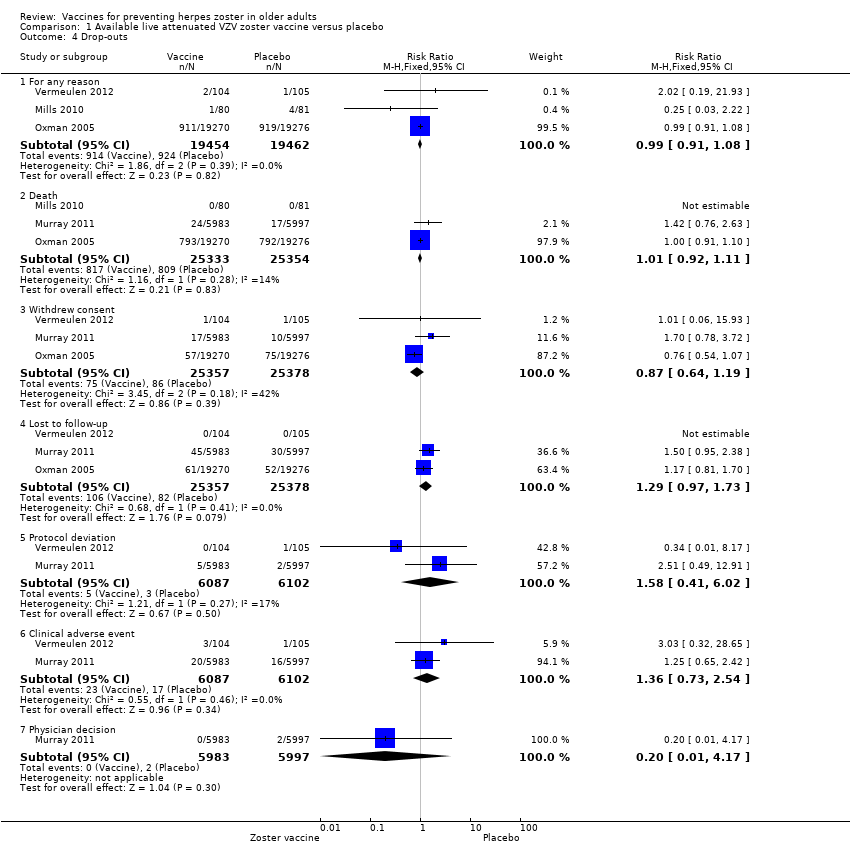
Comparison 1 Available live attenuated VZV zoster vaccine versus placebo, Outcome 4 Drop‐outs.

Comparison 1 Available live attenuated VZV zoster vaccine versus placebo, Outcome 5 Participants with no follow‐up.

Comparison 2 Live attenuated VZV zoster vaccine higher‐potency zoster vaccine versus lower‐potency zoster vaccine, Outcome 1 Incidence of herpes zoster.

Comparison 2 Live attenuated VZV zoster vaccine higher‐potency zoster vaccine versus lower‐potency zoster vaccine, Outcome 2 Vaccine‐related adverse effects.
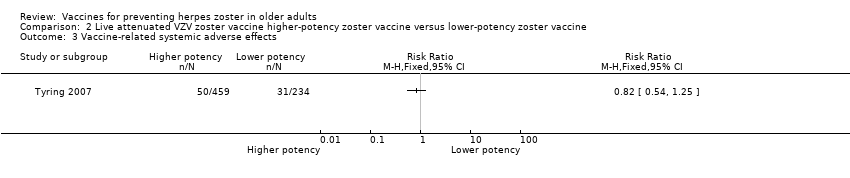
Comparison 2 Live attenuated VZV zoster vaccine higher‐potency zoster vaccine versus lower‐potency zoster vaccine, Outcome 3 Vaccine‐related systemic adverse effects.

Comparison 2 Live attenuated VZV zoster vaccine higher‐potency zoster vaccine versus lower‐potency zoster vaccine, Outcome 4 Vaccine‐related serious adverse effects.

Comparison 2 Live attenuated VZV zoster vaccine higher‐potency zoster vaccine versus lower‐potency zoster vaccine, Outcome 5 Injection site vaccine‐related adverse effects.

Comparison 2 Live attenuated VZV zoster vaccine higher‐potency zoster vaccine versus lower‐potency zoster vaccine, Outcome 6 Participants with no follow‐up.
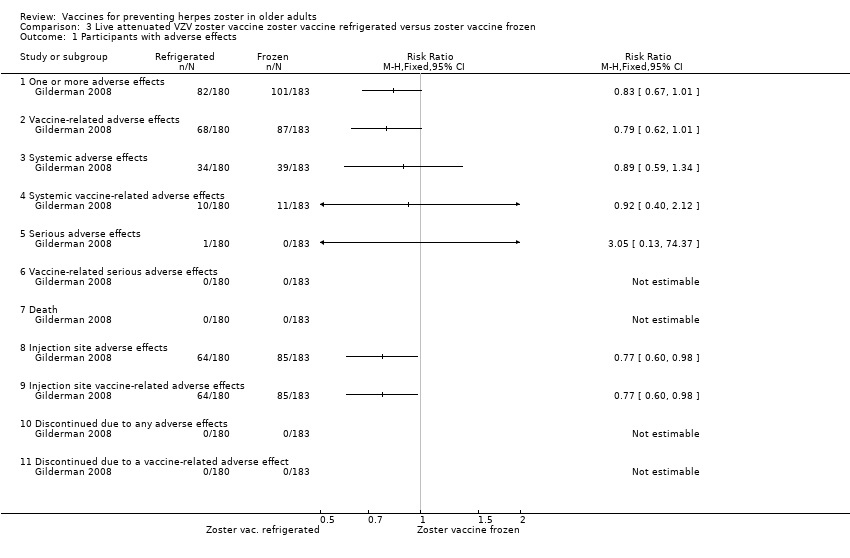
Comparison 3 Live attenuated VZV zoster vaccine zoster vaccine refrigerated versus zoster vaccine frozen, Outcome 1 Participants with adverse effects.
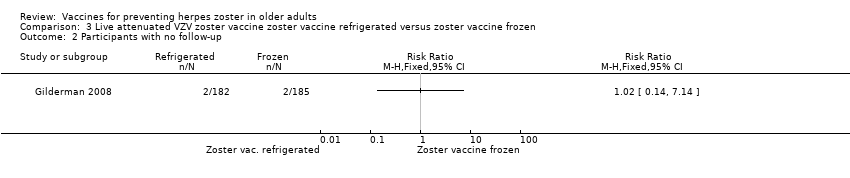
Comparison 3 Live attenuated VZV zoster vaccine zoster vaccine refrigerated versus zoster vaccine frozen, Outcome 2 Participants with no follow‐up.

Comparison 4 Live attenuated VZV zoster vaccine versus inactivated zoster vaccine, Outcome 1 Incidence of herpes zoster.

Comparison 5 Live attenuated VZV zoster vaccine versus pneumo 23 vaccine, Outcome 1 3200 pfu VZV/dose.

Comparison 5 Live attenuated VZV zoster vaccine versus pneumo 23 vaccine, Outcome 2 8500 pfu VZV/dose.

Comparison 5 Live attenuated VZV zoster vaccine versus pneumo 23 vaccine, Outcome 3 41,650 pfu/dose.
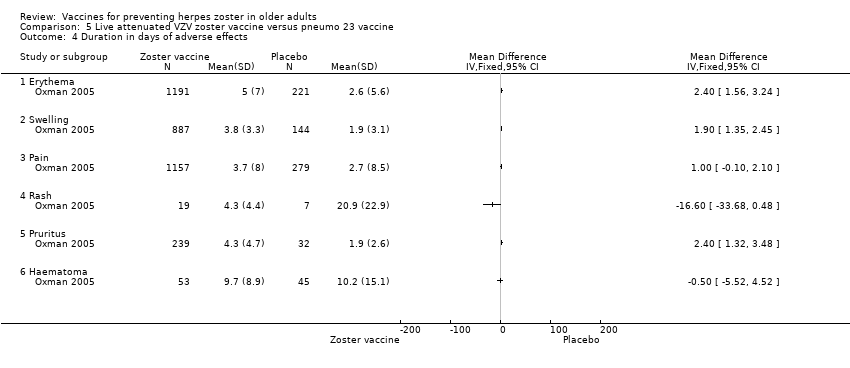
Comparison 5 Live attenuated VZV zoster vaccine versus pneumo 23 vaccine, Outcome 4 Duration in days of adverse effects.

Comparison 6 Live attenuated VZV zoster vaccine IM route versus zoster vaccine SC route, Outcome 1 Participants with adverse events.
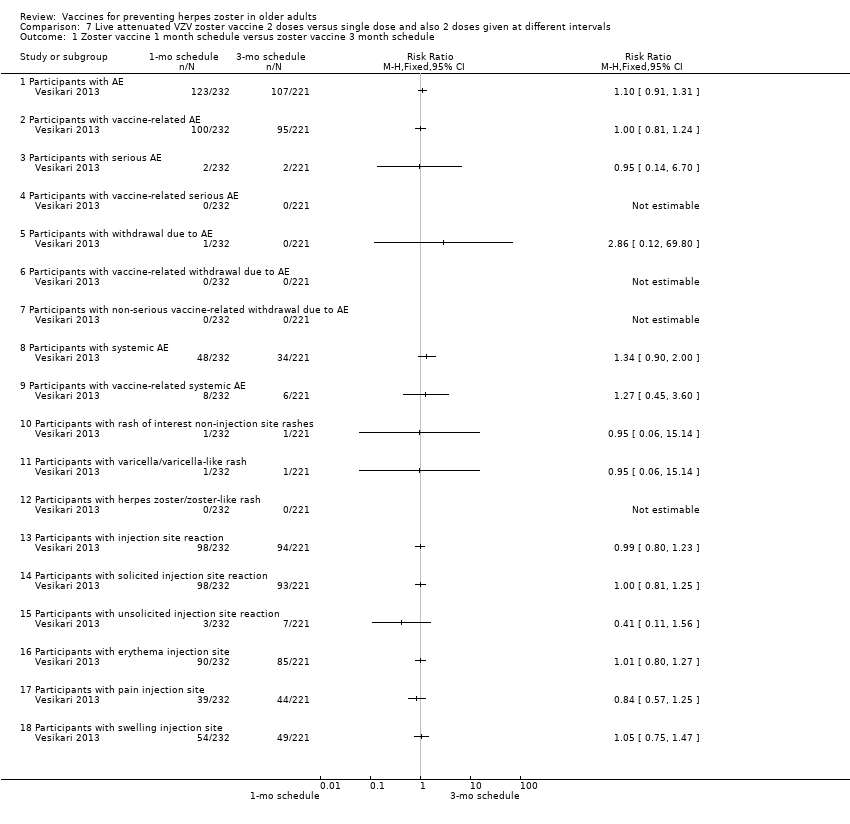
Comparison 7 Live attenuated VZV zoster vaccine 2 doses versus single dose and also 2 doses given at different intervals, Outcome 1 Zoster vaccine 1 month schedule versus zoster vaccine 3 month schedule.

Comparison 7 Live attenuated VZV zoster vaccine 2 doses versus single dose and also 2 doses given at different intervals, Outcome 2 Zoster vaccine 1 month schedule versus zoster vaccine single dose.

Comparison 7 Live attenuated VZV zoster vaccine 2 doses versus single dose and also 2 doses given at different intervals, Outcome 3 Zoster vaccine 3 month schedule versus zoster vaccine single dose.

Comparison 8 Adjuvanted recombinant VZV subunit zoster vaccine: lower or higher quantities of adjuvants plus gE subunit VZV versus unadjuvanted gE or saline, Outcome 1 50 μg gE/AS01E versus 50 μg gE/AS01B.

Comparison 8 Adjuvanted recombinant VZV subunit zoster vaccine: lower or higher quantities of adjuvants plus gE subunit VZV versus unadjuvanted gE or saline, Outcome 2 50 μg gE/AS01E versus 50 μg gE/saline (unadjuvanted gE).

Comparison 8 Adjuvanted recombinant VZV subunit zoster vaccine: lower or higher quantities of adjuvants plus gE subunit VZV versus unadjuvanted gE or saline, Outcome 3 50 μg gE/AS01B versus 50 μg gE/saline (unadjuvanted gE).

Comparison 8 Adjuvanted recombinant VZV subunit zoster vaccine: lower or higher quantities of adjuvants plus gE subunit VZV versus unadjuvanted gE or saline, Outcome 4 50 μg gE/AS01E versus saline.

Comparison 8 Adjuvanted recombinant VZV subunit zoster vaccine: lower or higher quantities of adjuvants plus gE subunit VZV versus unadjuvanted gE or saline, Outcome 5 50 μg gE/AS01B versus saline.

Comparison 8 Adjuvanted recombinant VZV subunit zoster vaccine: lower or higher quantities of adjuvants plus gE subunit VZV versus unadjuvanted gE or saline, Outcome 6 50 μg gE/Saline (unadjuvanted) versus saline.

Comparison 9 Adjuvanted recombinant VZV subunit zoster vaccine: 3 groups of VZV subunit gE in 3 different quantities versus unadjuvanted gE or saline, Outcome 1 25 µg gE/AS01B versus 50 µg gE/AS01B.
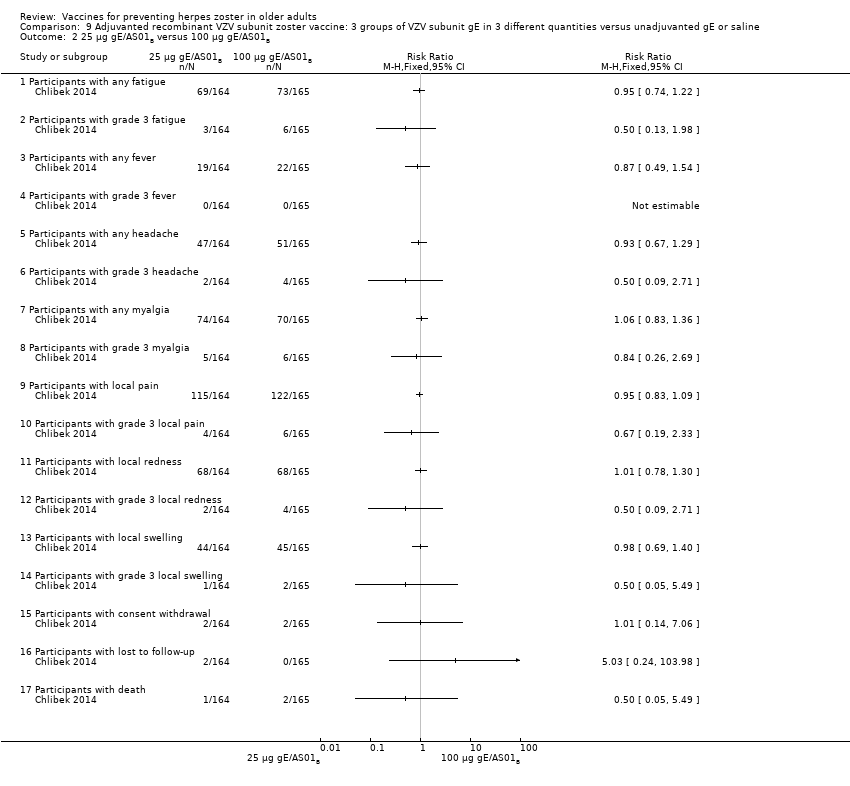
Comparison 9 Adjuvanted recombinant VZV subunit zoster vaccine: 3 groups of VZV subunit gE in 3 different quantities versus unadjuvanted gE or saline, Outcome 2 25 µg gE/AS01B versus 100 µg gE/AS01B.
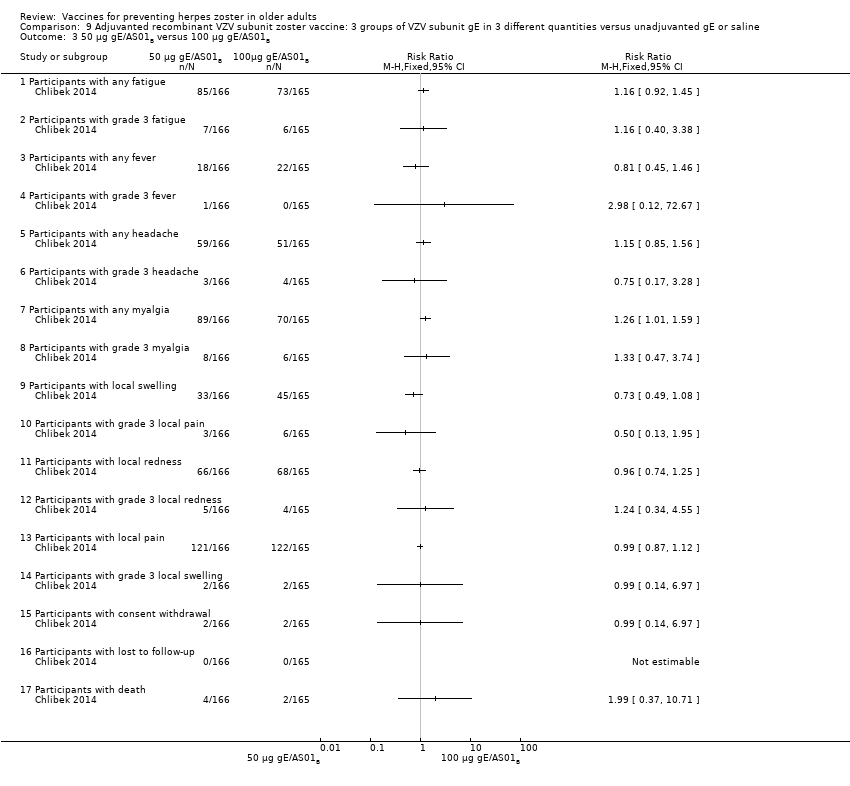
Comparison 9 Adjuvanted recombinant VZV subunit zoster vaccine: 3 groups of VZV subunit gE in 3 different quantities versus unadjuvanted gE or saline, Outcome 3 50 µg gE/AS01B versus 100 µg gE/AS01B.

Comparison 9 Adjuvanted recombinant VZV subunit zoster vaccine: 3 groups of VZV subunit gE in 3 different quantities versus unadjuvanted gE or saline, Outcome 4 25 µg gE/AS01B versus 100 µg gE/saline (unadjuvanted gE).

Comparison 9 Adjuvanted recombinant VZV subunit zoster vaccine: 3 groups of VZV subunit gE in 3 different quantities versus unadjuvanted gE or saline, Outcome 5 50 µg gE/AS01B a versus 100 µg gE/saline (unadjuvanted gE).
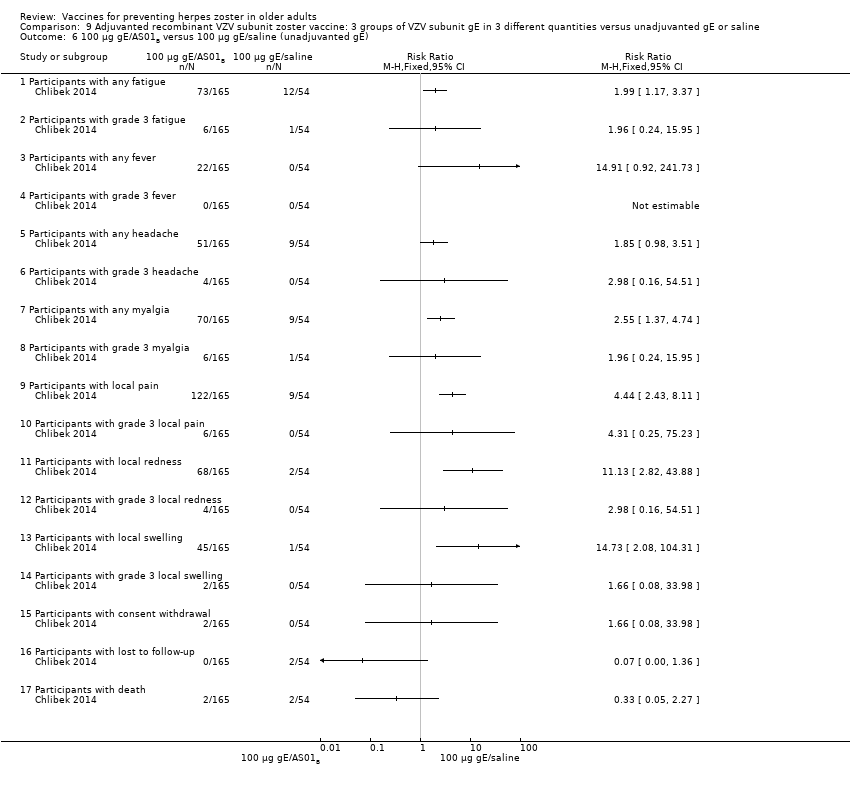
Comparison 9 Adjuvanted recombinant VZV subunit zoster vaccine: 3 groups of VZV subunit gE in 3 different quantities versus unadjuvanted gE or saline, Outcome 6 100 µg gE/AS01B versus 100 µg gE/saline (unadjuvanted gE).

Comparison 9 Adjuvanted recombinant VZV subunit zoster vaccine: 3 groups of VZV subunit gE in 3 different quantities versus unadjuvanted gE or saline, Outcome 7 25 µg gE/AS01B versus saline + 100 µg gE/AS01B.
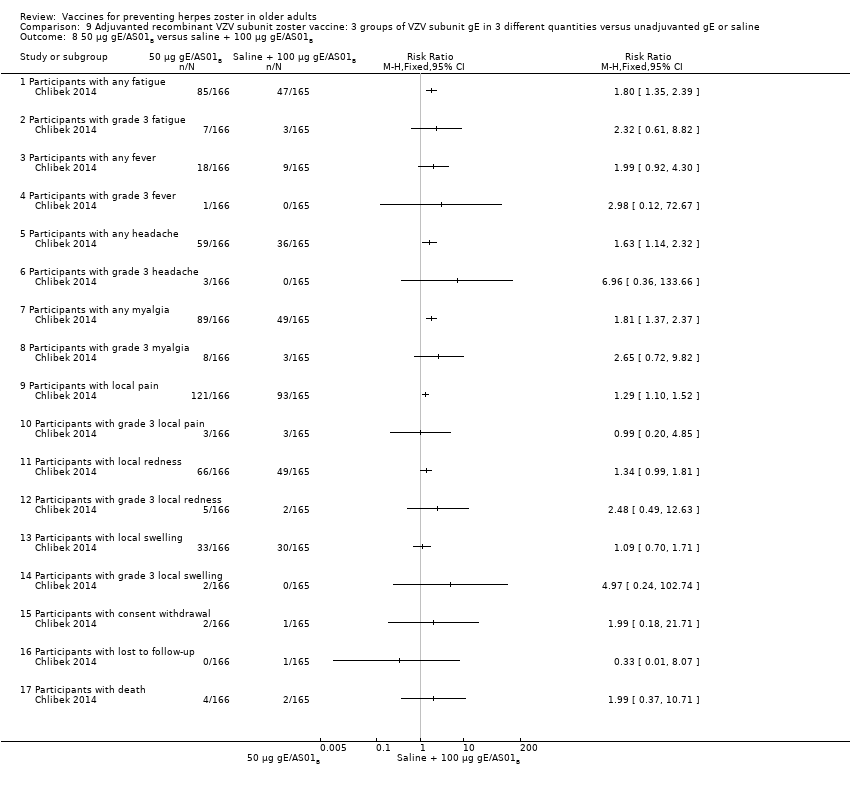
Comparison 9 Adjuvanted recombinant VZV subunit zoster vaccine: 3 groups of VZV subunit gE in 3 different quantities versus unadjuvanted gE or saline, Outcome 8 50 µg gE/AS01B versus saline + 100 µg gE/AS01B.

Comparison 9 Adjuvanted recombinant VZV subunit zoster vaccine: 3 groups of VZV subunit gE in 3 different quantities versus unadjuvanted gE or saline, Outcome 9 100 µg gE/AS01B versus saline + 100 µg gE/AS01B.
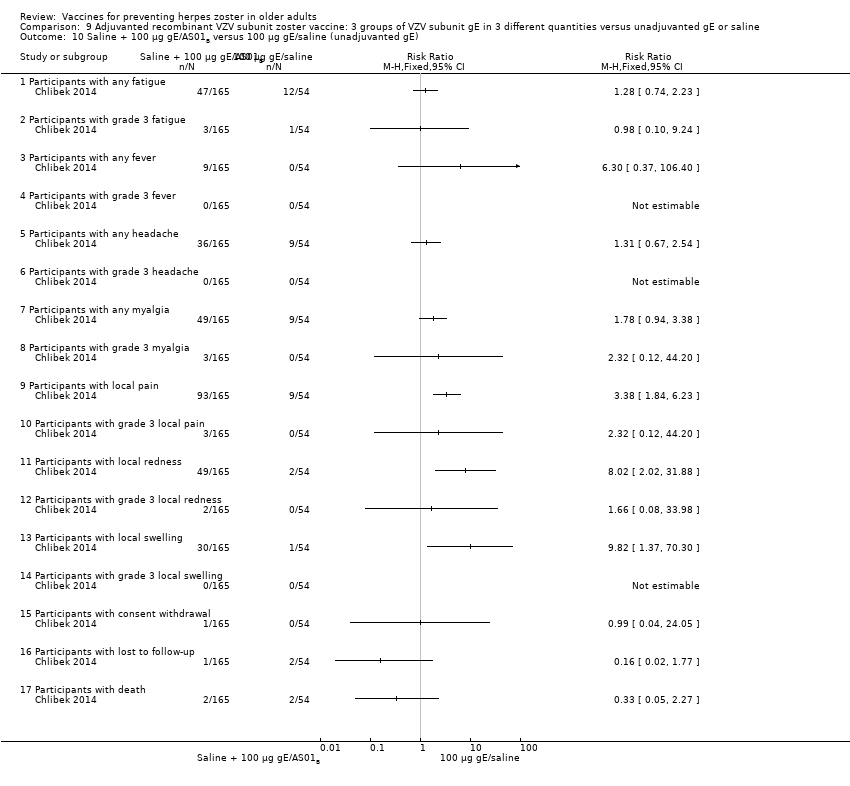
Comparison 9 Adjuvanted recombinant VZV subunit zoster vaccine: 3 groups of VZV subunit gE in 3 different quantities versus unadjuvanted gE or saline, Outcome 10 Saline + 100 µg gE/AS01B versus 100 µg gE/saline (unadjuvanted gE).
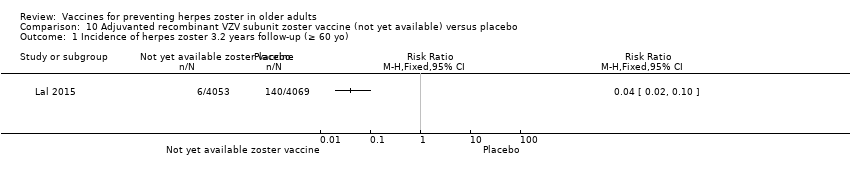
Comparison 10 Adjuvanted recombinant VZV subunit zoster vaccine (not yet available) versus placebo, Outcome 1 Incidence of herpes zoster 3.2 years follow‐up (≥ 60 yo).

Comparison 10 Adjuvanted recombinant VZV subunit zoster vaccine (not yet available) versus placebo, Outcome 2 Participants with AEs.
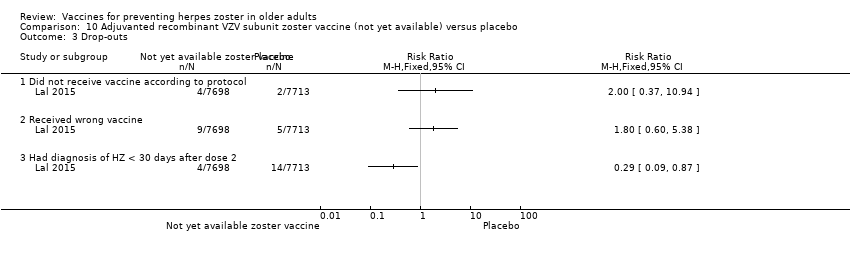
Comparison 10 Adjuvanted recombinant VZV subunit zoster vaccine (not yet available) versus placebo, Outcome 3 Drop‐outs.
| Available live attenuated VZV zoster vaccine versus placebo for preventing herpes zoster in older adults | ||||||
| Patient or population: healthy older adults Settings: outpatients Intervention: available live attenuated VZV zoster vaccine Comparison: placebo | ||||||
| Outcomes | Illustrative comparative risks* (95% CI) | Relative effect | No of participants | Quality of the evidence | Comments | |
| Assumed risk | Corresponding risk | |||||
| Placebo | Available live attenuated VZV zoster vaccine | |||||
| Incidence of herpes zoster Clinical and laboratory criteria | Study population | RR 0.49 | 38,546 | ⊕⊕⊕⊝ | Absolute risk for available live attenuated VZV zoster vaccine = 1.6% Absolute risk for placebo group = 3.3% | |
| 33 per 1000 | 16 per 1000 | |||||
| Participants with AEs: ≥ 1 serious AE regardless of type of storage of the vaccine Clinical and laboratory criteria | Study population | RR 1.08 | 50,896 | ⊕⊕⊕⊝ | Absolute risk for available live attenuated VZV zoster vaccine = 2.3% Absolute risk for placebo group = 2.2% | |
| 22 per 1000 | 23 per 1000 | |||||
| Participants with AEs: hospitalised Number of participants hospitalised | Study population | RR 1.00 | 6616 | ⊕⊕⊕⊝ | Absolute risk for available live attenuated VZV zoster vaccine = 34.1% Absolute risk for placebo group = 34.1% | |
| 341 per 1000 | 341 per 1000 | |||||
| Participants with AEs: injection site AEs Clinical and laboratory criteria | Study population | RR 2.99 (2.75 to 3.26) | 6986 | ⊕⊕⊕⊝ | Absolute risk for available live attenuated VZV zoster vaccine = 47.9% Absolute risk for placebo group = 16.0% | |
| 160 per 1000 | 479 per 1000 | |||||
| Drop‐outs: death Number of deaths | Study population | RR 1.01 | 50,687 | ⊕⊕⊕⊝ | Absolute risk for available live attenuated VZV zoster vaccine = 3.3% Absolute risk for placebo group = 3.2% | |
| 32 per 1000 | 33 per 1000 | |||||
| *The basis for the assumed risk (e.g. the median control group risk across studies) is provided in footnotes. The corresponding risk (and its 95% confidence interval) is based on the assumed risk in the comparison group and the relative effect of the intervention (and its 95% CI). | ||||||
| GRADE Working Group grades of evidence | ||||||
| 1Did not describe random sequence generation. | ||||||
| Adjuvanted recombinant VZV subunit zoster vaccine (not yet available) versus placebo for preventing herpes zoster in older adults | ||||||
| Patient or population: healthy older adults Comparison: placebo | ||||||
| Outcomes | Illustrative comparative risks* (95% CI) | Relative effect | No of participants | Quality of the evidence | Comments | |
| Assumed risk | Corresponding risk | |||||
| Placebo | Adjuvanted recombinant VZV subunit zoster vaccine (not yet available) versus placebo | |||||
| Incidence of herpes zoster 3.2 years follow‐up (≥ 60 yo) Clinical and laboratory criteria | Study population | RR 0.04 (0.02 to 0.1) | 8122 | ⊕⊕⊕⊝ | Absolute risk for adjuvanted recombinant VZV subunit zoster vaccine (not yet available) = 0.2% Absolute risk for placebo group = 3.4% | |
| 34 per 1000 | 2 per 1000 | |||||
| Participants with AEs: any local symptom Clinical criteria | Study population | RR 6.83 (6.30 to 7.42) | 8759 | ⊕⊕⊕⊝ | Absolute risk for adjuvanted recombinant VZV subunit zoster vaccine (not yet available) = 81.5% Absolute risk for placebo group = 11.9% | |
| 119 per 1000 | 815 per 1000 | |||||
| Participants with AEs: serious AEs Clinical and laboratory criteria | Study population | RR 1.01 (0.91 to 1.1) | 15,411 | ⊕⊕⊕⊝ | Absolute risk for adjuvanted recombinant VZV subunit zoster vaccine (not yet available) = 9.0% Absolute risk for placebo group = 8.9% | |
| 89 per 1000 | 90 per 1000 | |||||
| Participants with AEs: potential immune‐mediated disease Clinical and laboratory criteria | Study population | RR 0.81 (0.06 to 1.08) | 15,411 | ⊕⊕⊕⊝ | Absolute risk for adjuvanted recombinant VZV subunit zoster vaccine (not yet available) = 1.0% Absolute risk for placebo group = 1.3% | |
| 13 per 1000 | 10 per 1000 | |||||
| Participants with AEs: deaths Number of deaths Follow‐up: mean 3.2 years | Study population | RR 0.96 (0.78 to 1.19) | 15,411 | ⊕⊕⊕⊝ | Absolute risk for adjuvanted recombinant VZV subunit zoster vaccine (not yet available) = 2.2% Absolute risk for placebo group = 2.3% | |
| 23 per 1000 | 22 per 1000 | |||||
| *The basis for the assumed risk (e.g. the median control group risk across studies) is provided in footnotes. The corresponding risk (and its 95% confidence interval) is based on the assumed risk in the comparison group and the relative effect of the intervention (and its 95% CI). | ||||||
| GRADE Working Group grades of evidence | ||||||
| 1Did not describe allocation concealment and participant flow not clear. | ||||||
| Domain | Risk of bias |
| Allocation (selection bias): randomisation criteria | We graded 5 studies as having a low risk of bias for random sequence generation (selection bias) because they described how the randomisation was done (Chlibek 2013; Diez‐Domingo 2015; Lal 2015; Vermeulen 2012; Vesikari 2013). Chlibek 2013 stated that "Randomization was made using an algorithm that stratified by country, minimized for age, and included a block size of 11". In Diez‐Domingo 2015: "The subjects were randomised using an electronic case report form (e‐CRF)". Lal 2015 stated that "We randomly assigned participants in a 1:1 ratio to receive either vaccine or placebo using an online centralized randomization system". Vermeulen 2012 stated that "Subjects were randomised in a 1:1 ratio to receive two doses of either zoster vaccine or placebo, according to a computer‐generated, study‐centre specific allocation schedule". Vesikari 2013 used "blocks of randomisation, with stratification by age (70–79 y and ≥ 80 y) and country". The other 8 trials provided no details on the randomisation process and we therefore classified them as having an unclear risk of bias for this domain (Berger 1998; Chlibek 2014; Gilderman 2008; Levin 2000; Mills 2010; Murray 2011; Oxman 2005; Tyring 2007). |
| Allocation (selection bias): allocation criteria | We classified Chlibek 2013, Diez‐Domingo 2015, Lal 2015, Oxman 2005, Vermeulen 2012 and Vesikari 2013 as having low risk of bias because of adequate allocation concealment described by the trial authors as follows. Chlibek 2013: "Treatments were allocated at each site using a central randomisation system on the Internet". Diez‐Domingo 2015: "Allocation schedules were generated using a 1:1 ratio with permuted blocks of 4‐6". Lal 2015: "Participants were stratified according to region and age group (50 to 59, 60 to 69, and ≥70 years)". Oxman 2005: "Each study site received randomly ordered vials of zoster vaccine and placebo in separate boxes for each age stratum". Vermeulen 2012: "Allocation numbers were assigned sequentially by the study site personnel to subjects who met the study eligibility criteria, beginning with the lowest number available at the study centre, after informed consent and medical history had been obtained. The allocation schedule was generated by a sponsor statistician not otherwise associated with the zoster vaccine program". Vesikari 2013: "The allocation schedule was generated using balanced permuted blocks of randomisation" Berger 1998, Chlibek 2014, Gilderman 2008, Levin 2000, Mills 2010, Murray 2011 and Tyring 2007 did not report details of allocation concealment and we therefore classified these trials as having an 'unclear' risk of bias for this domain. |
| Blinding (performance bias and detection bias) | 8 trials were double‐blind and we considered them at low risk for this domain (Berger 1998; Chlibek 2013; Gilderman 2008; Lal 2015; Murray 2011; Oxman 2005; Tyring 2007; Vermeulen 2012). The Berger 1998 trial had 4 arms: 3 received different concentrations of a live attenuated VZV/Oka vaccine under double‐blind conditions. The 4th arm used a pneumococcal polysaccharide vaccine as a control for reactogenicity and immune response, under single‐blind conditions Chlibek 2013 stated that "Both vaccine recipients and observers responsible for evaluations were blinded to which formulation was administered". Gilderman 2008 included the following comment: "Double‐blind, with in‐house blinding. The vaccine and placebo were indistinguishable from each other." Lal 2015 reported "Because the appearance of the reconstituted HZ/su vaccine differed from the placebo solution, injections were prepared and administered by study staff who did not participate in any study assessment." In Murray 2011, the authors reported that "The zoster vaccine and placebo were reconstituted with sterile diluent immediately prior to administration, and were indistinguishable from each other in appearance. Placebo was the vaccine stabiliser of zoster vaccine with no live virus. An independent Data Monitoring Committee was established for continuous safety oversight during the study." Oxman 2005 provided the following statement: "Since the reconstituted zoster vaccine had a different appearance from the placebo, reconstitution and administration were performed by technicians who did not otherwise interact with subjects, evaluate outcomes or adverse events, answer the telephone or enter study data." Tyring 2007 states "Blinded subject, investigator and sponsor. The 2 potency formulations were indistinguishable in appearance". Vermeulen 2012 declares that "The subject, investigator, clinical study site personnel, and sponsor personnel directly involved in the study were blinded to whether the subject received zoster vaccine or placebo. They remained blinded until all subjects completed the study. The clinical materials were prepared by an unblinded vaccine coordinator at each clinical site, because of differences in the turbidity of the study vaccine and placebo. Each vial of vaccine or placebo was labelled with a subject‐specific allocation number. The unblinded vaccine coordinator reconstituted the study vaccine/placebo and wrapped the syringe in an opaque label containing subject allocation number and time of reconstitution. The unblinded vaccine coordinator did not have any contact with the subject and did not disclose the contents of the syringe to the person administering the study vaccine/placebo." We classified 3 trials as having a 'low risk of bias' only for the domain "blinding of participants and personnel (performance bias)" although "personnel were not blinded" because the participants themselves were blinded and they were the ones who described adverse events in diary cards (Chlibek 2014; Diez‐Domingo 2015; Vesikari 2013). Please see below: Chlibek 2014 described: "solicited local reactions (pain, redness and swelling) and general reactions (fatigue, fever, headache and myalgia) were recorded by subjects on diary cards for seven days after each vaccination". Diez‐Domingo 2015 stated: "Between visit 1 and 2, the participants were given a diary card to record their temperature if they were febrile (oral temperature ≥38.3 ◦C), occurrence of any solicited injection‐site (erythema, swelling and pain) adverse reactions (Days 0–4) and any unsolicited injection‐site adverse reactions, varicella, varicella‐like rashes, HZ and zoster‐like rashes and other systemic adverse events (AEs) (Days 0–28). They were also asked to report any serious AEs (SAEs) that occurred at any time during the study". Vesikari 2013 provided the following description: "Solicited injection‐site reactions (erythema, swelling, and pain) occurring within 4 days of vaccination were recorded by participants in a diary card. Other injection‐site reactions and systemic AEs were recorded in the diary card for up to 28 d following each vaccination." 1 trial was an open study and we considered it to be at high risk of bias for blinding (Levin 2000). We classified Mills 2010 as 'unclear risk of bias' because the authors did not provide any information on blinding. |
| Incomplete outcome data (attrition bias) | We classified Chlibek 2013, Chlibek 2014, Diez‐Domingo 2015, Gilderman 2008, Murray 2011, Oxman 2005, Tyring 2007, Vermeulen 2012 and Vesikari 2013 as 'low risk' in this domain because the flow of patients was clear. Mills 2010 had no data on the first arm of the cross‐over study and we therefore classified it as 'high risk'. We also classified Lal 2015 as high risk of bias because the patient flow is not clear. We classified Berger 1998 and Levin 2000 as 'unclear risk' as they did not provide any information for this domain. |
| Selective reporting (reporting bias) | We classified the following studies as 'low risk' in this domain. In Berger 1998, the adverse events originally defined by the authors were presented for all groups. Chlibek 2013 presented the adverse events originally defined by the authors in all groups that received 2 doses of 2 different amounts of adjuvant plus gE subunit VZV, unadjuvanted gE or saline. Chlibek 2014 also presented the adverse events associated with 2 doses of different amounts of adjuvanted gE, unadjuvanted gE or saline. Diez‐Domingo 2015 presented all adverse events proposed in the methodology in both groups (intramuscular versus subcutaneous zoster vaccine). Gilderman 2008 reported all adverse events that the investigators selected, for both groups (refrigerated versus frozen zoster vaccines). In Lal 2015, the data for efficacy and safety of the adjuvanted recombinant zoster vaccine proposed in the methods were described in the results. Mills 2010 described in the results all of the adverse events listed in the methods. Murray 2011 presented in the results all the serious adverse events that were defined in the methods section. Oxman 2005 reported in the results all the data on effectiveness and adverse events that the authors proposed in their methodology. Tyring 2007 provided in the results all the adverse events defined in the methods section, for both higher‐potency and lower‐potency zoster vaccines. Vermeulen 2012 described in their results all adverse events listed by the authors in the methods for both groups and Vesikari 2013 reported all the data that had been proposed in their methodology in the results section, for the 3 groups who received 2 doses of zoster vaccines given at different times or a single dose. We classified Levin 2000 as having an 'unclear' risk of bias for this domain because it was basically a study that analysed immune response. |
| Other potential sources of bias | We did not identify any significant aspects pertaining to this domain. |
| Comparison (studies) | Results |
| Available live attenuated VZV zoster vaccineversus placebo | The risk of herpes zoster‐like rash up to 42 days post‐vaccination (Oxman 2005) was lower in the vaccinated group (RR 0.47, 95% CI 0.27 to 0.84) than the placebo group but without a significant RD (Analysis 1.3.7). The following systemic AEs were not significantly different between the groups receiving zoster vaccine or placebo: systemic AEs (Mills 2010; Oxman 2005; Vermeulen 2012), systemic pruritus (Vermeulen 2012), varicella‐like rash not at injection site (from day of vaccination to day 42) (Oxman 2005; Vermeulen 2012), rash unrelated to HZ (from day of vaccination to day 42) (Oxman 2005), 1 or more SAE (including death) (Mills 2010; Murray 2011; Oxman 2005; Vermeulen 2012), vaccine‐related SAEs (Mills 2010; Murray 2011; Oxman 2005), discontinuation due to a vaccine‐related AE (Mills 2010; Vermeulen 2012), hospitalisation (Oxman 2005), and hospitalisation related to HZ (Oxman 2005). Specific injection site AEs were more frequent in the vaccinated group. Specific risks for individual AEs were:
Varicella‐like rash at injection site (up to day 42) was also more frequent in the vaccinated group: RR 2.86, 95% CI 1.21 to 6.76 (Analysis 1.3.23) (Oxman 2005), but without a significant RD due to the small number of events. Duration of injection site AEs In general, injection site AEs lasted longer in the zoster vaccine group. There were significant differences with respect to the duration of the following local AEs: erythema, with a mean difference (MD) of 2.40 days (95% CI 1.56 to 3.24) (Analysis 1.4.1), swelling MD 1.90 days (95% CI 1.35 to 2.45) (Analysis 1.4.2) and pruritus MD 2.40 days (95% CI 1.32 to 3.48) (Analysis 1.4.5). The duration of pain and haematoma did not differ significantly between the groups, MD 1.00 (95% CI ‐0.10 to 2.10) (Analysis 1.4.3) and MD ‐0.50 (95% CI ‐5.52 to 4.52) (Analysis 1.4.6) respectively. The duration of rash was longer in the placebo compared to the vaccine group: RR ‐16.60 (95% CI ‐33.68 to 0.48) (Analysis 1.4.4). |
| High‐potency versus low‐potency zoster vaccine (Tyring 2007) | The comparison of high versus low‐potency zoster vaccine yielded no significant differences between groups for the following AEs: vaccine‐related AEs, systemic vaccine‐related AEs and vaccine‐related serious AEs (death). |
| Refrigerated versus frozen zoster vaccine | Compared refrigerated versus frozen zoster vaccine and reported no significant differences between groups for the following AEs: 1 or more AEs, vaccine‐related AEs, systemic AEs, systemic vaccine‐related AEs, serious AEs, vaccine‐related serious AEs or death. However, there were more injection site AEs in the group receiving frozen vaccines (RR 0.77, 95% CI 0.60 to 0.98) (Analysis 3.1.8). |
| Zoster vaccine versus pneumo 23 | One study compared 3 different concentrations of plaque‐forming units (pfu) of live attenuated VZV and presented the following adverse events: 3200 pfu VZV/dose versus pneumo 23 There was a lower incidence of 1 or more injection site reactions in the group vaccinated with the 3200 pfu/dose zoster vaccine (RR 0.61, 95% CI 0.41 to 0.91) (Analysis 5.1.1) as well as pain at the injection site (RR 0.49, 95% CI 0.30 to 0.81) (Analysis 5.1.3). There were no significant differences between the 3200 pfu/dose zoster vaccine and the pneumo 23 vaccine for the following local adverse events: induration (≥ 2 cm diameter injection site), probably vaccine‐related injection site pain, redness (≥ 2 cm diameter injection site), pruritus or vesicles (no patients had vesicles in the 3200 pfu/dose zoster vaccine nor the pneumo 23 groups). 8500 pfu VZV/dose versus pneumo 23 There was a lower incidence of 1 or more injection site reaction in the group vaccinated with the 8500 pfu/dose zoster vaccine (RR 0.63, 95% CI 0.43 to 0.93) (Analysis 5.2.1). There were no significant differences for the following injection site AEs between participants who received the 8500 pfu/dose VZV vaccine and those who received the pneumo 23 vaccine: induration (≥ 2 cm diameter injection site), pain (injection site), probably vaccine‐related injection site pain, redness, pruritus and vesicles. 41,650 pfu VZV/dose VZV versus pneumo 23 Participants receiving the 41,650 pfu/dose zoster vaccine had significantly lower rates of one or more injection site reaction (RR 0.41, 95% CI 0.24 to 0.68) (Analysis 5.3.1) and pain at injection site (RR 0.43, 95% CI 0.25 to 0.74) (Analysis 5.3.3) than those receiving the pneumo 23 vaccine. There were no significant differences between the groups for the following injection site AEs: induration (≥ 2 cm diameter injection site), probably vaccine‐related injection site pain, redness (≥ 2 cm diameter injection site), pruritus and vesicles (no patients had vesicles in the 41,650 pfu/dose zoster vaccine nor the pneumo 23 vaccine groups). |
| Zoster vaccine intramuscular route versus zoster vaccine subcutaneous route | Compared intramuscular (IM) versus subcutaneous (SC) zoster vaccine and reported that compared to the IM group, participants who received SC vaccines had a significantly higher incidence of the following AEs:
There were no significant differences between groups for the following AEs: all systemic AEs: RR 1.03, 95% CI 0.70 to 1.51 (Analysis 6.1.3); vaccine‐related systemic AE: RR 0.93, 95% CI 0.44 to 1.98 (Analysis 6.1.4); headache considered as vaccine‐related by the investigator: RR 0.75, 95% CI 0.17 to 3.32 (Analysis 6.1.5); unsolicited injection site reaction: RR 0.65 95% CI 0.29 to 1.45 (Analysis 6.1.7); severe injection site erythema (> 10 cm): RR 0.67 95% CI 0.11 to 3.96 (Analysis 6.1.9); severe injection site pain (inability to work or usual activity): RR 1.01, 95% CI 0.14 to 7.06 (Analysis 6.1.11); severe injection site swelling (> 10 cm): RR 0.25, 95% CI 0.03 to 2.23 (Analysis 6.1.13). No participant withdrew from the trial because of AE (Analysis 6.1.15). |
| 2 doses of a zoster vaccine versus a single dose and also 2 doses given at different intervals | Zoster vaccine 1‐month schedule versus zoster vaccine 3‐month schedule There was no statistical difference between participants who received the doses of zoster vaccine 2 months apart compared to those receiving the doses 3 months apart: AE RR 1.10, 95% CI 0.91 to 1.31 (Analysis 7.1.1), vaccine‐related AE RR 1.00, 95% CI 0.81 to 1.24 (Analysis 7.1.2); serious AE RR 0.95, 95% CI 0.14 to 6.70 (Analysis 7.1.3); withdrawal due to AE RR 2.86, 95% CI 0.12 to 69.80 (Analysis 7.1.5); systemic AE RR 1.34, 95% CI 0.90 to 2.00 (Analysis 7.1.8); vaccine‐related systemic AE RR 1.27, 95% CI 0.45 to 3.60 (Analysis 7.1.9); rash of interest non‐injection site rashes RR 0.95, 95% CI 0.06 to 15.14 (Analysis 7.1.10); varicella/varicella‐like rash RR 0.95, 95% CI 0.06 to 15.14 (Analysis 7.1.11); injection site reaction RR 0.99, 95% CI 0.80 to 1.23 (Analysis 7.1.13); solicited injection site reaction RR 1.00, 95% CI 0.81 to 1.25 (Analysis 7.1.14); unsolicited injection site reaction RR 0.41, 95% CI 0.11 to 1.56 (Analysis 7.1.15); erythema injection site RR 1.01, 95% CI 0.80 to 1.27 (Analysis 7.1.16); pain injection site RR 0.84, 95% CI 0.57 to 1.25 (Analysis 7.1.17); swelling injection site RR 1.05, 95% CI 0.75 to 1.47 (Analysis 7.1.18). No participants, from either group, reported the following AE: vaccine‐related serious AE (Analysis 7.1.4); vaccine‐related withdrawal due to AE (Analysis 7.1.6); non‐serious vaccine‐related withdrawal due to AE (Analysis 7.1.7) and herpes zoster/zoster‐like rash (Analysis 7.1.12). Zoster vaccine 1 month schedule versus zoster vaccine single dose Only participants with systemic AE: there were significant differences in favour of the 2 doses 1 month apart, with a higher incidence in the single dose group: RR 0.74, 95% CI 0.56 to 0.97, RD ‐0.07, 95% CI ‐0.13 to ‐0.01 and NNTH 14.3, 95% CI 7.6 to 100 (Analysis 7.2.8). For most AEs, there was no statistical difference: AE RR 0.92, 95% CI 0.80 to 1.05 (Analysis 7.2.1), vaccine‐related AE RR 0.91, 95% CI 0.77 to 1.08 (Analysis 7.2.2); serious AE RR 0.72, 95% CI 0.16 to 3.30 (Analysis 7.2.3); withdrawal due to AE RR 0.36, 95% CI 0.05 to 2.82 (Analysis 7.1.5); vaccine‐related withdrawal due to AE RR 0.21, 95% CI 0.01 to 3.74 (Analysis 7.2.6); non‐serious vaccine‐related withdrawal due to AE RR 0.21, 95% CI 0.01 to 3.74 (Analysis 7.2.7); vaccine‐related systemic AE RR 0.54, 95% CI 0.26 to 1.12 (Analysis 7.2.9); rash of interest non‐injection site rashes RR 1.61, 95% CI 0.15 to 17.72 (Analysis 7.2.10); varicella/varicella‐like rash RR 9.66, 95% CI 0.39 to 236.25 (Analysis 7.2.11); herpes zoster/zoster‐like rash RR 0.64, 95% CI 0.03 to 13.36 (Analysis 7.2.12); injection site reaction RR 0.93, 95% CI 0.78 to 1.10 (Analysis 7.2.13); solicited injection site reaction RR 0.94, 95% CI 0.79 to 1.11 (Analysis 7.2.14); unsolicited injection site reaction RR 0.35, 95% CI 0.11 to 1.13 (Analysis 7.2.15); injection site erythema RR 0.98, 95% CI 0.81 to 1.17 (Analysis 7.2.16); injection site pain RR 0.74, 95% CI 0.54 to 1.01 (Analysis 7.2.17); injection site swelling RR 1.08, 95% CI 0.82 to 1.41 (Analysis 7.2.18). There were no participants with vaccine‐related serious AE in either group (Analysis 7.2.4). Zoster vaccine 3 month schedule versus zoster vaccine single dose The participants in the group that received a single dose had a higher incidence of the following AE in comparison to those in the group that received 2 doses, 3 months apart: AEs RR 0.84, 95% CI 0.72 to 0.97; RD ‐0.09; 95% CI ‐0.17 to ‐0.02 and NNTH 11.1, 95% CI 5.9 to 50 (Analysis 7.3.1), systemic AEs RR 0.55, 95% CI 0.39 to 0.76, RD ‐0.13, 95% CI ‐0.18 to ‐0.07 and NNTH 7.6, 95% CI 5.6 to 14.3 (Analysis 7.3.8) and vaccine‐related systemic AE RR 0.42, 95% CI 0.18 to 0.98), RD ‐0.04, 95% CI ‐0.06 to ‐0.01 and NNTH 25.0, 95% CI 16.6 to 100 (Analysis 7.3.9). There were no significant differences between these groups in relation to the following AEs: vaccine‐related AE RR 0.91, 95% CI 0.77 to 1.08 (Analysis 7.3.2); serious AE RR 0.75, 95% CI 0.16 to 3.46 (Analysis 7.3.3); withdrawal due to AE RR 0.18, 95% CI 0.01 to 3.04 (Analysis 7.3.5); vaccine‐related withdrawal due to AE RR 0.23, 95% CI 0.01 to 3.93 (Analysis 7.3.6); non‐serious vaccine‐related withdrawal due to AE RR 0.23, 95% CI 0.01 to 3.93 (Analysis 7.3.7); rash of interest non‐injection site rashes RR 1.69, 95% CI 0.15 to 18.60 (Analysis 7.3.10); varicella/varicella‐like rash RR 10.14, 95% CI 0.41 to 247.92 (Analysis 7.3.11); herpes zoster/zoster‐like rash RR 0.68, 95% CI 0.03 to 14.02 (Analysis 7.3.12); injection site reaction RR 1.10, 95% CI 0.79 to 1.11 (Analysis 7.3.13); solicited injection site reaction RR 0.93, 95% CI 0.78 to 1.11 (Analysis 7.3.14); unsolicited injection site reaction RR 0.85, 95% CI 0.38 to 1.91 (Analysis 7.3.15); injection site erythema RR 0.97, 95% CI 0.80 to 1.17 (Analysis 7.3.16); injection site pain RR 0.87, 95% CI 0.65 to 1.17 (Analysis 7.3.17); injection site swelling RR 1.03, 95% CI 0.77 to 1.36 (Analysis 7.3.18). There were no participants with vaccine‐related serious AE in either group (Analysis 7.3.4). |
| AE: adverse event | |
| Comparison (studies) | Results |
| Adjuvanted recombinant VZV subunit zoster vaccine: lower or higher quantities of adjuvants plus gE subunit VZV versus unadjuvanted gE or saline | Compared 4 groups that received either lower (AS01E) or higher (AS01B) volumes of adjuvants plus gE subunit VZ or unadjuvanted gE or saline injections. 50 μg gE/AS01E versus 50 μg gE/AS01B There was a significantly higher incidence of AEs in the participants who received a higher quantity of adjuvant (AS01B):
There were no significant differences between groups for all other AEs: any grade 3 symptom; any general symptom, any general grade 3 symptom, grade 3 fatigue, fever, gastrointestinal symptoms, grade 3 gastrointestinal symptoms, grade 3 headache, myalgia, grade 3 myalgia, any grade 3 local symptom, local grade 3 pain, local grade 3 redness, local swelling and local grade 3 swelling, consent withdrawal, loss to follow‐up and serious AE. No participants had grade 3 fever in either group. 50 μg gE/AS01E versus 50 μg gE/saline (unadjuvanted)
All these AE differences were favourable to the unadjuvanted gE group. There were no significant differences between the groups for the following AEs: any grade 3 symptom, any general grade 3 symptom, fatigue, grade 3 fatigue, gastrointestinal symptoms, grade 3 gastrointestinal symptoms, headache, grade 3 myalgia, any local grade 3 symptom, local grade 3 pain, local grade 3 redness and local grade 3 swelling, consent withdrawal, loss to follow‐up and serious AE. No participants had grade 3 fever or grade 3 headache in either group. 50 μg gE/AS01B versus 50 μg gE/saline (unadjuvanted)
All these AE differences were favourable to unadjuvanted gE. There were no significant differences between the groups for the following AEs: any grade 3 symptom, any general grade 3 symptom, grade 3 fatigue, gastrointestinal symptoms, grade 3 headache, grade 3 myalgia, any local grade 3 symptom, local grade 3 pain, local grade 3 redness and local grade 3 swelling, consent withdrawal, loss to follow‐up and serious AE. No participant had grade 3 fever or grade 3 gastrointestinal symptoms in either group. 50 μg gE/AS01E versus saline
All differences in these AEs were favourable to the saline group. There were no significant differences in the following AEs between the groups:any grade 3 symptom, any general grade 3 symptom, fatigue, grade 3 fatigue, fever, gastrointestinal symptoms, grade 3 gastrointestinal symptoms, headache, grade 3 headache, grade 3 myalgia, any local grade 3 symptom, local grade 3 pain, local redness, local grade 3 redness, local swelling and local grade 3 swelling, consent withdrawal, loss to follow‐up and serious AE No participants had grade 3 fever or grade 3 headache in either group. 50 μg gE/AS01B versus saline
All AE differences were favourable to saline. There was no significant difference in AEs between groups for the following: any grade 3 symptom, any general grade 3 symptom, grade 3 fatigue, fever, gastrointestinal symptoms, grade 3 gastrointestinal symptoms, grade 3, headache, grade 3 myalgia, any local grade 3 symptom, local grade 3 pain, local grade 3 redness, local swelling and local grade 3 swelling, consent withdrawal, loss to follow‐up and serious AEs. No participant had grade 3 fever in either group. 50 μg gE/saline (unadjuvanted) versus saline
There were no significant differences between groups for the following AEs: any grade 3 symptom, any general symptom, any general grade 3 symptom, fatigue, grade 3 fatigue, fever, gastrointestinal symptoms, grade 3 gastrointestinal symptoms, headache, myalgia, grade 3 myalgia, any local symptom, local pain, local redness and local swelling or consent withdrawal. No participant, in either group had grade 3 fever, grade 3 headache, any local grade 3 symptom, local grade 3 pain, local grade 3 redness, local grade 3 swelling, loss to follow‐up and serious AE. |
| Adjuvanted recombinant VZV subunit zoster vaccine: three groups of VZV subunit gE in 3 different quantities versus unadjuvanted gE or saline | 3 groups of VZV plus gE were compared in 3 different quantities, 1 group that received unadjuvanted gE and 1 group that received only saline 25 µg gE/AS01B versus 50 µg gE/AS01B There was no difference in the incidence of the following AEs: any fatigue, grade 3 fatigue, any fever, grade 3 fever, any headache, grade 3 headache, any myalgia, grade 3 myalgia, local pain, local grade 3 pain, local redness, local grade 3 redness, local swelling, local grade 3 swelling, consent withdrawal, loss to follow‐up and serious AEs. 25 µg gE/AS01B versus 100 µg gE/AS01B There were no differences in the incidence of the following AEs: any fatigue, grade 3 fatigue, any fever, any headache, grade 3 headache, any myalgia, grade 3 myalgia, local pain, grade 3 local pain, local redness, local grade 3 redness, local swelling, local grade 3 swelling, consent withdrawal, loss to follow‐up and serious AEs. 50 µg gE/AS01B versus 100 µg gE/AS01B
There were no differences in the incidence of all the others AEs: any fatigue, grade 3 fatigue, any fever, grade 3 fever, any headache, grade 3 headache, grade 3 myalgia, local pain, local grade 3 pain, local redness, local grade 3 redness, local swelling, local grade 3 swelling, consent withdrawal and serious AEs 25 µg gE/AS01B versus 100 µg gE/saline (unadjuvanted gE)
All these differences in AEs were favourable to unadjuvanted gE. There were no differences in the incidence of the following AEs: grade 3 fatigue, any fever, any headache, grade 3 headache, grade 3 myalgia, local grade 3 pain, local grade 3 redness, local grade 3 swelling, consent withdrawal, loss to follow‐up and serious AEs. No participant had grade 3 fever in either of the groups. 50 µg gE/AS01B versus 100 µg gE/saline (unadjuvanted gE)
All these differences of AEs were favourable to unadjuvanted gE. There were no differences in the incidence of the following AEs: grade 3 fatigue, any fever, grade 3 headache, grade 3 myalgia, local grade 3 pain, local grade 3 redness, local grade 3 swelling, consent withdrawal, loss to follow‐up and serious AEs. No participant had grade 3 fever in either of the groups 100 µg gE/AS01B versus 100 µg gE/saline (unadjuvanted gE)
All these differences in AEs were favourable to unadjuvanted gE. There were no differences in the incidence of the following AEs: grade 3 fatigue, any fever, grade 3 headache, grade 3 myalgia, local grade 3 pain, local grade 3 redness, local grade 3 swelling, consent withdrawal, loss to follow‐up and serious AEs. No participant had grade 3 fever in either of the groups. 25 µg gE/AS01B versus saline + 100 µg gE/AS01B
All differences in AEs were favourable to saline + 100 µg gE/AS01B. There were no differences in the incidence of the following AEs:, any fatigue, grade 3 fever, any headache, grade 3 headache, grade 3 myalgia, local grade 3 pain, local grade 3 redness, local swelling, local grade 3 swelling, consent withdrawal, loss to follow‐up and serious AEs. No participant had grade 3 fever in either of the groups. 50 µg gE/AS01B versus saline + 100 µg gE/AS01B
All differences in AEs were favourable to saline + 100 µg gE/AS01B. There were no differences in the incidence of the following AEs: grade 3 fatigue, any fever, grade 3 fever, grade 3 headache, grade 3 myalgia, local grade 3 pain, local redness, local grade 3 redness, local swelling, local grade 3 swelling, consent withdrawal, loss to follow‐up and serious AEs. 100 µg gE/AS01B versus saline + 100 µg gE/AS01B
All differences in AEs were favourable to saline + 100 µg gE/AS01B. There were no difference in the incidence of the following AEs: grade 3 fatigue, headache, grade 3 headache, grade 3 myalgia, local grade 3 pain, local grade 3 redness, local swelling, local grade 3 swelling, consent withdrawal, loss to follow‐up and serious AEs. No participant had grade 3 fever in either of the groups. Saline + 100 µg gE/AS01B versus 100 µg gE/saline (unadjuvanted gE)
All differences in AEs were favourable to 100 µg gE/saline. There were no differences in the incidence of the following AEs: any fatigue, grade 3 fatigue, any fever, any headache, any myalgia, grade 3 myalgia, local grade 3 pain, local grade 3 redness, consent withdrawal, loss to follow‐up and serious AEs. No participant had grade 3 fever, grade 3 headache and local grade 3 swelling in either of the groups. |
| Adjuvanted recombinant VZV subunit zoster vaccine (not yet available) versus placebo (Lal 2015) | The AEs related the comparison between adjuvanted recombinant VZV subunit zoster vaccine (not yet available) and placebo are shown below:
|
| AEs: adverse events | |
| Drop‐outs of all included studies | Available live attenuated VZV zoster vaccine versus placebo The pooled data from the studies that compared zoster vaccine and placebo showed no differences in the reasons for drop‐outs (Analysis 1.4): for any reason (RR 0.99, 95% CI 0.91 to 1.08) (Analysis 1.4.1) (Mills 2010; Oxman 2005; Vermeulen 2012), for death (RR 1.01, 95% CI 0.92 to 1.11) (Analysis 1.4.2) (Mills 2010; Murray 2011; Oxman 2005), for withdrawal of consent (RR 0.87, 95% CI 0.64 to 1.19) (Analysis 1.4.3) (Murray 2011; Oxman 2005; Vermeulen 2012), for loss to follow‐up (RR 1.29, 95% CI 0.97 to 1.73) (Analysis 1.4.4) (Mills 2010; Murray 2011; Oxman 2005; Vermeulen 2012), for protocol deviation (RR 1.58, 95% CI 0.41 to 6.02) (Analysis 1.4.5) (Murray 2011; Vermeulen 2012), for clinical AE (RR 1.36, 95% CI 0.73 to 2.54) (Analysis 1.4.6) (Murray 2011; Vermeulen 2012) and for physician decision (RR 0.20, 95% CI 0.01 to 4.17) (Analysis 1.4.7) (Murray 2011). In Mills 2010, Oxman 2005 and Vermeulen 2012 consent was withdrawn after the intervention. In Murray 2011, some patients apparently withdrew consent after randomisation, but the trial authors do not describe the exact number who withdrew consent after the intervention. The pooled data from the studies that compared zoster vaccine and placebo (Mills 2010; Murray 2011; Oxman 2005) showed no differences in the reasons for participants with no follow‐up (Analysis 1.5). High‐potency versus low‐potency zoster vaccine: There were no differences between the groups (Analysis 2.6). Refrigerated versus frozen zoster vaccine: There were no differences between the groups (Analysis 3.2). Zoster vaccine IM route versus zoster vaccine SC route: There were no withdrawals due to AE in either group (Analysis 6.1.15). 2 doses of a zoster vaccine versus a single dose and also 2 doses given at different intervals: There were no differences between the groups for participants with withdrawal due to AE (Analysis 7.1.5; Analysis 7.2.5; Analysis 7.3.5) (Vesikari 2013). Adjuvanted recombinant VZV subunit zoster vaccine (not yet available) ‐ lower or higher volumes of adjuvants plus gE subunit VZV or unadjuvanted gE or saline injections: There were no differences between the groups for the following reasons of drop‐out: participants with consent withdrawal and participants with loss to follow‐up (Chlibek 2013). 3 groups of VZV subunit gE in 3 different quantities versus unadjuvanted gE or saline: There were no differences between groups for participants with withdrawal of consent or participants with loss to follow‐up for all comparisons provided (Chlibek 2014). Adjuvanted recombinant VZV subunit zoster vaccine not yet available versus placebo:Lal 2015 described 3 reasons to drop‐out: did not receive vaccine according to protocol (Analysis 10.3.1), received wrong vaccine (Analysis 10.3.2) and had diagnosis of HZ less than 30 days after dose 2 (Analysis 10.3.3). For the first 2 there were no differences between the groups. The last outcome had a RR of 0.29 (95% CI 0.09 to 0.87) but no RD and we considered it as drop‐out and not an incidence outcome since it is related to participants aged > 50 years old and not with our age group of interest (participants 60 years old or more). |
| AE: adverse event | |
| Outcome or subgroup title | No. of studies | No. of participants | Statistical method | Effect size |
| 1 Incidence of herpes zoster Show forest plot | 2 | Risk Ratio (M‐H, Fixed, 95% CI) | Totals not selected | |
| 1.1 3.1 years follow‐up | 1 | Risk Ratio (M‐H, Fixed, 95% CI) | 0.0 [0.0, 0.0] | |
| 1.2 30 days of vaccination | 1 | Risk Ratio (M‐H, Fixed, 95% CI) | 0.0 [0.0, 0.0] | |
| 1.3 42 days of vaccination | 2 | Risk Ratio (M‐H, Fixed, 95% CI) | 0.0 [0.0, 0.0] | |
| 1.4 3.3 to 7.8 years after vaccination substudy | 1 | Risk Ratio (M‐H, Fixed, 95% CI) | 0.0 [0.0, 0.0] | |
| 1.5 Mean 5 years follow‐up | 1 | Risk Ratio (M‐H, Fixed, 95% CI) | 0.0 [0.0, 0.0] | |
| 2 Incidence of herpes zoster with ZBPI ADL. Severity of interference scores of 300 or greater (high score is worse) Show forest plot | 1 | Risk Ratio (M‐H, Fixed, 95% CI) | Totals not selected | |
| 3 Participants with AEs Show forest plot | 4 | Risk Ratio (M‐H, Fixed, 95% CI) | Subtotals only | |
| 3.1 One or more AEs | 3 | 6986 | Risk Ratio (M‐H, Fixed, 95% CI) | 1.70 [1.61, 1.80] |
| 3.2 Vaccine‐related AEs | 1 | 209 | Risk Ratio (M‐H, Fixed, 95% CI) | 4.63 [2.64, 8.12] |
| 3.3 Systemic AEs | 3 | 6986 | Risk Ratio (M‐H, Fixed, 95% CI) | 1.07 [0.98, 1.16] |
| 3.4 Systemic pruritus | 1 | 209 | Risk Ratio (M‐H, Fixed, 95% CI) | 7.07 [0.37, 135.13] |
| 3.5 Vaccine‐related systemic AEs | 2 | 6777 | Risk Ratio (M‐H, Fixed, 95% CI) | 1.29 [1.06, 1.57] |
| 3.6 Varicella‐like rash not at injection site (day of vaccination to day 42) | 2 | 38755 | Risk Ratio (M‐H, Fixed, 95% CI) | 1.12 [0.58, 2.18] |
| 3.7 Herpes zoster‐like rash (day of vaccination to day 42) | 1 | 38546 | Risk Ratio (M‐H, Fixed, 95% CI) | 0.47 [0.27, 0.84] |
| 3.8 Rash unrelated to herpes zoster (day of vaccination to day 42) | 1 | 38546 | Risk Ratio (M‐H, Fixed, 95% CI) | 0.96 [0.86, 1.07] |
| 3.9 ≥ 1 serious AEs regardless of type of storage of the vaccine | 4 | 50896 | Risk Ratio (M‐H, Fixed, 95% CI) | 1.08 [0.96, 1.20] |
| 3.10 Vaccine‐related serious AEs | 3 | 50687 | Risk Ratio (M‐H, Fixed, 95% CI) | 1.00 [0.25, 4.00] |
| 3.11 Discontinued due to vaccine‐related AEs | 2 | 370 | Risk Ratio (M‐H, Fixed, 95% CI) | 5.05 [0.25, 103.88] |
| 3.12 Hospitalised | 1 | 6616 | Risk Ratio (M‐H, Fixed, 95% CI) | 1.00 [0.93, 1.07] |
| 3.13 Hospitalisation related to herpes zoster | 1 | 6616 | Risk Ratio (M‐H, Fixed, 95% CI) | 0.81 [0.25, 2.67] |
| 3.14 Injection site AEs | 3 | 6986 | Risk Ratio (M‐H, Fixed, 95% CI) | 2.99 [2.75, 3.26] |
| 3.15 Erythema inoculation site | 2 | 6825 | Risk Ratio (M‐H, Fixed, 95% CI) | 5.15 [4.51, 5.87] |
| 3.16 Pain inoculation site | 2 | 6825 | Risk Ratio (M‐H, Fixed, 95% CI) | 4.14 [3.67, 4.68] |
| 3.17 Pruritus inoculation site | 2 | 6825 | Risk Ratio (M‐H, Fixed, 95% CI) | 6.91 [4.87, 9.82] |
| 3.18 Swelling inoculation site | 2 | 6825 | Risk Ratio (M‐H, Fixed, 95% CI) | 5.85 [4.96, 6.91] |
| 3.19 Warmth inoculation site | 2 | 6825 | Risk Ratio (M‐H, Fixed, 95% CI) | 5.15 [2.75, 9.66] |
| 3.20 Rash inoculation site | 1 | 6616 | Risk Ratio (M‐H, Fixed, 95% CI) | 3.26 [1.31, 8.11] |
| 3.21 Haematoma inoculation site | 1 | 6616 | Risk Ratio (M‐H, Fixed, 95% CI) | 1.13 [0.76, 1.67] |
| 3.22 Mass inoculation site | 1 | 6616 | Risk Ratio (M‐H, Fixed, 95% CI) | 14.67 [3.51, 61.33] |
| 3.23 Varicella‐like rash at injection site (day of vaccination to day 42) | 1 | 38546 | Risk Ratio (M‐H, Fixed, 95% CI) | 2.86 [1.21, 6.76] |
| 4 Drop‐outs Show forest plot | 4 | Risk Ratio (M‐H, Fixed, 95% CI) | Subtotals only | |
| 4.1 For any reason | 3 | 38916 | Risk Ratio (M‐H, Fixed, 95% CI) | 0.99 [0.91, 1.08] |
| 4.2 Death | 3 | 50687 | Risk Ratio (M‐H, Fixed, 95% CI) | 1.01 [0.92, 1.11] |
| 4.3 Withdrew consent | 3 | 50735 | Risk Ratio (M‐H, Fixed, 95% CI) | 0.87 [0.64, 1.19] |
| 4.4 Lost to follow‐up | 3 | 50735 | Risk Ratio (M‐H, Fixed, 95% CI) | 1.29 [0.97, 1.73] |
| 4.5 Protocol deviation | 2 | 12189 | Risk Ratio (M‐H, Fixed, 95% CI) | 1.58 [0.41, 6.02] |
| 4.6 Clinical adverse event | 2 | 12189 | Risk Ratio (M‐H, Fixed, 95% CI) | 1.36 [0.73, 2.54] |
| 4.7 Physician decision | 1 | 11980 | Risk Ratio (M‐H, Fixed, 95% CI) | 0.20 [0.01, 4.17] |
| 5 Participants with no follow‐up Show forest plot | 3 | Risk Ratio (M‐H, Fixed, 95% CI) | Totals not selected | |
| Outcome or subgroup title | No. of studies | No. of participants | Statistical method | Effect size |
| 1 Incidence of herpes zoster Show forest plot | 1 | Risk Ratio (M‐H, Fixed, 95% CI) | Totals not selected | |
| 2 Vaccine‐related adverse effects Show forest plot | 1 | Risk Ratio (M‐H, Fixed, 95% CI) | Totals not selected | |
| 3 Vaccine‐related systemic adverse effects Show forest plot | 1 | Risk Ratio (M‐H, Fixed, 95% CI) | Totals not selected | |
| 4 Vaccine‐related serious adverse effects Show forest plot | 1 | Risk Ratio (M‐H, Fixed, 95% CI) | Totals not selected | |
| 4.1 Death | 1 | Risk Ratio (M‐H, Fixed, 95% CI) | 0.0 [0.0, 0.0] | |
| 5 Injection site vaccine‐related adverse effects Show forest plot | 1 | Risk Ratio (M‐H, Fixed, 95% CI) | Totals not selected | |
| 5.1 Erythema | 1 | Risk Ratio (M‐H, Fixed, 95% CI) | 0.0 [0.0, 0.0] | |
| 5.2 Pain | 1 | Risk Ratio (M‐H, Fixed, 95% CI) | 0.0 [0.0, 0.0] | |
| 5.3 Swelling | 1 | Risk Ratio (M‐H, Fixed, 95% CI) | 0.0 [0.0, 0.0] | |
| 5.4 Pruritus | 1 | Risk Ratio (M‐H, Fixed, 95% CI) | 0.0 [0.0, 0.0] | |
| 6 Participants with no follow‐up Show forest plot | 1 | Risk Ratio (M‐H, Fixed, 95% CI) | Totals not selected | |
| Outcome or subgroup title | No. of studies | No. of participants | Statistical method | Effect size |
| 1 Participants with adverse effects Show forest plot | 1 | Risk Ratio (M‐H, Fixed, 95% CI) | Totals not selected | |
| 1.1 One or more adverse effects | 1 | Risk Ratio (M‐H, Fixed, 95% CI) | 0.0 [0.0, 0.0] | |
| 1.2 Vaccine‐related adverse effects | 1 | Risk Ratio (M‐H, Fixed, 95% CI) | 0.0 [0.0, 0.0] | |
| 1.3 Systemic adverse effects | 1 | Risk Ratio (M‐H, Fixed, 95% CI) | 0.0 [0.0, 0.0] | |
| 1.4 Systemic vaccine‐related adverse effects | 1 | Risk Ratio (M‐H, Fixed, 95% CI) | 0.0 [0.0, 0.0] | |
| 1.5 Serious adverse effects | 1 | Risk Ratio (M‐H, Fixed, 95% CI) | 0.0 [0.0, 0.0] | |
| 1.6 Vaccine‐related serious adverse effects | 1 | Risk Ratio (M‐H, Fixed, 95% CI) | 0.0 [0.0, 0.0] | |
| 1.7 Death | 1 | Risk Ratio (M‐H, Fixed, 95% CI) | 0.0 [0.0, 0.0] | |
| 1.8 Injection site adverse effects | 1 | Risk Ratio (M‐H, Fixed, 95% CI) | 0.0 [0.0, 0.0] | |
| 1.9 Injection site vaccine‐related adverse effects | 1 | Risk Ratio (M‐H, Fixed, 95% CI) | 0.0 [0.0, 0.0] | |
| 1.10 Discontinued due to any adverse effects | 1 | Risk Ratio (M‐H, Fixed, 95% CI) | 0.0 [0.0, 0.0] | |
| 1.11 Discontinued due to a vaccine‐related adverse effect | 1 | Risk Ratio (M‐H, Fixed, 95% CI) | 0.0 [0.0, 0.0] | |
| 2 Participants with no follow‐up Show forest plot | 1 | Risk Ratio (M‐H, Fixed, 95% CI) | Totals not selected | |
| Outcome or subgroup title | No. of studies | No. of participants | Statistical method | Effect size |
| 1 Incidence of herpes zoster Show forest plot | 1 | Risk Ratio (M‐H, Fixed, 95% CI) | Totals not selected | |
| Outcome or subgroup title | No. of studies | No. of participants | Statistical method | Effect size |
| 1 3200 pfu VZV/dose Show forest plot | 1 | Risk Ratio (M‐H, Fixed, 95% CI) | Totals not selected | |
| 1.1 ≥ 1 reaction injection site | 1 | Risk Ratio (M‐H, Fixed, 95% CI) | 0.0 [0.0, 0.0] | |
| 1.2 Induration (diameter ≥ 2 cm injection site) | 1 | Risk Ratio (M‐H, Fixed, 95% CI) | 0.0 [0.0, 0.0] | |
| 1.3 Pain injection site | 1 | Risk Ratio (M‐H, Fixed, 95% CI) | 0.0 [0.0, 0.0] | |
| 1.4 Pain (injection site, probably vaccine‐related) | 1 | Risk Ratio (M‐H, Fixed, 95% CI) | 0.0 [0.0, 0.0] | |
| 1.5 Redness injection site (diameter ≥ 2 cm) | 1 | Risk Ratio (M‐H, Fixed, 95% CI) | 0.0 [0.0, 0.0] | |
| 1.6 Pruritus injection site | 1 | Risk Ratio (M‐H, Fixed, 95% CI) | 0.0 [0.0, 0.0] | |
| 1.7 Vesicles at injection site | 1 | Risk Ratio (M‐H, Fixed, 95% CI) | 0.0 [0.0, 0.0] | |
| 2 8500 pfu VZV/dose Show forest plot | 1 | Risk Ratio (M‐H, Fixed, 95% CI) | Totals not selected | |
| 2.1 ≥ 1 reaction injection site | 1 | Risk Ratio (M‐H, Fixed, 95% CI) | 0.0 [0.0, 0.0] | |
| 2.2 Induration (diameter ≥ 2 cm injection site) | 1 | Risk Ratio (M‐H, Fixed, 95% CI) | 0.0 [0.0, 0.0] | |
| 2.3 Pain injection site | 1 | Risk Ratio (M‐H, Fixed, 95% CI) | 0.0 [0.0, 0.0] | |
| 2.4 Pain (injection site, probably vaccine‐related) | 1 | Risk Ratio (M‐H, Fixed, 95% CI) | 0.0 [0.0, 0.0] | |
| 2.5 Redness injection site (diameter ≥ 2 cm) | 1 | Risk Ratio (M‐H, Fixed, 95% CI) | 0.0 [0.0, 0.0] | |
| 2.6 Pruritus injection site | 1 | Risk Ratio (M‐H, Fixed, 95% CI) | 0.0 [0.0, 0.0] | |
| 2.7 Vesicle injection site | 1 | Risk Ratio (M‐H, Fixed, 95% CI) | 0.0 [0.0, 0.0] | |
| 3 41,650 pfu/dose Show forest plot | 1 | Risk Ratio (M‐H, Fixed, 95% CI) | Totals not selected | |
| 3.1 ≥ 1 reaction injection site | 1 | Risk Ratio (M‐H, Fixed, 95% CI) | 0.0 [0.0, 0.0] | |
| 3.2 Induration (diameter ≥ 2 cm injection site) | 1 | Risk Ratio (M‐H, Fixed, 95% CI) | 0.0 [0.0, 0.0] | |
| 3.3 Pain injection site | 1 | Risk Ratio (M‐H, Fixed, 95% CI) | 0.0 [0.0, 0.0] | |
| 3.4 Pain (injection site, probably vaccine‐related) | 1 | Risk Ratio (M‐H, Fixed, 95% CI) | 0.0 [0.0, 0.0] | |
| 3.5 Redness injection site (diameter ≥ 2 cm) | 1 | Risk Ratio (M‐H, Fixed, 95% CI) | 0.0 [0.0, 0.0] | |
| 3.6 Pruritus injection site | 1 | Risk Ratio (M‐H, Fixed, 95% CI) | 0.0 [0.0, 0.0] | |
| 3.7 Vesicle injection site | 1 | Risk Ratio (M‐H, Fixed, 95% CI) | 0.0 [0.0, 0.0] | |
| 4 Duration in days of adverse effects Show forest plot | 1 | Mean Difference (IV, Fixed, 95% CI) | Totals not selected | |
| 4.1 Erythema | 1 | Mean Difference (IV, Fixed, 95% CI) | 0.0 [0.0, 0.0] | |
| 4.2 Swelling | 1 | Mean Difference (IV, Fixed, 95% CI) | 0.0 [0.0, 0.0] | |
| 4.3 Pain | 1 | Mean Difference (IV, Fixed, 95% CI) | 0.0 [0.0, 0.0] | |
| 4.4 Rash | 1 | Mean Difference (IV, Fixed, 95% CI) | 0.0 [0.0, 0.0] | |
| 4.5 Pruritus | 1 | Mean Difference (IV, Fixed, 95% CI) | 0.0 [0.0, 0.0] | |
| 4.6 Haematoma | 1 | Mean Difference (IV, Fixed, 95% CI) | 0.0 [0.0, 0.0] | |
| Outcome or subgroup title | No. of studies | No. of participants | Statistical method | Effect size |
| 1 Participants with adverse events Show forest plot | 1 | Risk Ratio (M‐H, Fixed, 95% CI) | Totals not selected | |
| 1.1 At least one AE | 1 | Risk Ratio (M‐H, Fixed, 95% CI) | 0.0 [0.0, 0.0] | |
| 1.2 Vaccine‐related AE | 1 | Risk Ratio (M‐H, Fixed, 95% CI) | 0.0 [0.0, 0.0] | |
| 1.3 All systemic AE | 1 | Risk Ratio (M‐H, Fixed, 95% CI) | 0.0 [0.0, 0.0] | |
| 1.4 Vaccine‐related systemic AE | 1 | Risk Ratio (M‐H, Fixed, 95% CI) | 0.0 [0.0, 0.0] | |
| 1.5 Headache considered as vaccine‐related by the investigator | 1 | Risk Ratio (M‐H, Fixed, 95% CI) | 0.0 [0.0, 0.0] | |
| 1.6 Solicited injection site reaction | 1 | Risk Ratio (M‐H, Fixed, 95% CI) | 0.0 [0.0, 0.0] | |
| 1.7 Unsolicited injection site reaction | 1 | Risk Ratio (M‐H, Fixed, 95% CI) | 0.0 [0.0, 0.0] | |
| 1.8 Injection site erythema | 1 | Risk Ratio (M‐H, Fixed, 95% CI) | 0.0 [0.0, 0.0] | |
| 1.9 Severe injection site erythema (> 10 cm) | 1 | Risk Ratio (M‐H, Fixed, 95% CI) | 0.0 [0.0, 0.0] | |
| 1.10 Injection site pain | 1 | Risk Ratio (M‐H, Fixed, 95% CI) | 0.0 [0.0, 0.0] | |
| 1.11 Severe injection site pain (inability to work or usual activity) | 1 | Risk Ratio (M‐H, Fixed, 95% CI) | 0.0 [0.0, 0.0] | |
| 1.12 Injection site swelling | 1 | Risk Ratio (M‐H, Fixed, 95% CI) | 0.0 [0.0, 0.0] | |
| 1.13 Severe injection site swelling (> 10 cm) | 1 | Risk Ratio (M‐H, Fixed, 95% CI) | 0.0 [0.0, 0.0] | |
| 1.14 Injection site pruritus | 1 | Risk Ratio (M‐H, Fixed, 95% CI) | 0.0 [0.0, 0.0] | |
| 1.15 Withdrawal due to AE | 1 | Risk Ratio (M‐H, Fixed, 95% CI) | 0.0 [0.0, 0.0] | |
| Outcome or subgroup title | No. of studies | No. of participants | Statistical method | Effect size |
| 1 Zoster vaccine 1 month schedule versus zoster vaccine 3 month schedule Show forest plot | 1 | Risk Ratio (M‐H, Fixed, 95% CI) | Totals not selected | |
| 1.1 Participants with AE | 1 | Risk Ratio (M‐H, Fixed, 95% CI) | 0.0 [0.0, 0.0] | |
| 1.2 Participants with vaccine‐related AE | 1 | Risk Ratio (M‐H, Fixed, 95% CI) | 0.0 [0.0, 0.0] | |
| 1.3 Participants with serious AE | 1 | Risk Ratio (M‐H, Fixed, 95% CI) | 0.0 [0.0, 0.0] | |
| 1.4 Participants with vaccine‐related serious AE | 1 | Risk Ratio (M‐H, Fixed, 95% CI) | 0.0 [0.0, 0.0] | |
| 1.5 Participants with withdrawal due to AE | 1 | Risk Ratio (M‐H, Fixed, 95% CI) | 0.0 [0.0, 0.0] | |
| 1.6 Participants with vaccine‐related withdrawal due to AE | 1 | Risk Ratio (M‐H, Fixed, 95% CI) | 0.0 [0.0, 0.0] | |
| 1.7 Participants with non‐serious vaccine‐related withdrawal due to AE | 1 | Risk Ratio (M‐H, Fixed, 95% CI) | 0.0 [0.0, 0.0] | |
| 1.8 Participants with systemic AE | 1 | Risk Ratio (M‐H, Fixed, 95% CI) | 0.0 [0.0, 0.0] | |
| 1.9 Participants with vaccine‐related systemic AE | 1 | Risk Ratio (M‐H, Fixed, 95% CI) | 0.0 [0.0, 0.0] | |
| 1.10 Participants with rash of interest non‐injection site rashes | 1 | Risk Ratio (M‐H, Fixed, 95% CI) | 0.0 [0.0, 0.0] | |
| 1.11 Participants with varicella/varicella‐like rash | 1 | Risk Ratio (M‐H, Fixed, 95% CI) | 0.0 [0.0, 0.0] | |
| 1.12 Participants with herpes zoster/zoster‐like rash | 1 | Risk Ratio (M‐H, Fixed, 95% CI) | 0.0 [0.0, 0.0] | |
| 1.13 Participants with injection site reaction | 1 | Risk Ratio (M‐H, Fixed, 95% CI) | 0.0 [0.0, 0.0] | |
| 1.14 Participants with solicited injection site reaction | 1 | Risk Ratio (M‐H, Fixed, 95% CI) | 0.0 [0.0, 0.0] | |
| 1.15 Participants with unsolicited injection site reaction | 1 | Risk Ratio (M‐H, Fixed, 95% CI) | 0.0 [0.0, 0.0] | |
| 1.16 Participants with erythema injection site | 1 | Risk Ratio (M‐H, Fixed, 95% CI) | 0.0 [0.0, 0.0] | |
| 1.17 Participants with pain injection site | 1 | Risk Ratio (M‐H, Fixed, 95% CI) | 0.0 [0.0, 0.0] | |
| 1.18 Participants with swelling injection site | 1 | Risk Ratio (M‐H, Fixed, 95% CI) | 0.0 [0.0, 0.0] | |
| 2 Zoster vaccine 1 month schedule versus zoster vaccine single dose Show forest plot | 1 | Risk Ratio (M‐H, Fixed, 95% CI) | Totals not selected | |
| 2.1 Participants with adverse events | 1 | Risk Ratio (M‐H, Fixed, 95% CI) | 0.0 [0.0, 0.0] | |
| 2.2 Participants with vaccine‐related AE | 1 | Risk Ratio (M‐H, Fixed, 95% CI) | 0.0 [0.0, 0.0] | |
| 2.3 Participants with serious AE | 1 | Risk Ratio (M‐H, Fixed, 95% CI) | 0.0 [0.0, 0.0] | |
| 2.4 Participants with vaccine‐related serious AE | 1 | Risk Ratio (M‐H, Fixed, 95% CI) | 0.0 [0.0, 0.0] | |
| 2.5 Participants with withdrawal due to AE | 1 | Risk Ratio (M‐H, Fixed, 95% CI) | 0.0 [0.0, 0.0] | |
| 2.6 Participants with vaccine‐related withdrawal due to AE | 1 | Risk Ratio (M‐H, Fixed, 95% CI) | 0.0 [0.0, 0.0] | |
| 2.7 Participants with non‐serious vaccine‐related withdrawal due to AE | 1 | Risk Ratio (M‐H, Fixed, 95% CI) | 0.0 [0.0, 0.0] | |
| 2.8 Participants with systemic AE | 1 | Risk Ratio (M‐H, Fixed, 95% CI) | 0.0 [0.0, 0.0] | |
| 2.9 Participants with vaccine‐related systemic AE | 1 | Risk Ratio (M‐H, Fixed, 95% CI) | 0.0 [0.0, 0.0] | |
| 2.10 Participants with rash of interest non‐injection site rashes | 1 | Risk Ratio (M‐H, Fixed, 95% CI) | 0.0 [0.0, 0.0] | |
| 2.11 Participants with varicella/varicella‐like rash | 1 | Risk Ratio (M‐H, Fixed, 95% CI) | 0.0 [0.0, 0.0] | |
| 2.12 Participants with herpes zoster/zoster‐like rash | 1 | Risk Ratio (M‐H, Fixed, 95% CI) | 0.0 [0.0, 0.0] | |
| 2.13 Participants with injection site reaction | 1 | Risk Ratio (M‐H, Fixed, 95% CI) | 0.0 [0.0, 0.0] | |
| 2.14 Participants with solicited injection site reaction | 1 | Risk Ratio (M‐H, Fixed, 95% CI) | 0.0 [0.0, 0.0] | |
| 2.15 Participants with unsolicited injection site reaction | 1 | Risk Ratio (M‐H, Fixed, 95% CI) | 0.0 [0.0, 0.0] | |
| 2.16 Participants with erythema injection site | 1 | Risk Ratio (M‐H, Fixed, 95% CI) | 0.0 [0.0, 0.0] | |
| 2.17 Participants with pain injection site | 1 | Risk Ratio (M‐H, Fixed, 95% CI) | 0.0 [0.0, 0.0] | |
| 2.18 Participants with swelling injection site | 1 | Risk Ratio (M‐H, Fixed, 95% CI) | 0.0 [0.0, 0.0] | |
| 3 Zoster vaccine 3 month schedule versus zoster vaccine single dose Show forest plot | 1 | Risk Ratio (M‐H, Fixed, 95% CI) | Totals not selected | |
| 3.1 Participants with AE | 1 | Risk Ratio (M‐H, Fixed, 95% CI) | 0.0 [0.0, 0.0] | |
| 3.2 Participants with vaccine‐related AE | 1 | Risk Ratio (M‐H, Fixed, 95% CI) | 0.0 [0.0, 0.0] | |
| 3.3 Participants with serious AE | 1 | Risk Ratio (M‐H, Fixed, 95% CI) | 0.0 [0.0, 0.0] | |
| 3.4 Participants with vaccine‐related serious AE | 1 | Risk Ratio (M‐H, Fixed, 95% CI) | 0.0 [0.0, 0.0] | |
| 3.5 Participants with withdrawal due to AE | 1 | Risk Ratio (M‐H, Fixed, 95% CI) | 0.0 [0.0, 0.0] | |
| 3.6 Participants with vaccine‐related withdrawal due to AE | 1 | Risk Ratio (M‐H, Fixed, 95% CI) | 0.0 [0.0, 0.0] | |
| 3.7 Participants with non‐serious vaccine‐related withdrawal due to AE | 1 | Risk Ratio (M‐H, Fixed, 95% CI) | 0.0 [0.0, 0.0] | |
| 3.8 Participants with systemic AE | 1 | Risk Ratio (M‐H, Fixed, 95% CI) | 0.0 [0.0, 0.0] | |
| 3.9 Participants with vaccine‐related systemic AE | 1 | Risk Ratio (M‐H, Fixed, 95% CI) | 0.0 [0.0, 0.0] | |
| 3.10 Participants with rash of interest non‐injection site rashes | 1 | Risk Ratio (M‐H, Fixed, 95% CI) | 0.0 [0.0, 0.0] | |
| 3.11 Participants with varicella/varicella‐like rash | 1 | Risk Ratio (M‐H, Fixed, 95% CI) | 0.0 [0.0, 0.0] | |
| 3.12 Participants with herpes zoster/zoster‐like rash | 1 | Risk Ratio (M‐H, Fixed, 95% CI) | 0.0 [0.0, 0.0] | |
| 3.13 Participants with injection site reaction | 1 | Risk Ratio (M‐H, Fixed, 95% CI) | 0.0 [0.0, 0.0] | |
| 3.14 Participants with solicited injection site reaction | 1 | Risk Ratio (M‐H, Fixed, 95% CI) | 0.0 [0.0, 0.0] | |
| 3.15 Participants with unsolicited injection site reaction | 1 | Risk Ratio (M‐H, Fixed, 95% CI) | 0.0 [0.0, 0.0] | |
| 3.16 Participants with erythema injection site | 1 | Risk Ratio (M‐H, Fixed, 95% CI) | 0.0 [0.0, 0.0] | |
| 3.17 Participants with pain injection site | 1 | Risk Ratio (M‐H, Fixed, 95% CI) | 0.0 [0.0, 0.0] | |
| 3.18 Participants with swelling injection site | 1 | Risk Ratio (M‐H, Fixed, 95% CI) | 0.0 [0.0, 0.0] | |
| Outcome or subgroup title | No. of studies | No. of participants | Statistical method | Effect size |
| 1 50 μg gE/AS01E versus 50 μg gE/AS01B Show forest plot | 1 | Risk Ratio (M‐H, Fixed, 95% CI) | Totals not selected | |
| 1.1 Participants with any symptom | 1 | Risk Ratio (M‐H, Fixed, 95% CI) | 0.0 [0.0, 0.0] | |
| 1.2 Participants with any grade 3 symptom | 1 | Risk Ratio (M‐H, Fixed, 95% CI) | 0.0 [0.0, 0.0] | |
| 1.3 Participants with any general symptom | 1 | Risk Ratio (M‐H, Fixed, 95% CI) | 0.0 [0.0, 0.0] | |
| 1.4 Participants with any grade 3 general symptom | 1 | Risk Ratio (M‐H, Fixed, 95% CI) | 0.0 [0.0, 0.0] | |
| 1.5 Participants with fatigue | 1 | Risk Ratio (M‐H, Fixed, 95% CI) | 0.0 [0.0, 0.0] | |
| 1.6 Participants with grade 3 fatigue | 1 | Risk Ratio (M‐H, Fixed, 95% CI) | 0.0 [0.0, 0.0] | |
| 1.7 Participants with fever | 1 | Risk Ratio (M‐H, Fixed, 95% CI) | 0.0 [0.0, 0.0] | |
| 1.8 Participants with grade 3 fever | 1 | Risk Ratio (M‐H, Fixed, 95% CI) | 0.0 [0.0, 0.0] | |
| 1.9 Participants with gastrointestinal symptom | 1 | Risk Ratio (M‐H, Fixed, 95% CI) | 0.0 [0.0, 0.0] | |
| 1.10 Participants with grade 3 gastrointestinal symptom | 1 | Risk Ratio (M‐H, Fixed, 95% CI) | 0.0 [0.0, 0.0] | |
| 1.11 Participants with headache | 1 | Risk Ratio (M‐H, Fixed, 95% CI) | 0.0 [0.0, 0.0] | |
| 1.12 Participants with grade 3 headache | 1 | Risk Ratio (M‐H, Fixed, 95% CI) | 0.0 [0.0, 0.0] | |
| 1.13 Participants with myalgia | 1 | Risk Ratio (M‐H, Fixed, 95% CI) | 0.0 [0.0, 0.0] | |
| 1.14 Participants with grade 3 myalgia | 1 | Risk Ratio (M‐H, Fixed, 95% CI) | 0.0 [0.0, 0.0] | |
| 1.15 Participants with any local symptom | 1 | Risk Ratio (M‐H, Fixed, 95% CI) | 0.0 [0.0, 0.0] | |
| 1.16 Participants with any grade 3 local symptom | 1 | Risk Ratio (M‐H, Fixed, 95% CI) | 0.0 [0.0, 0.0] | |
| 1.17 Participants with local pain | 1 | Risk Ratio (M‐H, Fixed, 95% CI) | 0.0 [0.0, 0.0] | |
| 1.18 Participants with grade 3 local pain | 1 | Risk Ratio (M‐H, Fixed, 95% CI) | 0.0 [0.0, 0.0] | |
| 1.19 Participants with local redness | 1 | Risk Ratio (M‐H, Fixed, 95% CI) | 0.0 [0.0, 0.0] | |
| 1.20 Participants with grade 3 local redness | 1 | Risk Ratio (M‐H, Fixed, 95% CI) | 0.0 [0.0, 0.0] | |
| 1.21 Participants with local swelling | 1 | Risk Ratio (M‐H, Fixed, 95% CI) | 0.0 [0.0, 0.0] | |
| 1.22 Participants with grade 3 local swelling | 1 | Risk Ratio (M‐H, Fixed, 95% CI) | 0.0 [0.0, 0.0] | |
| 1.23 Participants with consent withdrawal | 1 | Risk Ratio (M‐H, Fixed, 95% CI) | 0.0 [0.0, 0.0] | |
| 1.24 Participants with lost follow‐up | 1 | Risk Ratio (M‐H, Fixed, 95% CI) | 0.0 [0.0, 0.0] | |
| 1.25 Participants with serious AE | 1 | Risk Ratio (M‐H, Fixed, 95% CI) | 0.0 [0.0, 0.0] | |
| 2 50 μg gE/AS01E versus 50 μg gE/saline (unadjuvanted gE) Show forest plot | 1 | Risk Ratio (M‐H, Fixed, 95% CI) | Totals not selected | |
| 2.1 Participants with any symptom | 1 | Risk Ratio (M‐H, Fixed, 95% CI) | 0.0 [0.0, 0.0] | |
| 2.2 Participants with any grade 3 symptom | 1 | Risk Ratio (M‐H, Fixed, 95% CI) | 0.0 [0.0, 0.0] | |
| 2.3 Participants with any general symptom | 1 | Risk Ratio (M‐H, Fixed, 95% CI) | 0.0 [0.0, 0.0] | |
| 2.4 Participants with any grade 3 general symptom | 1 | Risk Ratio (M‐H, Fixed, 95% CI) | 0.0 [0.0, 0.0] | |
| 2.5 Participants with fatigue | 1 | Risk Ratio (M‐H, Fixed, 95% CI) | 0.0 [0.0, 0.0] | |
| 2.6 Participants with grade 3 fatigue | 1 | Risk Ratio (M‐H, Fixed, 95% CI) | 0.0 [0.0, 0.0] | |
| 2.7 Participants with fever | 1 | Risk Ratio (M‐H, Fixed, 95% CI) | 0.0 [0.0, 0.0] | |
| 2.8 Participants with grade 3 fever | 1 | Risk Ratio (M‐H, Fixed, 95% CI) | 0.0 [0.0, 0.0] | |
| 2.9 Participants with gastrointestinal symptom | 1 | Risk Ratio (M‐H, Fixed, 95% CI) | 0.0 [0.0, 0.0] | |
| 2.10 Participants with grade 3 gastrointestinal symptom | 1 | Risk Ratio (M‐H, Fixed, 95% CI) | 0.0 [0.0, 0.0] | |
| 2.11 Participants with headache | 1 | Risk Ratio (M‐H, Fixed, 95% CI) | 0.0 [0.0, 0.0] | |
| 2.12 Participants with grade 3 headache | 1 | Risk Ratio (M‐H, Fixed, 95% CI) | 0.0 [0.0, 0.0] | |
| 2.13 Participants with myalgia | 1 | Risk Ratio (M‐H, Fixed, 95% CI) | 0.0 [0.0, 0.0] | |
| 2.14 Participants with grade 3 myalgia | 1 | Risk Ratio (M‐H, Fixed, 95% CI) | 0.0 [0.0, 0.0] | |
| 2.15 Participants with any local symptom | 1 | Risk Ratio (M‐H, Fixed, 95% CI) | 0.0 [0.0, 0.0] | |
| 2.16 Participants with any grade 3 local symptom | 1 | Risk Ratio (M‐H, Fixed, 95% CI) | 0.0 [0.0, 0.0] | |
| 2.17 Participants with local pain | 1 | Risk Ratio (M‐H, Fixed, 95% CI) | 0.0 [0.0, 0.0] | |
| 2.18 Participants with grade 3 local pain | 1 | Risk Ratio (M‐H, Fixed, 95% CI) | 0.0 [0.0, 0.0] | |
| 2.19 Participants with local redness | 1 | Risk Ratio (M‐H, Fixed, 95% CI) | 0.0 [0.0, 0.0] | |
| 2.20 Participants with grade 3 local redness | 1 | Risk Ratio (M‐H, Fixed, 95% CI) | 0.0 [0.0, 0.0] | |
| 2.21 Participants with local swelling | 1 | Risk Ratio (M‐H, Fixed, 95% CI) | 0.0 [0.0, 0.0] | |
| 2.22 Participants with grade 3 local swelling | 1 | Risk Ratio (M‐H, Fixed, 95% CI) | 0.0 [0.0, 0.0] | |
| 2.23 Participants with consent withdrawal | 1 | Risk Ratio (M‐H, Fixed, 95% CI) | 0.0 [0.0, 0.0] | |
| 2.24 Participants with lost follow‐up | 1 | Risk Ratio (M‐H, Fixed, 95% CI) | 0.0 [0.0, 0.0] | |
| 2.25 Participants with serious AE | 1 | Risk Ratio (M‐H, Fixed, 95% CI) | 0.0 [0.0, 0.0] | |
| 3 50 μg gE/AS01B versus 50 μg gE/saline (unadjuvanted gE) Show forest plot | 1 | Risk Ratio (M‐H, Fixed, 95% CI) | Totals not selected | |
| 3.1 Participants with any symptom | 1 | Risk Ratio (M‐H, Fixed, 95% CI) | 0.0 [0.0, 0.0] | |
| 3.2 Participants with any grade 3 symptom | 1 | Risk Ratio (M‐H, Fixed, 95% CI) | 0.0 [0.0, 0.0] | |
| 3.3 Participants with any general symptom | 1 | Risk Ratio (M‐H, Fixed, 95% CI) | 0.0 [0.0, 0.0] | |
| 3.4 Participants with any grade 3 general symptom | 1 | Risk Ratio (M‐H, Fixed, 95% CI) | 0.0 [0.0, 0.0] | |
| 3.5 Participants with fatigue | 1 | Risk Ratio (M‐H, Fixed, 95% CI) | 0.0 [0.0, 0.0] | |
| 3.6 Participants with grade 3 fatigue | 1 | Risk Ratio (M‐H, Fixed, 95% CI) | 0.0 [0.0, 0.0] | |
| 3.7 Participants with fever | 1 | Risk Ratio (M‐H, Fixed, 95% CI) | 0.0 [0.0, 0.0] | |
| 3.8 Participants with grade 3 fever | 1 | Risk Ratio (M‐H, Fixed, 95% CI) | 0.0 [0.0, 0.0] | |
| 3.9 Participants with gastrointestinal symptom | 1 | Risk Ratio (M‐H, Fixed, 95% CI) | 0.0 [0.0, 0.0] | |
| 3.10 Participants with grade 3 gastrointestinal symptom | 1 | Risk Ratio (M‐H, Fixed, 95% CI) | 0.0 [0.0, 0.0] | |
| 3.11 Participants with headache | 1 | Risk Ratio (M‐H, Fixed, 95% CI) | 0.0 [0.0, 0.0] | |
| 3.12 Participants with grade 3 headache | 1 | Risk Ratio (M‐H, Fixed, 95% CI) | 0.0 [0.0, 0.0] | |
| 3.13 Participants with myalgia | 1 | Risk Ratio (M‐H, Fixed, 95% CI) | 0.0 [0.0, 0.0] | |
| 3.14 Participants with grade 3 myalgia | 1 | Risk Ratio (M‐H, Fixed, 95% CI) | 0.0 [0.0, 0.0] | |
| 3.15 Participants with any local symptom | 1 | Risk Ratio (M‐H, Fixed, 95% CI) | 0.0 [0.0, 0.0] | |
| 3.16 Participants with any grade 3 local symptom | 1 | Risk Ratio (M‐H, Fixed, 95% CI) | 0.0 [0.0, 0.0] | |
| 3.17 Participants with local pain | 1 | Risk Ratio (M‐H, Fixed, 95% CI) | 0.0 [0.0, 0.0] | |
| 3.18 Participants with grade 3 local pain | 1 | Risk Ratio (M‐H, Fixed, 95% CI) | 0.0 [0.0, 0.0] | |
| 3.19 Participants with local redness | 1 | Risk Ratio (M‐H, Fixed, 95% CI) | 0.0 [0.0, 0.0] | |
| 3.20 Participants with grade 3 local redness | 1 | Risk Ratio (M‐H, Fixed, 95% CI) | 0.0 [0.0, 0.0] | |
| 3.21 Participants with local swelling | 1 | Risk Ratio (M‐H, Fixed, 95% CI) | 0.0 [0.0, 0.0] | |
| 3.22 Participants with grade 3 local swelling | 1 | Risk Ratio (M‐H, Fixed, 95% CI) | 0.0 [0.0, 0.0] | |
| 3.23 Participants with consent withdrawal | 1 | Risk Ratio (M‐H, Fixed, 95% CI) | 0.0 [0.0, 0.0] | |
| 3.24 Participants with lost follow‐up | 1 | Risk Ratio (M‐H, Fixed, 95% CI) | 0.0 [0.0, 0.0] | |
| 3.25 Participants with serious AE | 1 | Risk Ratio (M‐H, Fixed, 95% CI) | 0.0 [0.0, 0.0] | |
| 4 50 μg gE/AS01E versus saline Show forest plot | 1 | Risk Ratio (M‐H, Fixed, 95% CI) | Totals not selected | |
| 4.1 Participants with any symptom | 1 | Risk Ratio (M‐H, Fixed, 95% CI) | 0.0 [0.0, 0.0] | |
| 4.2 Participants with any grade 3 symptom | 1 | Risk Ratio (M‐H, Fixed, 95% CI) | 0.0 [0.0, 0.0] | |
| 4.3 Participants with any general symptom | 1 | Risk Ratio (M‐H, Fixed, 95% CI) | 0.0 [0.0, 0.0] | |
| 4.4 Participants with any grade 3 general symptom | 1 | Risk Ratio (M‐H, Fixed, 95% CI) | 0.0 [0.0, 0.0] | |
| 4.5 Participants with fatigue | 1 | Risk Ratio (M‐H, Fixed, 95% CI) | 0.0 [0.0, 0.0] | |
| 4.6 Participants with grade 3 fatigue | 1 | Risk Ratio (M‐H, Fixed, 95% CI) | 0.0 [0.0, 0.0] | |
| 4.7 Participants with fever | 1 | Risk Ratio (M‐H, Fixed, 95% CI) | 0.0 [0.0, 0.0] | |
| 4.8 Participants with grade 3 fever | 1 | Risk Ratio (M‐H, Fixed, 95% CI) | 0.0 [0.0, 0.0] | |
| 4.9 Participants with gastrointestinal symptom | 1 | Risk Ratio (M‐H, Fixed, 95% CI) | 0.0 [0.0, 0.0] | |
| 4.10 Participants with grade 3 gastrointestinal symptom | 1 | Risk Ratio (M‐H, Fixed, 95% CI) | 0.0 [0.0, 0.0] | |
| 4.11 Participants with headache | 1 | Risk Ratio (M‐H, Fixed, 95% CI) | 0.0 [0.0, 0.0] | |
| 4.12 Participants with grade 3 headache | 1 | Risk Ratio (M‐H, Fixed, 95% CI) | 0.0 [0.0, 0.0] | |
| 4.13 Participants with myalgia | 1 | Risk Ratio (M‐H, Fixed, 95% CI) | 0.0 [0.0, 0.0] | |
| 4.14 Participants with grade 3 myalgia | 1 | Risk Ratio (M‐H, Fixed, 95% CI) | 0.0 [0.0, 0.0] | |
| 4.15 Participants with any local symptom | 1 | Risk Ratio (M‐H, Fixed, 95% CI) | 0.0 [0.0, 0.0] | |
| 4.16 Participants with any grade 3 local symptom | 1 | Risk Ratio (M‐H, Fixed, 95% CI) | 0.0 [0.0, 0.0] | |
| 4.17 Participants with local pain | 1 | Risk Ratio (M‐H, Fixed, 95% CI) | 0.0 [0.0, 0.0] | |
| 4.18 Participants with grade 3 local pain | 1 | Risk Ratio (M‐H, Fixed, 95% CI) | 0.0 [0.0, 0.0] | |
| 4.19 Participants with local redness | 1 | Risk Ratio (M‐H, Fixed, 95% CI) | 0.0 [0.0, 0.0] | |
| 4.20 Participants with grade 3 local redness | 1 | Risk Ratio (M‐H, Fixed, 95% CI) | 0.0 [0.0, 0.0] | |
| 4.21 Participants with local swelling | 1 | Risk Ratio (M‐H, Fixed, 95% CI) | 0.0 [0.0, 0.0] | |
| 4.22 Participants with grade 3 local swelling | 1 | Risk Ratio (M‐H, Fixed, 95% CI) | 0.0 [0.0, 0.0] | |
| 4.23 Participants with consent withdrawal | 1 | Risk Ratio (M‐H, Fixed, 95% CI) | 0.0 [0.0, 0.0] | |
| 4.24 Participants with lost follow‐up | 1 | Risk Ratio (M‐H, Fixed, 95% CI) | 0.0 [0.0, 0.0] | |
| 4.25 Participants with serious AE | 1 | Risk Ratio (M‐H, Fixed, 95% CI) | 0.0 [0.0, 0.0] | |
| 5 50 μg gE/AS01B versus saline Show forest plot | 1 | Risk Ratio (M‐H, Fixed, 95% CI) | Totals not selected | |
| 5.1 Participants with any symptom | 1 | Risk Ratio (M‐H, Fixed, 95% CI) | 0.0 [0.0, 0.0] | |
| 5.2 Participants with any grade 3 symptom | 1 | Risk Ratio (M‐H, Fixed, 95% CI) | 0.0 [0.0, 0.0] | |
| 5.3 Participants with any general symptom | 1 | Risk Ratio (M‐H, Fixed, 95% CI) | 0.0 [0.0, 0.0] | |
| 5.4 Participants with any grade 3 general symptom | 1 | Risk Ratio (M‐H, Fixed, 95% CI) | 0.0 [0.0, 0.0] | |
| 5.5 Participants with fatigue | 1 | Risk Ratio (M‐H, Fixed, 95% CI) | 0.0 [0.0, 0.0] | |
| 5.6 Participants with grade 3 fatigue | 1 | Risk Ratio (M‐H, Fixed, 95% CI) | 0.0 [0.0, 0.0] | |
| 5.7 Participants with fever | 1 | Risk Ratio (M‐H, Fixed, 95% CI) | 0.0 [0.0, 0.0] | |
| 5.8 Participants with grade 3 fever | 1 | Risk Ratio (M‐H, Fixed, 95% CI) | 0.0 [0.0, 0.0] | |
| 5.9 Participants with gastrointestinal symptom | 1 | Risk Ratio (M‐H, Fixed, 95% CI) | 0.0 [0.0, 0.0] | |
| 5.10 Participants with grade 3 gastrointestinal symptom | 1 | Risk Ratio (M‐H, Fixed, 95% CI) | 0.0 [0.0, 0.0] | |
| 5.11 Participants with headache | 1 | Risk Ratio (M‐H, Fixed, 95% CI) | 0.0 [0.0, 0.0] | |
| 5.12 Participants with grade 3 headache | 1 | Risk Ratio (M‐H, Fixed, 95% CI) | 0.0 [0.0, 0.0] | |
| 5.13 Participants with myalgia | 1 | Risk Ratio (M‐H, Fixed, 95% CI) | 0.0 [0.0, 0.0] | |
| 5.14 Participants with grade 3 myalgia | 1 | Risk Ratio (M‐H, Fixed, 95% CI) | 0.0 [0.0, 0.0] | |
| 5.15 Participants with any local symptom | 1 | Risk Ratio (M‐H, Fixed, 95% CI) | 0.0 [0.0, 0.0] | |
| 5.16 Participants with any grade 3 local symptom | 1 | Risk Ratio (M‐H, Fixed, 95% CI) | 0.0 [0.0, 0.0] | |
| 5.17 Participants with local pain | 1 | Risk Ratio (M‐H, Fixed, 95% CI) | 0.0 [0.0, 0.0] | |
| 5.18 Participants with grade 3 local pain | 1 | Risk Ratio (M‐H, Fixed, 95% CI) | 0.0 [0.0, 0.0] | |
| 5.19 Participants with local redness | 1 | Risk Ratio (M‐H, Fixed, 95% CI) | 0.0 [0.0, 0.0] | |
| 5.20 Participants with grade 3 local redness | 1 | Risk Ratio (M‐H, Fixed, 95% CI) | 0.0 [0.0, 0.0] | |
| 5.21 Participants with local swelling | 1 | Risk Ratio (M‐H, Fixed, 95% CI) | 0.0 [0.0, 0.0] | |
| 5.22 Participants with grade 3 local swelling | 1 | Risk Ratio (M‐H, Fixed, 95% CI) | 0.0 [0.0, 0.0] | |
| 5.23 Participants with consent withdrawal | 1 | Risk Ratio (M‐H, Fixed, 95% CI) | 0.0 [0.0, 0.0] | |
| 5.24 Participants with lost follow‐up | 1 | Risk Ratio (M‐H, Fixed, 95% CI) | 0.0 [0.0, 0.0] | |
| 5.25 Participants with serious AE | 1 | Risk Ratio (M‐H, Fixed, 95% CI) | 0.0 [0.0, 0.0] | |
| 6 50 μg gE/Saline (unadjuvanted) versus saline Show forest plot | 1 | Risk Ratio (M‐H, Fixed, 95% CI) | Totals not selected | |
| 6.1 Participants with any symptom | 1 | Risk Ratio (M‐H, Fixed, 95% CI) | 0.0 [0.0, 0.0] | |
| 6.2 Participants with any grade 3 symptom | 1 | Risk Ratio (M‐H, Fixed, 95% CI) | 0.0 [0.0, 0.0] | |
| 6.3 Participants with any general symptom | 1 | Risk Ratio (M‐H, Fixed, 95% CI) | 0.0 [0.0, 0.0] | |
| 6.4 Participants with any grade 3 general symptom | 1 | Risk Ratio (M‐H, Fixed, 95% CI) | 0.0 [0.0, 0.0] | |
| 6.5 Participants with fatigue | 1 | Risk Ratio (M‐H, Fixed, 95% CI) | 0.0 [0.0, 0.0] | |
| 6.6 Participants with grade 3 fatigue | 1 | Risk Ratio (M‐H, Fixed, 95% CI) | 0.0 [0.0, 0.0] | |
| 6.7 Participants with fever | 1 | Risk Ratio (M‐H, Fixed, 95% CI) | 0.0 [0.0, 0.0] | |
| 6.8 Participants with grade 3 fever | 1 | Risk Ratio (M‐H, Fixed, 95% CI) | 0.0 [0.0, 0.0] | |
| 6.9 Participants with gastrointestinal symptom | 1 | Risk Ratio (M‐H, Fixed, 95% CI) | 0.0 [0.0, 0.0] | |
| 6.10 Participants with grade 3 gastrointestinal symptom | 1 | Risk Ratio (M‐H, Fixed, 95% CI) | 0.0 [0.0, 0.0] | |
| 6.11 Participants with headache | 1 | Risk Ratio (M‐H, Fixed, 95% CI) | 0.0 [0.0, 0.0] | |
| 6.12 Participants with grade 3 headache | 1 | Risk Ratio (M‐H, Fixed, 95% CI) | 0.0 [0.0, 0.0] | |
| 6.13 Participants with myalgia | 1 | Risk Ratio (M‐H, Fixed, 95% CI) | 0.0 [0.0, 0.0] | |
| 6.14 Participants with grade 3 myalgia | 1 | Risk Ratio (M‐H, Fixed, 95% CI) | 0.0 [0.0, 0.0] | |
| 6.15 Participants with any local symptom | 1 | Risk Ratio (M‐H, Fixed, 95% CI) | 0.0 [0.0, 0.0] | |
| 6.16 Participants with any grade 3 local symptom | 1 | Risk Ratio (M‐H, Fixed, 95% CI) | 0.0 [0.0, 0.0] | |
| 6.17 Participants with local pain | 1 | Risk Ratio (M‐H, Fixed, 95% CI) | 0.0 [0.0, 0.0] | |
| 6.18 Participants with grade 3 local pain | 1 | Risk Ratio (M‐H, Fixed, 95% CI) | 0.0 [0.0, 0.0] | |
| 6.19 Participants with local redness | 1 | Risk Ratio (M‐H, Fixed, 95% CI) | 0.0 [0.0, 0.0] | |
| 6.20 Participants with grade 3 local redness | 1 | Risk Ratio (M‐H, Fixed, 95% CI) | 0.0 [0.0, 0.0] | |
| 6.21 Participants with local swelling | 1 | Risk Ratio (M‐H, Fixed, 95% CI) | 0.0 [0.0, 0.0] | |
| 6.22 Participants with grade 3 local swelling | 1 | Risk Ratio (M‐H, Fixed, 95% CI) | 0.0 [0.0, 0.0] | |
| 6.23 Participants with consent withdrawal | 1 | Risk Ratio (M‐H, Fixed, 95% CI) | 0.0 [0.0, 0.0] | |
| 6.24 Participants with lost follow‐up | 1 | Risk Ratio (M‐H, Fixed, 95% CI) | 0.0 [0.0, 0.0] | |
| 6.25 Participants with serious AE | 1 | Risk Ratio (M‐H, Fixed, 95% CI) | 0.0 [0.0, 0.0] | |
| Outcome or subgroup title | No. of studies | No. of participants | Statistical method | Effect size |
| 1 25 µg gE/AS01B versus 50 µg gE/AS01B Show forest plot | 1 | Risk Ratio (M‐H, Fixed, 95% CI) | Totals not selected | |
| 1.1 Participants with any fatigue | 1 | Risk Ratio (M‐H, Fixed, 95% CI) | 0.0 [0.0, 0.0] | |
| 1.2 Participants with grade 3 fatigue | 1 | Risk Ratio (M‐H, Fixed, 95% CI) | 0.0 [0.0, 0.0] | |
| 1.3 Participants with any fever | 1 | Risk Ratio (M‐H, Fixed, 95% CI) | 0.0 [0.0, 0.0] | |
| 1.4 Participants with grade 3 fever | 1 | Risk Ratio (M‐H, Fixed, 95% CI) | 0.0 [0.0, 0.0] | |
| 1.5 Participants with any headache | 1 | Risk Ratio (M‐H, Fixed, 95% CI) | 0.0 [0.0, 0.0] | |
| 1.6 Participants with grade 3 headache | 1 | Risk Ratio (M‐H, Fixed, 95% CI) | 0.0 [0.0, 0.0] | |
| 1.7 Participants with any myalgia | 1 | Risk Ratio (M‐H, Fixed, 95% CI) | 0.0 [0.0, 0.0] | |
| 1.8 Participants with grade 3 myalgia | 1 | Risk Ratio (M‐H, Fixed, 95% CI) | 0.0 [0.0, 0.0] | |
| 1.9 Participants with local pain | 1 | Risk Ratio (M‐H, Fixed, 95% CI) | 0.0 [0.0, 0.0] | |
| 1.10 Participants with grade 3 local pain | 1 | Risk Ratio (M‐H, Fixed, 95% CI) | 0.0 [0.0, 0.0] | |
| 1.11 Participants with local redness | 1 | Risk Ratio (M‐H, Fixed, 95% CI) | 0.0 [0.0, 0.0] | |
| 1.12 Participants with grade 3 local redness | 1 | Risk Ratio (M‐H, Fixed, 95% CI) | 0.0 [0.0, 0.0] | |
| 1.13 Participants with local swelling | 1 | Risk Ratio (M‐H, Fixed, 95% CI) | 0.0 [0.0, 0.0] | |
| 1.14 Participants with grade 3 local swelling | 1 | Risk Ratio (M‐H, Fixed, 95% CI) | 0.0 [0.0, 0.0] | |
| 1.15 Participants with consent withdrawal | 1 | Risk Ratio (M‐H, Fixed, 95% CI) | 0.0 [0.0, 0.0] | |
| 1.16 Participants with lost to follow‐up | 1 | Risk Ratio (M‐H, Fixed, 95% CI) | 0.0 [0.0, 0.0] | |
| 1.17 Participants with death | 1 | Risk Ratio (M‐H, Fixed, 95% CI) | 0.0 [0.0, 0.0] | |
| 2 25 µg gE/AS01B versus 100 µg gE/AS01B Show forest plot | 1 | Risk Ratio (M‐H, Fixed, 95% CI) | Totals not selected | |
| 2.1 Participants with any fatigue | 1 | Risk Ratio (M‐H, Fixed, 95% CI) | 0.0 [0.0, 0.0] | |
| 2.2 Participants with grade 3 fatigue | 1 | Risk Ratio (M‐H, Fixed, 95% CI) | 0.0 [0.0, 0.0] | |
| 2.3 Participants with any fever | 1 | Risk Ratio (M‐H, Fixed, 95% CI) | 0.0 [0.0, 0.0] | |
| 2.4 Participants with grade 3 fever | 1 | Risk Ratio (M‐H, Fixed, 95% CI) | 0.0 [0.0, 0.0] | |
| 2.5 Participants with any headache | 1 | Risk Ratio (M‐H, Fixed, 95% CI) | 0.0 [0.0, 0.0] | |
| 2.6 Participants with grade 3 headache | 1 | Risk Ratio (M‐H, Fixed, 95% CI) | 0.0 [0.0, 0.0] | |
| 2.7 Participants with any myalgia | 1 | Risk Ratio (M‐H, Fixed, 95% CI) | 0.0 [0.0, 0.0] | |
| 2.8 Participants with grade 3 myalgia | 1 | Risk Ratio (M‐H, Fixed, 95% CI) | 0.0 [0.0, 0.0] | |
| 2.9 Participants with local pain | 1 | Risk Ratio (M‐H, Fixed, 95% CI) | 0.0 [0.0, 0.0] | |
| 2.10 Participants with grade 3 local pain | 1 | Risk Ratio (M‐H, Fixed, 95% CI) | 0.0 [0.0, 0.0] | |
| 2.11 Participants with local redness | 1 | Risk Ratio (M‐H, Fixed, 95% CI) | 0.0 [0.0, 0.0] | |
| 2.12 Participants with grade 3 local redness | 1 | Risk Ratio (M‐H, Fixed, 95% CI) | 0.0 [0.0, 0.0] | |
| 2.13 Participants with local swelling | 1 | Risk Ratio (M‐H, Fixed, 95% CI) | 0.0 [0.0, 0.0] | |
| 2.14 Participants with grade 3 local swelling | 1 | Risk Ratio (M‐H, Fixed, 95% CI) | 0.0 [0.0, 0.0] | |
| 2.15 Participants with consent withdrawal | 1 | Risk Ratio (M‐H, Fixed, 95% CI) | 0.0 [0.0, 0.0] | |
| 2.16 Participants with lost to follow‐up | 1 | Risk Ratio (M‐H, Fixed, 95% CI) | 0.0 [0.0, 0.0] | |
| 2.17 Participants with death | 1 | Risk Ratio (M‐H, Fixed, 95% CI) | 0.0 [0.0, 0.0] | |
| 3 50 µg gE/AS01B versus 100 µg gE/AS01B Show forest plot | 1 | Risk Ratio (M‐H, Fixed, 95% CI) | Totals not selected | |
| 3.1 Participants with any fatigue | 1 | Risk Ratio (M‐H, Fixed, 95% CI) | 0.0 [0.0, 0.0] | |
| 3.2 Participants with grade 3 fatigue | 1 | Risk Ratio (M‐H, Fixed, 95% CI) | 0.0 [0.0, 0.0] | |
| 3.3 Participants with any fever | 1 | Risk Ratio (M‐H, Fixed, 95% CI) | 0.0 [0.0, 0.0] | |
| 3.4 Participants with grade 3 fever | 1 | Risk Ratio (M‐H, Fixed, 95% CI) | 0.0 [0.0, 0.0] | |
| 3.5 Participants with any headache | 1 | Risk Ratio (M‐H, Fixed, 95% CI) | 0.0 [0.0, 0.0] | |
| 3.6 Participants with grade 3 headache | 1 | Risk Ratio (M‐H, Fixed, 95% CI) | 0.0 [0.0, 0.0] | |
| 3.7 Participants with any myalgia | 1 | Risk Ratio (M‐H, Fixed, 95% CI) | 0.0 [0.0, 0.0] | |
| 3.8 Participants with grade 3 myalgia | 1 | Risk Ratio (M‐H, Fixed, 95% CI) | 0.0 [0.0, 0.0] | |
| 3.9 Participants with local swelling | 1 | Risk Ratio (M‐H, Fixed, 95% CI) | 0.0 [0.0, 0.0] | |
| 3.10 Participants with grade 3 local pain | 1 | Risk Ratio (M‐H, Fixed, 95% CI) | 0.0 [0.0, 0.0] | |
| 3.11 Participants with local redness | 1 | Risk Ratio (M‐H, Fixed, 95% CI) | 0.0 [0.0, 0.0] | |
| 3.12 Participants with grade 3 local redness | 1 | Risk Ratio (M‐H, Fixed, 95% CI) | 0.0 [0.0, 0.0] | |
| 3.13 Participants with local pain | 1 | Risk Ratio (M‐H, Fixed, 95% CI) | 0.0 [0.0, 0.0] | |
| 3.14 Participants with grade 3 local swelling | 1 | Risk Ratio (M‐H, Fixed, 95% CI) | 0.0 [0.0, 0.0] | |
| 3.15 Participants with consent withdrawal | 1 | Risk Ratio (M‐H, Fixed, 95% CI) | 0.0 [0.0, 0.0] | |
| 3.16 Participants with lost to follow‐up | 1 | Risk Ratio (M‐H, Fixed, 95% CI) | 0.0 [0.0, 0.0] | |
| 3.17 Participants with death | 1 | Risk Ratio (M‐H, Fixed, 95% CI) | 0.0 [0.0, 0.0] | |
| 4 25 µg gE/AS01B versus 100 µg gE/saline (unadjuvanted gE) Show forest plot | 1 | Risk Ratio (M‐H, Fixed, 95% CI) | Totals not selected | |
| 4.1 Participants with any fatigue | 1 | Risk Ratio (M‐H, Fixed, 95% CI) | 0.0 [0.0, 0.0] | |
| 4.2 Participants with grade 3 fatigue | 1 | Risk Ratio (M‐H, Fixed, 95% CI) | 0.0 [0.0, 0.0] | |
| 4.3 Participants with any fever | 1 | Risk Ratio (M‐H, Fixed, 95% CI) | 0.0 [0.0, 0.0] | |
| 4.4 Participants with grade 3 fever | 1 | Risk Ratio (M‐H, Fixed, 95% CI) | 0.0 [0.0, 0.0] | |
| 4.5 Participants with any headache | 1 | Risk Ratio (M‐H, Fixed, 95% CI) | 0.0 [0.0, 0.0] | |
| 4.6 Participants with grade 3 headache | 1 | Risk Ratio (M‐H, Fixed, 95% CI) | 0.0 [0.0, 0.0] | |
| 4.7 Participants with any myalgia | 1 | Risk Ratio (M‐H, Fixed, 95% CI) | 0.0 [0.0, 0.0] | |
| 4.8 Participants with grade 3 myalgia | 1 | Risk Ratio (M‐H, Fixed, 95% CI) | 0.0 [0.0, 0.0] | |
| 4.9 Participants with local pain | 1 | Risk Ratio (M‐H, Fixed, 95% CI) | 0.0 [0.0, 0.0] | |
| 4.10 Participants with grade 3 local pain | 1 | Risk Ratio (M‐H, Fixed, 95% CI) | 0.0 [0.0, 0.0] | |
| 4.11 Participants with local redness | 1 | Risk Ratio (M‐H, Fixed, 95% CI) | 0.0 [0.0, 0.0] | |
| 4.12 Participants with grade 3 local redness | 1 | Risk Ratio (M‐H, Fixed, 95% CI) | 0.0 [0.0, 0.0] | |
| 4.13 Participants with local swelling | 1 | Risk Ratio (M‐H, Fixed, 95% CI) | 0.0 [0.0, 0.0] | |
| 4.14 Participants with grade 3 local swelling | 1 | Risk Ratio (M‐H, Fixed, 95% CI) | 0.0 [0.0, 0.0] | |
| 4.15 Participants with consent withdrawal | 1 | Risk Ratio (M‐H, Fixed, 95% CI) | 0.0 [0.0, 0.0] | |
| 4.16 Participants with lost to follow‐up | 1 | Risk Ratio (M‐H, Fixed, 95% CI) | 0.0 [0.0, 0.0] | |
| 4.17 Participants with death | 1 | Risk Ratio (M‐H, Fixed, 95% CI) | 0.0 [0.0, 0.0] | |
| 5 50 µg gE/AS01B a versus 100 µg gE/saline (unadjuvanted gE) Show forest plot | 1 | Risk Ratio (M‐H, Fixed, 95% CI) | Totals not selected | |
| 5.1 Participants with any fatigue | 1 | Risk Ratio (M‐H, Fixed, 95% CI) | 0.0 [0.0, 0.0] | |
| 5.2 Participants with grade 3 fatigue | 1 | Risk Ratio (M‐H, Fixed, 95% CI) | 0.0 [0.0, 0.0] | |
| 5.3 Participants with any fever | 1 | Risk Ratio (M‐H, Fixed, 95% CI) | 0.0 [0.0, 0.0] | |
| 5.4 Participants with grade 3 fever | 1 | Risk Ratio (M‐H, Fixed, 95% CI) | 0.0 [0.0, 0.0] | |
| 5.5 Participants with any headache | 1 | Risk Ratio (M‐H, Fixed, 95% CI) | 0.0 [0.0, 0.0] | |
| 5.6 Participants with grade 3 headache | 1 | Risk Ratio (M‐H, Fixed, 95% CI) | 0.0 [0.0, 0.0] | |
| 5.7 Participants with any myalgia | 1 | Risk Ratio (M‐H, Fixed, 95% CI) | 0.0 [0.0, 0.0] | |
| 5.8 Participants with grade 3 myalgia | 1 | Risk Ratio (M‐H, Fixed, 95% CI) | 0.0 [0.0, 0.0] | |
| 5.9 Participants with local pain | 1 | Risk Ratio (M‐H, Fixed, 95% CI) | 0.0 [0.0, 0.0] | |
| 5.10 Participants with grade 3 local pain | 1 | Risk Ratio (M‐H, Fixed, 95% CI) | 0.0 [0.0, 0.0] | |
| 5.11 Participants with local redness | 1 | Risk Ratio (M‐H, Fixed, 95% CI) | 0.0 [0.0, 0.0] | |
| 5.12 Participants with grade 3 local redness | 1 | Risk Ratio (M‐H, Fixed, 95% CI) | 0.0 [0.0, 0.0] | |
| 5.13 Participants with local swelling | 1 | Risk Ratio (M‐H, Fixed, 95% CI) | 0.0 [0.0, 0.0] | |
| 5.14 Participants with grade 3 local swelling | 1 | Risk Ratio (M‐H, Fixed, 95% CI) | 0.0 [0.0, 0.0] | |
| 5.15 Participants with consent withdrawal | 1 | Risk Ratio (M‐H, Fixed, 95% CI) | 0.0 [0.0, 0.0] | |
| 5.16 Participants with lost to follow‐up | 1 | Risk Ratio (M‐H, Fixed, 95% CI) | 0.0 [0.0, 0.0] | |
| 5.17 Participants with death | 1 | Risk Ratio (M‐H, Fixed, 95% CI) | 0.0 [0.0, 0.0] | |
| 6 100 µg gE/AS01B versus 100 µg gE/saline (unadjuvanted gE) Show forest plot | 1 | Risk Ratio (M‐H, Fixed, 95% CI) | Totals not selected | |
| 6.1 Participants with any fatigue | 1 | Risk Ratio (M‐H, Fixed, 95% CI) | 0.0 [0.0, 0.0] | |
| 6.2 Participants with grade 3 fatigue | 1 | Risk Ratio (M‐H, Fixed, 95% CI) | 0.0 [0.0, 0.0] | |
| 6.3 Participants with any fever | 1 | Risk Ratio (M‐H, Fixed, 95% CI) | 0.0 [0.0, 0.0] | |
| 6.4 Participants with grade 3 fever | 1 | Risk Ratio (M‐H, Fixed, 95% CI) | 0.0 [0.0, 0.0] | |
| 6.5 Participants with any headache | 1 | Risk Ratio (M‐H, Fixed, 95% CI) | 0.0 [0.0, 0.0] | |
| 6.6 Participants with grade 3 headache | 1 | Risk Ratio (M‐H, Fixed, 95% CI) | 0.0 [0.0, 0.0] | |
| 6.7 Participants with any myalgia | 1 | Risk Ratio (M‐H, Fixed, 95% CI) | 0.0 [0.0, 0.0] | |
| 6.8 Participants with grade 3 myalgia | 1 | Risk Ratio (M‐H, Fixed, 95% CI) | 0.0 [0.0, 0.0] | |
| 6.9 Participants with local pain | 1 | Risk Ratio (M‐H, Fixed, 95% CI) | 0.0 [0.0, 0.0] | |
| 6.10 Participants with grade 3 local pain | 1 | Risk Ratio (M‐H, Fixed, 95% CI) | 0.0 [0.0, 0.0] | |
| 6.11 Participants with local redness | 1 | Risk Ratio (M‐H, Fixed, 95% CI) | 0.0 [0.0, 0.0] | |
| 6.12 Participants with grade 3 local redness | 1 | Risk Ratio (M‐H, Fixed, 95% CI) | 0.0 [0.0, 0.0] | |
| 6.13 Participants with local swelling | 1 | Risk Ratio (M‐H, Fixed, 95% CI) | 0.0 [0.0, 0.0] | |
| 6.14 Participants with grade 3 local swelling | 1 | Risk Ratio (M‐H, Fixed, 95% CI) | 0.0 [0.0, 0.0] | |
| 6.15 Participants with consent withdrawal | 1 | Risk Ratio (M‐H, Fixed, 95% CI) | 0.0 [0.0, 0.0] | |
| 6.16 Participants with lost to follow‐up | 1 | Risk Ratio (M‐H, Fixed, 95% CI) | 0.0 [0.0, 0.0] | |
| 6.17 Participants with death | 1 | Risk Ratio (M‐H, Fixed, 95% CI) | 0.0 [0.0, 0.0] | |
| 7 25 µg gE/AS01B versus saline + 100 µg gE/AS01B Show forest plot | 1 | Risk Ratio (M‐H, Fixed, 95% CI) | Totals not selected | |
| 7.1 Participants with any fatigue | 1 | Risk Ratio (M‐H, Fixed, 95% CI) | 0.0 [0.0, 0.0] | |
| 7.2 Participants with grade 3 fatigue | 1 | Risk Ratio (M‐H, Fixed, 95% CI) | 0.0 [0.0, 0.0] | |
| 7.3 Participants with any fever | 1 | Risk Ratio (M‐H, Fixed, 95% CI) | 0.0 [0.0, 0.0] | |
| 7.4 Participants with grade 3 fever | 1 | Risk Ratio (M‐H, Fixed, 95% CI) | 0.0 [0.0, 0.0] | |
| 7.5 Participants with any headache | 1 | Risk Ratio (M‐H, Fixed, 95% CI) | 0.0 [0.0, 0.0] | |
| 7.6 Participants with grade 3 headache | 1 | Risk Ratio (M‐H, Fixed, 95% CI) | 0.0 [0.0, 0.0] | |
| 7.7 Participants with any myalgia | 1 | Risk Ratio (M‐H, Fixed, 95% CI) | 0.0 [0.0, 0.0] | |
| 7.8 Participants with grade 3 myalgia | 1 | Risk Ratio (M‐H, Fixed, 95% CI) | 0.0 [0.0, 0.0] | |
| 7.9 Participants with local pain | 1 | Risk Ratio (M‐H, Fixed, 95% CI) | 0.0 [0.0, 0.0] | |
| 7.10 Participants with grade 3 local pain | 1 | Risk Ratio (M‐H, Fixed, 95% CI) | 0.0 [0.0, 0.0] | |
| 7.11 Participants with local redness | 1 | Risk Ratio (M‐H, Fixed, 95% CI) | 0.0 [0.0, 0.0] | |
| 7.12 Participants with grade 3 local redness | 1 | Risk Ratio (M‐H, Fixed, 95% CI) | 0.0 [0.0, 0.0] | |
| 7.13 Participants with local swelling | 1 | Risk Ratio (M‐H, Fixed, 95% CI) | 0.0 [0.0, 0.0] | |
| 7.14 Participants with grade 3 local swelling | 1 | Risk Ratio (M‐H, Fixed, 95% CI) | 0.0 [0.0, 0.0] | |
| 7.15 Participants with consent withdrawal | 1 | Risk Ratio (M‐H, Fixed, 95% CI) | 0.0 [0.0, 0.0] | |
| 7.16 Participants with lost to follow‐up | 1 | Risk Ratio (M‐H, Fixed, 95% CI) | 0.0 [0.0, 0.0] | |
| 7.17 Participants with death | 1 | Risk Ratio (M‐H, Fixed, 95% CI) | 0.0 [0.0, 0.0] | |
| 8 50 µg gE/AS01B versus saline + 100 µg gE/AS01B Show forest plot | 1 | Risk Ratio (M‐H, Fixed, 95% CI) | Totals not selected | |
| 8.1 Participants with any fatigue | 1 | Risk Ratio (M‐H, Fixed, 95% CI) | 0.0 [0.0, 0.0] | |
| 8.2 Participants with grade 3 fatigue | 1 | Risk Ratio (M‐H, Fixed, 95% CI) | 0.0 [0.0, 0.0] | |
| 8.3 Participants with any fever | 1 | Risk Ratio (M‐H, Fixed, 95% CI) | 0.0 [0.0, 0.0] | |
| 8.4 Participants with grade 3 fever | 1 | Risk Ratio (M‐H, Fixed, 95% CI) | 0.0 [0.0, 0.0] | |
| 8.5 Participants with any headache | 1 | Risk Ratio (M‐H, Fixed, 95% CI) | 0.0 [0.0, 0.0] | |
| 8.6 Participants with grade 3 headache | 1 | Risk Ratio (M‐H, Fixed, 95% CI) | 0.0 [0.0, 0.0] | |
| 8.7 Participants with any myalgia | 1 | Risk Ratio (M‐H, Fixed, 95% CI) | 0.0 [0.0, 0.0] | |
| 8.8 Participants with grade 3 myalgia | 1 | Risk Ratio (M‐H, Fixed, 95% CI) | 0.0 [0.0, 0.0] | |
| 8.9 Participants with local pain | 1 | Risk Ratio (M‐H, Fixed, 95% CI) | 0.0 [0.0, 0.0] | |
| 8.10 Participants with grade 3 local pain | 1 | Risk Ratio (M‐H, Fixed, 95% CI) | 0.0 [0.0, 0.0] | |
| 8.11 Participants with local redness | 1 | Risk Ratio (M‐H, Fixed, 95% CI) | 0.0 [0.0, 0.0] | |
| 8.12 Participants with grade 3 local redness | 1 | Risk Ratio (M‐H, Fixed, 95% CI) | 0.0 [0.0, 0.0] | |
| 8.13 Participants with local swelling | 1 | Risk Ratio (M‐H, Fixed, 95% CI) | 0.0 [0.0, 0.0] | |
| 8.14 Participants with grade 3 local swelling | 1 | Risk Ratio (M‐H, Fixed, 95% CI) | 0.0 [0.0, 0.0] | |
| 8.15 Participants with consent withdrawal | 1 | Risk Ratio (M‐H, Fixed, 95% CI) | 0.0 [0.0, 0.0] | |
| 8.16 Participants with lost to follow‐up | 1 | Risk Ratio (M‐H, Fixed, 95% CI) | 0.0 [0.0, 0.0] | |
| 8.17 Participants with death | 1 | Risk Ratio (M‐H, Fixed, 95% CI) | 0.0 [0.0, 0.0] | |
| 9 100 µg gE/AS01B versus saline + 100 µg gE/AS01B Show forest plot | 1 | Odds Ratio (M‐H, Fixed, 95% CI) | Totals not selected | |
| 9.1 Participants with any fatigue | 1 | Odds Ratio (M‐H, Fixed, 95% CI) | 0.0 [0.0, 0.0] | |
| 9.2 Participants with grade 3 fatigue | 1 | Odds Ratio (M‐H, Fixed, 95% CI) | 0.0 [0.0, 0.0] | |
| 9.3 Participants with any fever | 1 | Odds Ratio (M‐H, Fixed, 95% CI) | 0.0 [0.0, 0.0] | |
| 9.4 Participants with grade 3 fever | 1 | Odds Ratio (M‐H, Fixed, 95% CI) | 0.0 [0.0, 0.0] | |
| 9.5 Participants with any headache | 1 | Odds Ratio (M‐H, Fixed, 95% CI) | 0.0 [0.0, 0.0] | |
| 9.6 Participants with grade 3 headache | 1 | Odds Ratio (M‐H, Fixed, 95% CI) | 0.0 [0.0, 0.0] | |
| 9.7 Participants with any myalgia | 1 | Odds Ratio (M‐H, Fixed, 95% CI) | 0.0 [0.0, 0.0] | |
| 9.8 Participants with grade 3 myalgia | 1 | Odds Ratio (M‐H, Fixed, 95% CI) | 0.0 [0.0, 0.0] | |
| 9.9 Participants with local pain | 1 | Odds Ratio (M‐H, Fixed, 95% CI) | 0.0 [0.0, 0.0] | |
| 9.10 Participants with grade 3 local pain | 1 | Odds Ratio (M‐H, Fixed, 95% CI) | 0.0 [0.0, 0.0] | |
| 9.11 Participants with local redness | 1 | Odds Ratio (M‐H, Fixed, 95% CI) | 0.0 [0.0, 0.0] | |
| 9.12 Participants with grade 3 local redness | 1 | Odds Ratio (M‐H, Fixed, 95% CI) | 0.0 [0.0, 0.0] | |
| 9.13 Participants with local swelling | 1 | Odds Ratio (M‐H, Fixed, 95% CI) | 0.0 [0.0, 0.0] | |
| 9.14 Participants with grade 3 local swelling | 1 | Odds Ratio (M‐H, Fixed, 95% CI) | 0.0 [0.0, 0.0] | |
| 9.15 Participants with consent withdrawal | 1 | Odds Ratio (M‐H, Fixed, 95% CI) | 0.0 [0.0, 0.0] | |
| 9.16 Participants with lost to follow‐up | 1 | Odds Ratio (M‐H, Fixed, 95% CI) | 0.0 [0.0, 0.0] | |
| 9.17 Participants with death | 1 | Odds Ratio (M‐H, Fixed, 95% CI) | 0.0 [0.0, 0.0] | |
| 10 Saline + 100 µg gE/AS01B versus 100 µg gE/saline (unadjuvanted gE) Show forest plot | 1 | Risk Ratio (M‐H, Fixed, 95% CI) | Totals not selected | |
| 10.1 Participants with any fatigue | 1 | Risk Ratio (M‐H, Fixed, 95% CI) | 0.0 [0.0, 0.0] | |
| 10.2 Participants with grade 3 fatigue | 1 | Risk Ratio (M‐H, Fixed, 95% CI) | 0.0 [0.0, 0.0] | |
| 10.3 Participants with any fever | 1 | Risk Ratio (M‐H, Fixed, 95% CI) | 0.0 [0.0, 0.0] | |
| 10.4 Participants with grade 3 fever | 1 | Risk Ratio (M‐H, Fixed, 95% CI) | 0.0 [0.0, 0.0] | |
| 10.5 Participants with any headache | 1 | Risk Ratio (M‐H, Fixed, 95% CI) | 0.0 [0.0, 0.0] | |
| 10.6 Participants with grade 3 headache | 1 | Risk Ratio (M‐H, Fixed, 95% CI) | 0.0 [0.0, 0.0] | |
| 10.7 Participants with any myalgia | 1 | Risk Ratio (M‐H, Fixed, 95% CI) | 0.0 [0.0, 0.0] | |
| 10.8 Participants with grade 3 myalgia | 1 | Risk Ratio (M‐H, Fixed, 95% CI) | 0.0 [0.0, 0.0] | |
| 10.9 Participants with local pain | 1 | Risk Ratio (M‐H, Fixed, 95% CI) | 0.0 [0.0, 0.0] | |
| 10.10 Participants with grade 3 local pain | 1 | Risk Ratio (M‐H, Fixed, 95% CI) | 0.0 [0.0, 0.0] | |
| 10.11 Participants with local redness | 1 | Risk Ratio (M‐H, Fixed, 95% CI) | 0.0 [0.0, 0.0] | |
| 10.12 Participants with grade 3 local redness | 1 | Risk Ratio (M‐H, Fixed, 95% CI) | 0.0 [0.0, 0.0] | |
| 10.13 Participants with local swelling | 1 | Risk Ratio (M‐H, Fixed, 95% CI) | 0.0 [0.0, 0.0] | |
| 10.14 Participants with grade 3 local swelling | 1 | Risk Ratio (M‐H, Fixed, 95% CI) | 0.0 [0.0, 0.0] | |
| 10.15 Participants with consent withdrawal | 1 | Risk Ratio (M‐H, Fixed, 95% CI) | 0.0 [0.0, 0.0] | |
| 10.16 Participants with lost to follow‐up | 1 | Risk Ratio (M‐H, Fixed, 95% CI) | 0.0 [0.0, 0.0] | |
| 10.17 Participants with death | 1 | Risk Ratio (M‐H, Fixed, 95% CI) | 0.0 [0.0, 0.0] | |
| Outcome or subgroup title | No. of studies | No. of participants | Statistical method | Effect size |
| 1 Incidence of herpes zoster 3.2 years follow‐up (≥ 60 yo) Show forest plot | 1 | Risk Ratio (M‐H, Fixed, 95% CI) | Totals not selected | |
| 2 Participants with AEs Show forest plot | 1 | Risk Ratio (M‐H, Fixed, 95% CI) | Totals not selected | |
| 2.1 Any symptom | 1 | Risk Ratio (M‐H, Fixed, 95% CI) | 0.0 [0.0, 0.0] | |
| 2.2 Grade 3 any symptom | 1 | Risk Ratio (M‐H, Fixed, 95% CI) | 0.0 [0.0, 0.0] | |
| 2.3 Grade 3 any symptom related to vaccination | 1 | Risk Ratio (M‐H, Fixed, 95% CI) | 0.0 [0.0, 0.0] | |
| 2.4 Any systemic symptom | 1 | Risk Ratio (M‐H, Fixed, 95% CI) | 0.0 [0.0, 0.0] | |
| 2.5 Grade 3 any systemic AEs | 1 | Risk Ratio (M‐H, Fixed, 95% CI) | 0.0 [0.0, 0.0] | |
| 2.6 Myalgia | 1 | Risk Ratio (M‐H, Fixed, 95% CI) | 0.0 [0.0, 0.0] | |
| 2.7 Fatigue | 1 | Risk Ratio (M‐H, Fixed, 95% CI) | 0.0 [0.0, 0.0] | |
| 2.8 Headache | 1 | Risk Ratio (M‐H, Fixed, 95% CI) | 0.0 [0.0, 0.0] | |
| 2.9 Shivering | 1 | Risk Ratio (M‐H, Fixed, 95% CI) | 0.0 [0.0, 0.0] | |
| 2.10 Fever | 1 | Risk Ratio (M‐H, Fixed, 95% CI) | 0.0 [0.0, 0.0] | |
| 2.11 Gastrointestinal symptom | 1 | Risk Ratio (M‐H, Fixed, 95% CI) | 0.0 [0.0, 0.0] | |
| 2.12 Any local symptom | 1 | Risk Ratio (M‐H, Fixed, 95% CI) | 0.0 [0.0, 0.0] | |
| 2.13 Grade 3 any local symptom | 1 | Risk Ratio (M‐H, Fixed, 95% CI) | 0.0 [0.0, 0.0] | |
| 2.14 Local pain | 1 | Risk Ratio (M‐H, Fixed, 95% CI) | 0.0 [0.0, 0.0] | |
| 2.15 Local redness | 1 | Risk Ratio (M‐H, Fixed, 95% CI) | 0.0 [0.0, 0.0] | |
| 2.16 Local swelling | 1 | Risk Ratio (M‐H, Fixed, 95% CI) | 0.0 [0.0, 0.0] | |
| 2.17 Serious AEs | 1 | Risk Ratio (M‐H, Fixed, 95% CI) | 0.0 [0.0, 0.0] | |
| 2.18 Serious AEs within 30 days after vaccination | 1 | Risk Ratio (M‐H, Fixed, 95% CI) | 0.0 [0.0, 0.0] | |
| 2.19 Serious AEs within 30 days after vaccination related to vaccination | 1 | Risk Ratio (M‐H, Fixed, 95% CI) | 0.0 [0.0, 0.0] | |
| 2.20 Potential immune‐mediated disease | 1 | Risk Ratio (M‐H, Fixed, 95% CI) | 0.0 [0.0, 0.0] | |
| 2.21 Deaths | 1 | Risk Ratio (M‐H, Fixed, 95% CI) | 0.0 [0.0, 0.0] | |
| 2.22 Deaths within 30 days after vaccination | 1 | Risk Ratio (M‐H, Fixed, 95% CI) | 0.0 [0.0, 0.0] | |
| 2.23 Unsolicited report of AEs | 1 | Risk Ratio (M‐H, Fixed, 95% CI) | 0.0 [0.0, 0.0] | |
| 2.24 Grade 3 unsolicited report of AEs | 1 | Risk Ratio (M‐H, Fixed, 95% CI) | 0.0 [0.0, 0.0] | |
| 3 Drop‐outs Show forest plot | 1 | Risk Ratio (M‐H, Fixed, 95% CI) | Totals not selected | |
| 3.1 Did not receive vaccine according to protocol | 1 | Risk Ratio (M‐H, Fixed, 95% CI) | 0.0 [0.0, 0.0] | |
| 3.2 Received wrong vaccine | 1 | Risk Ratio (M‐H, Fixed, 95% CI) | 0.0 [0.0, 0.0] | |
| 3.3 Had diagnosis of HZ < 30 days after dose 2 | 1 | Risk Ratio (M‐H, Fixed, 95% CI) | 0.0 [0.0, 0.0] | |