Agomelatina versus otros agentes antidepresivos para la depresión
Información
- DOI:
- https://doi.org/10.1002/14651858.CD008851.pub2Copiar DOI

- Base de datos:
-
- Cochrane Database of Systematic Reviews
- Versión publicada:
-
- 17 diciembre 2013see what's new
- Tipo:
-
- Intervention
- Etapa:
-
- Review
- Grupo Editorial Cochrane:
-
Grupo Cochrane de Trastornos mentales comunes
- Copyright:
-
- Copyright © 2013 The Cochrane Collaboration. Published by John Wiley & Sons, Ltd.
Cifras del artículo
Altmetric:
Citado por:
Autores
Contributions of authors
GG: conceived the idea, supervised protocol writing, and wrote part of the review
SG: wrote the protocol and extracted data from studies
DC: read the protocol and the review, and provided methodological input
SJCD: wrote the descriptions of the condition and of the intervention, and provided content supervision
KH: helped with data extraction and with revision of the review
MK: extracted data from studies, wrote part of the review and also analysed the data
Sources of support
Internal sources
-
None, Not specified.
External sources
-
None, Not specified.
Declarations of interest
Giuseppe Guaiana: none known
Sumeet Gupta: none known
Debbie Chiodo: none known
Simon JC Davies: none known
Katja Haederle: none known
Markus Koesters: none known
Acknowledgements
CRG Funding Acknowledgement
The National Institute for Health Research (NIHR) is the largest single funder of the Cochrane Depression, Anxiety and Neurosis Group.
Disclaimer: the views and opinions expressed herein are those of the authors and do not necessarily reflect those of the NIHR, NHS or the Department of Health.
Version history
| Published | Title | Stage | Authors | Version |
| 2013 Dec 17 | Agomelatine versus other antidepressive agents for major depression | Review | Giuseppe Guaiana, Sumeet Gupta, Debbie Chiodo, Simon JC Davies, Katja Haederle, Markus Koesters | |
| 2010 Nov 10 | Agomelatine versus other antidepressive agents for major depression | Protocol | Giuseppe Guaiana, Sumeet Gupta, Debbie Chiodo, Simon JC Davies | |
Differences between protocol and review
Since we judged that it would have not made much difference in data analysis and interpretation, the analysis for the fixed‐effect model was calculated only for the main outcomes that were included in the 'Summary of findings' tables.
The protocol did not list continuous data as an outcome. We amended the analysis and we included continuous data as a secondary outcome.
We did not run any meta‐regression analyses, as the low number of studies available made these analyses obsolete.
In the protocol phase, we thought of grouping all antidepressants together. At the review stage, we decided to group the antidepressants by classes (SSRI, SNRI and others).
In order to assess publication bias better, we added a subgroup analysis (Analysis 1.30), that examined differences in outcomes for agomelatine in published versus unpublished studies.
Keywords
MeSH
Medical Subject Headings (MeSH) Keywords
Medical Subject Headings Check Words
Adult; Humans;
PICO
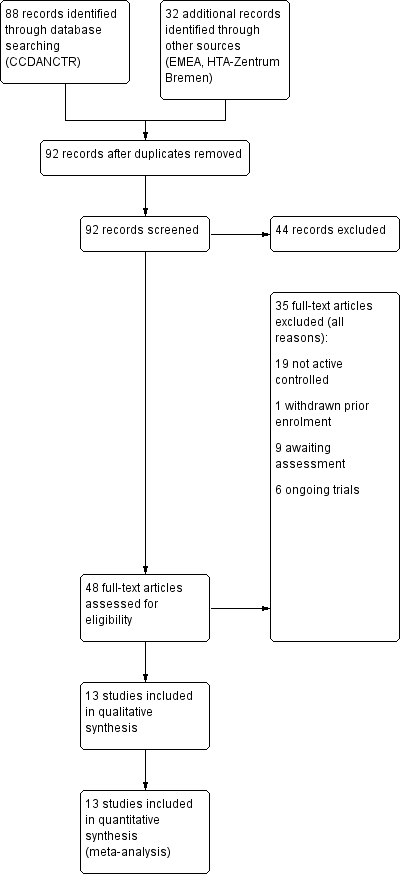
Study flow diagram

Risk of bias graph: review authors' judgements about each risk of bias item presented as percentages across all included studies

Risk of bias summary: review authors' judgements about each risk of bias item for each included study

Forest plot of comparison: 1 Agomelatine vs SSRI, outcome: 1.1 Response rates

Forest plot of comparison: 1 Agomelatine vs SSRI, outcome: 1.2 Remission rates

Forest plot of comparison: 1 Agomelatine vs SSRI, outcome: 1.3 Total drop outs

Forest plot of comparison: 2 Agomelatine vs SNRI, outcome: 2.1 Response rates

Forest plot of comparison: 2 Agomelatine vs SNRI, outcome: 2.2 Remission rates

Forest plot of comparison: 2 Agomelatine vs SNRI, outcome: 2.3 Total drop outs

Comparison 1 Agomelatine vs SSRI, Outcome 1 Response rates.

Comparison 1 Agomelatine vs SSRI, Outcome 2 Remission rates.

Comparison 1 Agomelatine vs SSRI, Outcome 3 Total drop outs.

Comparison 1 Agomelatine vs SSRI, Outcome 4 Drop out due to inefficacy.

Comparison 1 Agomelatine vs SSRI, Outcome 5 Drop outs due to side effects.

Comparison 1 Agomelatine vs SSRI, Outcome 6 Total number of patients with side effects.
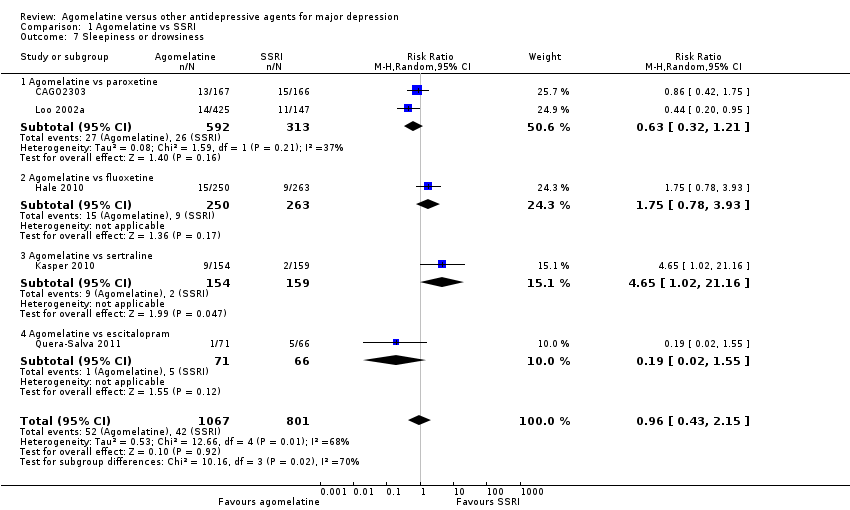
Comparison 1 Agomelatine vs SSRI, Outcome 7 Sleepiness or drowsiness.

Comparison 1 Agomelatine vs SSRI, Outcome 8 Insomnia.
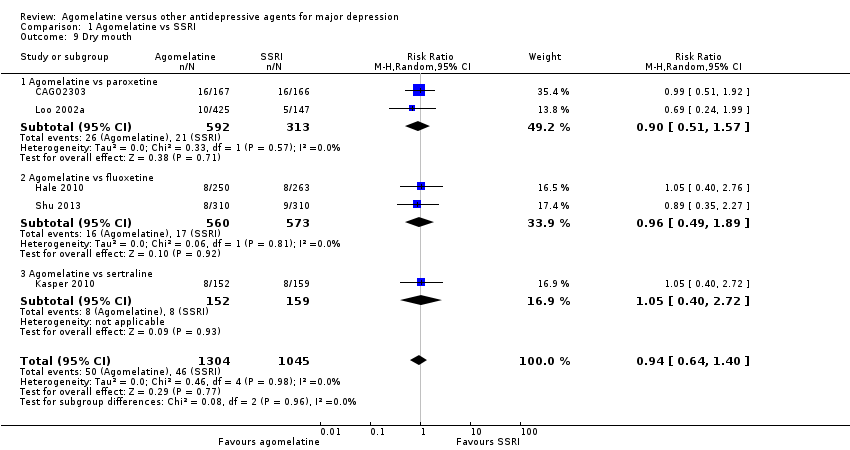
Comparison 1 Agomelatine vs SSRI, Outcome 9 Dry mouth.

Comparison 1 Agomelatine vs SSRI, Outcome 10 Constipation.

Comparison 1 Agomelatine vs SSRI, Outcome 11 Dizziness.

Comparison 1 Agomelatine vs SSRI, Outcome 12 Agitation or anxiety.
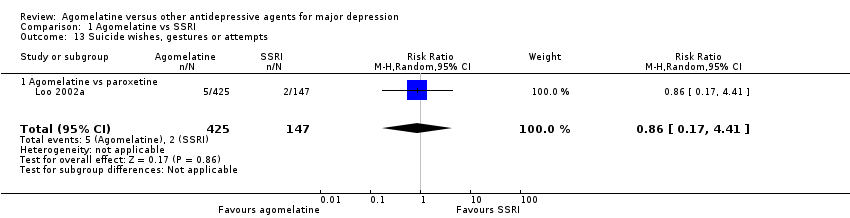
Comparison 1 Agomelatine vs SSRI, Outcome 13 Suicide wishes, gestures or attempts.

Comparison 1 Agomelatine vs SSRI, Outcome 14 Completed suicide.

Comparison 1 Agomelatine vs SSRI, Outcome 15 Vomiting or nausea.

Comparison 1 Agomelatine vs SSRI, Outcome 16 Diarrhoea.

Comparison 1 Agomelatine vs SSRI, Outcome 17 Sexual dysfunction.
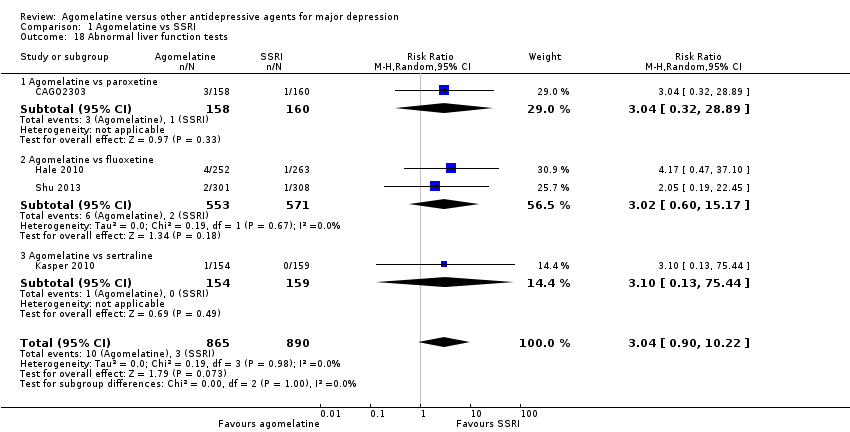
Comparison 1 Agomelatine vs SSRI, Outcome 18 Abnormal liver function tests.

Comparison 1 Agomelatine vs SSRI, Outcome 19 Depression scales endpoint score.

Comparison 1 Agomelatine vs SSRI, Outcome 20 Subgroup analysis: dosing ‐ response rates.

Comparison 1 Agomelatine vs SSRI, Outcome 21 Sensitivity analysis: excluding trials with > 20% drop outs ‐ response rates.

Comparison 1 Agomelatine vs SSRI, Outcome 22 Sensitivity analysis: excluding imputed response rates.

Comparison 1 Agomelatine vs SSRI, Outcome 23 Sensitivity analysis: excluding imputed remission rates.

Comparison 1 Agomelatine vs SSRI, Outcome 24 Sensitivity analysis: excluding trials with imputed SDs.

Comparison 1 Agomelatine vs SSRI, Outcome 25 Sensitivity analysis: response rates ‐ best case.

Comparison 1 Agomelatine vs SSRI, Outcome 26 Sensitivity analysis: response rates ‐ worst case.

Comparison 1 Agomelatine vs SSRI, Outcome 27 Sensitivity analysis: remission rates ‐ best case.

Comparison 1 Agomelatine vs SSRI, Outcome 28 Sensitivity analysis:remission rates ‐ worst case.

Comparison 1 Agomelatine vs SSRI, Outcome 29 Sensitivity anal': excluding studies with bipolar participants ‐ response rates.

Comparison 1 Agomelatine vs SSRI, Outcome 30 Additional subgroup analysis: unpublished vs published trials ‐ response rates.

Comparison 2 Agomelatine vs SNRI, Outcome 1 Response rates.

Comparison 2 Agomelatine vs SNRI, Outcome 2 Remission rates.

Comparison 2 Agomelatine vs SNRI, Outcome 3 Total drop outs.

Comparison 2 Agomelatine vs SNRI, Outcome 4 Drop out due to inefficacy.

Comparison 2 Agomelatine vs SNRI, Outcome 5 Drop outs due to side effects.
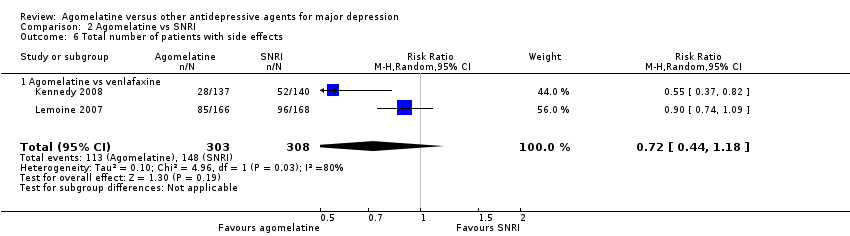
Comparison 2 Agomelatine vs SNRI, Outcome 6 Total number of patients with side effects.

Comparison 2 Agomelatine vs SNRI, Outcome 7 Sleepiness or drowsiness.

Comparison 2 Agomelatine vs SNRI, Outcome 8 Insomnia.

Comparison 2 Agomelatine vs SNRI, Outcome 9 Dry mouth.

Comparison 2 Agomelatine vs SNRI, Outcome 10 Constipation.

Comparison 2 Agomelatine vs SNRI, Outcome 11 Dizziness.

Comparison 2 Agomelatine vs SNRI, Outcome 12 Vomiting or nausea.

Comparison 2 Agomelatine vs SNRI, Outcome 13 Diarrhoea.

Comparison 2 Agomelatine vs SNRI, Outcome 14 Depression scales endpoint score.

Comparison 2 Agomelatine vs SNRI, Outcome 15 Subgroup analysis: dosing ‐ response rates.

Comparison 2 Agomelatine vs SNRI, Outcome 16 Subgroup analysis: severity ‐ response rates.
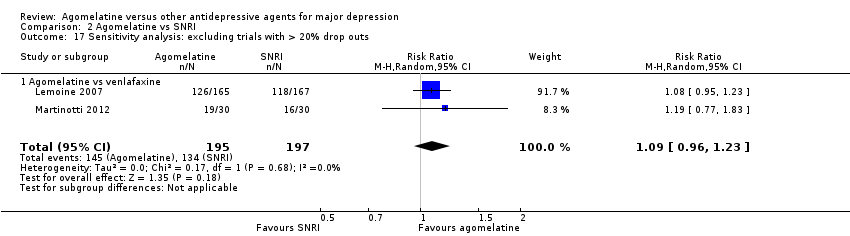
Comparison 2 Agomelatine vs SNRI, Outcome 17 Sensitivity analysis: excluding trials with > 20% drop outs.

Comparison 2 Agomelatine vs SNRI, Outcome 18 Sensitivity analysis: excluding imputed remission rates.

Comparison 2 Agomelatine vs SNRI, Outcome 19 Sensitivity analysis: response rates ‐ best case.

Comparison 2 Agomelatine vs SNRI, Outcome 20 Sensitivity analysis: response rates ‐ worst case.
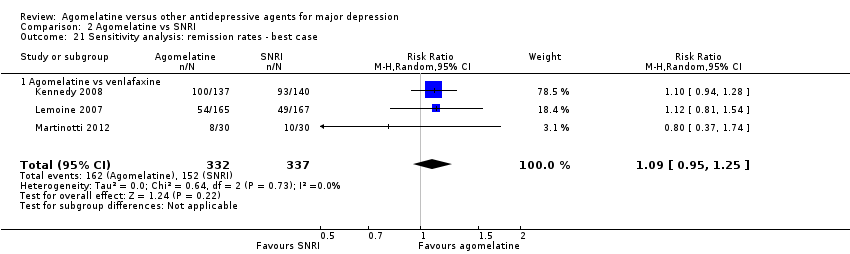
Comparison 2 Agomelatine vs SNRI, Outcome 21 Sensitivity analysis: remission rates ‐ best case.

Comparison 2 Agomelatine vs SNRI, Outcome 22 Sensitivity analysis: remission rates ‐ worst case.
| Agomelatine compared to SSRI for major depression | ||||||
| Patient or population: patients with major depression | ||||||
| Outcomes | Illustrative comparative risks* (95% CI) | Relative effect | No of Participants | Quality of the evidence | Comments | |
| Assumed risk | Corresponding risk | |||||
| SSRI | Agomelatine | |||||
| Response rates | Study population | RR 1.01 | 3826 | ⊕⊝⊝⊝ | ||
| 610 per 1000 | 616 per 1000 | |||||
| Moderate | ||||||
| 557 per 1000 | 563 per 1000 | |||||
| Remission rates | Study population | RR 0.83 | 3826 | ⊕⊝⊝⊝ | Most of the difference in heterogeneity existed between published and unpublished studies | |
| 363 per 1000 | 302 per 1000 | |||||
| Moderate | ||||||
| 264 per 1000 | 219 per 1000 | |||||
| Total drop outs | Study population | RR 0.95 | 3826 | ⊕⊝⊝⊝ | ||
| 189 per 1000 | 180 per 1000 | |||||
| Moderate | ||||||
| 188 per 1000 | 179 per 1000 | |||||
| Drop out due to inefficacy | Study population | RR 0.99 | 3377 | ⊕⊝⊝⊝ | ||
| 44 per 1000 | 43 per 1000 | |||||
| Moderate | ||||||
| 49 per 1000 | 49 per 1000 | |||||
| Drop outs due to side effects | Study population | RR 0.68 | 3377 | ⊕⊝⊝⊝ | ||
| 70 per 1000 | 47 per 1000 | |||||
| Moderate | ||||||
| 65 per 1000 | 44 per 1000 | |||||
| Total number of participants with side effects | Study population | RR 0.91 | 2490 | ⊕⊝⊝⊝ | ||
| 594 per 1000 | 540 per 1000 | |||||
| Moderate | ||||||
| 611 per 1000 | 556 per 1000 | |||||
| *The basis for the assumed risk (e.g. the median control group risk across studies) is provided in footnotes. The corresponding risk (and its 95% confidence interval) is based on the assumed risk in the comparison group and the relative effect of the intervention (and its 95% CI). | ||||||
| GRADE Working Group grades of evidence | ||||||
| 1 Most studies were funded by the pharmaceutical company that manufactures agomelatine (Servier). Four out of ten studies were unpublished | ||||||
| Agomelatine compared to SNRI for major depression | ||||||
| Patient or population: patients with major depression | ||||||
| Outcomes | Illustrative comparative risks* (95% CI) | Relative effect | No of Participants | Quality of the evidence | Comments | |
| Assumed risk | Corresponding risk | |||||
| SNRI | Agomelatine | |||||
| Response rates | Study population | RR 1.06 | 669 | ⊕⊝⊝⊝ | ||
| 727 per 1000 | 771 per 1000 | |||||
| Moderate | ||||||
| 707 per 1000 | 749 per 1000 | |||||
| Remission rates | Study population | RR 1.08 | 669 | ⊕⊝⊝⊝ | ||
| 454 per 1000 | 490 per 1000 | |||||
| Moderate | ||||||
| 333 per 1000 | 360 per 1000 | |||||
| Total drop outs | Study population | RR 0.4 | 392 | ⊕⊝⊝⊝ | ||
| 228 per 1000 | 91 per 1000 | |||||
| Moderate | ||||||
| 258 per 1000 | 103 per 1000 | |||||
| Drop out due to inefficacy | Study population | RR 1.01 | 332 | ⊕⊝⊝⊝ | ||
| 18 per 1000 | 18 per 1000 | |||||
| Moderate | ||||||
| 18 per 1000 | 18 per 1000 | |||||
| Drop outs due to side effects | Study population | RR 0.3 | 608 | ⊕⊝⊝⊝ | ||
| 111 per 1000 | 33 per 1000 | |||||
| Moderate | ||||||
| 109 per 1000 | 33 per 1000 | |||||
| Total number of patients with side effects | Study population | RR 0.72 | 611 | ⊕⊝⊝⊝ | ||
| 481 per 1000 | 346 per 1000 | |||||
| Moderate | ||||||
| 471 per 1000 | 339 per 1000 | |||||
| *The basis for the assumed risk (e.g. the median control group risk across studies) is provided in footnotes. The corresponding risk (and its 95% confidence interval) is based on the assumed risk in the comparison group and the relative effect of the intervention (and its 95% CI). | ||||||
| GRADE Working Group grades of evidence | ||||||
| 1 The studies included in our review were conducted in inpatient and outpatient settings. Results may not be generalisable for a primary care setting | ||||||
| Outcome or subgroup title | No. of studies | No. of participants | Statistical method | Effect size |
| 1 Response rates Show forest plot | 10 | 3826 | Risk Ratio (M‐H, Random, 95% CI) | 1.01 [0.95, 1.08] |
| 1.1 Agomelatine vs paroxetine | 3 | 1189 | Risk Ratio (M‐H, Random, 95% CI) | 0.92 [0.77, 1.09] |
| 1.2 Agomelatine vs fluoxetine | 4 | 1862 | Risk Ratio (M‐H, Random, 95% CI) | 1.01 [0.92, 1.11] |
| 1.3 Agomelatine vs sertraline | 1 | 313 | Risk Ratio (M‐H, Random, 95% CI) | 1.11 [0.94, 1.30] |
| 1.4 Agomelatine vs escitalopram | 2 | 462 | Risk Ratio (M‐H, Random, 95% CI) | 1.05 [0.95, 1.16] |
| 2 Remission rates Show forest plot | 10 | 3826 | Risk Ratio (M‐H, Random, 95% CI) | 0.83 [0.68, 1.01] |
| 2.1 Agomelatine vs paroxetine | 3 | 1189 | Risk Ratio (M‐H, Random, 95% CI) | 0.61 [0.32, 1.18] |
| 2.2 Agomelatine vs fluoxetine | 4 | 1862 | Risk Ratio (M‐H, Random, 95% CI) | 0.76 [0.55, 1.05] |
| 2.3 Agomelatine vs sertraline | 1 | 313 | Risk Ratio (M‐H, Random, 95% CI) | 1.12 [0.80, 1.58] |
| 2.4 Agomelatine vs escitalopram | 2 | 462 | Risk Ratio (M‐H, Random, 95% CI) | 1.13 [0.94, 1.35] |
| 3 Total drop outs Show forest plot | 10 | 3826 | Risk Ratio (M‐H, Random, 95% CI) | 0.95 [0.83, 1.09] |
| 3.1 Agomelatine vs paroxetine | 3 | 1189 | Risk Ratio (M‐H, Random, 95% CI) | 1.01 [0.80, 1.28] |
| 3.2 Agomelatine vs fluoxetine | 4 | 1862 | Risk Ratio (M‐H, Random, 95% CI) | 0.96 [0.74, 1.26] |
| 3.3 Agomelatine vs sertraline | 1 | 313 | Risk Ratio (M‐H, Random, 95% CI) | 0.72 [0.43, 1.21] |
| 3.4 Agomelatine vs escitalopram | 2 | 462 | Risk Ratio (M‐H, Random, 95% CI) | 0.81 [0.50, 1.32] |
| 4 Drop out due to inefficacy Show forest plot | 9 | 3377 | Risk Ratio (M‐H, Random, 95% CI) | 0.99 [0.71, 1.37] |
| 4.1 Agomelatine vs paroxetine | 3 | 1189 | Risk Ratio (M‐H, Random, 95% CI) | 1.07 [0.64, 1.80] |
| 4.2 Agomelatine vs fluoxetine | 3 | 1413 | Risk Ratio (M‐H, Random, 95% CI) | 0.97 [0.57, 1.65] |
| 4.3 Agomelatine vs sertraline | 1 | 313 | Risk Ratio (M‐H, Random, 95% CI) | 0.52 [0.16, 1.68] |
| 4.4 Agomelatine vs escitalopram | 2 | 462 | Risk Ratio (M‐H, Random, 95% CI) | 1.34 [0.43, 4.21] |
| 5 Drop outs due to side effects Show forest plot | 9 | 3377 | Risk Ratio (M‐H, Random, 95% CI) | 0.68 [0.51, 0.91] |
| 5.1 Agomelatine vs paroxetine | 3 | 1189 | Risk Ratio (M‐H, Random, 95% CI) | 0.83 [0.49, 1.41] |
| 5.2 Agomelatine vs fluoxetine | 3 | 1413 | Risk Ratio (M‐H, Random, 95% CI) | 0.74 [0.50, 1.09] |
| 5.3 Agomelatine vs sertraline | 1 | 313 | Risk Ratio (M‐H, Random, 95% CI) | 0.37 [0.14, 1.00] |
| 5.4 Agomelatine vs escitalopram | 2 | 462 | Risk Ratio (M‐H, Random, 95% CI) | 0.40 [0.15, 1.06] |
| 6 Total number of patients with side effects Show forest plot | 6 | 2490 | Risk Ratio (M‐H, Random, 95% CI) | 0.91 [0.84, 0.98] |
| 6.1 Agomelatine vs paroxetine | 2 | 905 | Risk Ratio (M‐H, Random, 95% CI) | 0.86 [0.78, 0.94] |
| 6.2 Agomelatine vs fluoxetine | 2 | 1141 | Risk Ratio (M‐H, Random, 95% CI) | 1.00 [0.89, 1.11] |
| 6.3 Agomelatine vs sertraline | 1 | 307 | Risk Ratio (M‐H, Random, 95% CI) | 0.98 [0.78, 1.23] |
| 6.4 Agomelatine vs escitalopram | 1 | 137 | Risk Ratio (M‐H, Random, 95% CI) | 0.81 [0.66, 0.99] |
| 7 Sleepiness or drowsiness Show forest plot | 5 | 1868 | Risk Ratio (M‐H, Random, 95% CI) | 0.96 [0.43, 2.15] |
| 7.1 Agomelatine vs paroxetine | 2 | 905 | Risk Ratio (M‐H, Random, 95% CI) | 0.63 [0.32, 1.21] |
| 7.2 Agomelatine vs fluoxetine | 1 | 513 | Risk Ratio (M‐H, Random, 95% CI) | 1.75 [0.78, 3.93] |
| 7.3 Agomelatine vs sertraline | 1 | 313 | Risk Ratio (M‐H, Random, 95% CI) | 4.65 [1.02, 21.16] |
| 7.4 Agomelatine vs escitalopram | 1 | 137 | Risk Ratio (M‐H, Random, 95% CI) | 0.19 [0.02, 1.55] |
| 8 Insomnia Show forest plot | 2 | 1192 | Risk Ratio (M‐H, Random, 95% CI) | 0.78 [0.38, 1.59] |
| 8.1 Agomelatine vs paroxetine | 1 | 572 | Risk Ratio (M‐H, Random, 95% CI) | 0.54 [0.21, 1.38] |
| 8.2 Agomelatine vs fluoxetine | 1 | 620 | Risk Ratio (M‐H, Random, 95% CI) | 1.13 [0.44, 2.88] |
| 9 Dry mouth Show forest plot | 5 | 2349 | Risk Ratio (M‐H, Random, 95% CI) | 0.94 [0.64, 1.40] |
| 9.1 Agomelatine vs paroxetine | 2 | 905 | Risk Ratio (M‐H, Random, 95% CI) | 0.90 [0.51, 1.57] |
| 9.2 Agomelatine vs fluoxetine | 2 | 1133 | Risk Ratio (M‐H, Random, 95% CI) | 0.96 [0.49, 1.89] |
| 9.3 Agomelatine vs sertraline | 1 | 311 | Risk Ratio (M‐H, Random, 95% CI) | 1.05 [0.40, 2.72] |
| 10 Constipation Show forest plot | 1 | 513 | Risk Ratio (M‐H, Random, 95% CI) | 2.81 [0.75, 10.46] |
| 10.1 Agomelatine vs fluoxetine | 1 | 513 | Risk Ratio (M‐H, Random, 95% CI) | 2.81 [0.75, 10.46] |
| 11 Dizziness Show forest plot | 4 | 1603 | Risk Ratio (M‐H, Random, 95% CI) | 1.00 [0.64, 1.55] |
| 11.1 Agomelatine vs paroxetine | 1 | 333 | Risk Ratio (M‐H, Random, 95% CI) | 0.80 [0.32, 1.96] |
| 11.2 Agomelatine vs fluoxetine | 2 | 1133 | Risk Ratio (M‐H, Random, 95% CI) | 1.17 [0.71, 1.94] |
| 11.3 Agomelatine vs escitalopram | 1 | 137 | Risk Ratio (M‐H, Random, 95% CI) | 0.23 [0.03, 2.03] |
| 12 Agitation or anxiety Show forest plot | 2 | 1192 | Risk Ratio (M‐H, Random, 95% CI) | 1.02 [0.46, 2.27] |
| 12.1 Agomelatine vs paroxetine | 1 | 572 | Risk Ratio (M‐H, Random, 95% CI) | 1.21 [0.40, 3.62] |
| 12.2 Agomelatine vs fluoxetine | 1 | 620 | Risk Ratio (M‐H, Random, 95% CI) | 0.83 [0.26, 2.70] |
| 13 Suicide wishes, gestures or attempts Show forest plot | 1 | 572 | Risk Ratio (M‐H, Random, 95% CI) | 0.86 [0.17, 4.41] |
| 13.1 Agomelatine vs paroxetine | 1 | 572 | Risk Ratio (M‐H, Random, 95% CI) | 0.86 [0.17, 4.41] |
| 14 Completed suicide Show forest plot | 1 | 572 | Risk Ratio (M‐H, Random, 95% CI) | 0.35 [0.02, 5.49] |
| 14.1 Agomelatine vs paroxetine | 1 | 572 | Risk Ratio (M‐H, Random, 95% CI) | 0.35 [0.02, 5.49] |
| 15 Vomiting or nausea Show forest plot | 5 | 2175 | Risk Ratio (M‐H, Random, 95% CI) | 0.70 [0.33, 1.45] |
| 15.1 Agomelatine vs paroxetine | 2 | 905 | Risk Ratio (M‐H, Random, 95% CI) | 0.34 [0.23, 0.52] |
| 15.2 Agomelatine vs fluoxetine | 2 | 1133 | Risk Ratio (M‐H, Random, 95% CI) | 1.54 [0.30, 7.90] |
| 15.3 Agomelatine vs escitalopram | 1 | 137 | Risk Ratio (M‐H, Random, 95% CI) | 0.65 [0.26, 1.61] |
| 16 Diarrhoea Show forest plot | 4 | 1533 | Risk Ratio (M‐H, Random, 95% CI) | 0.80 [0.46, 1.40] |
| 16.1 Agomelatine vs paroxetine | 1 | 572 | Risk Ratio (M‐H, Random, 95% CI) | 0.52 [0.19, 1.43] |
| 16.2 Agomelatine vs fluoxetine | 1 | 513 | Risk Ratio (M‐H, Random, 95% CI) | 1.05 [0.37, 2.96] |
| 16.3 Agomelatine vs sertraline | 1 | 311 | Risk Ratio (M‐H, Random, 95% CI) | 0.70 [0.25, 1.91] |
| 16.4 Agomelatine vs escitalopram | 1 | 137 | Risk Ratio (M‐H, Random, 95% CI) | 1.86 [0.35, 9.82] |
| 17 Sexual dysfunction Show forest plot | 1 | 333 | Risk Ratio (M‐H, Random, 95% CI) | 0.14 [0.04, 0.47] |
| 17.1 Agomelatine vs paroxetine | 1 | 333 | Risk Ratio (M‐H, Random, 95% CI) | 0.14 [0.04, 0.47] |
| 18 Abnormal liver function tests Show forest plot | 4 | 1755 | Risk Ratio (M‐H, Random, 95% CI) | 3.04 [0.90, 10.22] |
| 18.1 Agomelatine vs paroxetine | 1 | 318 | Risk Ratio (M‐H, Random, 95% CI) | 3.04 [0.32, 28.89] |
| 18.2 Agomelatine vs fluoxetine | 2 | 1124 | Risk Ratio (M‐H, Random, 95% CI) | 3.02 [0.60, 15.17] |
| 18.3 Agomelatine vs sertraline | 1 | 313 | Risk Ratio (M‐H, Random, 95% CI) | 3.10 [0.13, 75.44] |
| 19 Depression scales endpoint score Show forest plot | 10 | 3457 | Std. Mean Difference (IV, Random, 95% CI) | 0.00 [‐0.11, 0.12] |
| 19.1 Agomelatine vs paroxetine | 3 | 882 | Std. Mean Difference (IV, Random, 95% CI) | 0.16 [‐0.11, 0.43] |
| 19.2 Agomelatine vs fluoxetine | 4 | 1816 | Std. Mean Difference (IV, Random, 95% CI) | ‐0.01 [‐0.15, 0.13] |
| 19.3 Agomelatine vs sertraline | 1 | 306 | Std. Mean Difference (IV, Random, 95% CI) | ‐0.23 [‐0.46, ‐0.01] |
| 19.4 Agomelatine vs escitalopram | 2 | 453 | Std. Mean Difference (IV, Random, 95% CI) | ‐0.08 [‐0.26, 0.11] |
| 20 Subgroup analysis: dosing ‐ response rates Show forest plot | 10 | 3826 | Risk Ratio (M‐H, Random, 95% CI) | 1.01 [0.95, 1.08] |
| 20.1 Flexible dosing | 6 | 2255 | Risk Ratio (M‐H, Random, 95% CI) | 1.03 [0.94, 1.12] |
| 20.2 Fixed dosing | 4 | 1571 | Risk Ratio (M‐H, Random, 95% CI) | 0.97 [0.88, 1.07] |
| 21 Sensitivity analysis: excluding trials with > 20% drop outs ‐ response rates Show forest plot | 5 | 1516 | Risk Ratio (M‐H, Random, 95% CI) | 1.06 [0.97, 1.16] |
| 21.1 Agomelatine vs paroxetine | 1 | 280 | Risk Ratio (M‐H, Random, 95% CI) | 0.93 [0.74, 1.17] |
| 21.2 Agomelatine vs fluoxetine | 2 | 785 | Risk Ratio (M‐H, Random, 95% CI) | 1.03 [0.84, 1.27] |
| 21.3 Agomelatine vs sertraline | 1 | 313 | Risk Ratio (M‐H, Random, 95% CI) | 1.11 [0.94, 1.30] |
| 21.4 Agomelatine vs escitalopram | 1 | 138 | Risk Ratio (M‐H, Random, 95% CI) | 1.15 [0.87, 1.54] |
| 22 Sensitivity analysis: excluding imputed response rates Show forest plot | 8 | 3097 | Risk Ratio (M‐H, Random, 95% CI) | 1.02 [0.95, 1.10] |
| 22.1 Agomelatine vs paroxetine | 2 | 909 | Risk Ratio (M‐H, Random, 95% CI) | 0.90 [0.67, 1.21] |
| 22.2 Agomelatine vs fluoxetine | 3 | 1413 | Risk Ratio (M‐H, Random, 95% CI) | 1.02 [0.91, 1.15] |
| 22.3 Agomelatine vs sertraline | 1 | 313 | Risk Ratio (M‐H, Random, 95% CI) | 1.11 [0.94, 1.30] |
| 22.4 Agomelatine vs escitalopram | 2 | 462 | Risk Ratio (M‐H, Random, 95% CI) | 1.05 [0.95, 1.16] |
| 23 Sensitivity analysis: excluding imputed remission rates Show forest plot | 6 | 2331 | Risk Ratio (M‐H, Random, 95% CI) | 0.97 [0.83, 1.14] |
| 23.1 Agomelatine vs paroxetine | 2 | 909 | Risk Ratio (M‐H, Random, 95% CI) | 0.81 [0.67, 0.97] |
| 23.2 Agomelatine vs fluoxetine | 2 | 785 | Risk Ratio (M‐H, Random, 95% CI) | 0.98 [0.67, 1.45] |
| 23.3 Agomelatine vs sertraline | 1 | 313 | Risk Ratio (M‐H, Random, 95% CI) | 1.12 [0.80, 1.58] |
| 23.4 Agomelatine vs escitalopram | 1 | 324 | Risk Ratio (M‐H, Random, 95% CI) | 1.12 [0.93, 1.35] |
| 24 Sensitivity analysis: excluding trials with imputed SDs Show forest plot | 8 | 2524 | Std. Mean Difference (IV, Random, 95% CI) | 0.01 [‐0.15, 0.16] |
| 24.1 Agomelatine vs paroxetine | 3 | 882 | Std. Mean Difference (IV, Random, 95% CI) | 0.16 [‐0.11, 0.43] |
| 24.2 Agomelatine vs fluoxetine | 3 | 1207 | Std. Mean Difference (IV, Random, 95% CI) | ‐0.02 [‐0.23, 0.18] |
| 24.3 Agomelatine vs sertraline | 1 | 306 | Std. Mean Difference (IV, Random, 95% CI) | ‐0.23 [‐0.46, ‐0.01] |
| 24.4 Agomelatine vs escitalopram | 1 | 129 | Std. Mean Difference (IV, Random, 95% CI) | ‐0.21 [‐0.55, 0.14] |
| 25 Sensitivity analysis: response rates ‐ best case Show forest plot | 10 | 3826 | Risk Ratio (M‐H, Random, 95% CI) | 1.05 [0.99, 1.11] |
| 25.1 Agomelatine vs paroxetine | 3 | 1189 | Risk Ratio (M‐H, Random, 95% CI) | 0.96 [0.83, 1.11] |
| 25.2 Agomelatine vs fluoxetine | 4 | 1862 | Risk Ratio (M‐H, Random, 95% CI) | 1.06 [0.99, 1.14] |
| 25.3 Agomelatine vs sertraline | 1 | 313 | Risk Ratio (M‐H, Random, 95% CI) | 1.15 [0.98, 1.35] |
| 25.4 Agomelatine vs escitalopram | 2 | 462 | Risk Ratio (M‐H, Random, 95% CI) | 1.08 [0.93, 1.26] |
| 26 Sensitivity analysis: response rates ‐ worst case Show forest plot | 10 | 3826 | Risk Ratio (M‐H, Random, 95% CI) | 0.98 [0.92, 1.04] |
| 26.1 Agomelatine vs paroxetine | 3 | 1189 | Risk Ratio (M‐H, Random, 95% CI) | 0.88 [0.73, 1.07] |
| 26.2 Agomelatine vs fluoxetine | 4 | 1862 | Risk Ratio (M‐H, Random, 95% CI) | 0.98 [0.90, 1.07] |
| 26.3 Agomelatine vs sertraline | 1 | 313 | Risk Ratio (M‐H, Random, 95% CI) | 1.08 [0.92, 1.27] |
| 26.4 Agomelatine vs escitalopram | 2 | 462 | Risk Ratio (M‐H, Random, 95% CI) | 1.03 [0.94, 1.13] |
| 27 Sensitivity analysis: remission rates ‐ best case Show forest plot | 9 | 3502 | Risk Ratio (M‐H, Random, 95% CI) | 0.91 [0.72, 1.15] |
| 27.1 Agomelatine vs paroxetine | 3 | 1189 | Risk Ratio (M‐H, Random, 95% CI) | 0.75 [0.48, 1.17] |
| 27.2 Agomelatine vs fluoxetine | 4 | 1862 | Risk Ratio (M‐H, Random, 95% CI) | 0.89 [0.61, 1.30] |
| 27.3 Agomelatine vs sertraline | 1 | 313 | Risk Ratio (M‐H, Random, 95% CI) | 1.22 [0.87, 1.69] |
| 27.4 Agomelatine vs escitalopram | 1 | 138 | Risk Ratio (M‐H, Random, 95% CI) | 1.42 [0.74, 2.71] |
| 28 Sensitivity analysis:remission rates ‐ worst case Show forest plot | 9 | 3502 | Risk Ratio (M‐H, Random, 95% CI) | 0.73 [0.57, 0.94] |
| 28.1 Agomelatine vs paroxetine | 3 | 1189 | Risk Ratio (M‐H, Random, 95% CI) | 0.57 [0.29, 1.12] |
| 28.2 Agomelatine vs fluoxetine | 4 | 1862 | Risk Ratio (M‐H, Random, 95% CI) | 0.74 [0.52, 1.05] |
| 28.3 Agomelatine vs sertraline | 1 | 313 | Risk Ratio (M‐H, Random, 95% CI) | 1.08 [0.77, 1.50] |
| 28.4 Agomelatine vs escitalopram | 1 | 138 | Risk Ratio (M‐H, Random, 95% CI) | 0.79 [0.43, 1.43] |
| 29 Sensitivity anal': excluding studies with bipolar participants ‐ response rates Show forest plot | 2 | 617 | Risk Ratio (M‐H, Random, 95% CI) | 0.84 [0.70, 1.03] |
| 29.1 Agomelatine vs paroxetine | 2 | 617 | Risk Ratio (M‐H, Random, 95% CI) | 0.84 [0.70, 1.03] |
| 30 Additional subgroup analysis: unpublished vs published trials ‐ response rates Show forest plot | 10 | 3826 | Risk Ratio (M‐H, Random, 95% CI) | 1.01 [0.95, 1.08] |
| 30.1 Unpublished | 4 | 1336 | Risk Ratio (M‐H, Random, 95% CI) | 0.90 [0.81, 1.00] |
| 30.2 Published | 6 | 2490 | Risk Ratio (M‐H, Random, 95% CI) | 1.05 [1.00, 1.11] |
| Outcome or subgroup title | No. of studies | No. of participants | Statistical method | Effect size |
| 1 Response rates Show forest plot | 3 | 669 | Risk Ratio (M‐H, Random, 95% CI) | 1.06 [0.98, 1.16] |
| 1.1 Agomelatine vs venlafaxine | 3 | 669 | Risk Ratio (M‐H, Random, 95% CI) | 1.06 [0.98, 1.16] |
| 2 Remission rates Show forest plot | 3 | 669 | Risk Ratio (M‐H, Random, 95% CI) | 1.08 [0.94, 1.24] |
| 2.1 Agomelatine vs venlafaxine | 3 | 669 | Risk Ratio (M‐H, Random, 95% CI) | 1.08 [0.94, 1.24] |
| 3 Total drop outs Show forest plot | 2 | 392 | Risk Ratio (M‐H, Random, 95% CI) | 0.40 [0.24, 0.67] |
| 3.1 Agomelatine vs venlafaxine | 2 | 392 | Risk Ratio (M‐H, Random, 95% CI) | 0.40 [0.24, 0.67] |
| 4 Drop out due to inefficacy Show forest plot | 1 | 332 | Risk Ratio (M‐H, Random, 95% CI) | 1.01 [0.21, 4.94] |
| 4.1 Agomelatine vs venlafaxine | 1 | 332 | Risk Ratio (M‐H, Random, 95% CI) | 1.01 [0.21, 4.94] |
| 5 Drop outs due to side effects Show forest plot | 2 | 608 | Risk Ratio (M‐H, Random, 95% CI) | 0.30 [0.15, 0.59] |
| 5.1 Agomelatine vs venlafaxine | 2 | 608 | Risk Ratio (M‐H, Random, 95% CI) | 0.30 [0.15, 0.59] |
| 6 Total number of patients with side effects Show forest plot | 2 | 611 | Risk Ratio (M‐H, Random, 95% CI) | 0.72 [0.44, 1.18] |
| 6.1 Agomelatine vs venlafaxine | 2 | 611 | Risk Ratio (M‐H, Random, 95% CI) | 0.72 [0.44, 1.18] |
| 7 Sleepiness or drowsiness Show forest plot | 1 | 334 | Risk Ratio (M‐H, Random, 95% CI) | 0.76 [0.27, 2.14] |
| 7.1 Agomelatine vs venlafaxine | 1 | 334 | Risk Ratio (M‐H, Random, 95% CI) | 0.76 [0.27, 2.14] |
| 8 Insomnia Show forest plot | 1 | 332 | Risk Ratio (M‐H, Random, 95% CI) | 0.25 [0.03, 2.24] |
| 8.1 Agomelatine vs venlafaxine | 1 | 332 | Risk Ratio (M‐H, Random, 95% CI) | 0.25 [0.03, 2.24] |
| 9 Dry mouth Show forest plot | 1 | 332 | Risk Ratio (M‐H, Random, 95% CI) | 0.51 [0.13, 1.99] |
| 9.1 Agomelatine vs venlafaxine | 1 | 332 | Risk Ratio (M‐H, Random, 95% CI) | 0.51 [0.13, 1.99] |
| 10 Constipation Show forest plot | 1 | 332 | Risk Ratio (M‐H, Random, 95% CI) | 0.87 [0.30, 2.53] |
| 10.1 Agomelatine vs venlafaxine | 1 | 332 | Risk Ratio (M‐H, Random, 95% CI) | 0.87 [0.30, 2.53] |
| 11 Dizziness Show forest plot | 1 | 332 | Risk Ratio (M‐H, Random, 95% CI) | 0.19 [0.06, 0.64] |
| 11.1 Agomelatine vs venlafaxine | 1 | 332 | Risk Ratio (M‐H, Random, 95% CI) | 0.19 [0.06, 0.64] |
| 12 Vomiting or nausea Show forest plot | 2 | 609 | Risk Ratio (M‐H, Random, 95% CI) | 0.42 [0.17, 1.08] |
| 12.1 Agomelatine vs venlafaxine | 2 | 609 | Risk Ratio (M‐H, Random, 95% CI) | 0.42 [0.17, 1.08] |
| 13 Diarrhoea Show forest plot | 1 | 332 | Risk Ratio (M‐H, Random, 95% CI) | 2.70 [0.73, 10.00] |
| 13.1 Agomelatine vs venlafaxine | 1 | 332 | Risk Ratio (M‐H, Random, 95% CI) | 2.70 [0.73, 10.00] |
| 14 Depression scales endpoint score Show forest plot | 3 | 668 | Std. Mean Difference (IV, Random, 95% CI) | ‐0.07 [‐0.22, 0.08] |
| 14.1 Agomelatine vs venlafaxine | 3 | 668 | Std. Mean Difference (IV, Random, 95% CI) | ‐0.07 [‐0.22, 0.08] |
| 15 Subgroup analysis: dosing ‐ response rates Show forest plot | 3 | 669 | Risk Ratio (M‐H, Random, 95% CI) | 1.06 [0.98, 1.16] |
| 15.1 Flexible dosing | 1 | 332 | Risk Ratio (M‐H, Random, 95% CI) | 1.08 [0.95, 1.23] |
| 15.2 Fixed dosing | 2 | 337 | Risk Ratio (M‐H, Random, 95% CI) | 1.05 [0.94, 1.17] |
| 16 Subgroup analysis: severity ‐ response rates Show forest plot | 3 | 669 | Risk Ratio (M‐H, Random, 95% CI) | 1.06 [0.98, 1.16] |
| 16.1 Agomelatine vs venlafaxine (moderate depression) | 1 | 277 | Risk Ratio (M‐H, Random, 95% CI) | 1.04 [0.93, 1.17] |
| 16.2 Agomelatine vs venlafaxine (severe depression) | 2 | 392 | Risk Ratio (M‐H, Random, 95% CI) | 1.09 [0.96, 1.23] |
| 17 Sensitivity analysis: excluding trials with > 20% drop outs Show forest plot | 2 | 392 | Risk Ratio (M‐H, Random, 95% CI) | 1.09 [0.96, 1.23] |
| 17.1 Agomelatine vs venlafaxine | 2 | 392 | Risk Ratio (M‐H, Random, 95% CI) | 1.09 [0.96, 1.23] |
| 18 Sensitivity analysis: excluding imputed remission rates Show forest plot | 2 | 337 | Risk Ratio (M‐H, Random, 95% CI) | 1.09 [0.93, 1.26] |
| 18.1 Agomelatine vs venlafaxine | 2 | 337 | Risk Ratio (M‐H, Random, 95% CI) | 1.09 [0.93, 1.26] |
| 19 Sensitivity analysis: response rates ‐ best case Show forest plot | 3 | 669 | Risk Ratio (M‐H, Random, 95% CI) | 1.06 [0.98, 1.16] |
| 19.1 Agomelatine vs venlafaxine | 3 | 669 | Risk Ratio (M‐H, Random, 95% CI) | 1.06 [0.98, 1.16] |
| 20 Sensitivity analysis: response rates ‐ worst case Show forest plot | 3 | 669 | Risk Ratio (M‐H, Random, 95% CI) | 1.06 [0.97, 1.15] |
| 20.1 Agomelatine vs venlafaxine | 3 | 669 | Risk Ratio (M‐H, Random, 95% CI) | 1.06 [0.97, 1.15] |
| 21 Sensitivity analysis: remission rates ‐ best case Show forest plot | 3 | 669 | Risk Ratio (M‐H, Random, 95% CI) | 1.09 [0.95, 1.25] |
| 21.1 Agomelatine vs venlafaxine | 3 | 669 | Risk Ratio (M‐H, Random, 95% CI) | 1.09 [0.95, 1.25] |
| 22 Sensitivity analysis: remission rates ‐ worst case Show forest plot | 3 | 669 | Risk Ratio (M‐H, Random, 95% CI) | 1.08 [0.94, 1.24] |
| 22.1 Agomelatine vs venlafaxine | 3 | 669 | Risk Ratio (M‐H, Random, 95% CI) | 1.08 [0.94, 1.24] |