| 1 Response rates Show forest plot | 10 | 3826 | Risk Ratio (M‐H, Random, 95% CI) | 1.01 [0.95, 1.08] |
|
| 1.1 Agomelatine vs paroxetine | 3 | 1189 | Risk Ratio (M‐H, Random, 95% CI) | 0.92 [0.77, 1.09] |
| 1.2 Agomelatine vs fluoxetine | 4 | 1862 | Risk Ratio (M‐H, Random, 95% CI) | 1.01 [0.92, 1.11] |
| 1.3 Agomelatine vs sertraline | 1 | 313 | Risk Ratio (M‐H, Random, 95% CI) | 1.11 [0.94, 1.30] |
| 1.4 Agomelatine vs escitalopram | 2 | 462 | Risk Ratio (M‐H, Random, 95% CI) | 1.05 [0.95, 1.16] |
| 2 Remission rates Show forest plot | 10 | 3826 | Risk Ratio (M‐H, Random, 95% CI) | 0.83 [0.68, 1.01] |
|
| 2.1 Agomelatine vs paroxetine | 3 | 1189 | Risk Ratio (M‐H, Random, 95% CI) | 0.61 [0.32, 1.18] |
| 2.2 Agomelatine vs fluoxetine | 4 | 1862 | Risk Ratio (M‐H, Random, 95% CI) | 0.76 [0.55, 1.05] |
| 2.3 Agomelatine vs sertraline | 1 | 313 | Risk Ratio (M‐H, Random, 95% CI) | 1.12 [0.80, 1.58] |
| 2.4 Agomelatine vs escitalopram | 2 | 462 | Risk Ratio (M‐H, Random, 95% CI) | 1.13 [0.94, 1.35] |
| 3 Total drop outs Show forest plot | 10 | 3826 | Risk Ratio (M‐H, Random, 95% CI) | 0.95 [0.83, 1.09] |
|
| 3.1 Agomelatine vs paroxetine | 3 | 1189 | Risk Ratio (M‐H, Random, 95% CI) | 1.01 [0.80, 1.28] |
| 3.2 Agomelatine vs fluoxetine | 4 | 1862 | Risk Ratio (M‐H, Random, 95% CI) | 0.96 [0.74, 1.26] |
| 3.3 Agomelatine vs sertraline | 1 | 313 | Risk Ratio (M‐H, Random, 95% CI) | 0.72 [0.43, 1.21] |
| 3.4 Agomelatine vs escitalopram | 2 | 462 | Risk Ratio (M‐H, Random, 95% CI) | 0.81 [0.50, 1.32] |
| 4 Drop out due to inefficacy Show forest plot | 9 | 3377 | Risk Ratio (M‐H, Random, 95% CI) | 0.99 [0.71, 1.37] |
|
| 4.1 Agomelatine vs paroxetine | 3 | 1189 | Risk Ratio (M‐H, Random, 95% CI) | 1.07 [0.64, 1.80] |
| 4.2 Agomelatine vs fluoxetine | 3 | 1413 | Risk Ratio (M‐H, Random, 95% CI) | 0.97 [0.57, 1.65] |
| 4.3 Agomelatine vs sertraline | 1 | 313 | Risk Ratio (M‐H, Random, 95% CI) | 0.52 [0.16, 1.68] |
| 4.4 Agomelatine vs escitalopram | 2 | 462 | Risk Ratio (M‐H, Random, 95% CI) | 1.34 [0.43, 4.21] |
| 5 Drop outs due to side effects Show forest plot | 9 | 3377 | Risk Ratio (M‐H, Random, 95% CI) | 0.68 [0.51, 0.91] |
|
| 5.1 Agomelatine vs paroxetine | 3 | 1189 | Risk Ratio (M‐H, Random, 95% CI) | 0.83 [0.49, 1.41] |
| 5.2 Agomelatine vs fluoxetine | 3 | 1413 | Risk Ratio (M‐H, Random, 95% CI) | 0.74 [0.50, 1.09] |
| 5.3 Agomelatine vs sertraline | 1 | 313 | Risk Ratio (M‐H, Random, 95% CI) | 0.37 [0.14, 1.00] |
| 5.4 Agomelatine vs escitalopram | 2 | 462 | Risk Ratio (M‐H, Random, 95% CI) | 0.40 [0.15, 1.06] |
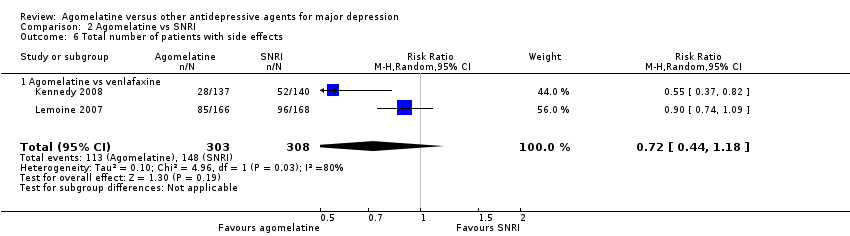
| 6 Total number of patients with side effects Show forest plot | 6 | 2490 | Risk Ratio (M‐H, Random, 95% CI) | 0.91 [0.84, 0.98] |
|
| 6.1 Agomelatine vs paroxetine | 2 | 905 | Risk Ratio (M‐H, Random, 95% CI) | 0.86 [0.78, 0.94] |
| 6.2 Agomelatine vs fluoxetine | 2 | 1141 | Risk Ratio (M‐H, Random, 95% CI) | 1.00 [0.89, 1.11] |
| 6.3 Agomelatine vs sertraline | 1 | 307 | Risk Ratio (M‐H, Random, 95% CI) | 0.98 [0.78, 1.23] |
| 6.4 Agomelatine vs escitalopram | 1 | 137 | Risk Ratio (M‐H, Random, 95% CI) | 0.81 [0.66, 0.99] |
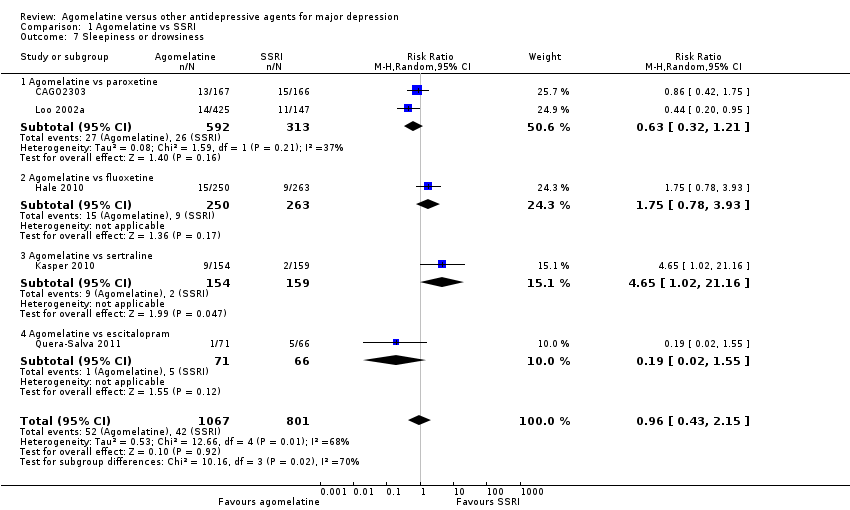
| 7 Sleepiness or drowsiness Show forest plot | 5 | 1868 | Risk Ratio (M‐H, Random, 95% CI) | 0.96 [0.43, 2.15] |
|
| 7.1 Agomelatine vs paroxetine | 2 | 905 | Risk Ratio (M‐H, Random, 95% CI) | 0.63 [0.32, 1.21] |
| 7.2 Agomelatine vs fluoxetine | 1 | 513 | Risk Ratio (M‐H, Random, 95% CI) | 1.75 [0.78, 3.93] |
| 7.3 Agomelatine vs sertraline | 1 | 313 | Risk Ratio (M‐H, Random, 95% CI) | 4.65 [1.02, 21.16] |
| 7.4 Agomelatine vs escitalopram | 1 | 137 | Risk Ratio (M‐H, Random, 95% CI) | 0.19 [0.02, 1.55] |
| 8 Insomnia Show forest plot | 2 | 1192 | Risk Ratio (M‐H, Random, 95% CI) | 0.78 [0.38, 1.59] |
|
| 8.1 Agomelatine vs paroxetine | 1 | 572 | Risk Ratio (M‐H, Random, 95% CI) | 0.54 [0.21, 1.38] |
| 8.2 Agomelatine vs fluoxetine | 1 | 620 | Risk Ratio (M‐H, Random, 95% CI) | 1.13 [0.44, 2.88] |
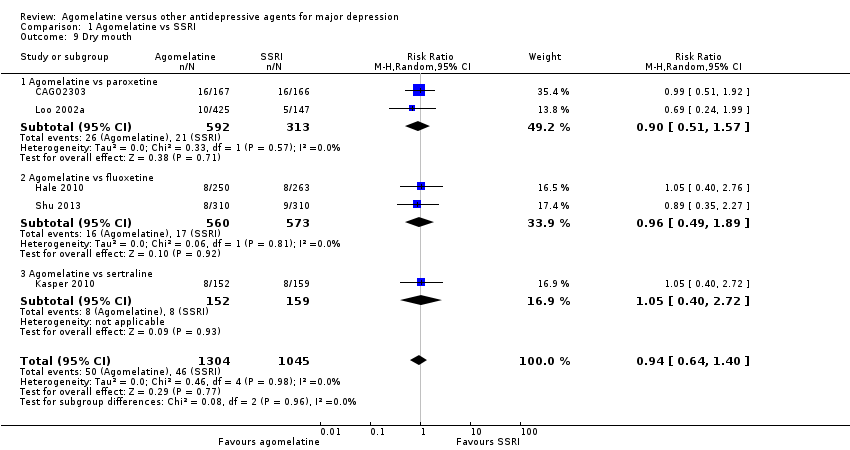
| 9 Dry mouth Show forest plot | 5 | 2349 | Risk Ratio (M‐H, Random, 95% CI) | 0.94 [0.64, 1.40] |
|
| 9.1 Agomelatine vs paroxetine | 2 | 905 | Risk Ratio (M‐H, Random, 95% CI) | 0.90 [0.51, 1.57] |
| 9.2 Agomelatine vs fluoxetine | 2 | 1133 | Risk Ratio (M‐H, Random, 95% CI) | 0.96 [0.49, 1.89] |
| 9.3 Agomelatine vs sertraline | 1 | 311 | Risk Ratio (M‐H, Random, 95% CI) | 1.05 [0.40, 2.72] |
| 10 Constipation Show forest plot | 1 | 513 | Risk Ratio (M‐H, Random, 95% CI) | 2.81 [0.75, 10.46] |
|
| 10.1 Agomelatine vs fluoxetine | 1 | 513 | Risk Ratio (M‐H, Random, 95% CI) | 2.81 [0.75, 10.46] |
| 11 Dizziness Show forest plot | 4 | 1603 | Risk Ratio (M‐H, Random, 95% CI) | 1.00 [0.64, 1.55] |
|
| 11.1 Agomelatine vs paroxetine | 1 | 333 | Risk Ratio (M‐H, Random, 95% CI) | 0.80 [0.32, 1.96] |
| 11.2 Agomelatine vs fluoxetine | 2 | 1133 | Risk Ratio (M‐H, Random, 95% CI) | 1.17 [0.71, 1.94] |
| 11.3 Agomelatine vs escitalopram | 1 | 137 | Risk Ratio (M‐H, Random, 95% CI) | 0.23 [0.03, 2.03] |
| 12 Agitation or anxiety Show forest plot | 2 | 1192 | Risk Ratio (M‐H, Random, 95% CI) | 1.02 [0.46, 2.27] |
|
| 12.1 Agomelatine vs paroxetine | 1 | 572 | Risk Ratio (M‐H, Random, 95% CI) | 1.21 [0.40, 3.62] |
| 12.2 Agomelatine vs fluoxetine | 1 | 620 | Risk Ratio (M‐H, Random, 95% CI) | 0.83 [0.26, 2.70] |
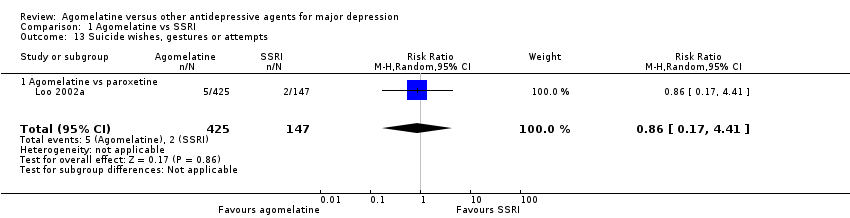
| 13 Suicide wishes, gestures or attempts Show forest plot | 1 | 572 | Risk Ratio (M‐H, Random, 95% CI) | 0.86 [0.17, 4.41] |
|
| 13.1 Agomelatine vs paroxetine | 1 | 572 | Risk Ratio (M‐H, Random, 95% CI) | 0.86 [0.17, 4.41] |
| 14 Completed suicide Show forest plot | 1 | 572 | Risk Ratio (M‐H, Random, 95% CI) | 0.35 [0.02, 5.49] |
|
| 14.1 Agomelatine vs paroxetine | 1 | 572 | Risk Ratio (M‐H, Random, 95% CI) | 0.35 [0.02, 5.49] |
| 15 Vomiting or nausea Show forest plot | 5 | 2175 | Risk Ratio (M‐H, Random, 95% CI) | 0.70 [0.33, 1.45] |
|
| 15.1 Agomelatine vs paroxetine | 2 | 905 | Risk Ratio (M‐H, Random, 95% CI) | 0.34 [0.23, 0.52] |
| 15.2 Agomelatine vs fluoxetine | 2 | 1133 | Risk Ratio (M‐H, Random, 95% CI) | 1.54 [0.30, 7.90] |
| 15.3 Agomelatine vs escitalopram | 1 | 137 | Risk Ratio (M‐H, Random, 95% CI) | 0.65 [0.26, 1.61] |
| 16 Diarrhoea Show forest plot | 4 | 1533 | Risk Ratio (M‐H, Random, 95% CI) | 0.80 [0.46, 1.40] |
|
| 16.1 Agomelatine vs paroxetine | 1 | 572 | Risk Ratio (M‐H, Random, 95% CI) | 0.52 [0.19, 1.43] |
| 16.2 Agomelatine vs fluoxetine | 1 | 513 | Risk Ratio (M‐H, Random, 95% CI) | 1.05 [0.37, 2.96] |
| 16.3 Agomelatine vs sertraline | 1 | 311 | Risk Ratio (M‐H, Random, 95% CI) | 0.70 [0.25, 1.91] |
| 16.4 Agomelatine vs escitalopram | 1 | 137 | Risk Ratio (M‐H, Random, 95% CI) | 1.86 [0.35, 9.82] |
| 17 Sexual dysfunction Show forest plot | 1 | 333 | Risk Ratio (M‐H, Random, 95% CI) | 0.14 [0.04, 0.47] |
|
| 17.1 Agomelatine vs paroxetine | 1 | 333 | Risk Ratio (M‐H, Random, 95% CI) | 0.14 [0.04, 0.47] |
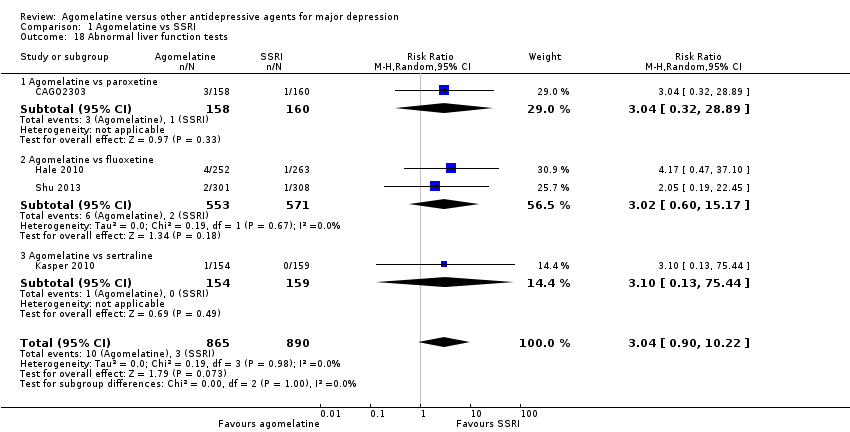
| 18 Abnormal liver function tests Show forest plot | 4 | 1755 | Risk Ratio (M‐H, Random, 95% CI) | 3.04 [0.90, 10.22] |
|
| 18.1 Agomelatine vs paroxetine | 1 | 318 | Risk Ratio (M‐H, Random, 95% CI) | 3.04 [0.32, 28.89] |
| 18.2 Agomelatine vs fluoxetine | 2 | 1124 | Risk Ratio (M‐H, Random, 95% CI) | 3.02 [0.60, 15.17] |
| 18.3 Agomelatine vs sertraline | 1 | 313 | Risk Ratio (M‐H, Random, 95% CI) | 3.10 [0.13, 75.44] |
| 19 Depression scales endpoint score Show forest plot | 10 | 3457 | Std. Mean Difference (IV, Random, 95% CI) | 0.00 [‐0.11, 0.12] |
|
| 19.1 Agomelatine vs paroxetine | 3 | 882 | Std. Mean Difference (IV, Random, 95% CI) | 0.16 [‐0.11, 0.43] |
| 19.2 Agomelatine vs fluoxetine | 4 | 1816 | Std. Mean Difference (IV, Random, 95% CI) | ‐0.01 [‐0.15, 0.13] |
| 19.3 Agomelatine vs sertraline | 1 | 306 | Std. Mean Difference (IV, Random, 95% CI) | ‐0.23 [‐0.46, ‐0.01] |
| 19.4 Agomelatine vs escitalopram | 2 | 453 | Std. Mean Difference (IV, Random, 95% CI) | ‐0.08 [‐0.26, 0.11] |
| 20 Subgroup analysis: dosing ‐ response rates Show forest plot | 10 | 3826 | Risk Ratio (M‐H, Random, 95% CI) | 1.01 [0.95, 1.08] |
|
| 20.1 Flexible dosing | 6 | 2255 | Risk Ratio (M‐H, Random, 95% CI) | 1.03 [0.94, 1.12] |
| 20.2 Fixed dosing | 4 | 1571 | Risk Ratio (M‐H, Random, 95% CI) | 0.97 [0.88, 1.07] |
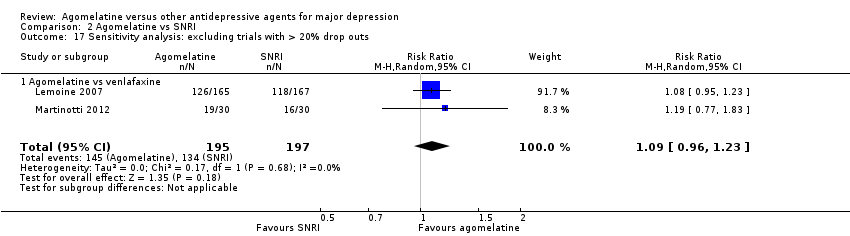
| 21 Sensitivity analysis: excluding trials with > 20% drop outs ‐ response rates Show forest plot | 5 | 1516 | Risk Ratio (M‐H, Random, 95% CI) | 1.06 [0.97, 1.16] |
|
| 21.1 Agomelatine vs paroxetine | 1 | 280 | Risk Ratio (M‐H, Random, 95% CI) | 0.93 [0.74, 1.17] |
| 21.2 Agomelatine vs fluoxetine | 2 | 785 | Risk Ratio (M‐H, Random, 95% CI) | 1.03 [0.84, 1.27] |
| 21.3 Agomelatine vs sertraline | 1 | 313 | Risk Ratio (M‐H, Random, 95% CI) | 1.11 [0.94, 1.30] |
| 21.4 Agomelatine vs escitalopram | 1 | 138 | Risk Ratio (M‐H, Random, 95% CI) | 1.15 [0.87, 1.54] |
| 22 Sensitivity analysis: excluding imputed response rates Show forest plot | 8 | 3097 | Risk Ratio (M‐H, Random, 95% CI) | 1.02 [0.95, 1.10] |
|
| 22.1 Agomelatine vs paroxetine | 2 | 909 | Risk Ratio (M‐H, Random, 95% CI) | 0.90 [0.67, 1.21] |
| 22.2 Agomelatine vs fluoxetine | 3 | 1413 | Risk Ratio (M‐H, Random, 95% CI) | 1.02 [0.91, 1.15] |
| 22.3 Agomelatine vs sertraline | 1 | 313 | Risk Ratio (M‐H, Random, 95% CI) | 1.11 [0.94, 1.30] |
| 22.4 Agomelatine vs escitalopram | 2 | 462 | Risk Ratio (M‐H, Random, 95% CI) | 1.05 [0.95, 1.16] |
| 23 Sensitivity analysis: excluding imputed remission rates Show forest plot | 6 | 2331 | Risk Ratio (M‐H, Random, 95% CI) | 0.97 [0.83, 1.14] |
|
| 23.1 Agomelatine vs paroxetine | 2 | 909 | Risk Ratio (M‐H, Random, 95% CI) | 0.81 [0.67, 0.97] |
| 23.2 Agomelatine vs fluoxetine | 2 | 785 | Risk Ratio (M‐H, Random, 95% CI) | 0.98 [0.67, 1.45] |
| 23.3 Agomelatine vs sertraline | 1 | 313 | Risk Ratio (M‐H, Random, 95% CI) | 1.12 [0.80, 1.58] |
| 23.4 Agomelatine vs escitalopram | 1 | 324 | Risk Ratio (M‐H, Random, 95% CI) | 1.12 [0.93, 1.35] |
| 24 Sensitivity analysis: excluding trials with imputed SDs Show forest plot | 8 | 2524 | Std. Mean Difference (IV, Random, 95% CI) | 0.01 [‐0.15, 0.16] |
|
| 24.1 Agomelatine vs paroxetine | 3 | 882 | Std. Mean Difference (IV, Random, 95% CI) | 0.16 [‐0.11, 0.43] |
| 24.2 Agomelatine vs fluoxetine | 3 | 1207 | Std. Mean Difference (IV, Random, 95% CI) | ‐0.02 [‐0.23, 0.18] |
| 24.3 Agomelatine vs sertraline | 1 | 306 | Std. Mean Difference (IV, Random, 95% CI) | ‐0.23 [‐0.46, ‐0.01] |
| 24.4 Agomelatine vs escitalopram | 1 | 129 | Std. Mean Difference (IV, Random, 95% CI) | ‐0.21 [‐0.55, 0.14] |
| 25 Sensitivity analysis: response rates ‐ best case Show forest plot | 10 | 3826 | Risk Ratio (M‐H, Random, 95% CI) | 1.05 [0.99, 1.11] |
|
| 25.1 Agomelatine vs paroxetine | 3 | 1189 | Risk Ratio (M‐H, Random, 95% CI) | 0.96 [0.83, 1.11] |
| 25.2 Agomelatine vs fluoxetine | 4 | 1862 | Risk Ratio (M‐H, Random, 95% CI) | 1.06 [0.99, 1.14] |
| 25.3 Agomelatine vs sertraline | 1 | 313 | Risk Ratio (M‐H, Random, 95% CI) | 1.15 [0.98, 1.35] |
| 25.4 Agomelatine vs escitalopram | 2 | 462 | Risk Ratio (M‐H, Random, 95% CI) | 1.08 [0.93, 1.26] |
| 26 Sensitivity analysis: response rates ‐ worst case Show forest plot | 10 | 3826 | Risk Ratio (M‐H, Random, 95% CI) | 0.98 [0.92, 1.04] |
|
| 26.1 Agomelatine vs paroxetine | 3 | 1189 | Risk Ratio (M‐H, Random, 95% CI) | 0.88 [0.73, 1.07] |
| 26.2 Agomelatine vs fluoxetine | 4 | 1862 | Risk Ratio (M‐H, Random, 95% CI) | 0.98 [0.90, 1.07] |
| 26.3 Agomelatine vs sertraline | 1 | 313 | Risk Ratio (M‐H, Random, 95% CI) | 1.08 [0.92, 1.27] |
| 26.4 Agomelatine vs escitalopram | 2 | 462 | Risk Ratio (M‐H, Random, 95% CI) | 1.03 [0.94, 1.13] |
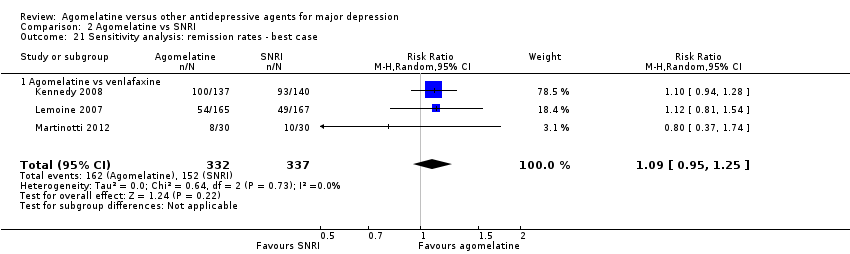
| 27 Sensitivity analysis: remission rates ‐ best case Show forest plot | 9 | 3502 | Risk Ratio (M‐H, Random, 95% CI) | 0.91 [0.72, 1.15] |
|
| 27.1 Agomelatine vs paroxetine | 3 | 1189 | Risk Ratio (M‐H, Random, 95% CI) | 0.75 [0.48, 1.17] |
| 27.2 Agomelatine vs fluoxetine | 4 | 1862 | Risk Ratio (M‐H, Random, 95% CI) | 0.89 [0.61, 1.30] |
| 27.3 Agomelatine vs sertraline | 1 | 313 | Risk Ratio (M‐H, Random, 95% CI) | 1.22 [0.87, 1.69] |
| 27.4 Agomelatine vs escitalopram | 1 | 138 | Risk Ratio (M‐H, Random, 95% CI) | 1.42 [0.74, 2.71] |
| 28 Sensitivity analysis:remission rates ‐ worst case Show forest plot | 9 | 3502 | Risk Ratio (M‐H, Random, 95% CI) | 0.73 [0.57, 0.94] |
|
| 28.1 Agomelatine vs paroxetine | 3 | 1189 | Risk Ratio (M‐H, Random, 95% CI) | 0.57 [0.29, 1.12] |
| 28.2 Agomelatine vs fluoxetine | 4 | 1862 | Risk Ratio (M‐H, Random, 95% CI) | 0.74 [0.52, 1.05] |
| 28.3 Agomelatine vs sertraline | 1 | 313 | Risk Ratio (M‐H, Random, 95% CI) | 1.08 [0.77, 1.50] |
| 28.4 Agomelatine vs escitalopram | 1 | 138 | Risk Ratio (M‐H, Random, 95% CI) | 0.79 [0.43, 1.43] |
| 29 Sensitivity anal': excluding studies with bipolar participants ‐ response rates Show forest plot | 2 | 617 | Risk Ratio (M‐H, Random, 95% CI) | 0.84 [0.70, 1.03] |
|
| 29.1 Agomelatine vs paroxetine | 2 | 617 | Risk Ratio (M‐H, Random, 95% CI) | 0.84 [0.70, 1.03] |
| 30 Additional subgroup analysis: unpublished vs published trials ‐ response rates Show forest plot | 10 | 3826 | Risk Ratio (M‐H, Random, 95% CI) | 1.01 [0.95, 1.08] |
|
| 30.1 Unpublished | 4 | 1336 | Risk Ratio (M‐H, Random, 95% CI) | 0.90 [0.81, 1.00] |
| 30.2 Published | 6 | 2490 | Risk Ratio (M‐H, Random, 95% CI) | 1.05 [1.00, 1.11] |