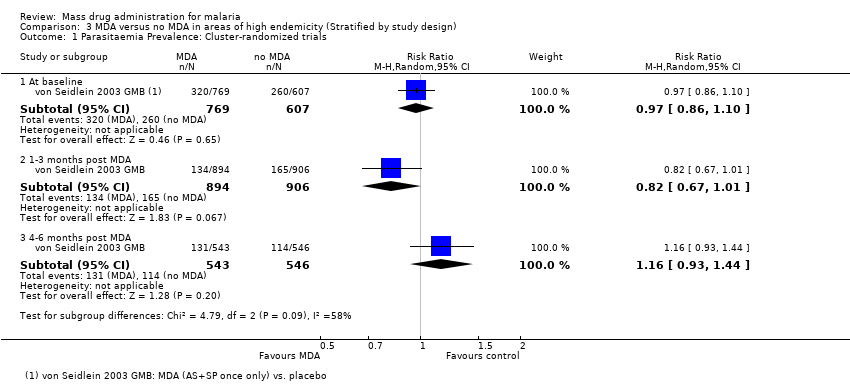
| 1 Parasitaemia Prevalence: Cluster‐randomized trials Show forest plot | 1 | | Risk Ratio (M‐H, Random, 95% CI) | Subtotals only |
|
| 1.1 At baseline | 1 | 1376 | Risk Ratio (M‐H, Random, 95% CI) | 0.97 [0.86, 1.10] |
| 1.2 1‐3 months post MDA | 1 | 1800 | Risk Ratio (M‐H, Random, 95% CI) | 0.82 [0.67, 1.01] |
| 1.3 4‐6 months post MDA | 1 | 1089 | Risk Ratio (M‐H, Random, 95% CI) | 1.16 [0.93, 1.44] |
| 2 Parasitaemia Prevalence: Non‐randomized controlled studies Show forest plot | 3 | | Risk Ratio (M‐H, Random, 95% CI) | Subtotals only |
|
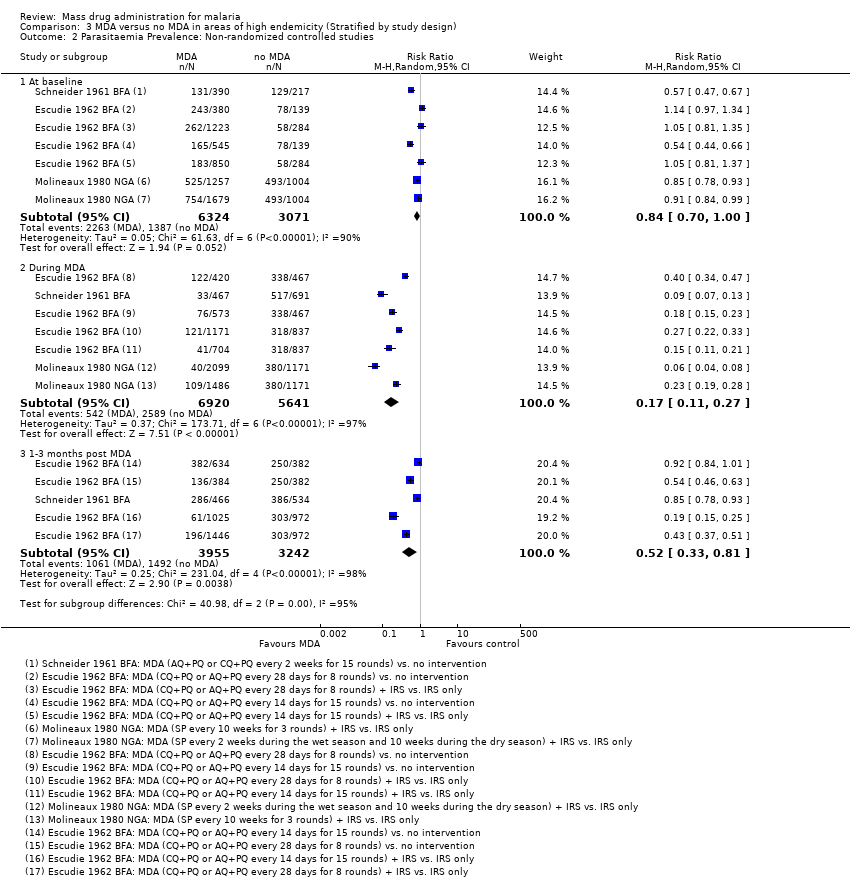
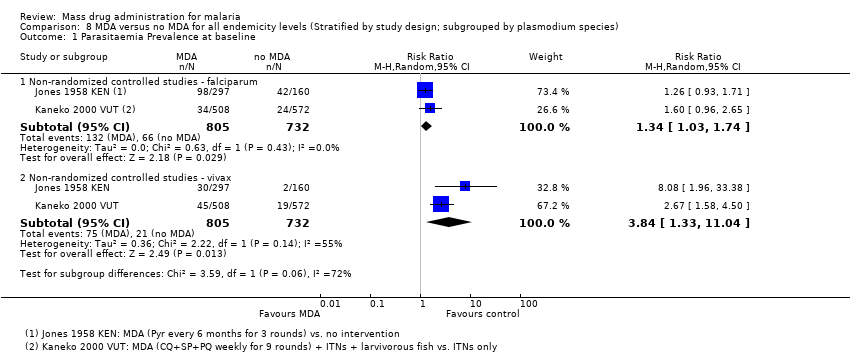
| 2.1 At baseline | 3 | 9395 | Risk Ratio (M‐H, Random, 95% CI) | 0.84 [0.70, 1.00] |
| 2.2 During MDA | 3 | 12561 | Risk Ratio (M‐H, Random, 95% CI) | 0.17 [0.11, 0.27] |
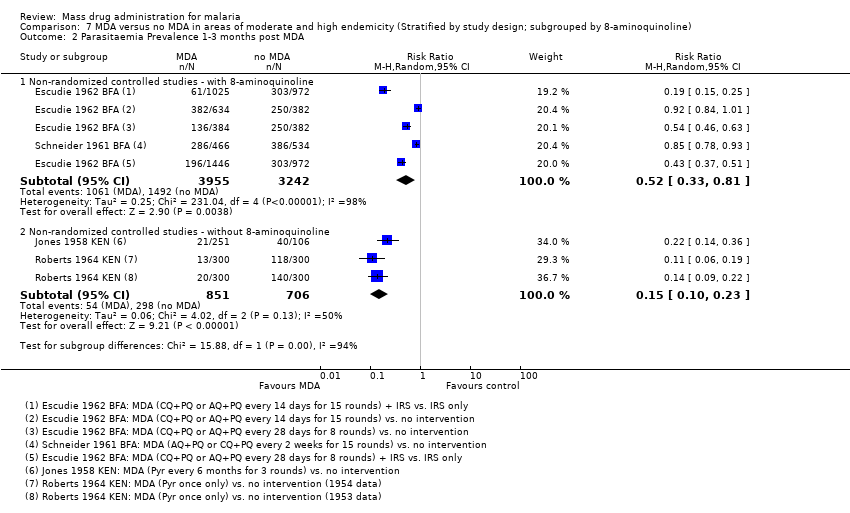
| 2.3 1‐3 months post MDA | 2 | 7197 | Risk Ratio (M‐H, Random, 95% CI) | 0.52 [0.33, 0.81] |
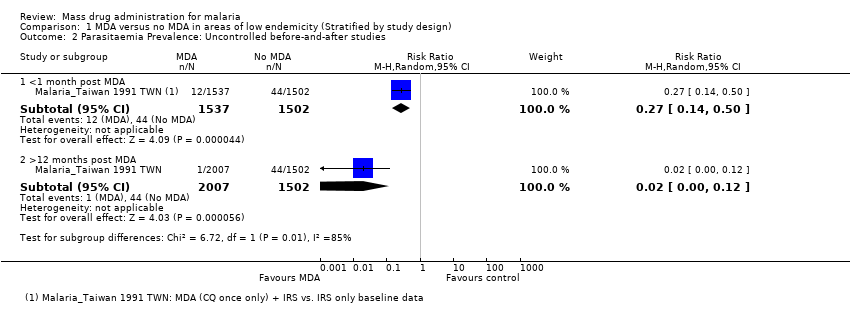
| 3 Parasitaemia Prevalence: Uncontrolled before‐and‐after studies Show forest plot | 7 | | Risk Ratio (M‐H, Random, 95% CI) | Subtotals only |
|
| 3.1 During MDA | 2 | 2011 | Risk Ratio (M‐H, Random, 95% CI) | 0.10 [0.03, 0.34] |
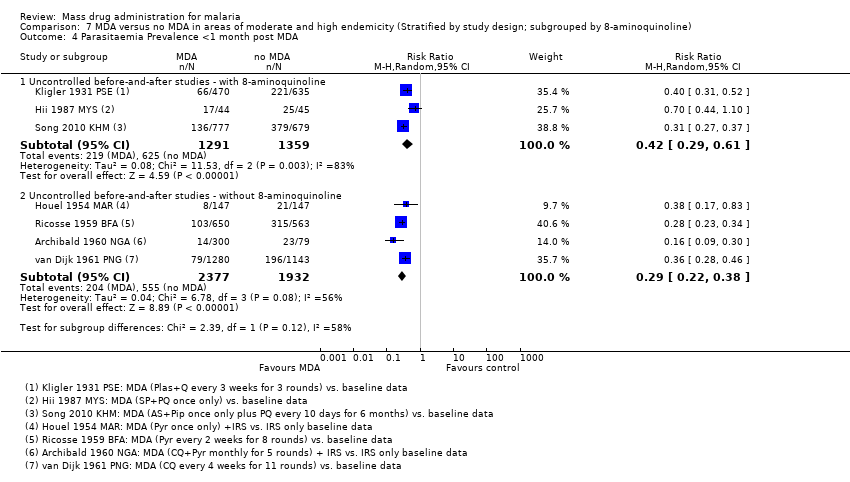
| 3.2 <1 month post MDA | 4 | 3863 | Risk Ratio (M‐H, Random, 95% CI) | 0.37 [0.28, 0.49] |
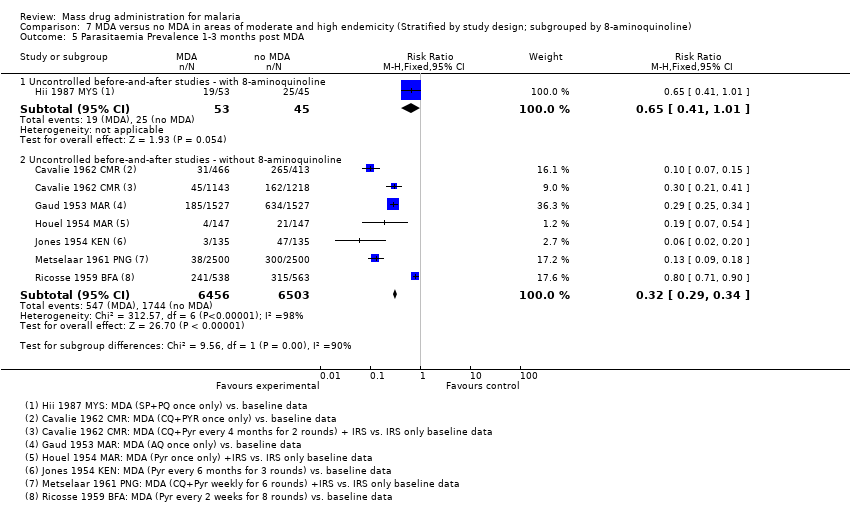
| 3.3 1‐3 months post MDA | 4 | 5132 | Risk Ratio (M‐H, Random, 95% CI) | 0.35 [0.15, 0.84] |
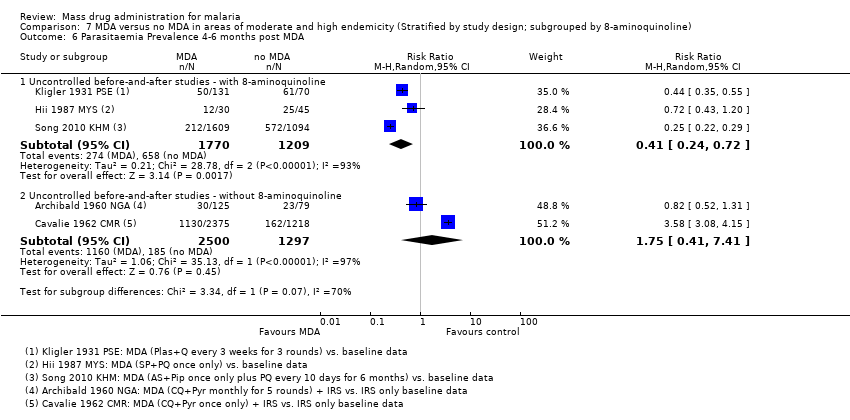
| 3.4 4‐6 months post MDA | 3 | 2979 | Risk Ratio (M‐H, Random, 95% CI) | 0.41 [0.24, 0.72] |
| 3.5 7‐12 months post MDA | 1 | 75 | Risk Ratio (M‐H, Random, 95% CI) | 0.72 [0.43, 1.20] |
| 3.6 >12 months post MDA | 1 | 2375 | Risk Ratio (M‐H, Random, 95% CI) | 0.10 [0.07, 0.12] |
| 4 Parasitaemia Incidence: Cluster‐randomized trials Show forest plot | 1 | | Rate Ratio (Random, 95% CI) | 0.84 [0.53, 1.32] |
|
| 4.1 < 1 month post MDA | 1 | | Rate Ratio (Random, 95% CI) | 0.41 [0.23, 0.74] |
| 4.2 1‐3 months post MDA | 1 | | Rate Ratio (Random, 95% CI) | 1.03 [0.75, 1.41] |
| 4.3 4‐6 months post MDA | 1 | | Rate Ratio (Random, 95% CI) | 1.11 [0.84, 1.45] |
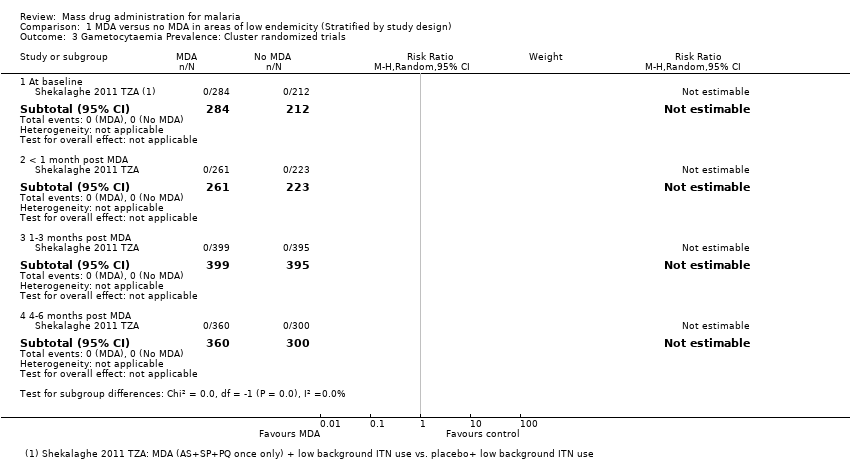
| 5 Gametocytaemia Prevalence: Cluster‐randomized trials Show forest plot | 1 | | Risk Ratio (M‐H, Random, 95% CI) | Subtotals only |
|
| 5.1 At baseline | 1 | 1376 | Risk Ratio (M‐H, Random, 95% CI) | 0.66 [0.33, 1.29] |
| 5.2 4‐6 months post MDA | 1 | 1414 | Risk Ratio (M‐H, Random, 95% CI) | 1.07 [0.62, 1.85] |
| 6 Gametocytaemia Prevalence: Non‐randomized controlled studies Show forest plot | 3 | | Risk Ratio (M‐H, Random, 95% CI) | Subtotals only |
|
| 6.1 At baseline | 3 | 9395 | Risk Ratio (M‐H, Random, 95% CI) | 0.72 [0.55, 0.95] |
| 6.2 During MDA | 3 | 12561 | Risk Ratio (M‐H, Random, 95% CI) | 0.17 [0.10, 0.28] |
| 6.3 1‐3 months post MDA | 2 | 7197 | Risk Ratio (M‐H, Random, 95% CI) | 0.55 [0.28, 1.07] |
| 7 Gametocytaemia Prevalence: Uncontrolled before‐and‐after studies Show forest plot | 5 | | Risk Ratio (M‐H, Random, 95% CI) | Subtotals only |
|
| 7.1 During MDA | 2 | 2011 | Risk Ratio (M‐H, Random, 95% CI) | 0.35 [0.09, 1.40] |
| 7.2 <1 month post MDA | 3 | 2582 | Risk Ratio (M‐H, Random, 95% CI) | 0.38 [0.13, 1.08] |
| 7.3 1‐3 months post MDA | 2 | 1199 | Risk Ratio (M‐H, Random, 95% CI) | 1.14 [0.64, 2.01] |
| 7.4 4‐6 months post MDA | 2 | 2789 | Risk Ratio (M‐H, Random, 95% CI) | 0.35 [0.10, 1.28] |
| 7.5 7‐12 months post MDA | 1 | 75 | Risk Ratio (M‐H, Random, 95% CI) | 0.86 [0.41, 1.79] |
| 7.6 >12 months post MDA | 1 | 2269 | Risk Ratio (M‐H, Random, 95% CI) | 0.09 [0.05, 0.15] |
| 8 Anaemia Prevalence: Cluster‐randomized trials Show forest plot | 1 | | Risk Ratio (M‐H, Random, 95% CI) | Subtotals only |
|
| 8.1 4‐6 months post MDA | 1 | 1414 | Risk Ratio (M‐H, Random, 95% CI) | 0.84 [0.75, 0.93] |
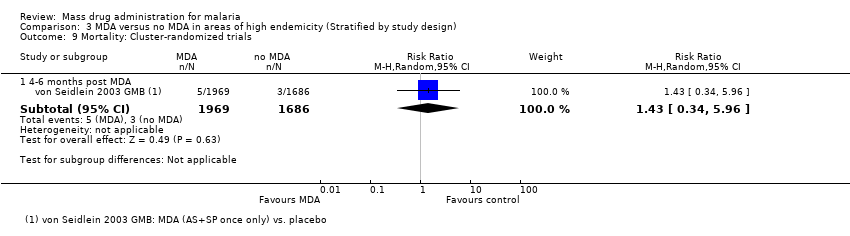
| 9 Mortality: Cluster‐randomized trials Show forest plot | 1 | | Risk Ratio (M‐H, Random, 95% CI) | Subtotals only |
|
| 9.1 4‐6 months post MDA | 1 | 3655 | Risk Ratio (M‐H, Random, 95% CI) | 1.43 [0.34, 5.96] |